the Creative Commons Attribution 4.0 License.
the Creative Commons Attribution 4.0 License.
 | 20 Jan 2023
Miniaturized differential scanning calorimeter with an integrated mass sensing system: first steps
Johanna Distler
Thomas Wöhrl
Robin Werner
Michael Gerlach
Michael Gollner
Florian Linseis
Jaroslaw Kita
Ralf Moos
In this paper, the first steps towards integrating a mass sensing system into an existing miniaturized ceramic DSC (differential scanning calorimetry) chip are presented. A vibration setup is developed based on the mass-dependent change in frequency of the DSC chip as an oscillating cantilever. A simulation model reveals that the resolution of the measurement can be improved by reducing the chip thickness. In this study, different measurement methods (acoustic, optical, and piezoresistive) are investigated. Three complete measurement systems are set up and evaluated with regard to their integration in the DSC chip. All presented measurement methods show promising results and already allow mass measurements with a resolution of 100 µg.
- Article
(8506 KB) - Full-text XML
- BibTeX
- EndNote


Differential scanning calorimetry (DSC) is a widespread analytical technique for determining thermal material properties, such as transition temperatures, enthalpies, or specific heat capacities. In conventional DSC instruments, the sample is placed in a furnace. During a temperature-controlled program, the heat flow of the sample and the reference are continuously measured. Specifically, the large and expensive furnace of conventional DSC devices leads to certain disadvantages. Due to the high heat capacity of the furnace, heating and cooling rates are limited. Furthermore, high operating and maintenance costs are incurred, and aggressive materials or reaction products may contaminate or damage the furnace. These disadvantages led to the development of a miniaturized DSC chip with an integrated heater (Missal et al., 2011; Kita et al., 2013; Brandenburg et al., 2016). The sensor is fully manufactured using low temperature co-fired ceramics (LTCC) technology and exhibits high heating and cooling rates due to its low thermal mass.
However, knowledge of the sample mass is required to determine enthalpies and specific heat capacities. This motivated the idea of integrating a weighing device into the DSC chip to measure the initial sample mass as well as small mass changes during thermal analysis, which adds thermogravimetry (TG) functionality to the system. The combination of DSC and TG is described as simultaneous thermal analysis (STA) and enables the correlation between gravimetric and caloric effects. Simultaneous measurement provides the advantage that only one measurement can be performed on the same sample under identical environmental conditions (Höhne et al., 2003). This novel and extremely miniaturized STA system offers all of the advantages of the DSC chip, in particular the suitability for mobile applications. In comparison, commercial STA devices are highly complex and comparatively expensive.
In this study, we investigate three different measurement techniques for noncontact mass determination for the purpose of implementation into the DSC chip. These methods are based on acoustics, optics, and the piezoresistive effect. The feasibility of the techniques is initially evaluated at room temperature without considering DSC functionality. Further factors, such as the influence of temperature or purge gas during thermal analysis, are temporary disregarded. However, when selecting the methods, it was assumed that they are suitable for an operation at elevated temperatures.
The working principle of the ceramic DSC chip is based on the heat flux differential scanning calorimetry principle. Whereas in a conventional heat flux DSC (Fig. 1) the sample and the reference crucibles are located in a furnace, the DSC chip comprises all functional elements in one multilayer structure. The three-dimensional design is realized using LTCC technology (see, e.g., Jurków et al., 2015; Kita et al., 2008). The sensor head represents the measuring cell and is mechanically and electrically connected to the contacting and clamping area via two beams. The setup is shown in Fig. 2. The embedded screen-printed heater heats the sensor head according to a predetermined temperature profile. The temperatures of the sample and the integrated reference are continuously measured by two screen-printed temperature sensors. By means of a device-specific calibration factor, the heat flux is determined from the temperature difference ΔT as a function of temperature. A cavity on the top of the sensor head serves as crucible support.
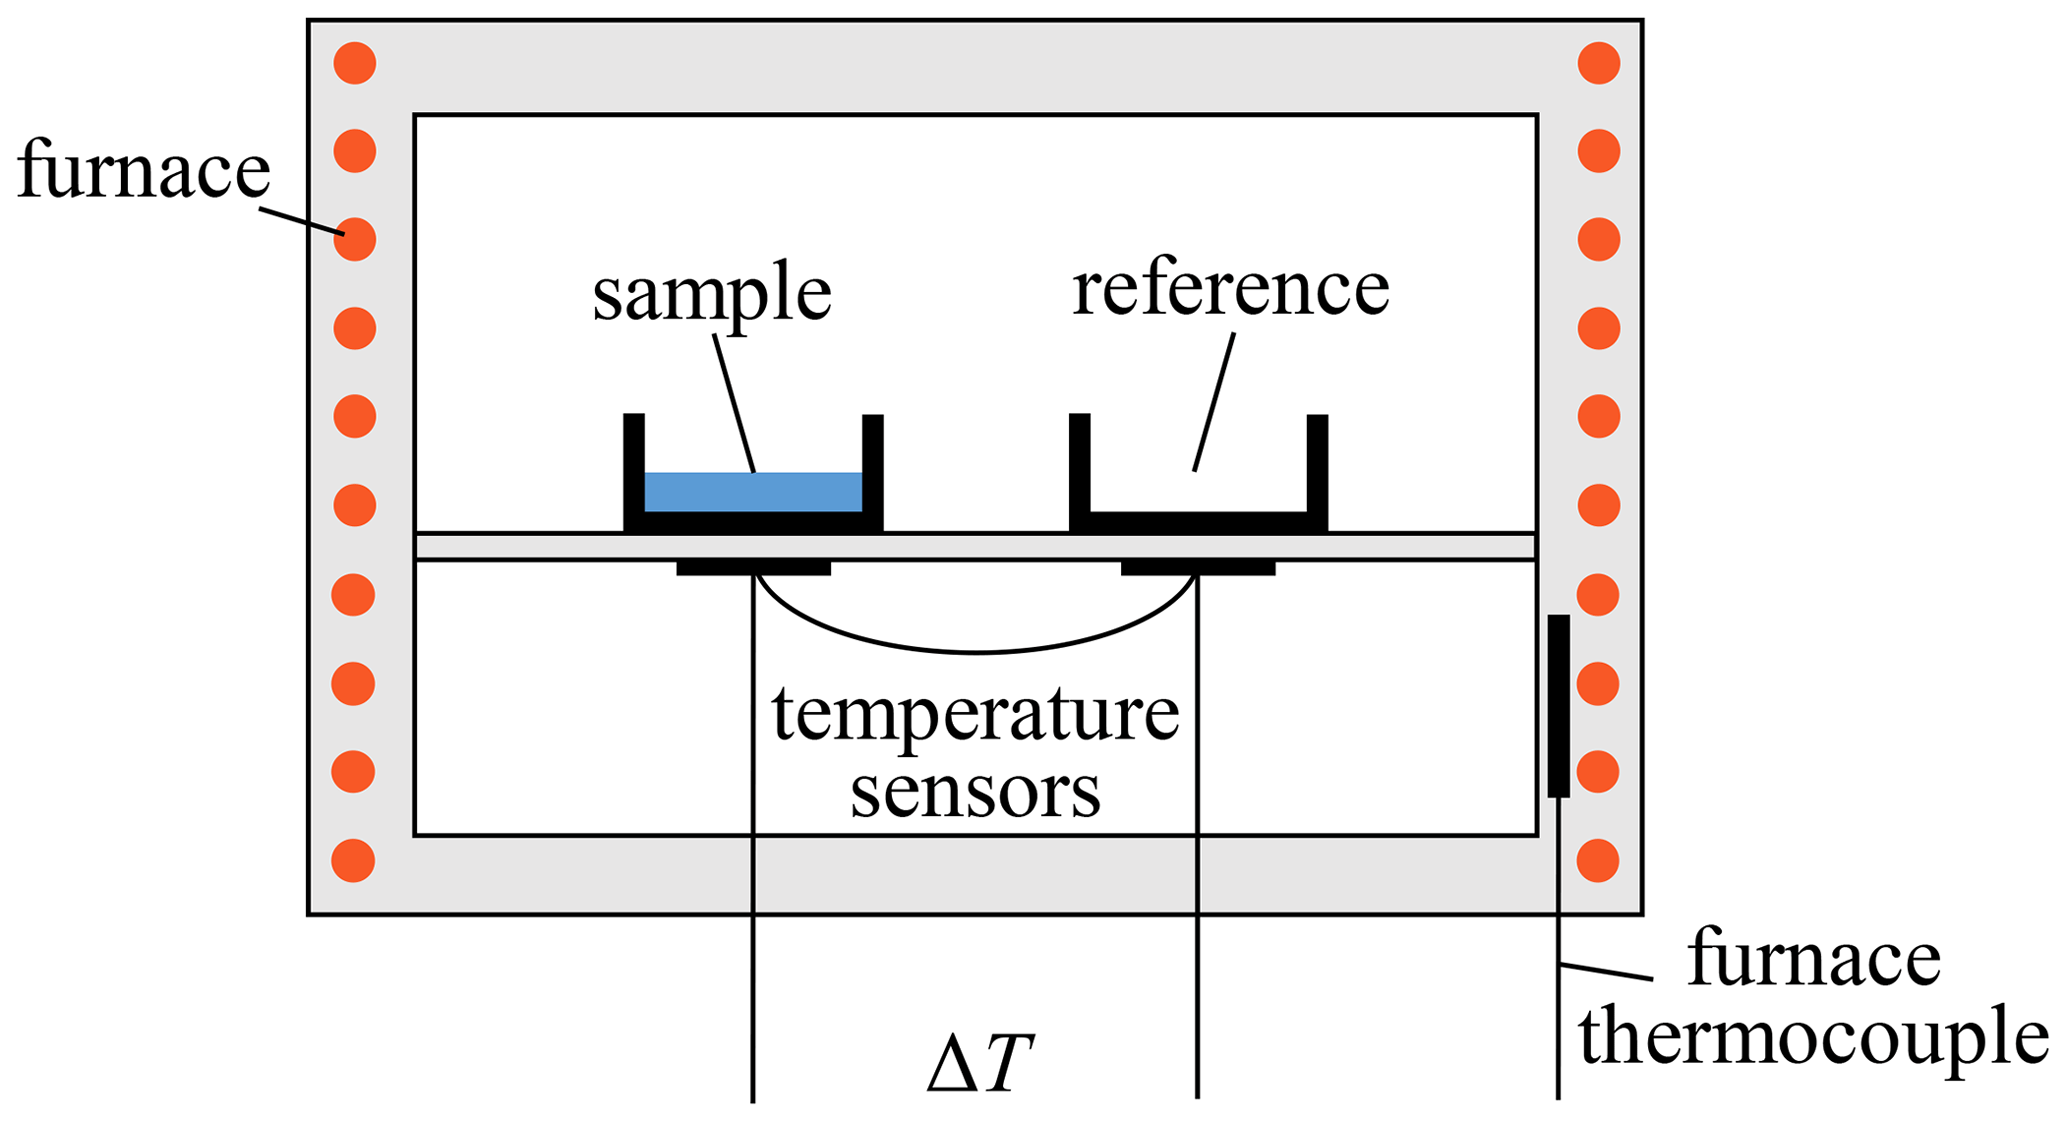

Figure 2Ceramic differential scanning calorimeter chip (a) and cross section of the sensor head with functional elements (b). The heater, temperature sensors, sample, and reference form a symmetrical design.
The compact design of the DSC chip results in low production costs and offers further advantages. The low thermal mass of the sensor head and the low thermal resistance between the heater and the sample allow excellent temperature control and high heating and cooling rates of up to 500 K min−1. Contaminated or defective sensors can be replaced quickly and easily. In addition, the low power consumption and small device size enable mobile applications. The temperature range is up to 600 ∘C. The sensitivity and thermal resolution are comparable to conventional DSC devices. Proof of functionality and various measurements can be found in Missal et al. (2011, 2012) and Brandenburg et al. (2016).
The first experiments were based on measuring the static deflection of the DSC chip when different masses were applied. With a simple setup, mass loadings below 10 mg were successfully determined using screen-printed strain gauges on the beams of the sensor (Brandenburg et al., 2016). However, the change in static deflection turned out be too small to achieve sufficient mass sensitivity. As a result, this study reports on a vibration setup that was developed based on the mass-dependent frequency change. In this case, the DSC chip is excited to oscillate. The natural or resonant frequency of the DSC chip is then dependent on mass loading. Consequently, by determining the oscillation frequency, the change in mass can be inferred.
The principle of mass determination by measuring the change in the resonant frequency has been known for a long time and is used in many applications in the field of microgravimetry. Quartz-crystal microbalances (QCM) change their resonance properties as mass is deposited on the surface of the crystal. The relationship between mass loading of a quartz crystal and a resulting resonant frequency shift was described as early as 1959 (Sauerbrey, 1959); since then, the technique has become increasingly important in research and development (Li et al., 2019; Kadirsoy et al., 2020; Liu et al., 2021). Moreover, resonant cantilevers in the micro- and nanogravimetric range are used for applications in bio/chemical sensing – for example, in combination with optical or piezoresistive detection methods (Ziegler, 2004; Johnson et al., 2012; Li and Lee, 2012; Basu et al., 2020; Jia et al., 2021).
The DSC chip can be modeled as a cantilever beam clamped on one side with a mass load on its free end, which is stimulated to vibrate. For small oscillation amplitudes, as in the case of the DSC chip, the cantilever is considered to be a damped harmonic oscillator with equivalent mass meq and equivalent spring stiffness keq.
The natural angular frequency ω0 of the given system is calculated according to Eq. (1), where E describes Young's modulus, is the second moment of area of the rectangular cross section, t is the thickness of the DSC chip, and b and l are the respective width and length of the cantilever (combination of the two beams) (Jäger et al., 2013; Gross et al., 2014).
The equivalent mass meq is composed of the cantilever mass (mcantilever), the mass of the sensor head (mhead), the crucible mass (mcr), and the to-be-determined sample mass (m). For small mass changes, the natural frequency approximately shows a linear dependence on the sample mass. The sensitivity is calculated under this assumption according to Eq. (2).
The maximum deflection of the DSC chip is decisive for the measurement of the frequency and further determines the maximum strain occurring in the beams. However, the maximum deflection is limited. At high oscillation frequencies, large accelerations occur, which can lead to lifting of the sample mass or crucible. If the acceleration acting on the sample exceeds the acceleration due to gravity, the sample lifts off the sensor head and starts to move. The maximum amplitude A can be calculated from the vibration equation according to Eq. (3), whereby the maximum possible acceleration is given by the gravitational acceleration amax=9.81 m s−2 (Papula, 2012).
Under the assumption that the mass of the sensor head with crucible outweighs the sample mass, the maximum amplitude A behaves approximately as with respect to the chip thickness t. The analytical estimations suggest that the resolution of measurement systems that determine the frequency indirectly via the deflection of the DSC chip or the strain of the beams can be increased by reducing the chip thickness t. This can simply be achieved by reducing the number of layers of the chip.
To validate the analytical model, simulations of chips with different numbers of layers (seven layers and three layers) were carried out in eigenfrequency studies using the COMSOL® finite element analysis software. The adopted boundary conditions are shown in Fig. 3. The density ρ = 3.1 g cm−3, Young's modulus E=120 GPa, and Poisson's ratio μ=0.24 were taken from the manufacturer's data sheet (DuPont, 2009). The crucible mass was applied isotropically to the surface of the crucible support, while the sample mass was attached in the center of the sensor head. It should also be noted that the damping properties of the sensor were not considered in the simulation, as the nonideal clamping of the sensor strongly influences the damping. However, as the damping coefficient is assumed to be small, the effect on the resonant frequency or sensitivity is not estimated to be decisive.
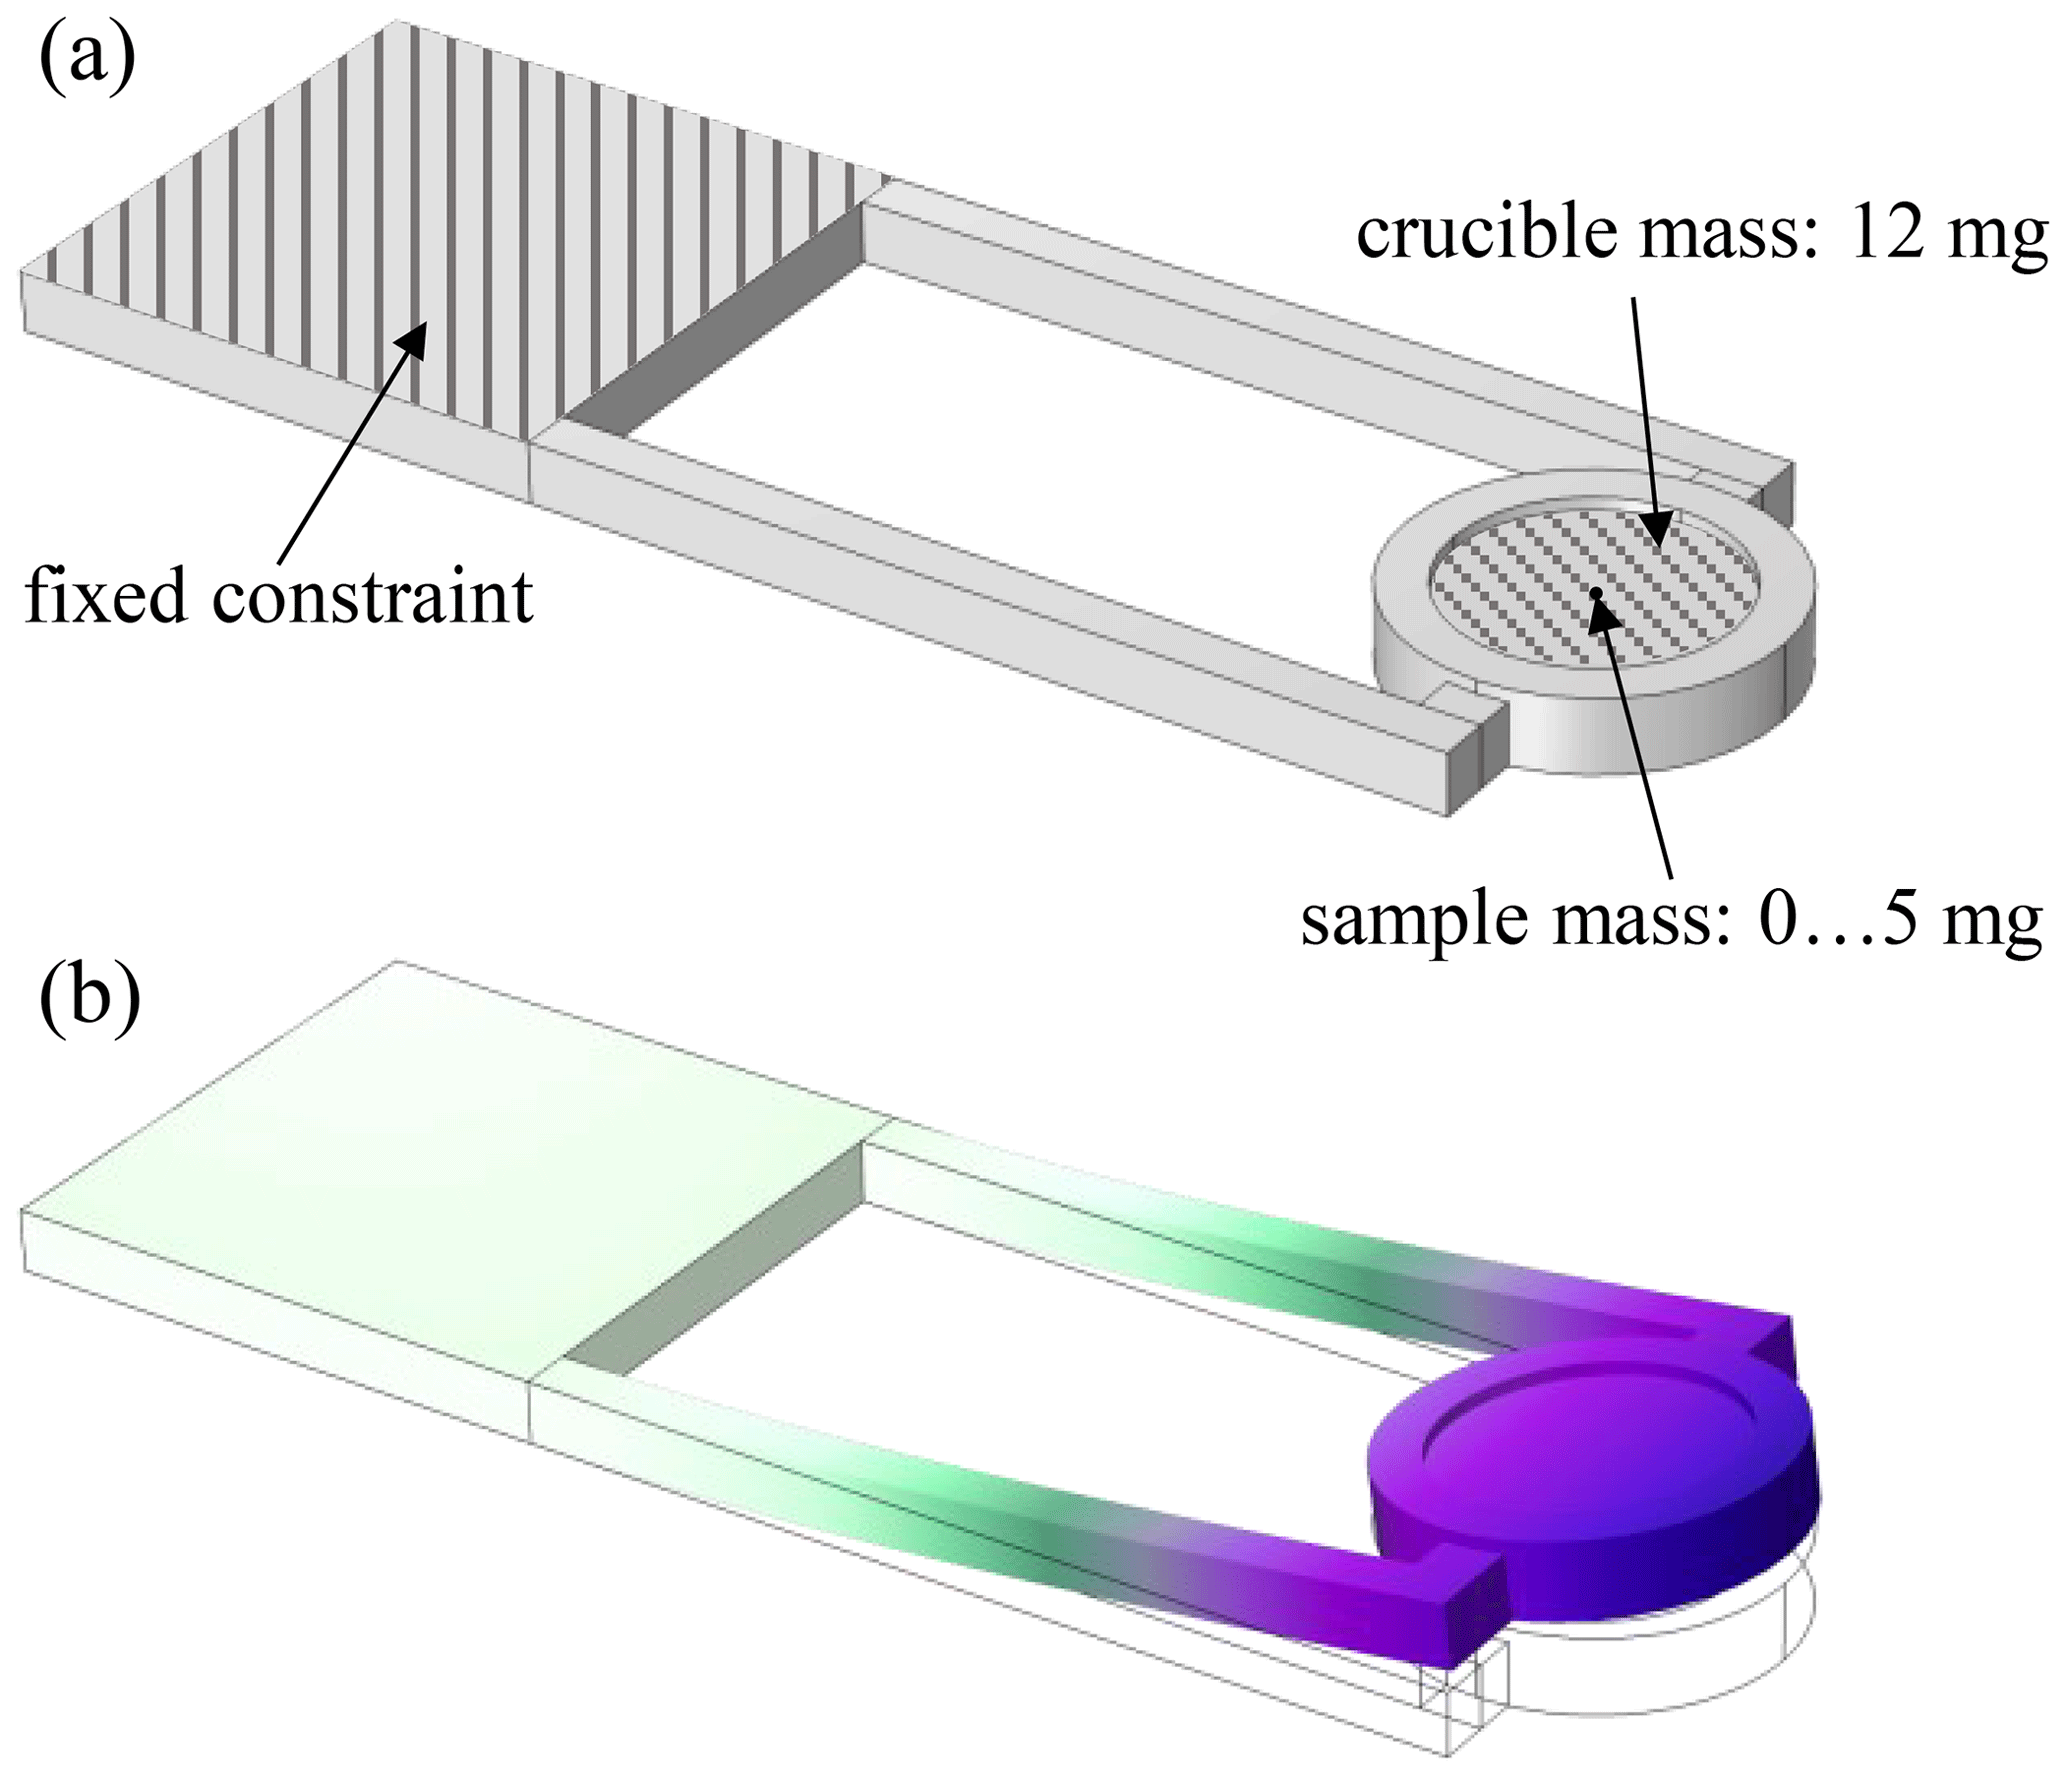
Figure 3Boundary conditions for finite element modeling of the DSC chip (a) and eigenfrequency study (b).
The simulated and calculated (via Eqs. 1–3) results of the natural frequency, the sensitivity, and the maximum amplitude are listed in Table 1. The natural frequencies and the maximum amplitudes were determined without mass loading by crucible or sample mass. When a sample is placed on the sensor head, the natural frequency decreases and, thus, the acceleration that acts on the sample also decreases. Therefore, the bare DSC chip represents the limiting case with respect to the maximum amplitude.
Table 1Analytically calculated and simulated properties of the three-layer and seven-layer sensor chip.
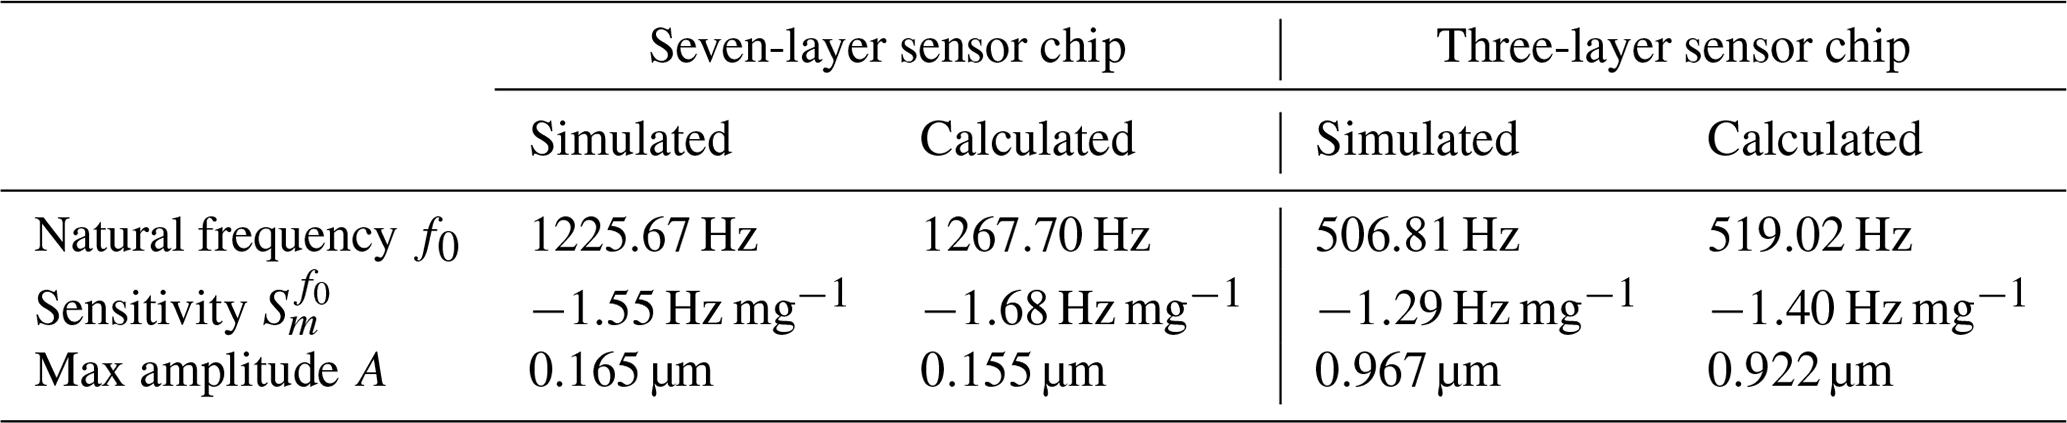
By reducing the number of layers from seven to three, the maximum amplitude can be increased by a factor of more than 5. At the same time, the natural frequency decreases by more than half. The analytically estimated dependence of approximately can be confirmed by the simulation. Concurrently, however, the sensitivity decreases slightly when the number of layers is reduced. The only small deviations in the simulation results compared to the analytically calculated values validate the model. The measurement data discussed in Sect. 4 further demonstrate that the simulation results are plausible, as the measured frequency ranges correspond to the simulated values.
According to the simulation results, the number of layers for both optical and piezoresistive frequency measurement was reduced from seven to three in this study. The two different chip geometries are depicted in Fig. 4. The mass of the sensor head is approximately 340 mg for the seven-layer chip and approximately 140 mg for the three-layer chip, while sample masses of up to 5 mg were measured in this study.
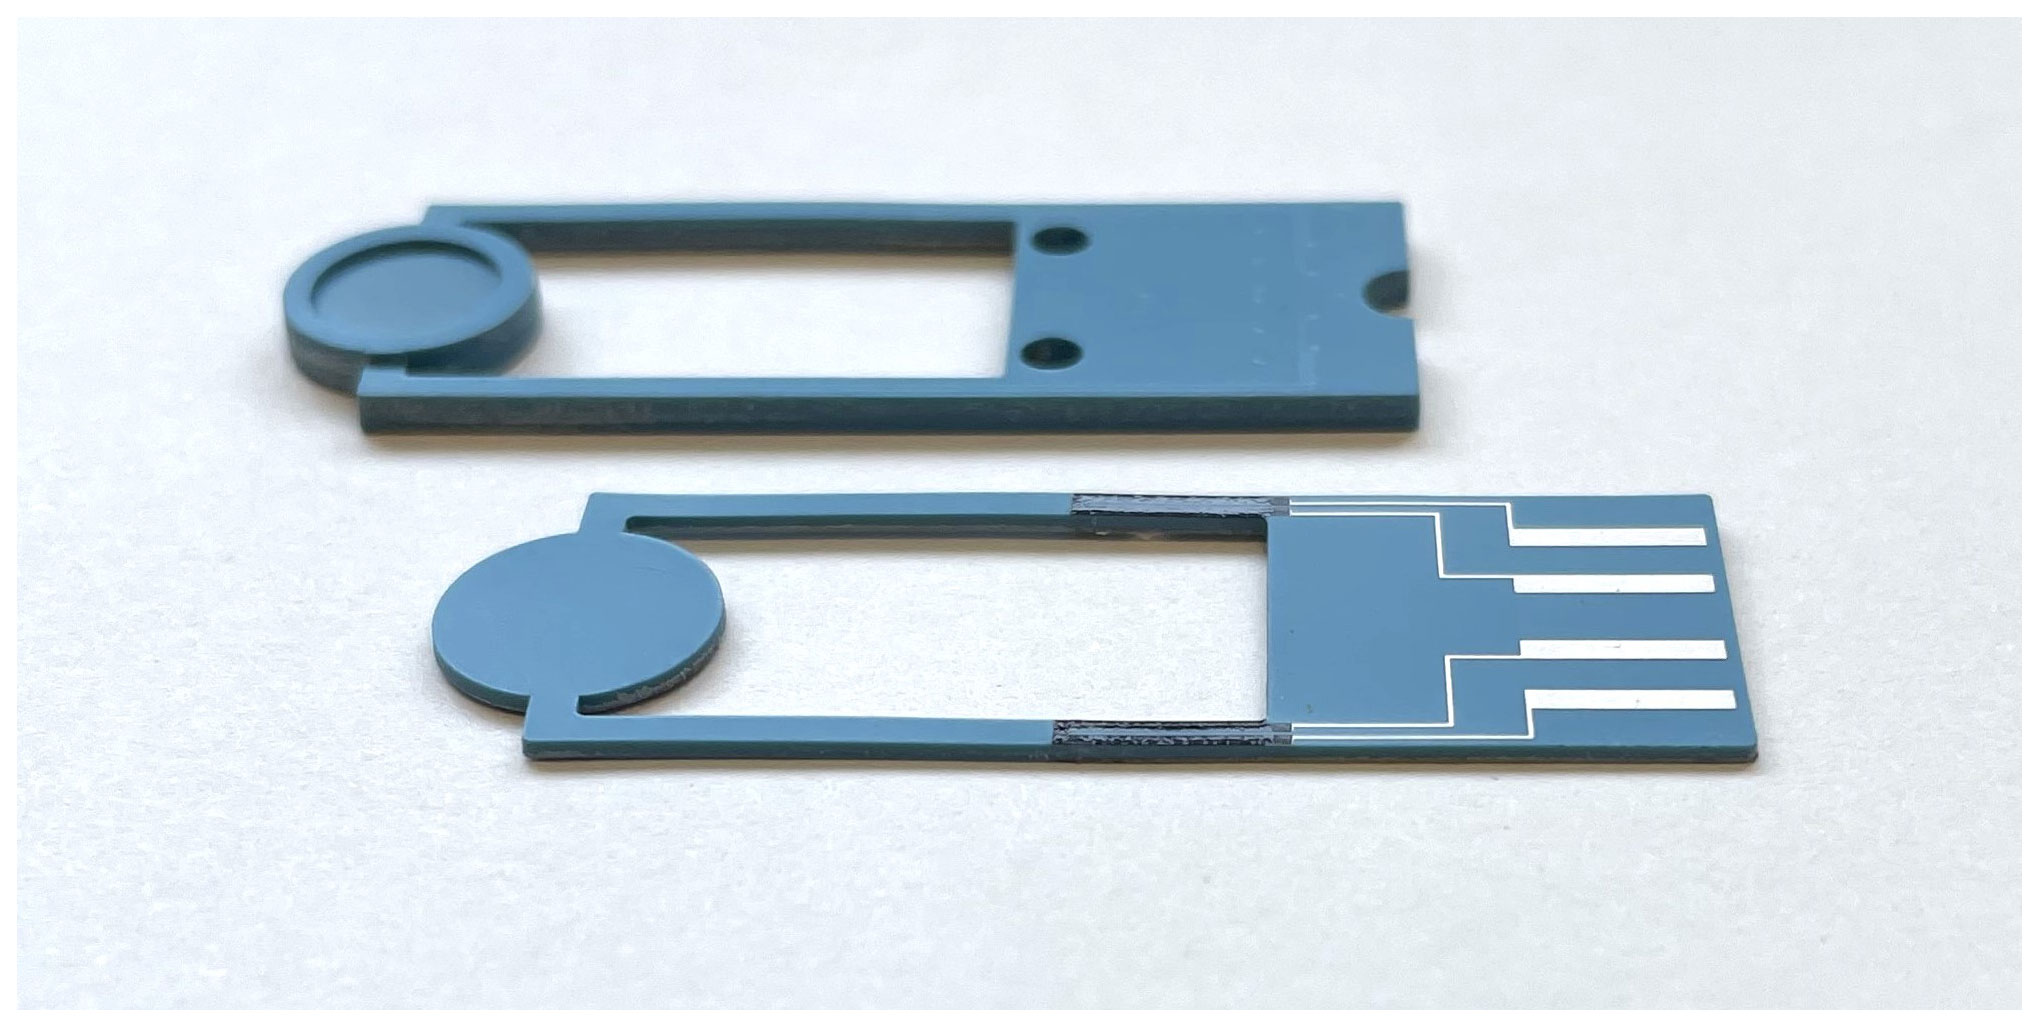
Figure 4Comparison of sensor chip geometries (width × height: 13×40 mm): seven-layer chip (thickness t=1.45 mm) in the background and three-layer chip (thickness t=0.6 mm) with screen-printed strain gauges and leads in the foreground.
The oscillation excitation of the DSC chip can be realized via transient or periodic methods. In the case of a transient excitation, the sensor chip is deflected by a single force impact and shows a damped oscillation with decreasing amplitude. The system oscillates with the natural angular frequency of the damped oscillation ωd, which is reduced by the damping factor δ compared with the undamped natural frequency according to the following (Jäger, 2013):
Therefore, the amplitude decreases with time by the factor e−δt (Jäger, 2013). However, the determination of the frequency from the time signal is too inaccurate, as a small error in the time in this frequency range leads to great mass deviations. The evaluation must therefore be conducted over the frequency range. As a result of the Fourier transform, a continuous frequency spectrum is obtained for transient excitation that shows a maximum at the sought frequency.
In the case of periodic excitation, a continuous sinusoidal force is applied. A forced oscillation occurs, and the system oscillates at the excitation frequency after the transient response has subsided. The oscillation amplitude reaches a maximum for a certain frequency, the resonant frequency. According to Eq. (5), the resonant angular frequency ωr is lower than the (damped) natural angular frequency (Jäger, 2013):
To determine the resonant frequency, the amplitude of the system response must therefore be evaluated, and a frequency sweep is required. If the position of the resonant frequency is already approximately known, the frequency sweep can be delimited to a small range around it.
Due to the influence of a mechanical contact on the natural frequency, damping, and sensitivity of the sensor chip, a contactless design of the weighing device is envisaged. In this study, however, a contact-based excitation method was partially still used, which is to be replaced later. Nevertheless, all of the measuring methods investigated here are of a noncontact nature. The periodic excitation was conducted via a piezoelectric linear actuator, which was mechanically clamped to the DSC chip and controlled via a frequency generator. Both the acoustic and the optical measurement methods used the piezoelectric linear actuator and periodic excitation, whereas the piezoresistive measurement used transient and noncontact excitation with the help of a servomotor.
4.1 Acoustic measurement of the resonant frequency
Vibrations that propagate in solid bodies are referred to as structure-borne sound. Due to the movement of the body surface, the vibration is transmitted to the air and is audible to humans in a certain frequency range (Möser, 2015). Airborne sound waves can be measured with conventional microphones. This approach was adopted here for the DSC chip. Condenser microphones are characterized by a thin, conductive membrane forming a capacitor along with an insulated counter electrode. The membrane is deflected by the sound pressure, and the variation in the distance between the electrodes causes a measurable change in the capacitance (Bernstein, 2019).
The setup for the acoustic measurement is shown in Fig. 5. The sensor holder was manufactured using 3D printing due to the wide range of adaptation options for the different measurement methods and sensor chip geometries. To measure the oscillation frequency of the DSC chip, the CMC-9745 electret condenser microphone with a directional characteristic from CUI Devices was used and placed directly under the sensor head. Unlike conventional condenser microphones, electret condenser microphones can be operated without an auxiliary voltage source, but they still require an amplifier (Bernstein, 2019). In addition to the use of a directional microphone, a measurement box lined with sound-absorbing materials and a multi-feedback bandpass filter were used to shield against disturbing ambient noise. The entire circuit configuration of the measurement setup with the frequency filter and subsequent amplification is shown in Fig. 6.

Figure 5Setup of the acoustic measurement with the seven-layer sensor chip.
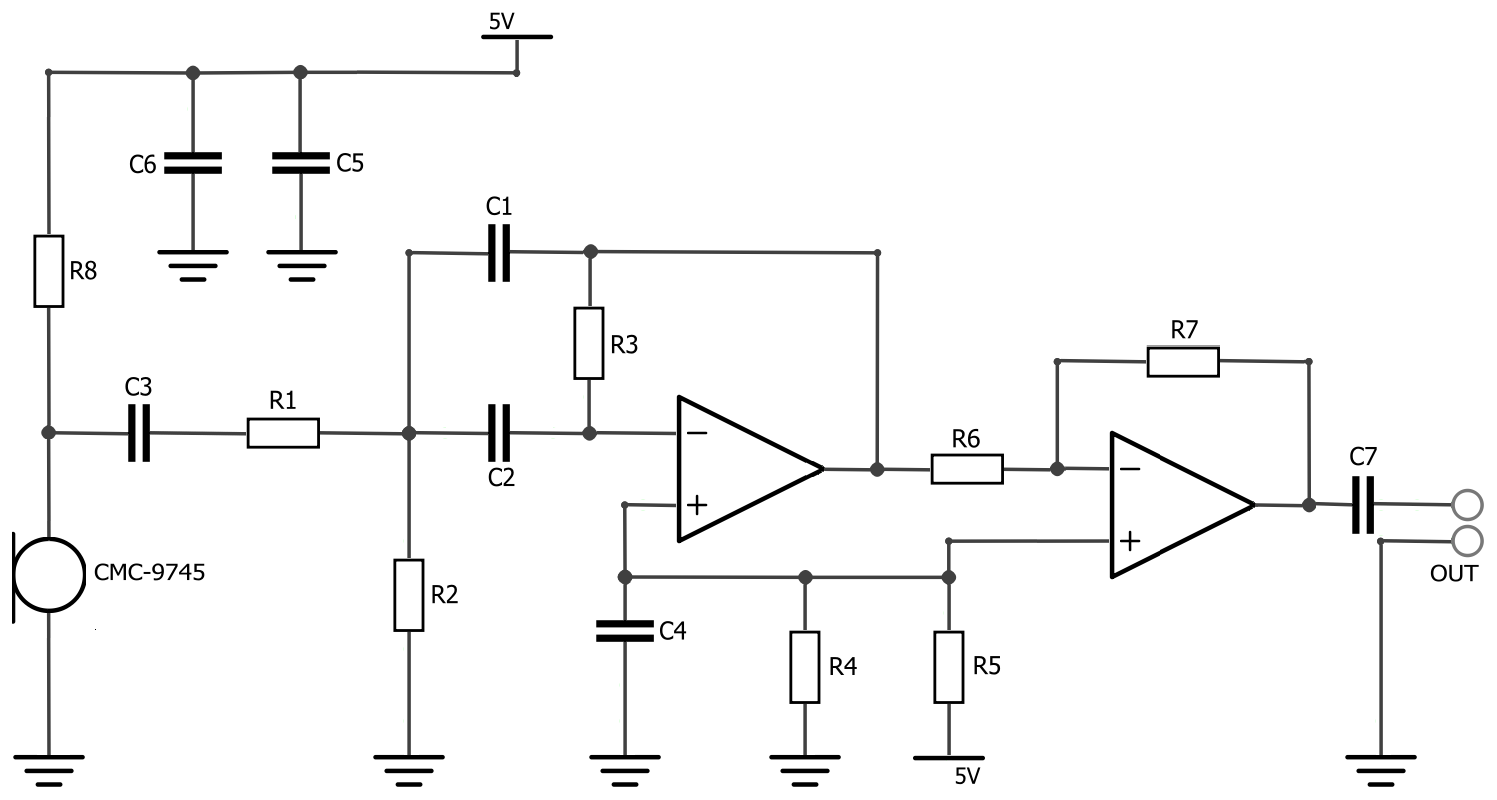
Figure 6Circuit configuration for acoustic measurement: multi-feedback bandpass filter and amplification.
The seven-layer sensor chip was used for the measurement, as it has a higher mass sensitivity according to Table 1 and the maximization of the amplitude is irrelevant in the context of this measurement method. The vibration excitation is conducted periodically by means of the piezoelectric linear actuator.
The sample mass was stepwise increased by adding small masses of approximately 1 mg each. Each sample mass was subjected to a frequency sweep by varying the excitation frequency using a frequency generator. The output voltage after filtering and amplification was measured, and the resonant frequency was obtained by evaluating the maximum amplitude. The measured resonant frequency as a function of the sample mass is shown in Fig. 7. The DSC chip with crucible (12.5 mg) initially exhibited a resonant frequency of 1077.5 Hz, which decreased with increasing sample mass. A linear relationship between mass loading and resonant frequency was observed, and the sample mass changes of 1 mg could be clearly detected. The sensitivity of the measurement was determined, from the slope of the regression line, to be −1.93 Hz mg−1. (An error estimation concerning the linear regression is comparatively done for all measurements in Sect. 5.) In this way, the first noncontact mass measurements were successfully carried out with a simple setup and a low-cost microphone.
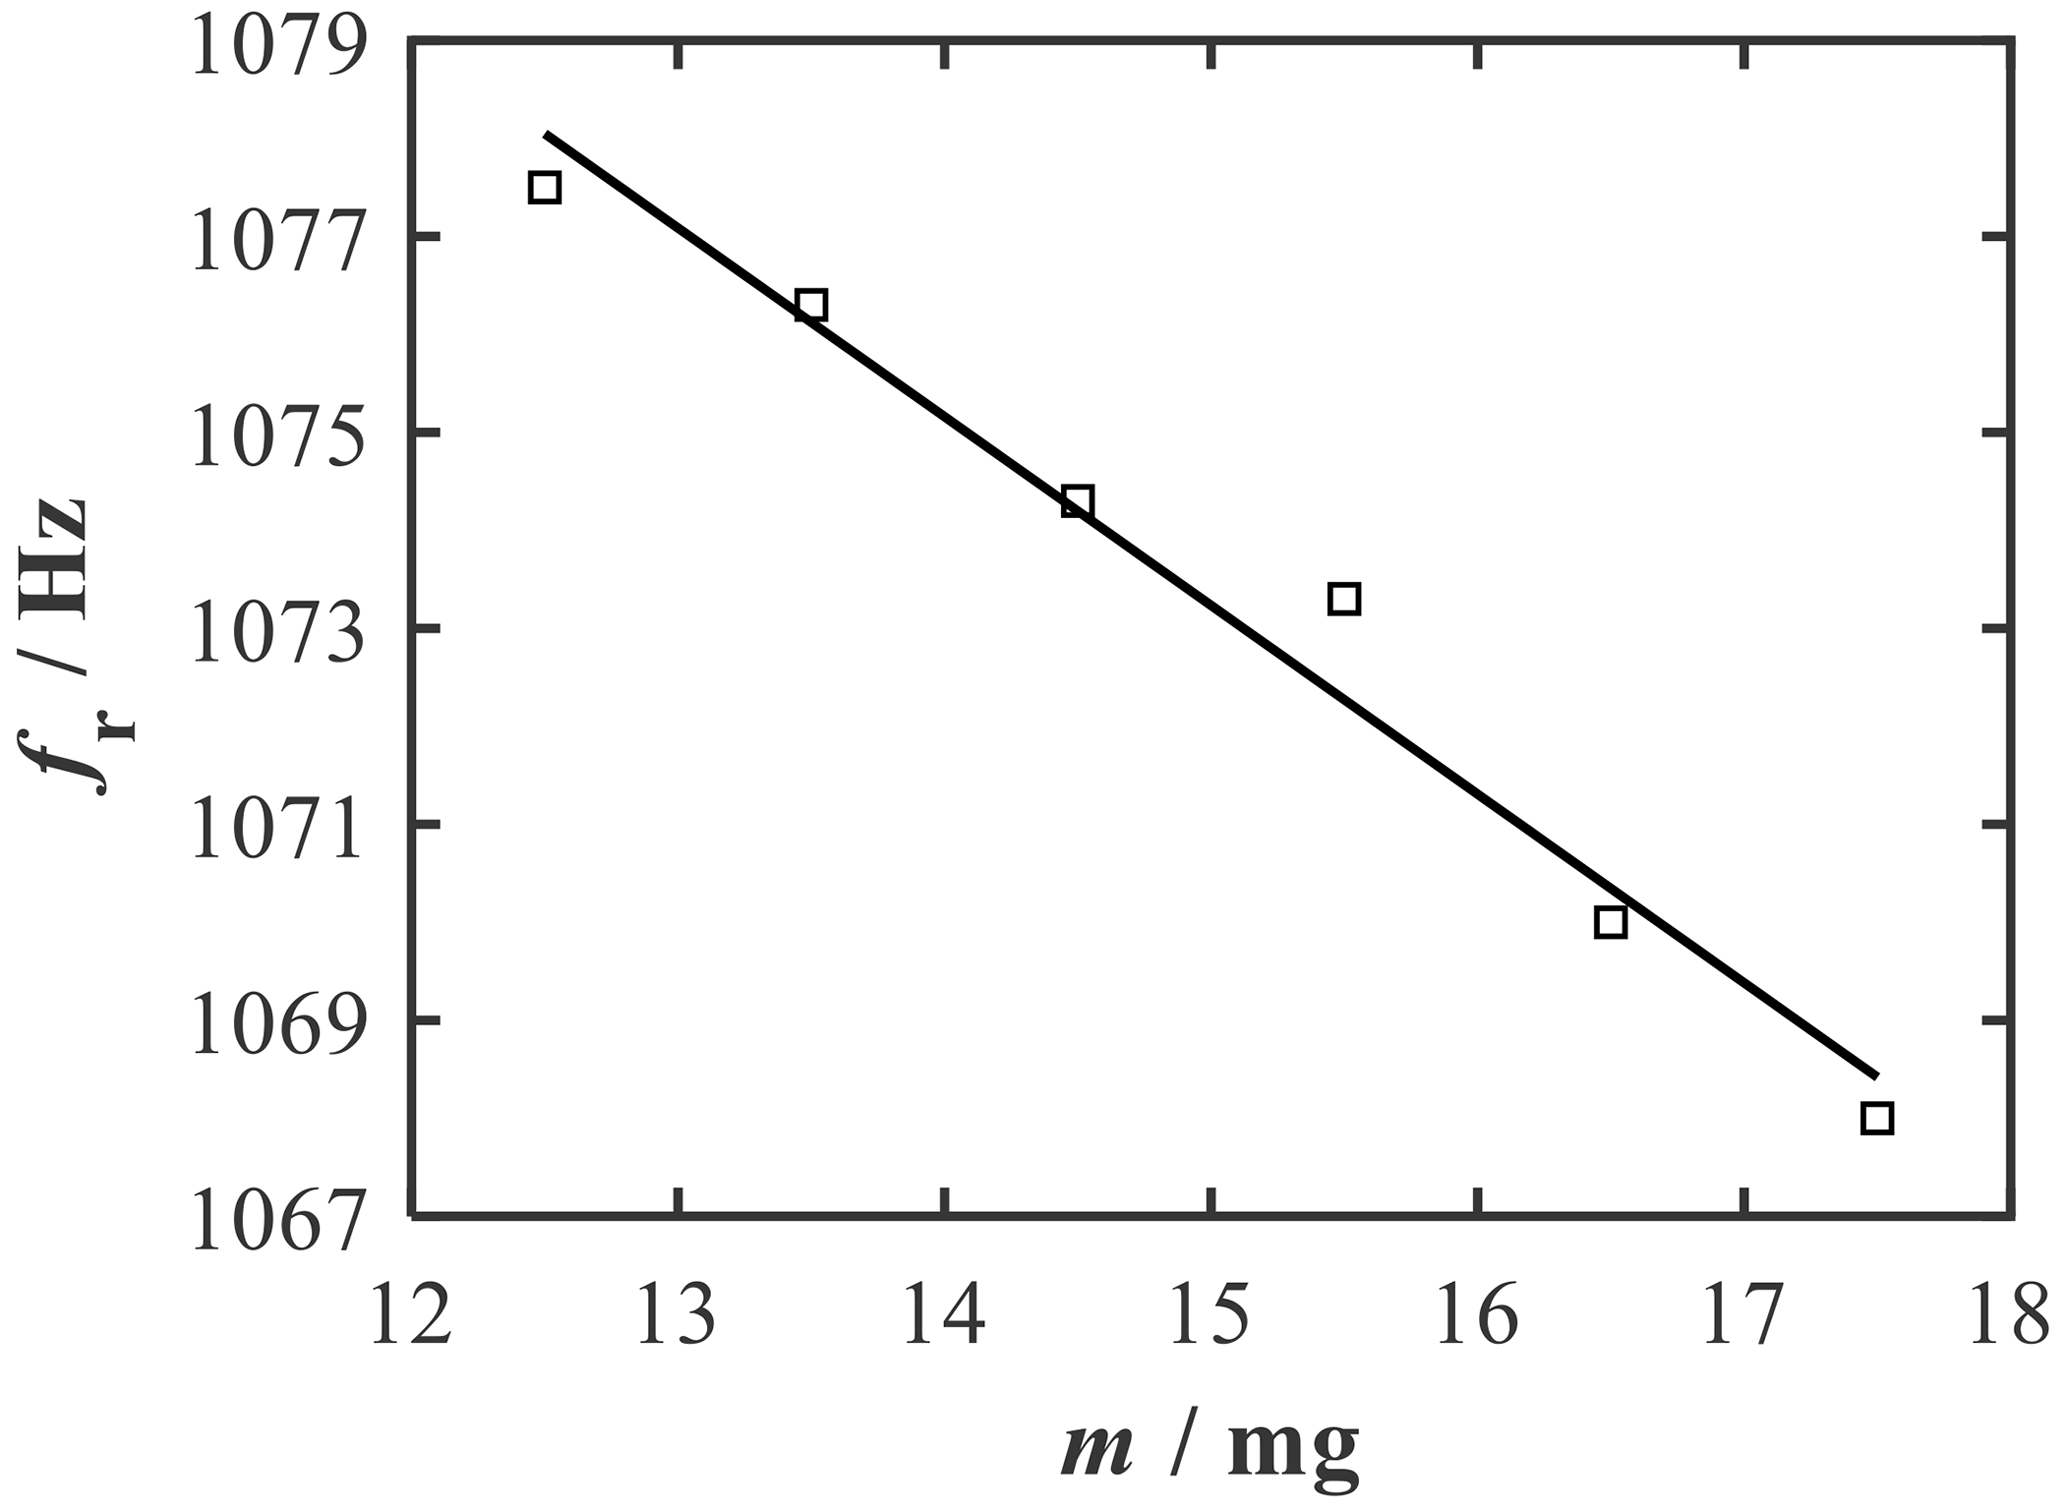
Figure 7Resonant frequency depending on the sample mass from acoustic measurement of the seven-layer chip. A sensitivity of −1.93 Hz mg−1 can be obtained from the regression line.
The small deviation in the resonant frequency and sensitivity from the simulation results can be explained by several factors. The piezoelectric linear actuator exerts a preload on the DSC chip and, thus, has an enormous influence on the vibration characteristics of the system. Another major influencing factor is given by the unreproducible clamping of the sensor chip in the plastic holder. When clamping and unclamping the sensor chip, considerable variations in the measured properties occur in some cases. Furthermore, deviations from the LTCC material properties specified in the data sheet are likely, as the manufacturing process, especially sintering, influences the microstructure and the final properties (Makarovič et al., 2012).
4.2 Optical measurement of the resonant frequency
The deflection of microcantilevers is frequently recorded using optical methods, as they can resolve distance changes very precisely (Fernando et al., 2009; Alvarez and Lechuga, 2010). The most common principle is the optical beam deflection method, which is also used in most atomic force microscopy (AFM) probes (Arntz et al., 2003; Pei et al., 2004; Lavrik et al., 2004; Beaulieu et al., 2007). In this method, a laser beam is reflected from the cantilever onto a position-sensitive photodetector (PSD). A similar setup was used here in the case of the DSC sensor (Fig. 8). A laser diode throws a laser beam at a certain angle onto the back of the DSC chip. The reflected beam reaches the detector via a converging lens. Due to the oscillation of the sensor chip, the position Δx of the light spot changes as a function of the deflection Δz.
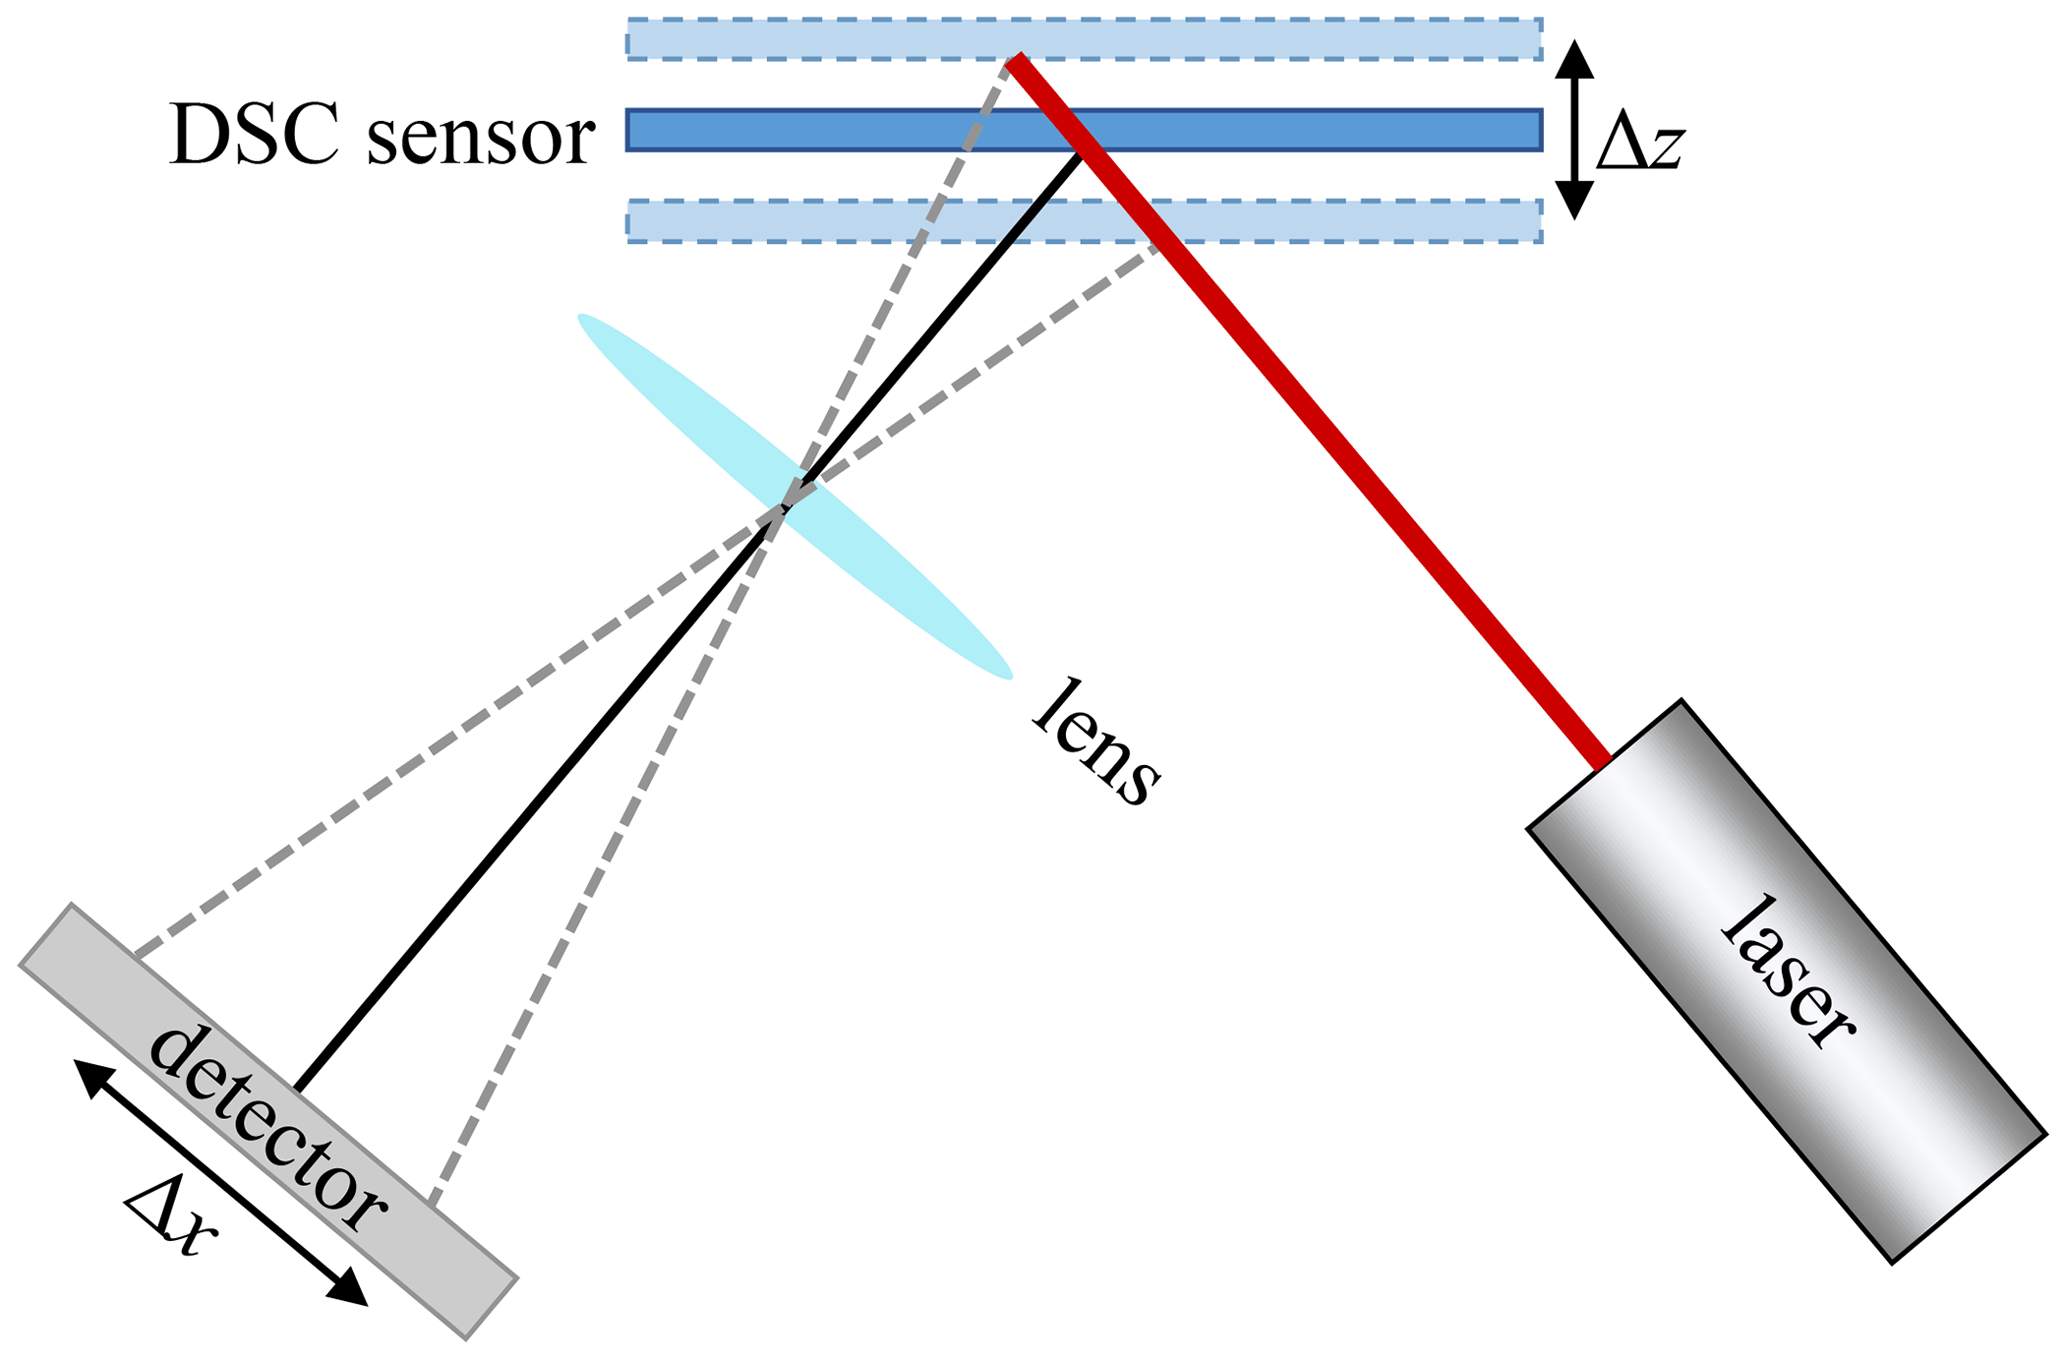
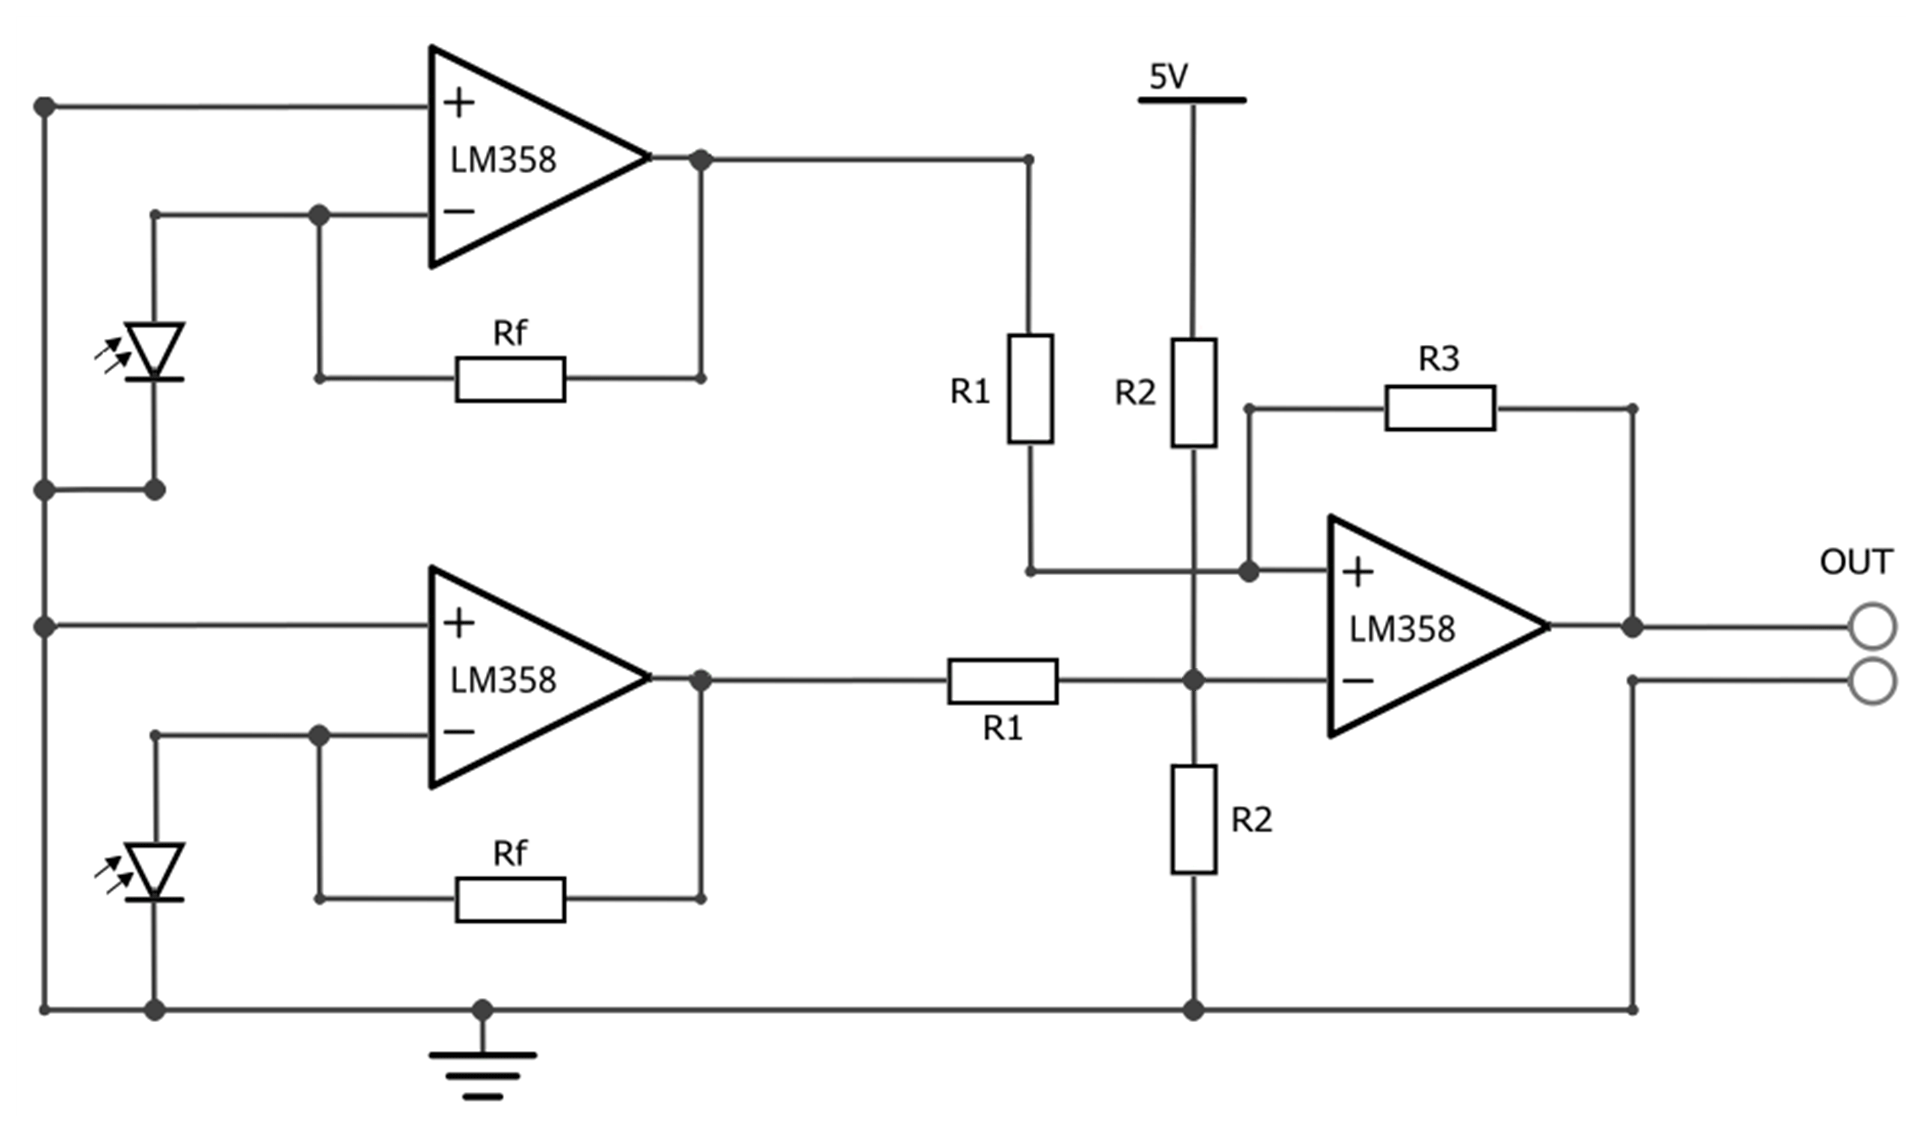
The measurement setup is shown in Fig. 9. The ARIM ADL-65055TL laser diode was used in combination with the IC-SY-WK2D driver. The Hamamatsu S4584-06 position-sensitive photodetector measured the location of the laser beam reflected from the DSC chip. A PSD is an optoelectronic component based on the lateral photoelectric effect that generates an electric current depending on the position of the incident light on the detector surface (Lindholm et al., 1976). The detector signal was processed by a transimpedance amplifier, which transforms the output currents into voltages (Fig. 10).

Figure 9Setup of the optical measurement with the three-layer sensor chip. Complete measurement setup with the laser diode, converging lens, and PSD (a) as well as the reflection of the laser beam on the sensor chip (b).
To increase the maximum deflection of the sensor chip and, consequently, the change in the position of the light spot on the detector, the three-layer sensor chip was used for the measurement (see Table 1). The periodic vibration excitation was conducted using the same methodology as that outlined in Sect. 4.1 with the help of a piezoelectric linear actuator on one of the beams.
The measuring procedure included the frequency sweep and the determination of the sample mass via the maximum amplitude of the output voltage for each measuring point. The measured resonant frequencies are shown in Fig. 11 as a function of the varied sample mass. The resonant frequency decreased from an initial frequency of 625.0 to 618.2 Hz. A linear relationship can be seen. The sensitivity determined from the slope of the regression line is −1.36 Hz mg−1. The deviation in the measured values from the simulated values can again be explained primarily by the fact that an unreproducible bias occurs on one of the beams due to the mechanical clamping of the actuator. The results reveal that sample mass changes of 1 mg can be clearly detected with a few optical components in a preliminary measurement setup.
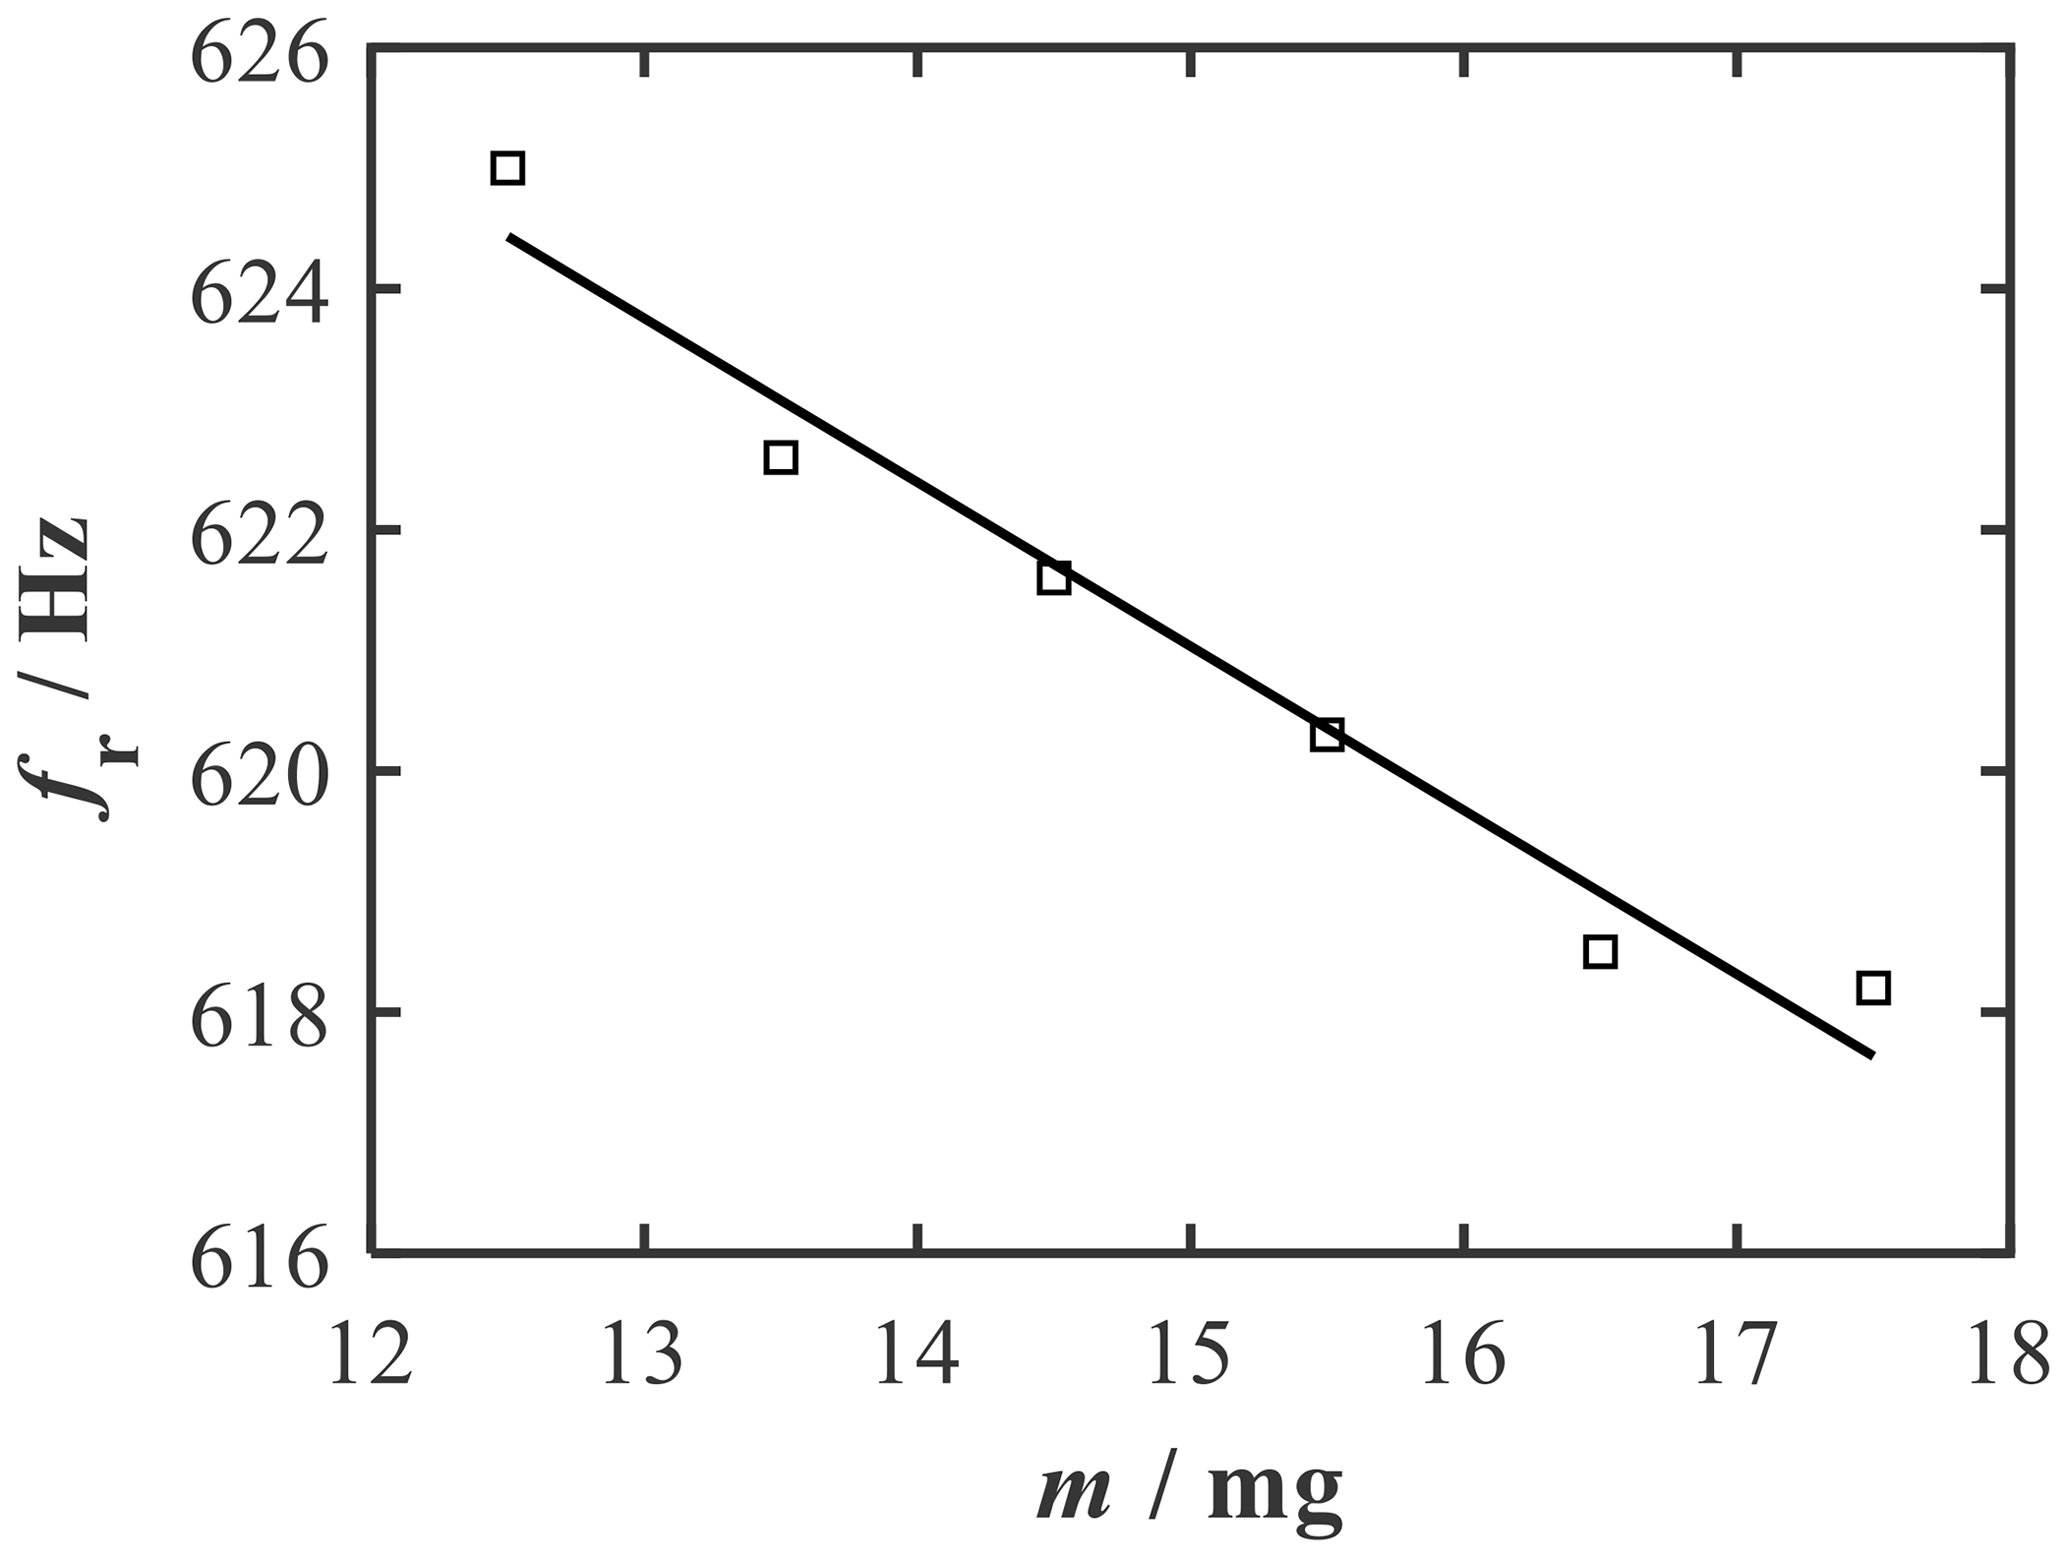
Figure 11Resonant frequency depending on the sample mass from optical measurement of the three-layer chip. A sensitivity of −1.36 Hz mg−1 can be obtained from the regression line.
4.3 Piezoresistive measurement of the natural frequency
Besides optical techniques, piezoresistive transducers are one of the most popular ways to measure the deflection of cantilevers in the microgravimetry range due to their simplicity in implementation and signal processing (Setiono et al., 2019; Xu et al., 2020). Piezoresistive measurements are widely used in strain gauges. This does not only include the measurement of strain; piezoresistive devices also serve as transducers for a wide range of mechanical quantities by indirectly determining the required value through the deformation caused in the measuring body (Keil, 2017). This also applies to the application of the DSC chip. The oscillating strain in the beams resulting from the vibration of the sensor chip is consequently converted into a resistance change via the strain gauges attached there. Due to fabrication using the thick-film technique, screen-printed strain gauges can easily be integrated into the pre-established DSC chip manufacturing process.
The DSC chip with screen-printed strain gauges and silver conductors is shown in Fig. 12. According to the simulation results in Table 1, the three-layer structure was used to increase the maximum deflection and, therefore, also the strain occurring in the beams. Meandering strain gauges were used to realize contact in the clamping area. In addition, the output signal can be doubled due to the presence of two meander paths. A resistor paste with a high gauge factor of 17 to 18 from Electro-Science Laboratories, which had been specially developed for piezoresistive applications, was used.
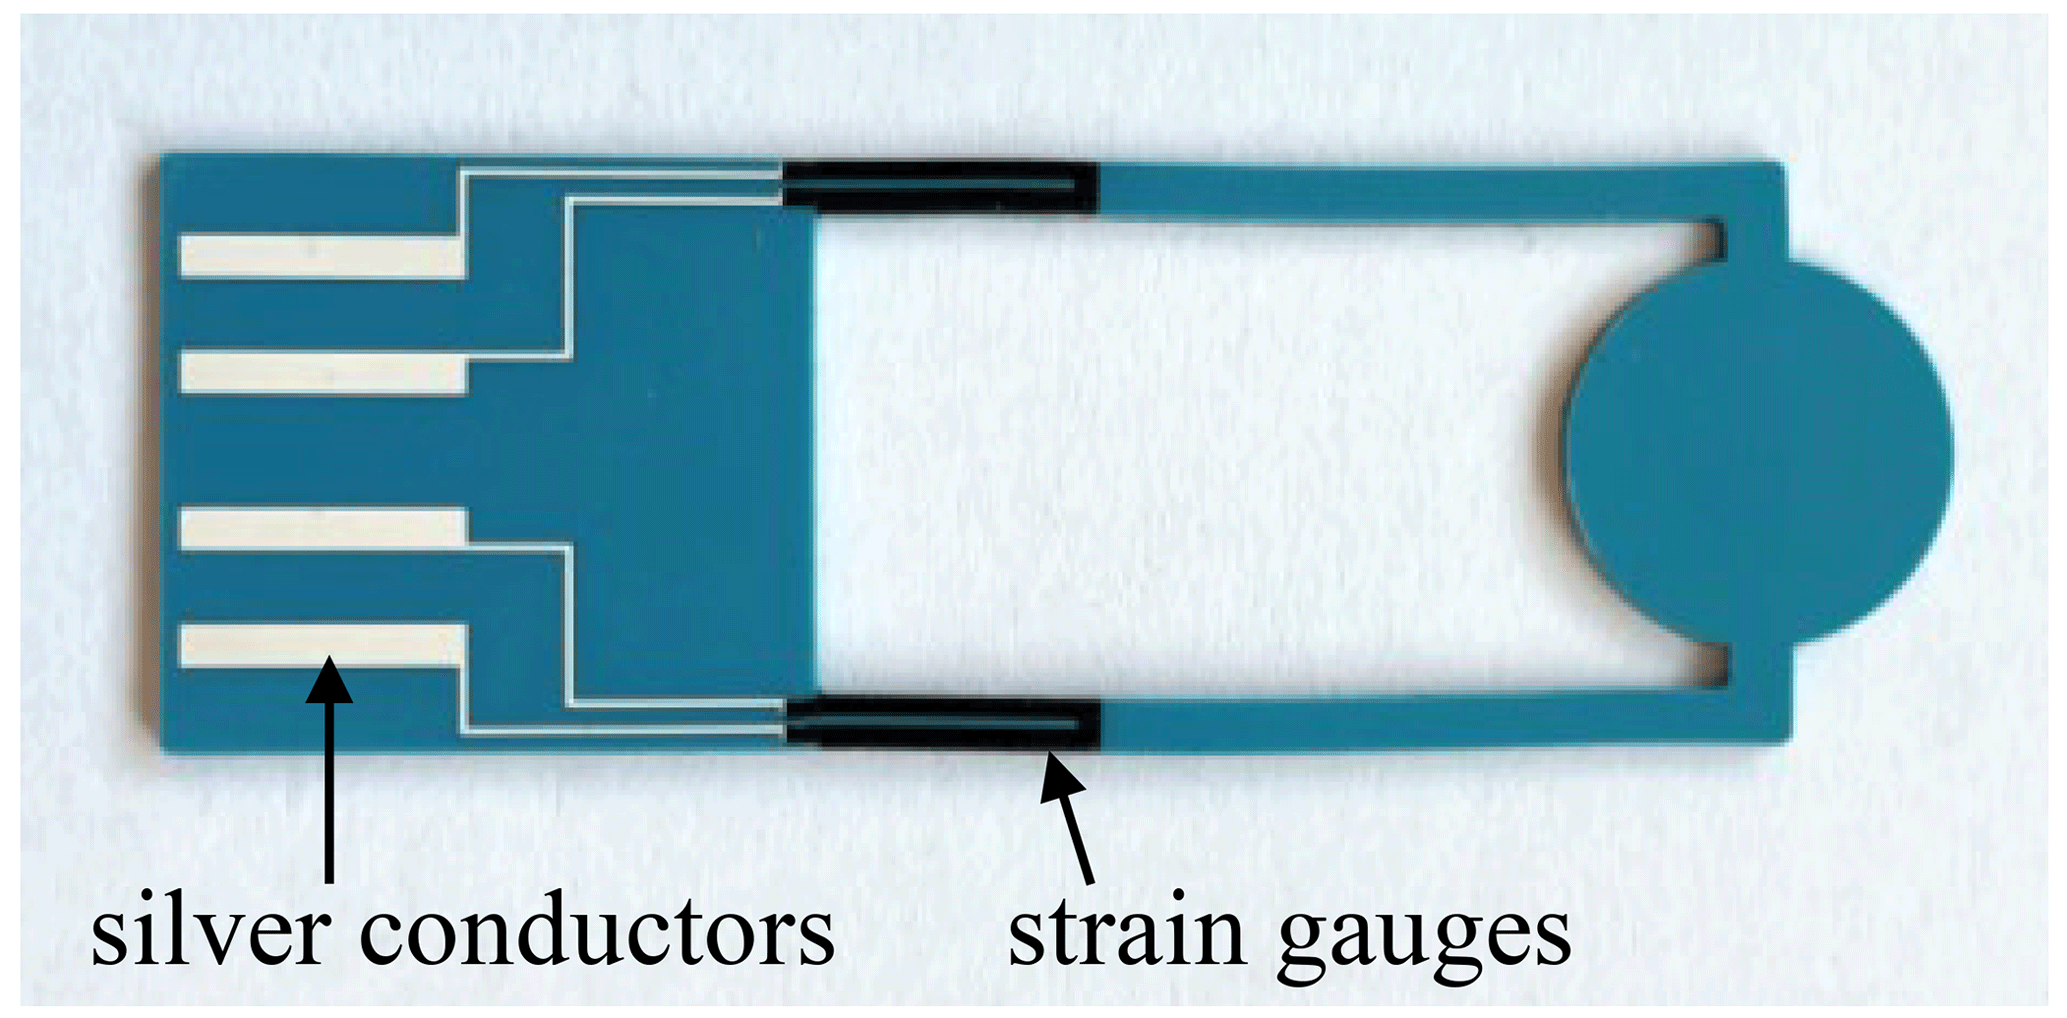
Figure 12Three-layer sensor chip with screen-printed strain gauges and silver conductors.
In order to compensate for temperature influences during thermal analysis and to further increase the measurable effect, a Wheatstone bridge was used. For this purpose, two strain gauges were applied to the upper side and two to the lower side. They were alternately stretched and compressed as the chip vibrated. The differential signal converted the resistance change into a proportional voltage change, thereby achieving temperature compensation.
The measurement setup is shown in Fig. 13. The sensor chip was excited by a transient force impact on the sensor holder by an oscillating servomotor. The sensor holder transmits the excitation to the firmly clamped sensor chip. As a result, the chip is deflected and exhibits a damped oscillation in natural frequency. The force must be adjusted via the compression springs so that the sample mass does not lift off.

Figure 13Setup of the piezoresistive measurement with the three-layer sensor chip.
Due to the low output voltage amplitude, a fast Fourier transform (FFT) was used for the evaluation. To achieve a sufficient frequency resolution of 0.1 Hz after FFT, a measuring duration of 10 s per measuring point was used. A bridge supply voltage of 20 V was applied. The normalized frequency spectrum at a mass loading of 1 mg is shown in Fig. 14. A well-defined maximum occurred at the required natural frequency. Due to the transient excitation, the frequency spectrum is continuous. To include the peak width in the evaluation, a Gaussian function was fitted to the spectrum, and its maximum was detected to determine the natural frequency. For an estimation of the sensitivity, the sample mass was successively increased. To investigate reproducibility, the measurement was repeated three times for each sample mass.
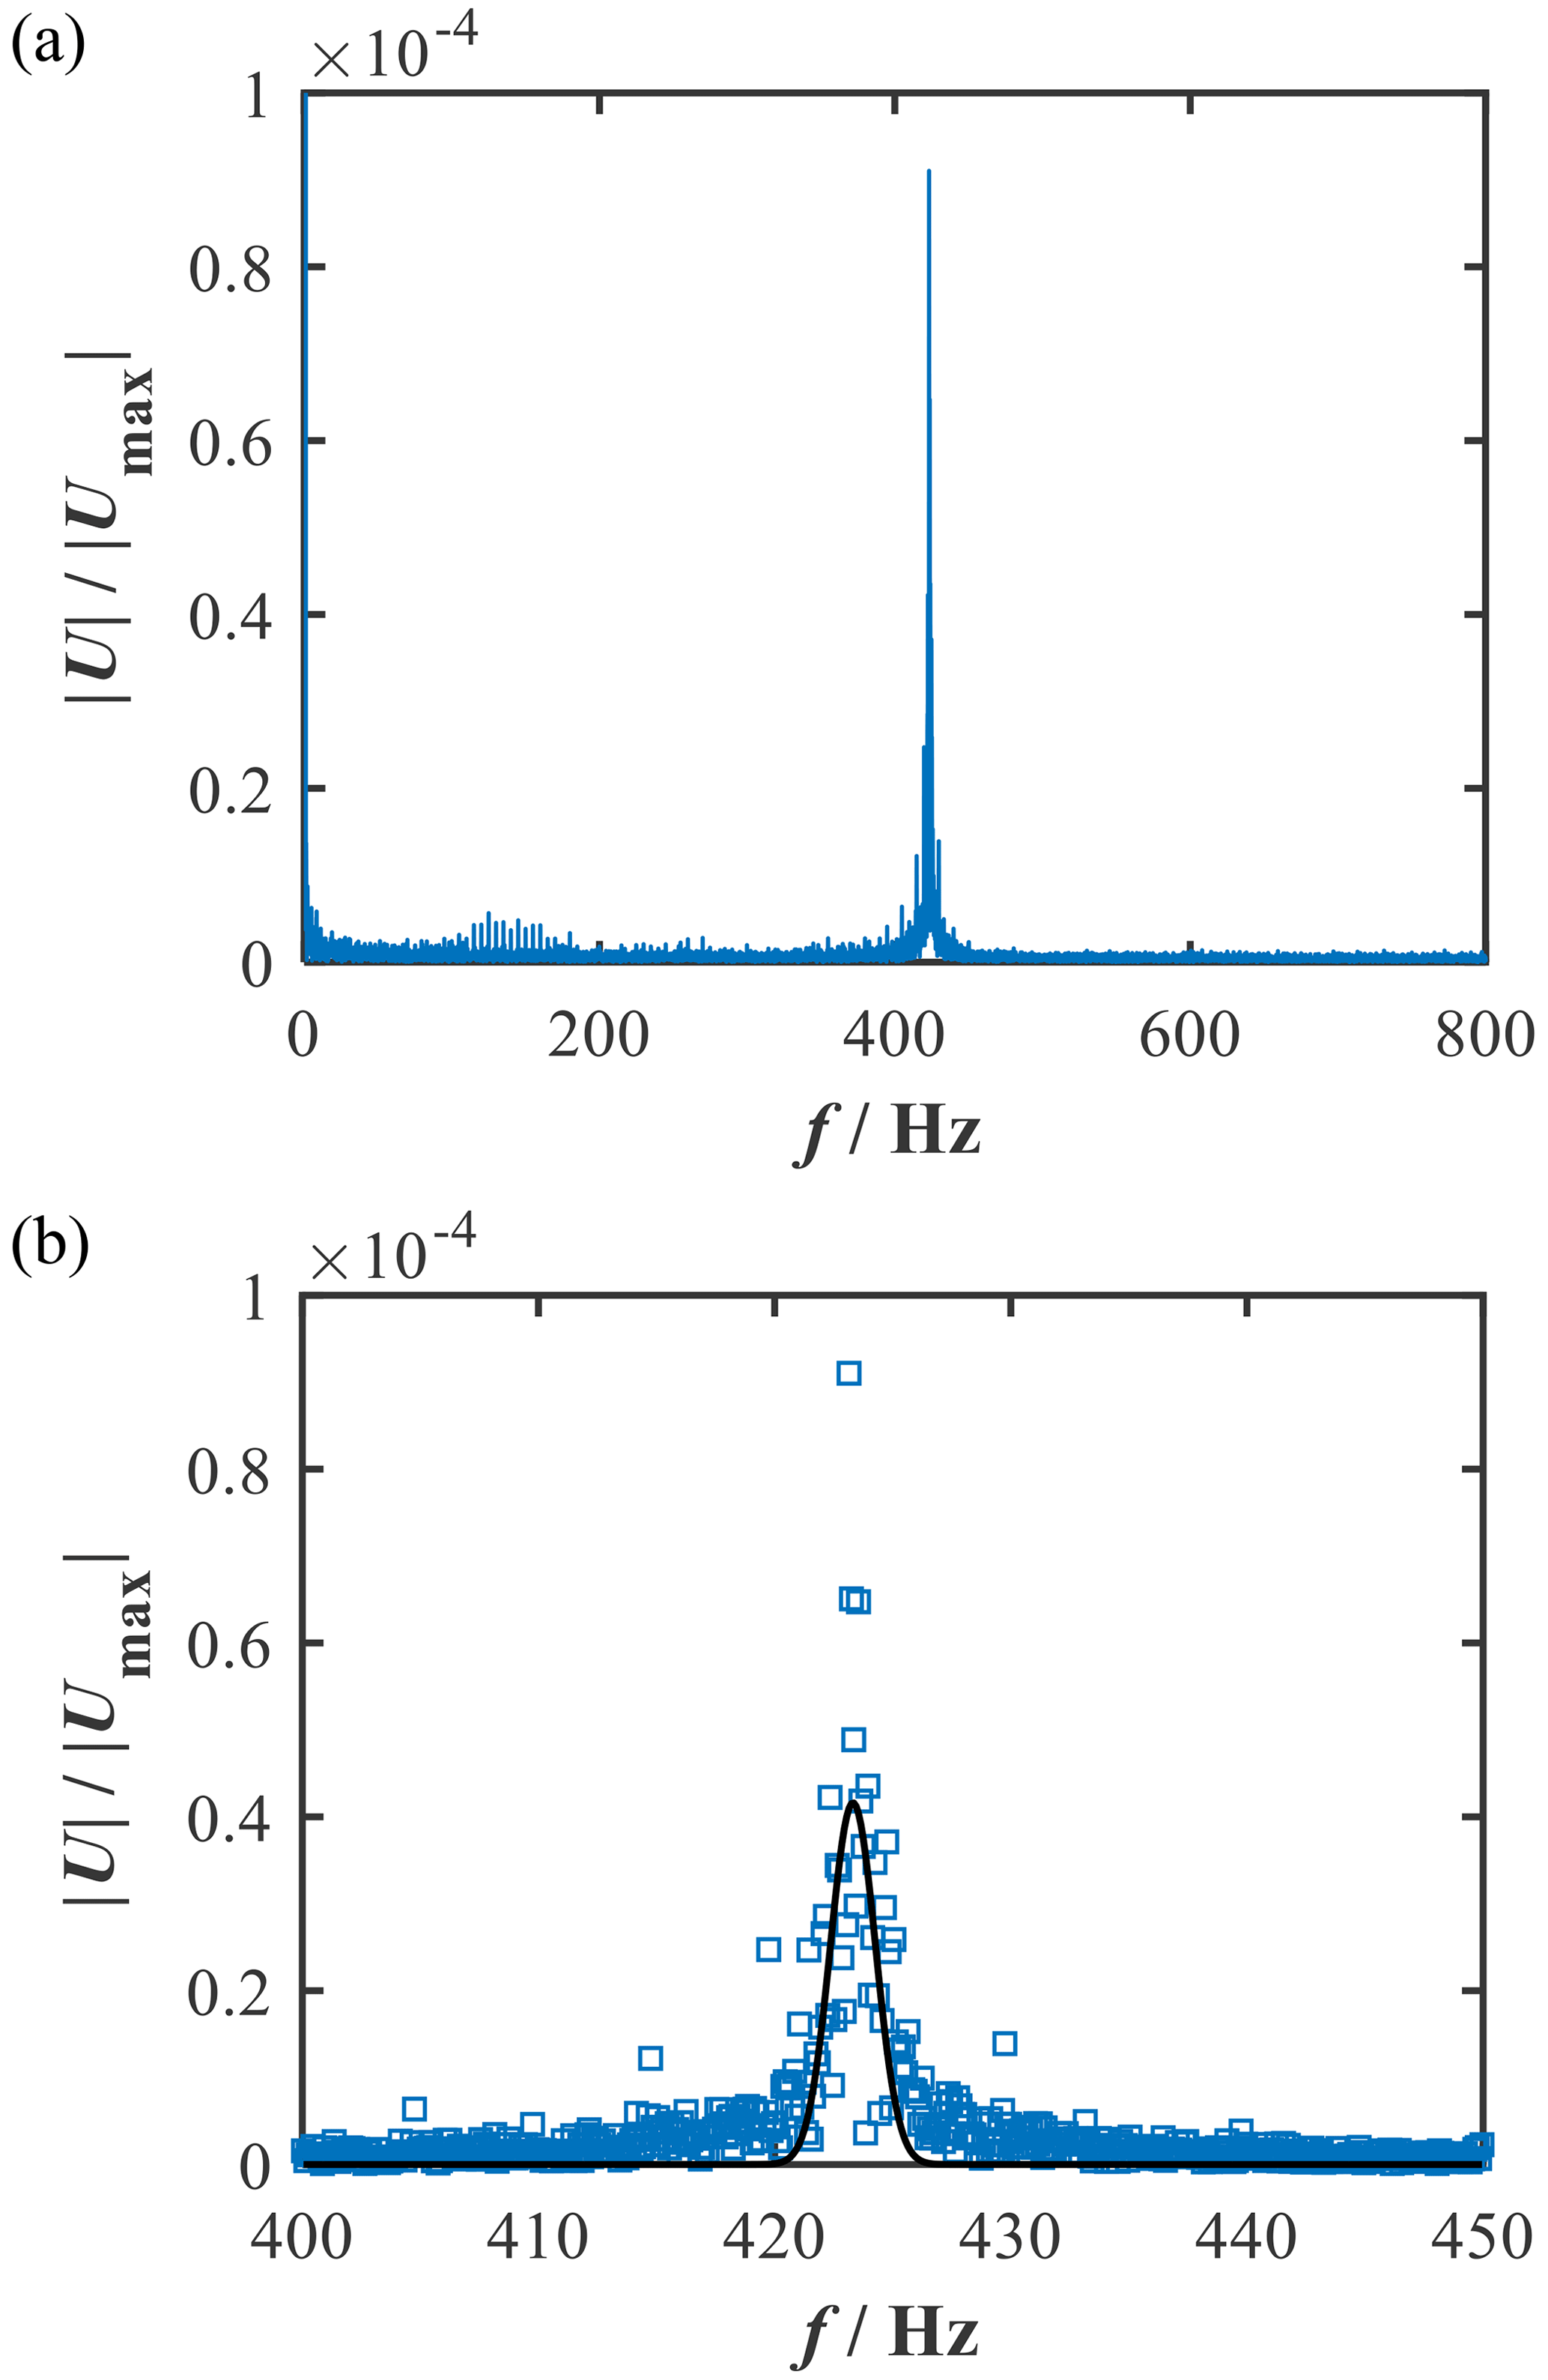
Figure 14Results of the piezoresistive measurement. Frequency spectrum after fast Fourier transform at a mass loading of 1 mg (a) and a section of the frequency spectrum with the fit of a Gaussian function (b).
The measured natural frequency as a function of the sample mass is shown in Fig. 15. The DSC chip with crucible (12.8 mg) initially had a natural frequency of 424.7 Hz. With an applied sample mass of 5 mg, the natural frequency decreased to 418.9 Hz. Once again, a linear relationship between mass loading and natural frequency was found, with a sensitivity of −1.12 Hz mg−1. Repeating the measurement three times revealed that the measured values deviated by a maximum of ±0.1 Hz, which corresponds to the frequency resolution of the FFT. With the measured sensitivity, a theoretical mass resolution of approximately 100 µg is achievable, which can be further improved by an extended measuring time. Thus, with screen-printed strain gauges on the beams of the sensor chip, it is possible to successfully conduct the first noncontact mass measurements using a relatively simple setup and to detect sample mass changes of 1 mg with good reproducibility. In this case, the variation in the natural frequency and the sensitivity from the simulation can mainly be attributed to the changed clamping. As depicted in Fig. 13, the clamping surface of the sensor chip is not flush with the sensor holder. The increased length of the beams results in a lower natural frequency and a lower sensitivity according to Eqs. (1) and (2).

Figure 15Resonant frequency depending on the sample mass from piezoresistive measurement of the three-layer chip. A sensitivity of −1.12 Hz mg−1 can be obtained from the regression line.
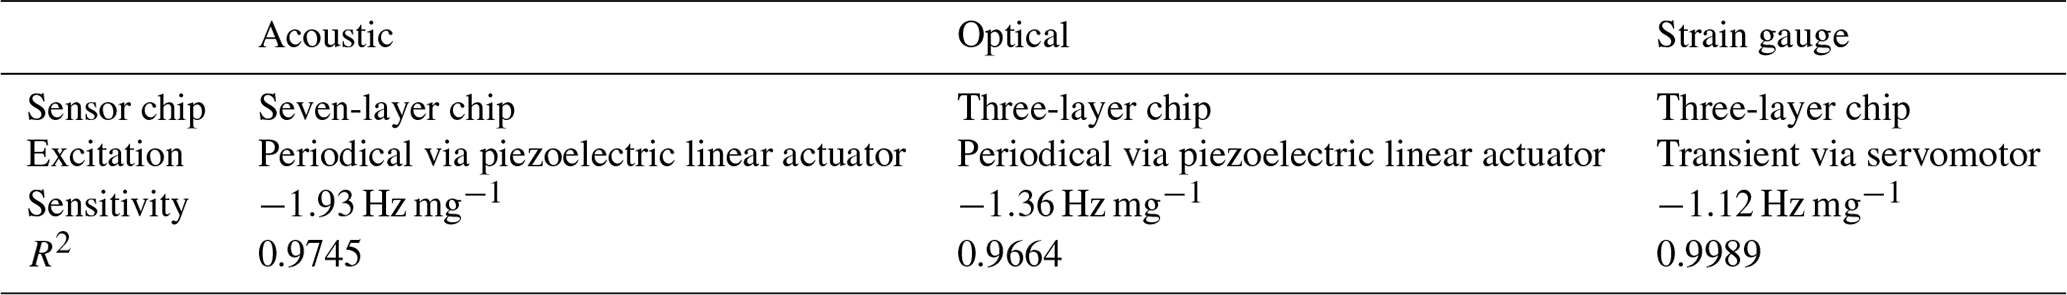
The first approaches for integrating a noncontact weighing device into a DSC chip achieved promising results. The characteristics of the three methods investigated are compared in Table 2 and evaluated below. The results of the acoustic method show the highest sensitivity of −1.93 Hz mg−1. However, the measured sensitivity is not determined by the measurement method used but rather by the physical properties of the system. The use of the seven-layer sensor chip leads to a different frequency range than with optical and piezoresistive measurement. A higher sensitivity in this case has already been indicated by the simulation results in Table 1. The coefficient of determination (R2) is a statistical indicator showing how well measured data with linear dependence are described by a regression line, and it was used to compare the different measurement methods. According to Table 2, piezoresistive measurement has the highest R2 (0.9989), followed by acoustic measurement (0.9745). The optical measurement performs worst with an R2 value of 0.9664.
However, it must be emphasized here that all of the experiments are preliminary setups that still have enormous potential for development. Moreover, different excitation principles were used, which can have an additional impact on the results of the measurement. Yet, there are further reasons for using screen-printed strain gauges. Screen-printed strain gauges are easy to apply and can be cost-effectively established in the DSC sensor manufacturing process. Furthermore, no additional components are necessary, and signal processing is simple. Acoustic measurement is also an easy and low-cost method, as only a directional microphone is needed as an additional component. However, there is a high susceptibility to disturbances, which must be improved by mechanical shielding or signal processing. A major disadvantage, though, is the limited functionality in the case of vacuum or gas purging, which must be investigated further. A successful mass measurement can also be conducted with the optical measurement method using only a few components. The main disadvantage here is the complex and precise alignment of the optical elements.
The first steps towards integrating a weighing device into the miniaturized DSC chip were described using three measurement methods (acoustic, optical, and piezoresistive). The principle of mass determination by changing the resonant or natural frequency of the DSC chip as a vibrating cantilever was proven. A simulation model showed that the maximum deflection can be increased by a factor of more than 5 by reducing the number of layers from seven to three. This was used for optical and piezoresistive measurements. Next, the first test structures for frequency measurement were manufactured. In this context, screen-printed strain gauges were successfully integrated into the DSC chip manufacturing process.
In summary, three complete measuring systems were set up with simple means, and these systems already allow mass measurements with a resolution of 100 µg at the present time. In the evaluation of the different methods, the piezoresistive measurement showed the best R2 value of 0.9989. Due to the ease of fabrication and signal processing, this particular method demonstrates promising potential for implementation in the DSC chip.
In further studies, investigations will be carried out under real circumstances, in particular during a temperature profile or under different atmospheric conditions. The temperature changes of several hundred degrees that occur during DSC analysis can have a considerable effect on the natural frequency, as Young's modulus of the ceramics used for the DSC chip is generally temperature dependent. For this purpose, sensor chips with DSC functionality must be manufactured, and the measurement setup must be improved. Finally, simultaneous DSC and TG measurements will be performed in order to investigate possible interactions.
All relevant data presented in the article are stored according to institutional requirements and, as such, are not available online. However, all data used in this paper can be made available by the authors upon request.
RM, JK, FL, and MGo created the concept of the project and were responsible for funding acquisition. The hardware setup was provided by MGe, MGo, and FL. JK and RW manufactured the sensor substrates. Simulations were executed by JD. The investigation of the measurement methods, the design and construction of the setups, and the measurement data analysis were done by JD and TW in close discussion with RW, JK, RM, MGe, MGo, and FL. All authors contributed to the review and to editing of the final paper. RM supervised the work.
The contact author has declared that none of the authors has any competing interests.
Publisher’s note: Copernicus Publications remains neutral with regard to jurisdictional claims in published maps and institutional affiliations.
This article is part of the special issue “Sensors and Measurement Systems 2022”. It is a result of the “Sensoren und Messsysteme 2022, 21. ITG/GMA-Fachtagung”, Nuremberg, Germany, 10–11 May 2022.
This research has been supported by the Bayerische Forschungsstiftung (grant no. AZ-1346-18).
This open-access publication was funded by the University of Bayreuth.
This paper was edited by Jürgen Wöllenstein and reviewed by two anonymous referees.
Alvarez, M. and Lechuga, L. M.: Microcantilever-based platforms as biosensing tools, Analyst, 135, 827–836, https://doi.org/10.1039/b908503n, 2010.
Arntz, Y., Seelig, J. D., Lang, H. P., Zhang, J., Hunziker, P., Ramseyer, J. P., Meyer, E., Hegner, M., and Gerber, C.: Label-free protein assay based on a nanomechanical cantilever array, Nanotechnology, 14, 86–90, https://doi.org/10.1088/0957-4484/14/1/319, 2003.
Basu, A. K., Basu, A., and Bhattacharya, S.: Micro/Nano fabricated cantilever based biosensor platform: A review and recent progress, Enzyme Microb. Tech., 139, 109558, https://doi.org/10.1016/j.enzmictec.2020.109558, 2020.
Beaulieu, L. Y., Godin, M., Laroche, O., Tabard-Cossa, V., and Grutter, P.: A complete analysis of the laser beam deflection system used in cantilever-based systems, Ultramicroscopy, 107, 422–430, https://doi.org/10.1016/j.ultramic.2006.11.001, 2007.
Bernstein, H.: Elektroakustik – Mikrofone, Klangstufen, Verstärker, Filterschaltungen und Lautsprecher, 2nd ed., Springer, Wiesbaden, Germany, 33 pp., 197, https://doi.org/10.1007/978-3-658-25174-1, 2019.
Brandenburg, A., Wappler, E., Kita, J., and Moos R.: Miniaturized ceramic DSC device with strain gauge-based mass detection – First steps to realize a fully integrated DSC/TGA device, Sensor. Actuat. A-Phys., 241, 145–151, https://doi.org/10.1016/j.sna.2016.02.011, 2016.
DuPont: DuPont™ Green Tape™ – Design and Layout Guidelines, https://studylib.net/doc/18479645/dupontTM-greentapeTM-design-and-layout-guidelines (last access: 11 January 2023), 2009.
Fernando, S. and Austin, M. W.: Extending the deflection measurement range of interferometric microcantilever arrays, J. Microelectromech. S., 18, 480–487, https://doi.org/10.1109/JMEMS.2009.2013399, 2009.
Gross, D., Hauger, W., Schröder, J., and Wall, W. A.: Technische Mechanik 2 – Elektrostatik, 12th ed., Springer, Berlin, Heidelberg, Germany, 93 pp., https://doi.org/10.1007/978-3-642-40966-0, 2014.
Höhne, G. W. H., Hemminger, W. F., and Flammersheim, H.-J.: Differential Scanning Calorimetry, 2nd ed., 5 pp., Springer, Berlin, Heidelberg, Germany, https://doi.org/10.1007/978-3-662-06710-9, 2003.
Jäger, H., Mastel, R., and Knaebel, M.: Technische Schwingungslehre, 8th ed., Springer, Wiesbaden, Germany, pp. 45–47, 88–89, 144, 231–232, https://doi.org/10.1007/978-3-8348-2099-0, 2013.
Jia, H., Xu, P., and Li, X.: Integrated resonant micro/nano gravimetric sensor for bio/chemical detection in air and liquid, Micromachines-Basel, 12, 645, https://doi.org/10.3390/mi12060645, 2021.
Johnson, B. N. and Mutharasan, R.: Biosensing using dynamic-mode cantilever sensors: A review, Biosensors and Bioelectronics, 32, 1–18, https://doi.org/10.1016/j.bios.2011.10.054, 2012.
Jurków, D., Maeder, T., Dąbrowski, A., Zarnik, M. S., Belavič, D., Bartsch, H., and Müller, J.: Overview on low temperature co-fired ceramic sensors, Sensor. Actuat. A-Phys., 233, 125–146, https://doi.org/10.1016/j.sna.2015.05.023, 2015.
Kadirsoy, S., Atar, N., and Yola, M. L.: Molecularly imprinted QCM sensor based on delaminated MXene for chlorpyrifos detection and QCM sensor validation, New J. Chem., 44, 6524–6532, https://doi.org/10.1039/d0nj00951b, 2020.
Keil, S.: Dehnungsmessstreifen, 2nd ed., Springer, Wiesbaden, Germany, 13–150 pp., https://doi.org/10.1007/978-3-658-13612-3, 2017.
Kita, J. and Moos, R.: Development of LTCC-Materials and their Applications – an Overview, Inform MIDEM, 38, 219–224, 2008.
Kita, J., Missal, W., Wappler, E., Bechtold, F., and Moos, R.: Development of a Miniaturized Ceramic Differential Calorimeter Device in LTCC Technology, J. Ceram. Sci. Technol., 4, 137–144, https://doi.org/10.4416/JCST2013-00008, 2013.
Lavrik, N. V., Sepaniak, M. J., and Datskos, P. G.: Cantilever transducers as a platform for chemical and biological sensors, Rev. Sci. Instrum., 75, 2229–2253, https://doi.org/10.1063/1.1763252, 2004.
Li, X. and Lee, D.-W.: Integrated microcantilevers for high-resolution sensing and probing, Meas. Sci. Technol., 23, 022001, https://doi.org/10.1088/0957-0233/23/2/022001, 2012.
Li, X., Ma, D., Zheng, S.-R., Fan, J., Wang, T., Dai, Z., Zou, X.-Y., Teng, S.-H., and Zhang, W.-G.: Assembly of a miRNA-modified QCM sensor for miRNA recognition through response patterns, J. Mol. Recognit., 32, e2772, https://doi.org/10.1002/jmr.2772, 2019.
Lindholm, L. E. and Petersson, G.: Position sensitive photodetectors with high linearity, 1976 International Electron Devices Meeting, Washington, DC, USA, 6–8 December 1976, 408–411, https://doi.org/10.1109/IEDM.1976.189069, 1976.
Liu, X., Zhang, D., Wang, D., Li, T., Song, X., and Kang, Z.: A humidity sensing and respiratory monitoring system constructed from quartz crystal microbalance sensors based on a chitosan/polypyrrole composite film, J. Mater. Chem. A, 9, 14524–14533, https://doi.org/10.1039/d1ta02828f, 2021.
Makarovič, K., Meden, A., Hrovat, M., Holc, J., Benčan, A., Dakskobler, A., and Kosec, M.: The Effect of Processing Conditions on the Properties of LTCC Material, J. Am. Ceram. Soc., 95, 760–767, https://doi.org/10.1111/j.1551-2916.2011.05027.x, 2012.
Missal, W., Kita, J., Wappler, E., Gora, F., Kipka, A., Bartnitzek, T., Bechtold, F., Schabbel, D., Pawlowski, B., and Moos, R.: Miniaturized Ceramic Differential Scanning Calorimeter with Integrated Oven and Crucible in LTCC Technology, Sensor. Actuat. A-Phys., 172, 21–26, https://doi.org/10.1016/j.sna.2011.01.025, 2011.
Missal, W., Kita, J., Wappler, E., Bechtold, F., and Moos R.: Calorimetric Sensitivity and Thermal Resolution of a Novel Miniaturized Ceramic DSC Chip in LTCC Technology, Thermochim. Acta, 543, 142–149, https://doi.org/10.1016/j.tca.2012.05.019, 2012.
Möser, M.: Technische Akustik, 10th ed., Springer, Berlin, Heidelberg, Germany, 129 pp., https://doi.org/10.1007/978-3-662-47704-5, 2015.
Papula, L.: Mathematik für Ingenieure und Naturwissenschaftler – Band 2, 13th ed., Vieweg+Teubner, Wiesbaden, Germany, 443 pp., https://doi.org/10.1007/978-3-8348-8643-9_1, 2012.
Pei, J., Tian, F., and Thundat, T.: Glucose biosensor based on the microcantilever, Anal. Chem., 76, 292–297, https://doi.org/10.1021/ac035048k, 2004.
Sauerbrey, G.: Verwendung von Schwingquarzen zur Wägung dünner Schichten und zur Mikrowägung, Z. Phys., 155, 206–222, https://doi.org/10.1007/BF01337937, 1959.
Setiono, A., Nyang'au, W. O., Fahrbach, M., Xu, J., Bertke, M., Wasisto, H. S., and Peiner, E.: Improvement of frequency responses of an in-plane electro-thermal cantilever sensor for real-time measurement, J. Micromech. Microeng., 29, 124006, https://doi.org/10.1088/1361-6439/ab4e29, 2019.
Xu, F., Wei, Y., Bian, S., Wang, H., Chen, D., and Kong, D.: Simulation-based design and optimization of rectangular micro-cantilever-based aerosols mass sensor, Sensors-Basel, 20, 626, https://doi.org/10.3390/s20030626, 2020.
Ziegler, C.: Cantilever-based biosensors, Anal. Bioanal. Chem., 379, 946–959, https://doi.org/10.1007/s00216-004-2694-y, 2004.
- Abstract
- Introduction
- Setup of the miniaturized ceramic DSC chip
- Theory and simulation of the weighing system
- Measurements
- Evaluation of the measurement methods
- Conclusions
- Data availability
- Author contributions
- Competing interests
- Disclaimer
- Special issue statement
- Financial support
- Review statement
- References