the Creative Commons Attribution 4.0 License.
the Creative Commons Attribution 4.0 License.
 | 08 Jul 2024
Concatenated Bragg grating fiber-optic sensors for simultaneous measurement of curvature, temperature, and axial pressure
Sohrab Shojaei Khatouni
Sven Zakowski
Reza Hosseini Vedad
Mustafa Masjedi
Akram Askar
Jan Christian Eli Ewald
Hoc Khiem Trieu
This paper presents the development and evaluation of four sensors based on multiple fiber Bragg grating (FBG) constellations embedded in a silicon dioxide single-mode fiber (SMF) for simultaneous measurement of pressure, temperature, and bending curvature. We applied dimension and material variations – including core, cladding, and coating dimensions; coating material; and the number and arrangement of the FBGs – to optimize the reflected signal response and increase information density. A bootstrap-aggregated ensemble of decision trees was used to evaluate the sensor signal. The results show that adjusting the cladding-to-coating ratio led to significant improvements in pressure and bending prediction performance. Additionally, two combined FBGs were fabricated to form a fiber Bragg grating Fabry–Pérot interferometer, which enabled the detection of curvature with a root-mean-square error (RMSE) of 0.0034 L mm−1 (R2=1), axial pressure with an RMSE of 0.0564 bar (R2=0.99), and temperature with an RMSE of 0.0265 °C (R2=1). At the time of writing, there is no commercially available instrument that can perform these measurements simultaneously.
- Article
(1440 KB) - Full-text XML
- BibTeX
- EndNote


In the past several decades, it has been known that the dispersion effects of thermo-optic and of opto-elastic phenomena can be utilized to discriminate between temperature- and strain-induced changes in the Bragg wavelength of fiber Bragg gratings (FBGs). FBGs utilize reflecting elements that produce interference patterns in the reflected and transmitted optical spectrum of an optical signal. The interference phase shifts when there is a change in the distance between the reflecting elements or in the refraction conditions. This phase alteration can be attributed to external forces or temperature changes. The two most prevalent instruments based on this principle are the FBG and the Fabry–Pérot interferometer (FPI). In 1994, Xu et al. (1994) demonstrated the feasibility of simultaneous strain and temperature measurement using two superimposed FBGs with Bragg wavelengths of 850 and 1300 nm, respectively. Another approach, presented in 1997, involved combining an FBG and FPI to form an FBGFPI (Du et al., 1999). In this approach, Du et al. (1999) fabricated a fiber with two 2 mm long highly reflective FBGs separated by a 1 mm grating-free zone, which was sheathed in an aluminum tube. The basic concept of generating an in-fiber FPI by multiplexing identical FBGs had already been reported by Morey et al. (1991). They manufactured two highly reflective 95.5 % FBGs separated by 10 cm to generate 53 fringes with a finesse of 67 in the grating bandpass. Wada et al. (2009, 2012) utilized this principle of a fiber Bragg grating Fabry–Pérot interferometer (FBGFPI, also denoted as an in-fiber Fabry–Pérot interferometer) for highly sensitive vibration sensing.
In addition, superstructures can be utilized to discriminate between force and temperature sensors (Patrick et al., 1996; Guan et al., 2000), which are substantially easier to manufacture, as they only require the inscription of gratings without any post-processing steps. The principles of superstructure fiber Bragg gratings (SFBGs) can also be applied to measure bending and strain simultaneously, as reported by Gwandu et al. (2002). They demonstrated the different effects of bending and strain on the transmission properties of an SFBG. In their temperature-compensated setup, they were able to measure bending curvatures of <0.41 m. Moreover, Wang et al. (2014) demonstrated that this approach can also be used for measuring temperature and bending simultaneously. Efficient methodologies for the characterization and design of SFBGs have also been reported in the literature (Liu, 2008; Sengupta and Ghorai, 2015). A recurring theme in these methodologies is the focus on the wavelength with the highest intensity in the reflected or transmitted optical spectrum and the discrimination of changes in the measurand predominantly via alterations in this peak wavelength. Additionally, only two physical quantities were assessed concurrently, necessitating that the third be either known or compensated for.
In this paper, we present an extensive study on four sensors based on multiple FBGs embedded in single-mode fiber (SMF) designed for the simultaneous measurement of bending curvature, axial pressure, and temperature. By modifying the geometric parameters, specifically the core diameter and cladding-to-coating ratios, we substantially increased both the sensors' pressure and bending curvature sensitivity, as well as their mechanical durability. Unlike conventional approaches, we not only harnessed the phase information of the optical spectrum but also exploited additional features within the spectrum through machine learning (ML) techniques to maximize the information capture. Additionally, we integrated an FBGFPI into our design to enhance the information density of the optical sensor signal. This augmentation led to a richer set of signal features, ultimately boosting the overall sensor performance and underscoring the potential of superior sensing capabilities.
FBGs are renowned in the field of optics for their distinct capacity to selectively reflect and transmit light at specified wavelengths. Through a process of coherent reflections, specific wavelengths are selectively reflected (Xie et al., 1993). This selective property is meticulously defined during the fabrication process through precise manipulation of grating parameters. The mechanism of selective reflection in FBGs is facilitated by the introduction of several periodic alterations of the refractive index within the core of a SMF that collectively contribute to the selective reflection of certain wavelengths. The distance of the periodic modifications is denoted as the pitch Λ. The wavelength that is reflected, designated as the Bragg wavelength (λB), is intrinsically dependent on two factors, the effective refractive index (neff) and the grating pitch (Λ):
Temperature changes or pressure changes (ΔT or ΔP, respectively) that act on the FBG significantly affect the neff and Λ of the grating, resulting in shifts in the λB (Kashyap, 2010; Fang et al., 2012):
From Eq. (2), it is evident that pressure-induced wavelength shifts are due to changes in both the refractive index (n) and grating pitch (Λ). Factors such as the Young's modulus (E), the material's Poisson's ratio (ν), and the photo-elastic coefficients (p11 and p12) contribute to the grating's pressure sensitivity. Additionally, the thermo-optic coefficient ξ, which comprises the thermal expansion coefficient αΛ(T) and the thermal photo coefficient αn(T), predominantly influences the temperature sensitivity of the FBG. Considering that the ratio between αΛ(T) and αn(T) varies from 0.047 to 0.06, the Bragg wavelength changes due to temperature fluctuations primarily stem from the effects on the refractive index, with less than 7 % attributed to the grating's thermal expansion. It can be inferred that temperature-induced alterations in the reflection properties of the FBG depend mainly on the waveguide material and are not influenced by dispersion.
An FBGFPI is created by placing two, in most cases highly reflective, FBGs at a distance LFP from each other. Depending on LFP, a specific range of wavelengths within the FBG's reflection band will be transmitted by the FPI (Reider, 2012; Marburger and Felber, 1978; Barmenkov et al., 2006). Generally, an FBGFPI functions as a filter, creating pass bands and reflection bands for particular wavelengths. The quantity of pass bands is calculated using the effective refractive index (neff), the bandwidth of the reflection band (ΔλFBG), the examined wavelength (λ) in free space, and the separation distance (LFP) as follows (Fang et al., 2012):
Figure 1 depicts the schematic representation of an FBGFPI and an FBG, along with the corresponding reflected optical spectrum for both grating types.
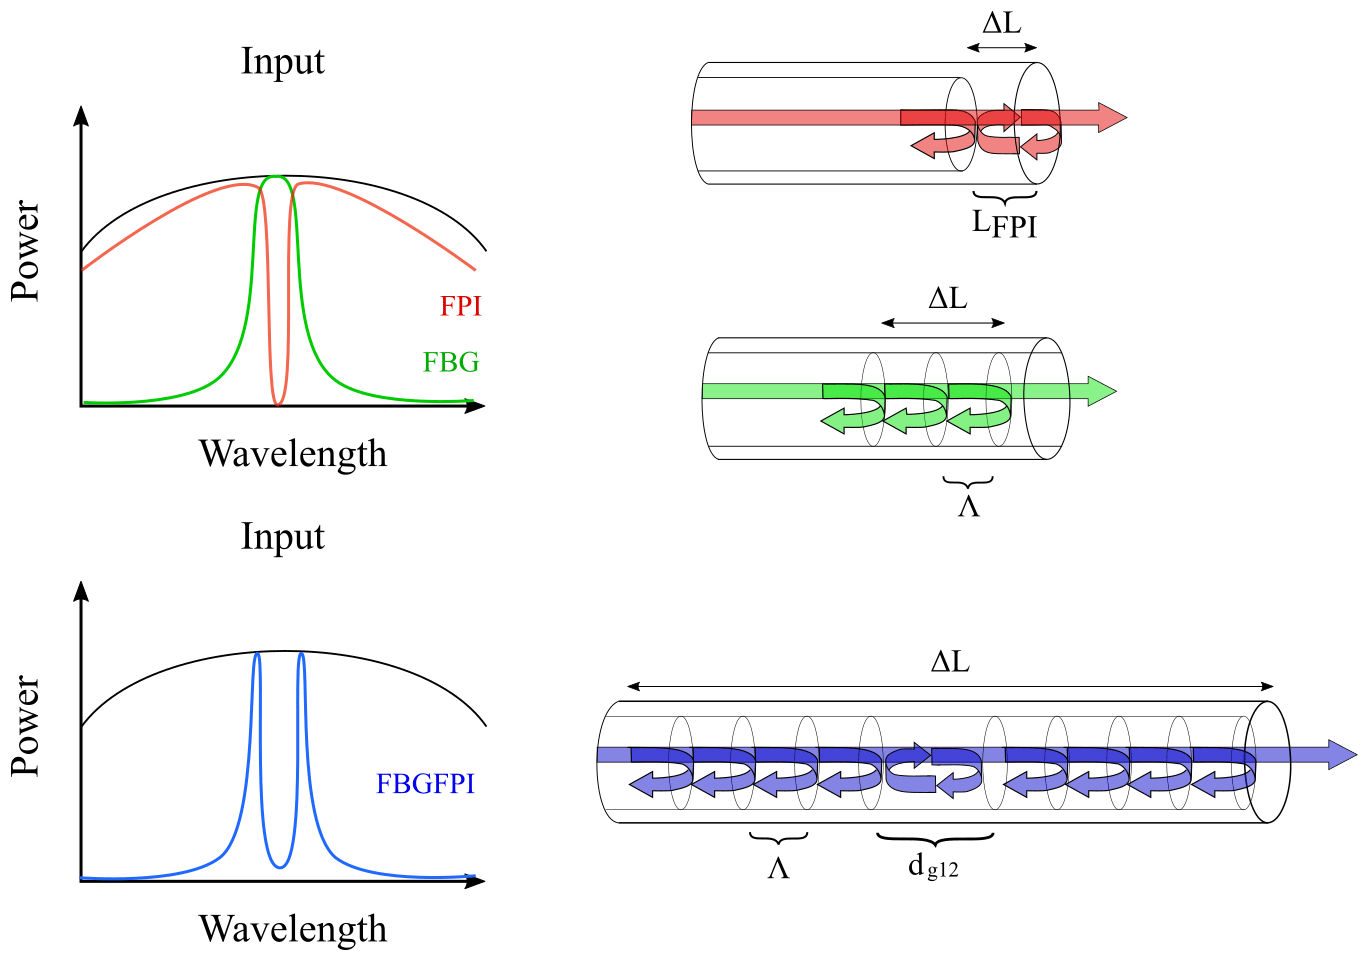
Figure 1Depiction of the dependence of reflected wavelengths for a fiber Bragg grating (FBG, green), a Fabry–Pérot interferometer (FPI, red), and a fiber Bragg grating Fabry–Pérot interferometer (FBGFPI, blue) on the intensity of the broadband light source (black), with the FPI cavity length being an odd integer multiple of the spatial period Λ.
The Fabry–Pérot cavity length (LFP) is composed of the effective length of the gratings (Leff.g1 and Leff.g2) and the separation between the gratings (dg12):
The actual effective grating length may be described as a function of the physical length (Lg) and the reflectivity (R) of the grating:
The transmission intensity (T) can be calculated with following equation:
In this study, we designed and fabricated four distinct fiber-optic sensors, labeled S1 through S4. Each single-mode optic fiber, manufactured by FiberCore GmbH in Germany, features a fused silica core with a refractive index of 1.459. The cladding has a refractive index of 1.445. The fibers' core and cladding exhibit a Young modulus of 72.4 GPa, a Poisson ratio of 0.17, and a thermal expansion coefficient of K−1. Attenuation across all fibers is measured to be less than 0.7 dB km−1 at 1550 nm using a YOKOGAWA AQ6370D optical spectrum analyzer (OSA) under ambient conditions.
Among them, three sensors utilize two individual FBGs. The fourth sensor utilizes two FBGs with the same λB separated by only 0.5 mm as well as constituting an FBGFPI and two regular single FBGs. Data acquisition was performed using a measurement setup developed in our previous work (Shojaei Khatouni et al., 2020, 2023), as depicted schematically in Fig. 2.
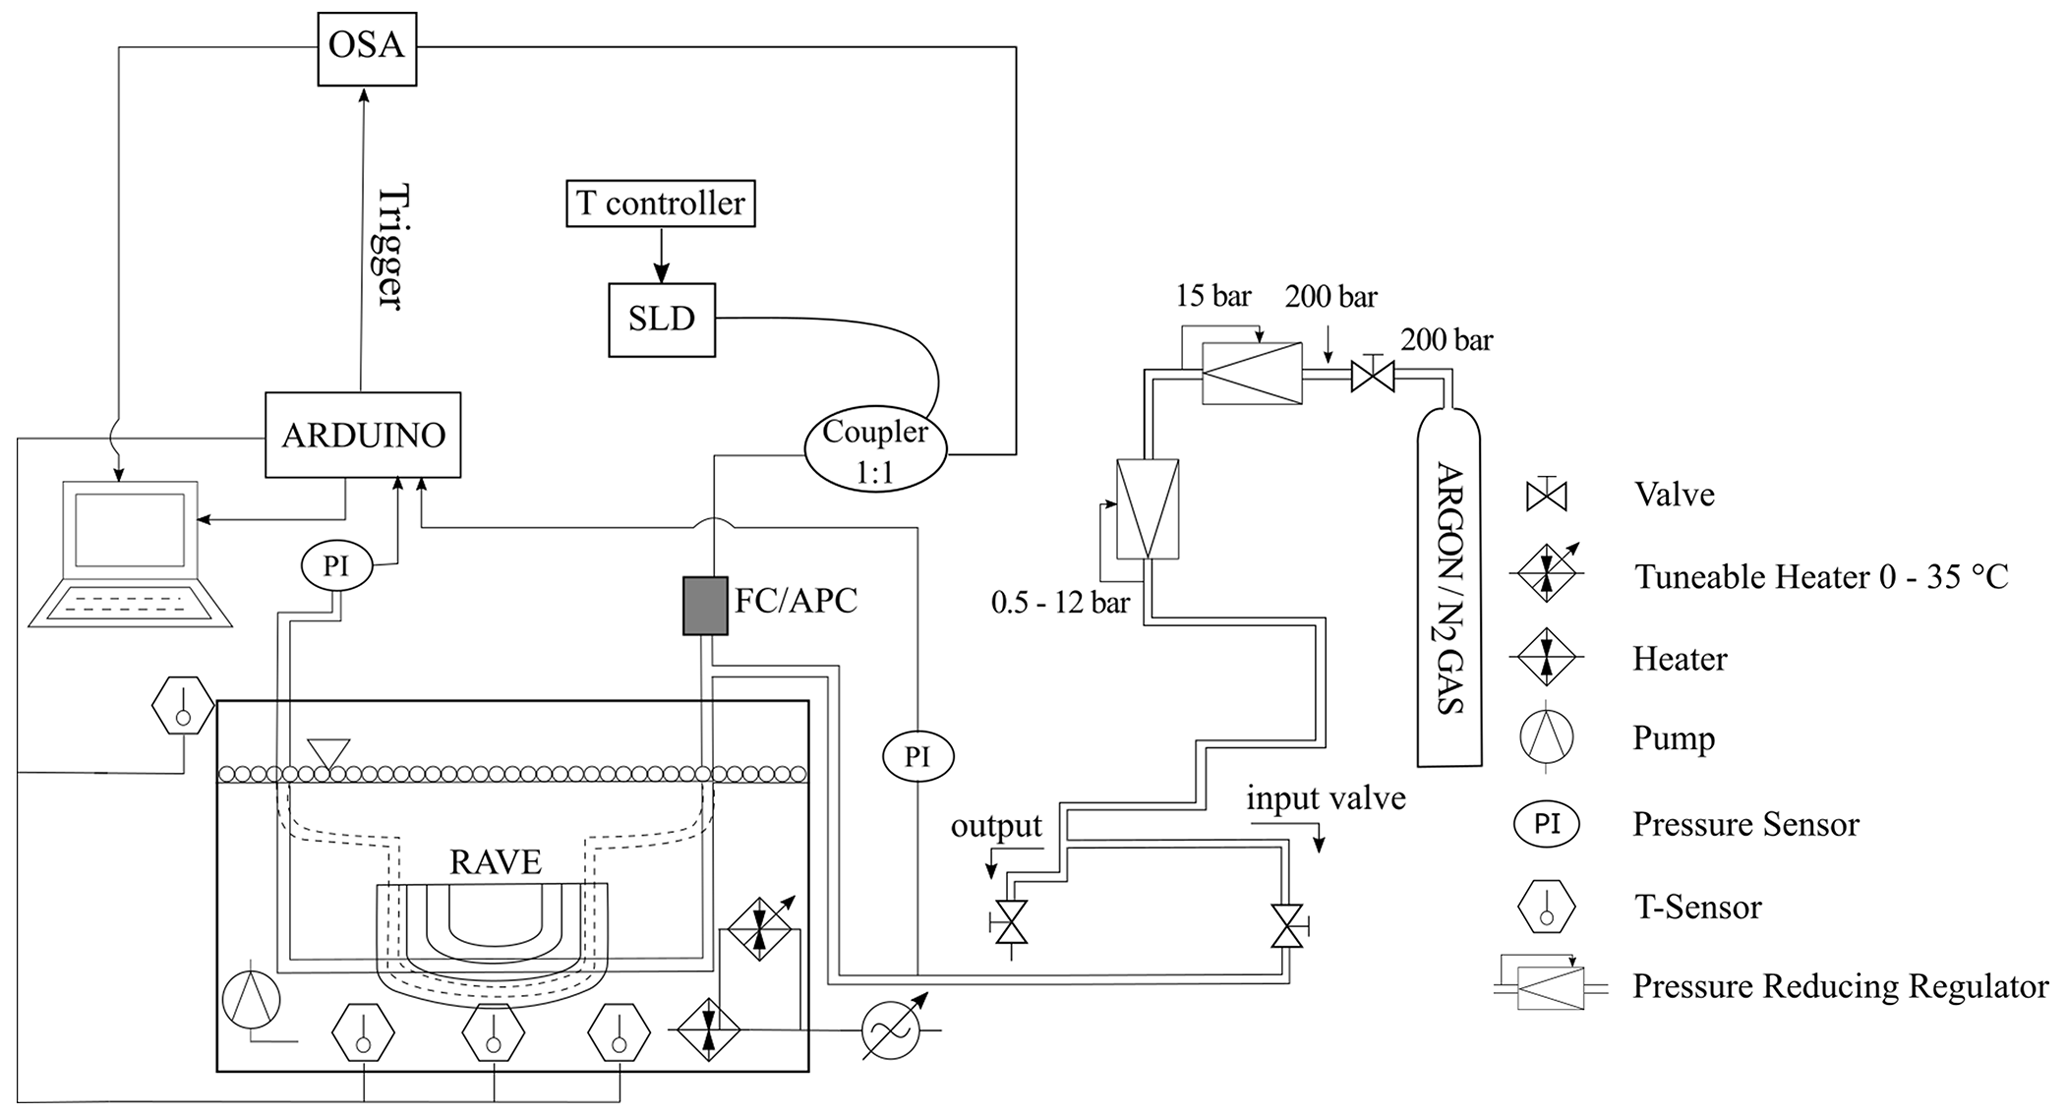
Figure 2Measurement setup scheme, following Shojaei Khatouni et al. (2023), showing a fiber-optic connector with angled physical contact (FC/APC), an optical spectrum analyzer (OSA), a pressure gauge (PI), a superluminescent diode (SLD), and a variable radius clamping device (RAVE).
In this setup, the main sensor is packaged in a flexible polyurethane tube that can be pressurized. The tube is partially filled with water to decouple pressure-related temperature fluctuations from the sensor element. Subsequently, the tube is immersed in a water basin (70 L) that is thermally isolated with a 50 mm thick polyurethane foam. The water surface is covered with air-filled 40 mm diameter polypropylene balls. Using these methods, the energy loss across the walls and curtailed vaporization at the air–water interface was minimized substantially. This led to a maximum hourly temperature decrease of ≤0.2 °C, a temperature differential of 15 °C between the water temperature and the ambient temperature, and no additional active temperature stabilization. The measurements were conducted under controlled temperature and pressure conditions, and the sensing elements were additionally subjected to specific bending curvatures of 0, 0.0227, 0.0294, 0.0416, and 0.0714 L mm−1. An optical spectrum analyzer (ID OSA from ID Photonics GmbH, Germany), operating at 1530–1565 nm, was employed to detect the reflected optical spectrum. A superluminescent diode (S5FC1005S-SM Benchtop SLD Source, Thorlabs GmbH, Germany) functioned as the light source, emitting spontaneous C-band radiation. The pressure and temperature are assessed using two resistive strain gauge pressure sensors (A-10-3-BG416-HD1Z-KA-M4Z-ZW, WIKA GmbH, Germany, 0.25 % and 0.5 % nonlinearity) and four temperature reference sensors (TSIC506-TO92, B+B Thermo-Technik GmbH, Germany, accuracy and precision of 0.1 °C). Three temperature reference sensors were placed less than 1 cm from the main sensor to ensure water temperature homogeneity and measurement accuracy. Valid measurements required agreement between at least two of these three sensors, with deviations prompting data exclusion. Notably, consensus among all three sensors was typically observed. A fourth sensor was employed to track ambient temperature, assessing its potential impact on the interrogation device and light source. An Arduino UNO single-board microcontroller served as the platform to initiate OSA measurements and simultaneously record temperature and pressure sensor values.
Throughout the experiment, curvature, pressure, and temperature were altered. Temperature was modified between 35 and 39 °C in 0.1 °C intervals, while pressure was altered within a range of 0 to 10 bar in increments of 0.01 bar, which in combination with the bending mentioned above, yielded a total of 20 705 unique parameter pairings.
For sensors S1–S4, measurements were systematically collected in small batches, with at least three measurements for each parameter combination. Subsequent to outlier removal, datasets retaining at least two measurements per point were incorporated. Notably, after attaining this threshold, expanding the dataset did not further decrease errors. Given this and the potential for bias in selective data elimination, all remaining data points were retained for analysis. This approach resulted in a total of 58 791 samples for sensor S1, 71 387 samples for S2, 74 832 samples for S3, and 56 802 samples for S4.
For evaluation, an ensemble of decision trees was used. The datasets were bootstrap-aggregated with a minimum of 100 learners and a leaf size of 4. This model was determined to be the best-performing decision tree model in a preliminary study (Shojaei Khatouni et al., 2023).
For the purpose of conducting comparative analyses across the sensors and assessing sensor performance, four distinct metrics were calculated: the five-fold cross-validated root-mean-square error (RMSE), the mean square error (MSE), the mean absolute error (MAE), and the R-squared (R2) value. These parameters were chosen over traditional resolution and precision, as they offer a comparable quantification of prediction discrepancies in continuous output domains of ML models. The RMSE is frequently referred to as standard error. Given the actual value y and its mean , the predictions , and the N predictions, the metrics can be calculated as outlined in the following:
To derive the five-fold cross-validated RMSE, the datasets are split into five subsets, with four being utilized for training and one for validation; this process is iterated five times. The five-fold cross-validated RMSE is solely used through this paper and is denoted as RMSE.
The R-squared value of a model indicates the proportion of variance accounted for by the model. Theoretically, a model with an R-squared value of 1 captures 100 % of the variance in the actual data. Thus, the combination of the RMSE and R-squared values enables the evaluation of a model's statistical robustness and performance. As hydrostatic pressure is applied to uniformly load the sensors, the pressure values were transformed into a corresponding axial load.
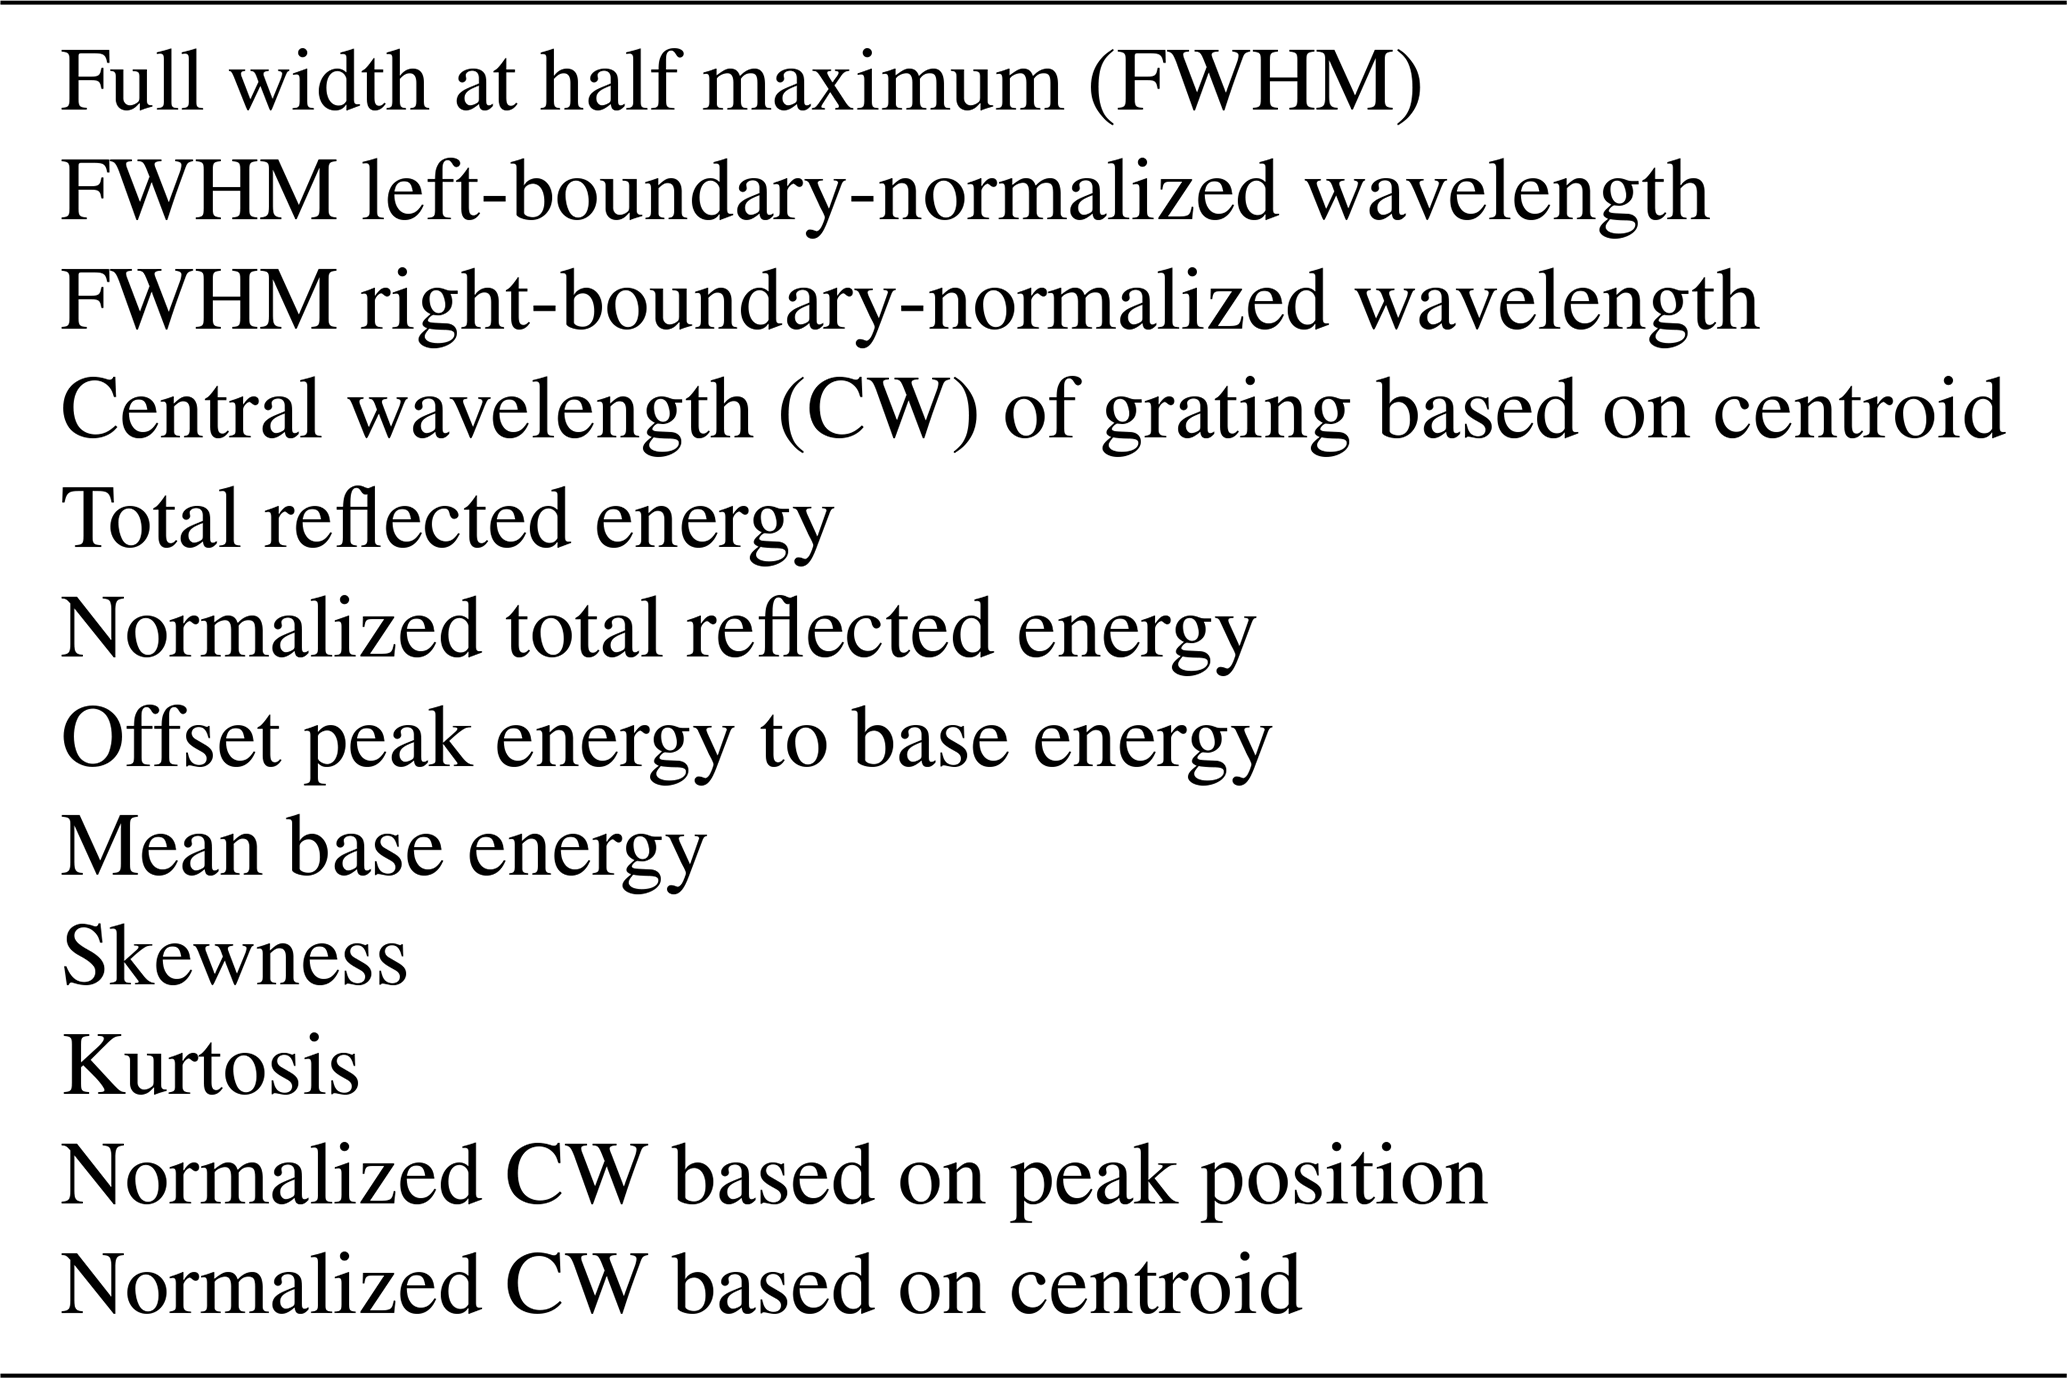
The collection of spectrum properties (features) selected to train the ML models was determined with respect to the signal alterations due to variations in pressure, temperature, and bending curvature. Changes in pressure and temperature primarily result in Bragg-wavelength shifts, while bending affects the Bragg wavelength, the signal morphology, and the signal energy (Reekie et al., 1994; Wang et al., 2014). It should be emphasized that the peak consists of multiple sub-peaks in the FBGFPI, yielding an expanded set of features. Moreover, in the FBGFPI, the relationship between all the FBG and FBGFPI signals, such as the difference between individual central wavelengths (CWs), is taken into account to enhance the model's accuracy, yielding 26 extra features. Ultimately, addressing drift phenomena correlated with the measurement equipment, which may otherwise introduce inaccuracies, is accomplished by incorporating noise energy, mean noise, and room temperature as distinct features. As in our previous work (Shojaei Khatouni et al., 2023), the features for each peak are chosen as delineated in Table 1.
In total, four sensors, named S1, S2, S3, and S4, have been developed. The sensors are based on SMFs made of silicon dioxide with embedded FBGs. They were designed with different parameters with respect to fiber type and to dimension and grating properties, as shown for S1 in Fig. 3. All of the sensor parameters after fabrication are listed in Table 2.
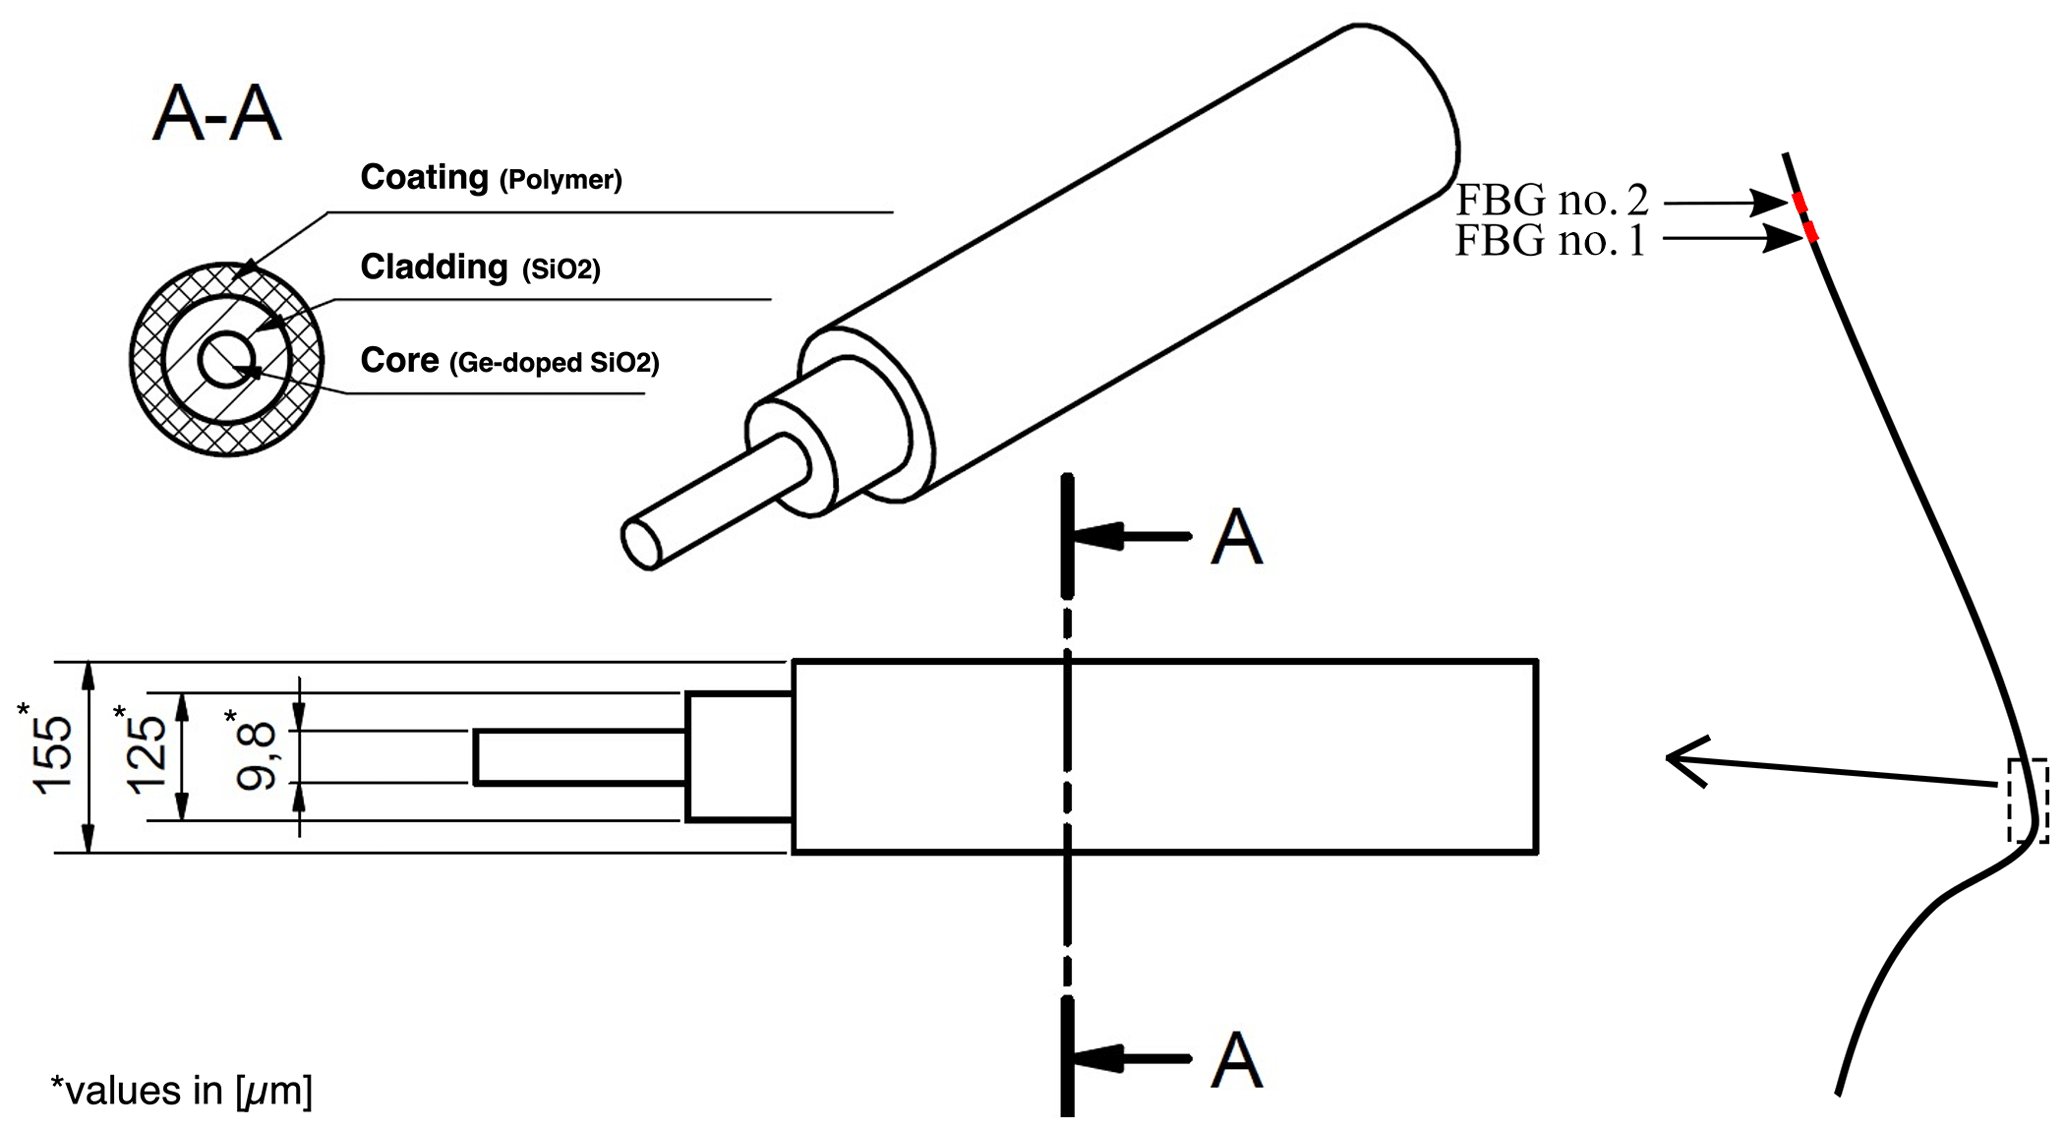
Figure 3Sensor S1 is shown on the right side with the position of FBG no. 1 and FBG no. 2 with respect to the fiber tip. Additionally, the dimensions of sensor S1 are shown as well as a cross-section A–A, magnified from a fiber portion shown on the right side. While the core, cladding, and coating dimensions vary between sensors S2 and S4, the schematic representation remains consistent.
Table 2FBG and FBGFPI sensor properties: the location of the grating from the tip of the fiber (x), the spatial dimension of the grating (l), the reflectivity of the grating (R), the center wavelength (λ), the bandwidth of the reflected peak (3 dB), and the signal-to-noise ratio (SNR).

Sensors S1, S2, and S3 are based on two single FBG gratings located 30 mm apart. The CWs of the FBGs were set to be at 1550 and 1560 nm. The core diameter of S2 is decreased by ≈ 9 % compared with S1, making S2 more sensitive to bending. In addition, both S1 and S2 share identical coating and cladding specifications, utilizing a polyimide material for the coating. This polyimide possesses a Young modulus of 3.1 GPa and a Poisson ratio of 0.37. From a mechanical perspective, the core and cladding can be considered a singular solid entity. Therefore, apart from manufacturing tolerances, S1 and S2 can be considered mechanically equivalent. These sensors are designed to assess the influence of the core diameter on the sensor's overall performance while maintaining consistent mechanical properties. Sensor S3 is designed using a fiber that has a decreased cladding diameter of di=80 µm. Owing to manufacturing limitations that only allow for certain material and dimension combinations, the fiber's outer diameter was adjusted to do=170 µm, and the coating material was transitioned to acrylate. Acrylate has a Young modulus of 2.7 GPa and is, therefore, 13 % less stiff than polyimide, which increases the pressure sensitivity. As thermal expansion contributes less than 7 % to the thermal sensitivity of the sensor, the difference in the thermal expansion coefficient between polyimide, which K−1, and that of acrylate, which is 7– K−1, is not significant for the temperature sensitivity (Biswas, 1992; Elsner et al., 1990; Domininghaus et al., 1993). The impact of the ratio between the cladding and coating diameter and the less-stiff coating is to be investigated with sensor S3. The reflected spectrum of S1 (representative of S2 and S3) is illustrated in Fig. 4.
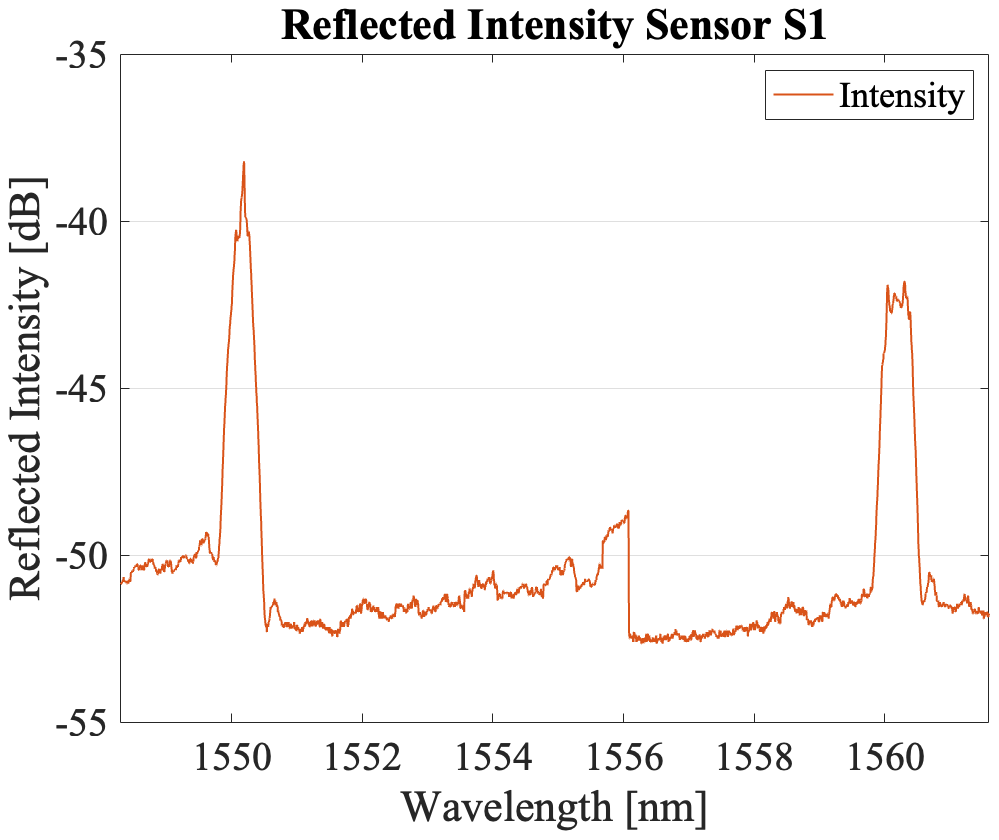
Figure 4The reflected optical intensity of sensor S1: 0 mm−1 curvature and 0 bar relative pressure at 35 °C.
Sensor S4 is fabricated using the same fiber as in S3. Therefore, apart from manufacturing tolerances, S3 and S4 can also be considered mechanically equivalent here. In S4, there are two pooled 1535 nm FBGs that are located at a specific distance (LFP=7.99 mm) from each other to form an SFBG, in particular, an FBGFPI, and two additional FBGs at 1550 and 1560 nm. Despite S4 incorporating an SFBG (specifically, an FBGFPI), the foundational sensing mechanism for all four sensors is consistently based on multiple in-fiber FBGs. The reflection of the combined FBGs is configured to be R=45 % for the first grating and R=75 % for the second grating. Using this approach, the peak at 1535 nm is divided into six sub-peaks, introducing more signal features compared with S1–S3 and thereby increasing the information density in the signal. Furthermore, the CWs (1535, 1550, and 1560 nm) of the gratings of sensor S4 are set to cover the majority of the optical C-band, in order to use dispersion-related differences in the sensor signal. In Fig. 5, the reflected optical spectrum of S4 is depicted.
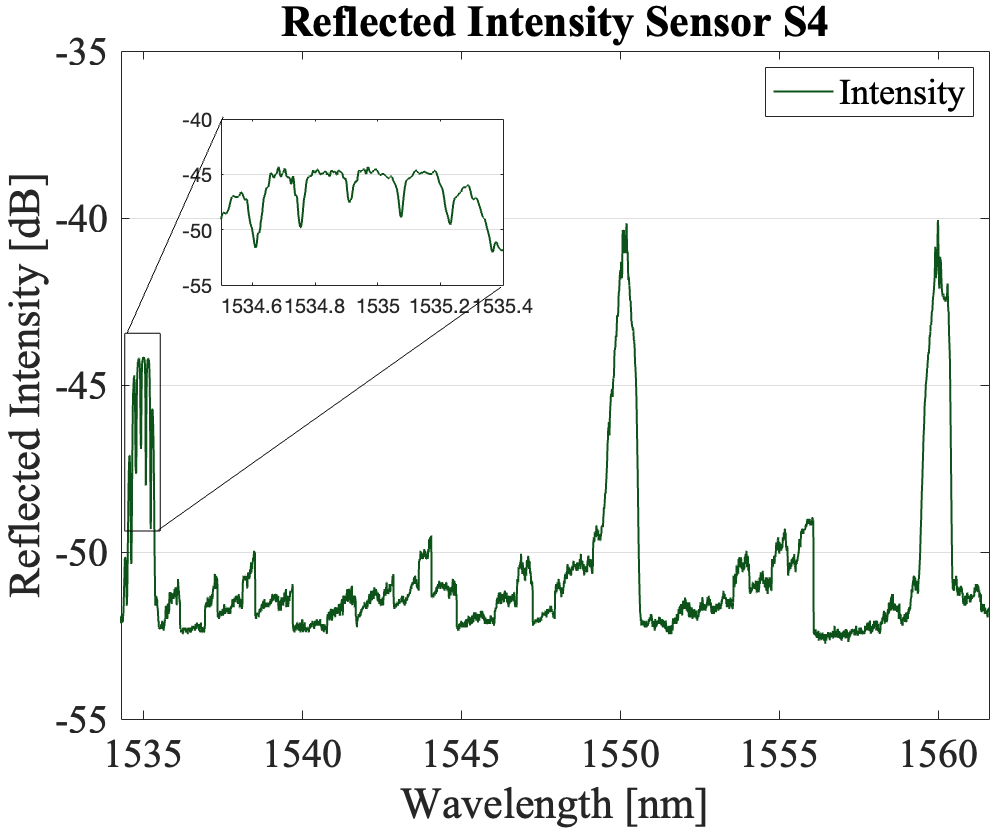
Figure 5The reflected optical intensity of sensor S4: 0 mm−1 curvature and 0 bar relative pressure at 35 °C.
The performance of all four sensors with respect to curvature, temperature, and axial pressure prediction are shown in Table 3.
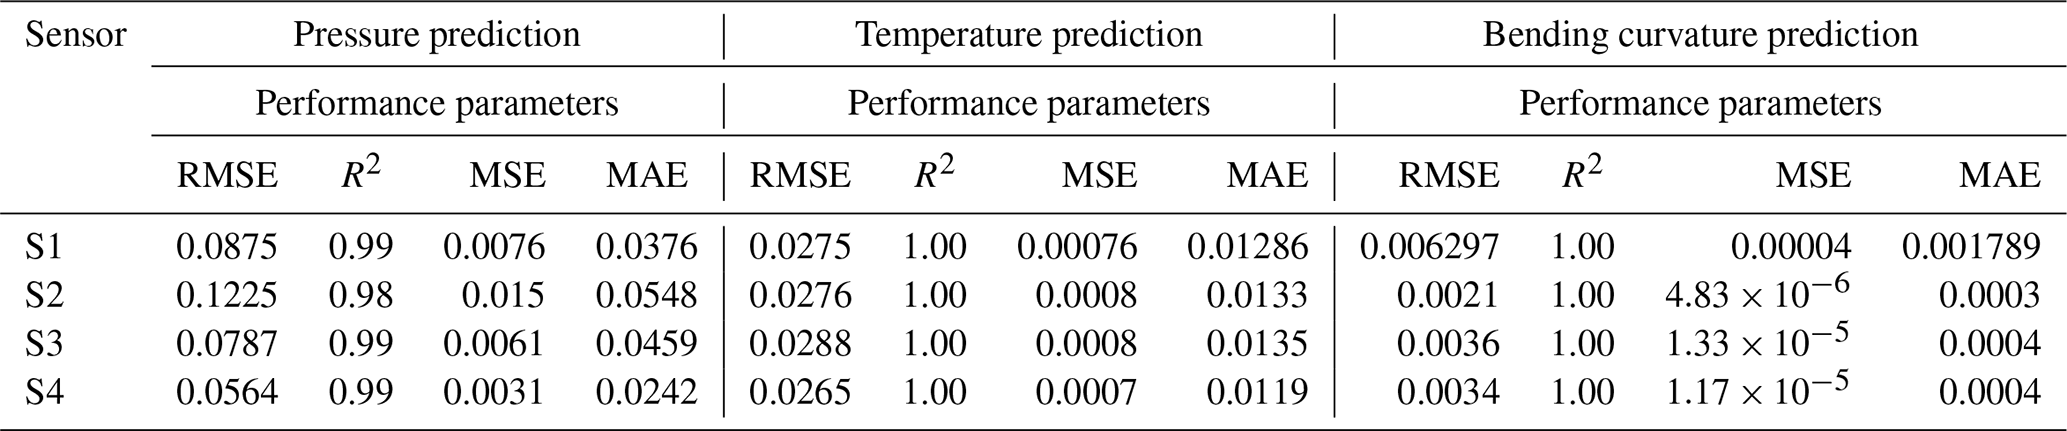
The assessment of the obtained results from sensors S1 and S2 indicate that the temperature prediction error is lower than the precision of the measurement equipment used for measurements. With an RMSE of 0.0275 °C, sensor S1 demonstrates slightly higher accuracy than S2 (RMSE of 0.0276 °C). Regarding pressure prediction, sensor S1 achieves an RMSE of 0.0875 bar (R2=0.99) and, therefore, a substantially better result than sensor S2 with a pressure RMSE of 0.1225 bar (R2=0.98), which corresponds to an error decrease of ≈ 29 %. This observation can be attributed to a higher signal-to-noise ratio, which results due to the ≈ 10 % larger core diameter of S1. Concerning bending curvature prediction, however, sensor S2 attains, as expected, substantially better results. With an RMSE of 0.0021 L mm−1, the prediction error of sensor S2 is ≈ 67 % lower than that of S1 (RMSE of 0.006297 L mm−1). This difference can be attributed to the bending sensitivity of S2.
Assessing the pressure prediction error achieved by sensor S3 indicates that using an acrylate fiber and increasing the ratio of the cladding and coating diameter does improve the pressure sensitivity substantially. Although, the core diameter of sensor S3 has been decreased by ≈ 35 % compared with S1, which decreases the signal-to-noise ratio, the pressure prediction error of sensor S3 (RMSE =0.0787 bar, R2=0.99) decreased by ≈ 10 % compared with sensor S1 (RMSE =0.0875, R2=0.99). In terms of temperature prediction, the RMSE achieved by S3 is 0.0288 °C, compared with 0.0275 °C for S1 and 0.0276 °C for S2, all of which are far below the accuracy of the reference temperature sensor (0.1 °C). Factors such as slight temperature and pressure deviations, which were below the resolution of the reference sensors, could be the sources of these deviations. With respect to bending curvature prediction, the prediction error of sensors S3 (RMSE =0.0036 L mm−1) decreased by over ≈ 43 % compared with sensor S1 (RMSE =0.006297 L mm−1). Due to the abovementioned constraints, we could not quantitatively attribute performance improvements for S1 and S2 compared with S3 to fiber diameter reductions versus material alterations.
Regarding pressure and temperature prediction, sensor S4 achieved the overall best results. With an RMSE of 0.0564 bar compared with sensor S3, the pressure prediction error decreased by ≈ 35 %. This can be attributed to the added FBGFPI, which provides more signal features that are relevant to pressure and temperature prediction. Additionally, incorporating spectral spacing between the FBGs, as suggested in the literature, enabled the utilization of dispersion effects in S3, which contributed to its improved performance. With respect to bending curvature prediction, sensor S4 has an RMSE of 0.0034 L mm−1 compared with an RMSE of 0.0034 L mm−1 for S3.
The primary limitation is the inability to quantitatively delineate the performance contributions between fiber diameter reductions and material alterations, due to manufacturer constraints on available combinations. Several other limitations in this study may affect the performance of the developed sensors in a negative way. The measurement setup includes temperature and pressure sensors with accuracies of 0.1 °C and 0.25 bar, respectively, potentially not fully showcasing the sensors' capabilities. The use of a low-power superluminescent diode light source and portable OSA yielded a modest SNR of nearly 13 dB, necessitating signal filtering, which notably impacted the off-center peaks. The OSA's update rate of one sweep per second constrains the live prediction capability.
Additionally, fiber-optic connectors with angled physical contact, which optimize transmission power, are easily broken and are suitable mostly for in-laboratory use. The employment of alternative connectors could significantly degrade sensor performance.
This study presents four single-mode silicon dioxide fiber-based sensors with cascaded-FBG variations. Using originally phase-based measurement principles, the sensors were fabricated in four different variations with respect to grating constellation and materials to assess the impact on the sensor performance for simultaneous measurement of pressure, temperature, and bending curvature.
It has been shown that a wavelength-division multiplexing (WDM) of two FBGs in a SMF with a core diameter of 6.4 µm, a cladding outer diameter of 80 µm, and a coating outer diameter of 170 µm as well as an acrylate coating was suited best to detect pressure (RMSE of 0.0564 bar, R2=0.99), temperature (RMSE of 0.02650 °C, R2=1), and bending curvature (RMSE of 0.0034 L mm−1, R2=1). This is attributed to the high cladding-to-coating ratio, a less stiff coating, using the entire C-band for spectral positioning of the FBGs, and introducing an FBGFPI via the combination of two FBGs.
The methodology presented enables the simultaneous determination of bending curvature, temperature, and axial pressure in fiber-optic sensors. Within this novel methodology, previously uncharted in the literature, we employ carefully optimized sensing elements (FBGs and FBGFPIs) to achieve an enhanced information density in sensor signals. By integrating ML, we effectively utilize this dense information, capturing details that might elude conventional techniques.
This research also showcases the adept use of traditional ML techniques, in particular an ensemble of decision trees, in examining the optical spectrum of multiple fiber Bragg grating Fabry–Pérot interferometer-based sensors within a SMF.
The software used in this work was MATLAB, which is publicly available at https://www.mathworks.com (The MathWorks Inc., 2022). In addition, custom code that was specifically designed for the setup was used; however, this code cannot be published, as the software is currently being patented.
Unfortunately, the datasets cannot be accessed due to the ongoing patenting process.
SSK and RHV built the measurement setup; SSK, SZ, RHV, and JCEE performed the measurements; SSK, MM, and AA developed machine learning models for evaluation; SSK, MM, and AA analyzed the data; SSK and SZ wrote the manuscript draft; and HKT reviewed and edited the manuscript.
The contact author has declared that none of the authors has any competing interests.
Publisher’s note: Copernicus Publications remains neutral with regard to jurisdictional claims made in the text, published maps, institutional affiliations, or any other geographical representation in this paper. While Copernicus Publications makes every effort to include appropriate place names, the final responsibility lies with the authors.
We gratefully acknowledge the generous funding and support provided by Hamburg Innovation GmbH, the Bundesministerium für Bildung und Forschung, and the Avicenna Studienwerk e.V. Their collective contributions were instrumental to this research.
This paper was edited by Michael Kraft and reviewed by two anonymous referees.
Barmenkov, Y. O., Zalvidea, D., Torres-Peiró, S., Cruz, J. L., and Andrés, M. V.: Effective length of short Fabry-Perot cavity formed by uniform fiber Bragg gratings, Opt. Express, 14, 6394–6399, https://doi.org/10.1364/OE.14.006394, 2006.
Biswas, D. R.: Optical fiber coatings for biomedical applications, Opt. Eng., 31, 1400, https://doi.org/10.1117/12.57701, 1992.
Domininghaus, H., Haim, J., and Hyatt, D.: Plastics for engineers: materials, properties, applications, edited by: Domininghaus, H., Hanser Publishers, Munich, ISBN-10: 3446157239, 1993.
Du, W.-C., Tao, X.-M., and Tam, H.-Y.: Fiber Bragg grating cavity sensor for simultaneous measurement of strain and temperature, IEEE Photonic. Tech. L., 105–107, https://doi.org/10.1109/68.736409, 1999.
Elsner, G., Kempf, J., Bartha, J. W., and Wagner, H. H.: Anisotropy of thermal expansion of thin polyimide films, Thin Solid Films, 185, 189–197, https://doi.org/10.1016/0040-6090(90)90018-9, 1990.
Fang, Z., Chin, K. K., Qu, R., and Cai, H.: Fundamentals of Optical Fiber Sensors, Wiley, https://doi.org/10.1002/9781118381717, 2012.
Guan, B.-O., Tam, H.-Y., Tao, X.-M., and Dong, X.-Y.: Simultaneous strain and temperature measurement using a superstructure fiber Bragg grating, IEEE Photonic. Tech. L., 12, 675–677, https://doi.org/10.1109/68.849081, 2000.
Gwandu, B. A. L., Shu, X. W., Liu, Y., Zhang, W., Zhang, L., and Bennion, I.: Simultaneous measurement of strain and curvature using superstructure fibre Bragg gratings, Sensor. Actuat. A-Phys., 96, 133–139, https://doi.org/10.1016/S0924-4247(01)00782-8, 2002.
Kashyap, R.: Fiber Bragg Gratings, 2nd edn., Elsevier, Amsterdam, 1–12, https://doi.org/10.1016/C2009-0-16830-7, 2010.
Liu, X.: Design of superstructure fiber Bragg gratings with a Fourier analysis technique and its applications to multiple ultranarrow transmission gratings, Opt. Eng., 47, 115001, https://doi.org/10.1117/1.3006090, 2008.
Marburger, J. H. and Felber, F. S.: Theory of a lossless nonlinear Fabry-Perot interferometer, Phys. Rev. A, 17, 335–342, https://doi.org/10.1103/PhysRevA.17.335, 1978.
Morey, W. W., Dunphy, J. R., and Meltz, G.: Multiplexing fiber bragg grating sensors, Fiber Integrated Opt., 10, 351–360, https://doi.org/10.1080/01468039108201715, 1991.
Patrick, H. J., Williams, G. M., Kersey, A. D., Pedrazzani, J. R., and Vengsarkar, A. M.: Hybrid fiber Bragg grating/long period fiber grating sensor for strain/temperature discrimination, IEEE Photonic. Tech. L., 8, 1223–1225, https://doi.org/10.1109/68.531843, 1996.
Reider, G. A.: Photonik, Springer Vienna, Vienna, 448 pp., https://doi.org/10.1007/978-3-7091-1521-3, 2012.
Sengupta, S. and Ghorai, S. K.: An efficient method for determining transmission characteristics of superstructure fiber Bragg grating and its use for multiparameter sensing, Opt. Fiber Technol., 21, 146–153, https://doi.org/10.1016/j.yofte.2014.11.009, 2015.
Shojaei Khatouni, S., Ewald, J. C. E., and Trieu, H. K.: Application of Machine Learning Algorithms for the Analysis of an Optical Fiber Sensor for Use in Endovascular Coiling of Intracranial Aneurysms, SMSI 2020 – Measurement Science, 273–274, https://doi.org/10.5162/SMSI2020/D2.5, 2020.
Shojaei Khatouni, S., Zakowski, S., Hosseini-Vedad, R., Askar, A., and Trieu, H. K.: Discriminating Temperature, Strain, and Bending Effects in Fiber Bragg Grating Fabry- Perot Interferometer Sensors Using Traditional Machine Learning Techniques, TechRxiv [preprint], https://doi.org/10.36227/techrxiv.22644031.v1, 2023.
The MathWorks Inc.: Optimization Toolbox version: MATLAB_R2020a, The MathWorks Inc., Natick, Massachusetts, https://www.mathworks.com, last access: 21 December 2022.
Wada, A., Tanaka, S., and Takahashi, N.: High-sensitivity vibration sensing using in-fiber Fabry-Perot interferometer with fiber-Bragg-grating reflectors, in: Proc. SPIE 7503, 20th International Conference on Optical Fibre Sensors, Edinburgh, United Kingdom, 5–9 October 2009, 75033L, https://doi.org/10.1117/12.834166, 2009.
Wada, A., Tanaka, S., and Takahashi, N.: Optical Fiber Vibration Sensor Using FBG Fabry–Perot Interferometer With Wavelength Scanning and Fourier Analysis, IEEE Sens. J., 12, 225–229, https://doi.org/10.1109/JSEN.2011.2141984, 2012.
Wang, L., Zhang, W., Geng, P., Gao, S., Li, J., Bai, Z., Chen, L., Zhang, S., Liu, Y., and Yan, T.: Simultaneous directional bending and temperature measurement with overlapping long period grating and fiber Bragg grating structure, J. Opt.-UK, 16, 055401, https://doi.org/10.1088/2040-8978/16/5/055401, 2014.
Xie, W. X., Douay, M., Bernage, P., Niay, P., Bayon, J. F., and Georges, T.: Second order diffraction efficiency of Bragg gratings written within germanosilicate fibres, Opt. Commun., 101, 85–91, https://doi.org/10.1016/0030-4018(93)90328-3, 1993.
Xu, M. G., Archambault, J.-L., Reekie, L., and Dakin, J. P.: Discrimination between strain and temperature effects using dual-wavelength fibre grating sensors, Electron. Lett., 30, 1085–1087, https://doi.org/10.1049/el:19940746, 1994.