the Creative Commons Attribution 4.0 License.
the Creative Commons Attribution 4.0 License.
 | 15 May 2024
Concept for improving the form measurement results of aspheres and freeform surfaces in a tilted-wave interferometer
Ling Yang
Markus Schake
Ines Fortmeier
Accurate and flexible form measurements for aspherical and freeform surfaces are in high demand, and non-null-test interferometric methods such as tilted-wave interferometry have gained attention as a promising response to this need. Interferometric methods, however, display ambiguities between the measurement of certain form errors and the misalignment of the measured specimen. Therefore, improved knowledge of the absolute measurement position of the specimen in relation to the interferometer setup may improve the form measurement result. In this work, we propose a concept that uses a white light interferometer to measure the absolute distance between a transparent specimen's surface and the interferometer's objective and present preparatory data to qualify the white light interferometer for the improvement of tilted-wave interferometer measurements.
- Article
(3342 KB) - Full-text XML
- BibTeX
- EndNote


In recent decades, the demand for aspherical and freeform surfaces in optical applications has grown significantly because they allow the creation of tailor-made optical systems with very low optical aberration. Such systems enable new lightweight optical designs that meet the demanding requirements of high-end applications. Advances in this field have led to a large variety of optical designs for highly sophisticated applications in both research and industry (Henselmans et al., 2011; Woodard et al., 2015). However, the production of high-quality custom surfaces relies on the ability to measure these surfaces with great accuracy to ensure the required surface form, and existing measurement technology currently limits the degree of manufacturing accuracy that can be achieved. Due to the complexity of the surface form, their measurement poses a much larger challenge than the measurement of spherical or flat surfaces (Beutler, 2016), and reference surfaces with the desired low uncertainties of a few tens of nanometers' root mean square do not yet exist.
There is therefore a need for a traceable, highly accurate form measurement system with the capability of measuring aspherical and freeform surfaces with accuracies in the range of a few tens of nanometers. Such a metrological reference measurement system is currently being developed at Physikalisch-Technische Bundesanstalt based on a tilted-wave interferometer (TWI) (Fortmeier et al., 2022).
For aspheres and freeform surfaces, the uncertainty of the form measurement is dominated by the uncertainty of the spherical form error. This is shown in multiple measurement comparisons (Schachtschneider et al., 2018; Fortmeier et al., 2020) for both point-based and area-based measurement methods.
As one of the most accurate measurement methods, interferometry is a common choice for measuring optical surfaces. For complex forms, different interferometric approaches are available. For all these approaches, however, ambiguities between specimen misalignment and certain form errors exist (Gronle et al., 2022). Since the radius of the spherical part of a test wavefront depends on its propagation distance, a spherical form error of a specimen's surface would lead to the same measured data, as would a surface displacement along the test wavefront's propagation direction. This also applies to the TWI, which is promising as a flexible non-null-test method for asphere and freeform surface testing (Baer et al., 2014).
In order to reduce the spherical form measurement error of TWI measurements, additional information has to be supplemented. One approach is to improve the knowledge about the absolute position of the specimen within the interferometer setup (Fortmeier et al., 2016).
In this work, we propose a concept for improving the knowledge about the absolute measurement position of the specimen within the setup of a TWI. Our concept is based on the utilization of a white light interferometer (WLI) to measure the absolute distance between the transparent specimen and the last optical surface of the TWI's objective. We will examine the feasibility of this distance measurement method for this purpose based on a laboratory setup of a WLI, present initial distance measurement results of a workbench test setup, and discuss the requirements and steps for implementing the method into the TWI hardware and software.
The paper is structured as follows: in Sect. 2, the measurement principle of the TWI and the measurement task are described. The concept for an improved position measurement is presented in Sect. 3 together with the laboratory setup of the WLI. In Sect. 4, initial distance measurement results obtained using the laboratory setup of the WLI and a workbench test case are shown. Finally, Sect. 5 presents some conclusions as well as a brief outlook.
2.1 Measurement principle of the TWI
Form-measuring interferometry is among the most accurate yet fast methods for measuring optical surfaces and is therefore in large-scale use both in industry and research. However, unlike spherical or plane surfaces, strong aspherical or freeform surfaces cannot simply be compared to a flat or spherical reference wavefront in a null-test measurement because their surface slope might deviate strongly from the reference slope. This would lead to three main effects: retrace errors, vignetting, and sub-sampling effects. It would also make large portions of the specimen unresolvable with a standard form-measuring interferometer. In order to circumvent this problem, tilted-wave interferometry, which is one of the non-null-test methods, is a promising solution. Tilted-wave interferometry (see Fig. 1a) combines a special setup with model-based evaluation procedures. It uses a microlens array to produce multiple wavefronts that are tilted relative to each other to illuminate the surface under test (SUT). Depending on the local slope of the SUT, the light of different microlenses is reflected back to the camera, generating several sub-interferograms (also called patches) on the image sensor (see Fig. 1b).
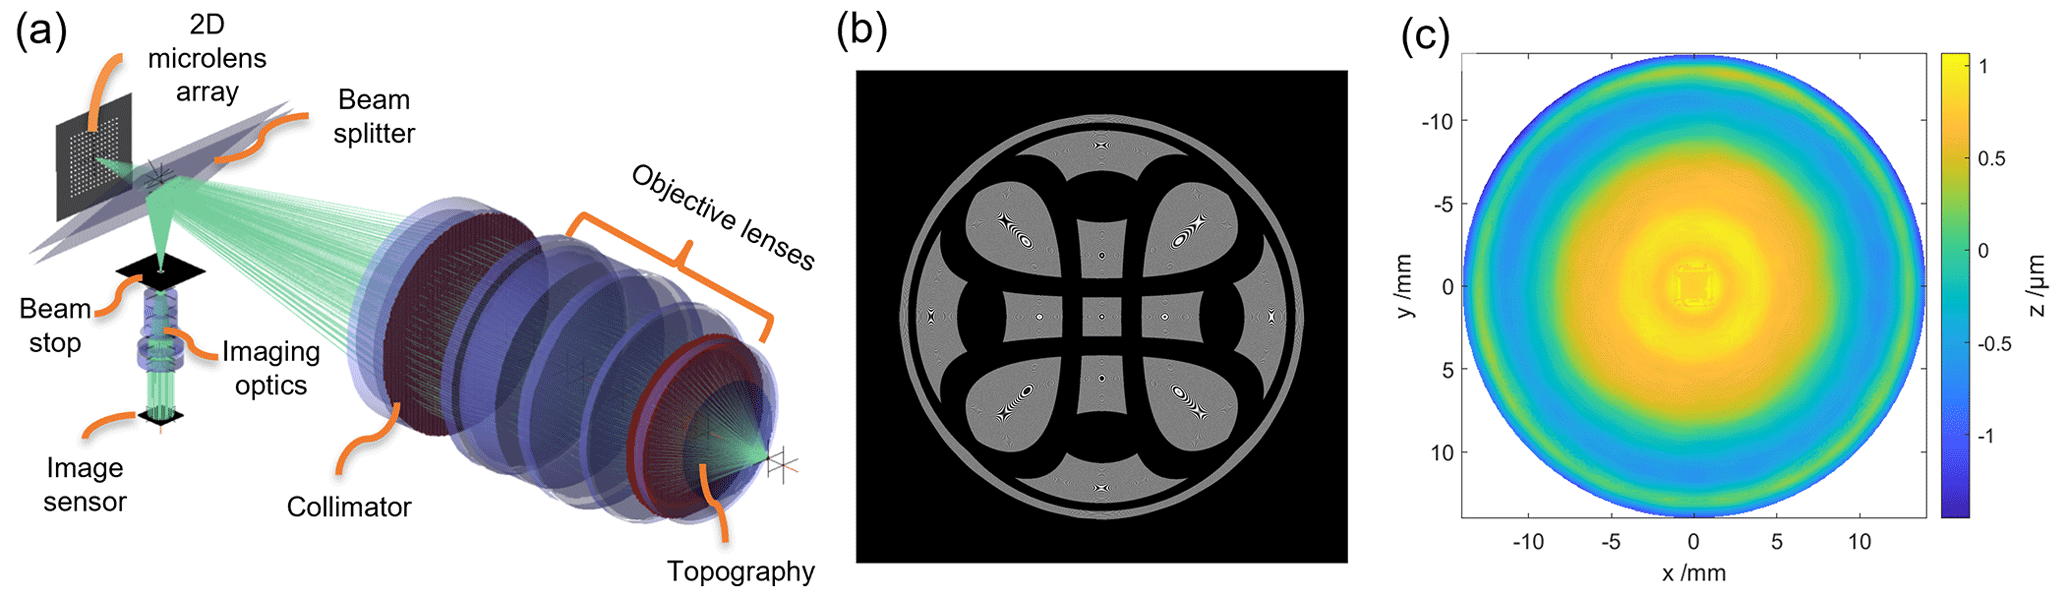
Figure 1Tilted-wave interferometer: (a) scheme of the digital twin of the TWI including the 2D microlens array, the beam splitter, the collimator, the objective lenses, beam stop, imaging optics, and the image sensor but excluding the interferometer's reference arm (adapted from Scholz et al., 2022, CC BY 4.0); (b) sample sensor image of the TWI showing multiple interference patches that are related to different microlenses from the microlens array; and (c) difference topography between the design and the measured topography of an aspherical surface measured with the TWI.
In order to measure the full specimen while avoiding interferences between overlapping patches, every second row and column of the microlens array is covered by a blocking mask. When cycling through all four possible mask positions, overlapping patches are measured consecutively instead of simultaneously. The combined measurements cover the full specimen without leaving unmeasured areas (for details, see Pruss et al., 2017 and Fortmeier et al., 2022). Phase recovery of the interferograms is done by recording five interferograms for each mask position at different phase-shifted reference waves and reconstructing the phase from these recordings (Hariharan et al., 1987). The resulting phase images are then phase-unwrapped using the Goldstein unwrapping algorithm (Goldstein et al., 1988). This leads to a data set of optical path length differences (OPDs) between the reference wave and the tilted measurement waves.
In order to reconstruct the form of the SUT from this data set, a digital twin of the interferometer and the SUT is used to simulate the OPDs for the assumed position, orientation, and form of the SUT. The difference between the measured and simulated OPDs is then used to reconstruct the surface form (see Fig. 1c) by adjusting the parameter of the SUT and its position and orientation within the interferometer. For the reconstruction, a high-dimensional, non-linear inverse problem must be solved.
Since simulations are part of the reconstruction process, the model of the interferometer must be adapted to the real-world interferometer beforehand. This is done in a calibration step by measuring special well-known reference surfaces at many positions in the interferometer and adapting the model parameter by solving another high-dimensional, non-linear inverse problem. For further details on this process, please refer to Fortmeier et al. (2022).
2.2 Requirements to improve the surface positioning
For interferometric methods, it is difficult to distinguish between a misalignment of the specimen and certain form errors (Fortmeier et al., 2016). This is because the (best-fit) radius of the test wavefront depends on its propagation distance, which in turn depends on the position of the specimen within the measurement setup.
As mentioned above, the position perpendicular to the optical axis (x and y directions) and the orientation of the specimen (depending on the degrees of freedom of the specimen) within the setup are part of the optimization process during the reconstruction of the form. Previous studies have shown that this procedure works well (Scholz et al., 2022).
The position along the optical axis (z axis) cannot be distinguished from certain form errors (Gronle et al., 2022), and several investigations have shown that this position has a large impact on the total measurement uncertainty. Therefore, the position along the optical axis is currently measured by an additional distance-measuring interferometer relative to a reference position.
Currently, the so-called cat's eye position is used as a reference position. The adjustment procedure for the SUT therefore involves bringing the specimen into the cat's eye position, where the focus of the objective lens system is on the apex of the SUT. The measured interferogram here is only characteristic of the optical system and does not depend on the surface topography. After adjusting the SUT to this position, the SUT is brought into the measurement position, while the travel of the specimen holder is tracked by a distance-measuring interferometer (DMI; see Fig. 2). This fixes the measurement position in relation to the cat's eye position. In order for this procedure to succeed, the cat's eye position must be accurately known and the adjustment of the specimen to the cat's eye position has to be repeatable with high accuracy.
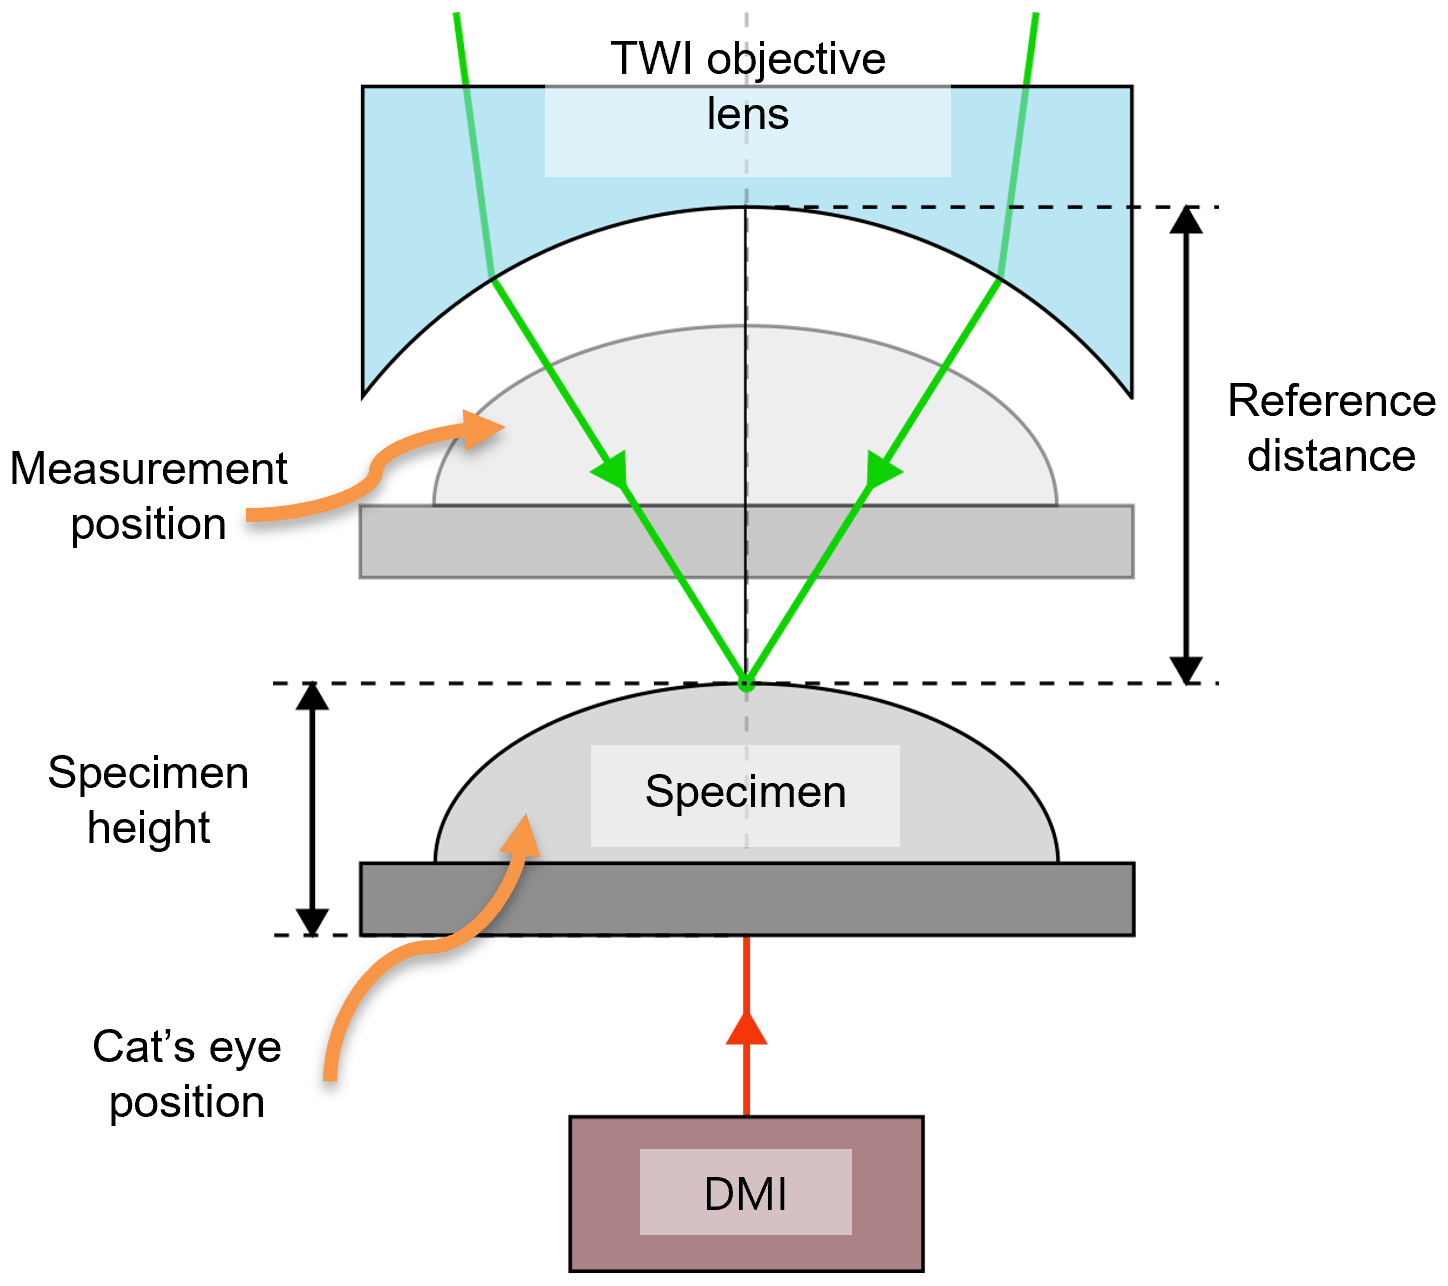
Figure 2Specimen alignment in the TWI by placing the specimen in the cat's eye position as a reference distance and subsequently moving the specimen into the measurement position (here semitransparent). The position of the specimen holder is tracked relative to the cat's eye position by a distance-measuring interferometer (DMI).
To improve the positioning of the SUT, the cat's eye position, which is currently taken from the design parameters of the objective lens, has to be measured during the experiment. Additionally, the positioning accuracy of the SUT in this position needs to be investigated in order to evaluate the stability of the positioning.
For this purpose, a white light interferometer is utilized as an absolute distance-measuring device. Additionally, a transparent specimen is adjusted to the cat's eye position by means of the standard specimen adjustment procedure, and the distance between the top surface of the specimen (SUT) and the last lens surface of the TWI is measured. From this position, the SUT is moved to the measurement position, while the DMI measures the relative position between the cat's eye and the measurement position. In this way, the absolute positioning is measured and improved.
Additionally, repeated measurements of the cat's eye position after alignment of the SUT to this position will reveal the repeatability and robustness of the alignment with the cat's eye position. These results will help to decide whether the distance between the objective lens and the SUT after alignment to the cat's eye needs to be measured once for a certain specimen design or during every single measurement and which measurement uncertainty of the positioning has to be taken into account for the form measurement of the SUT.
3.1 White light interferometry setup
When measuring the distance between two surfaces of a transparent specimen, the wavefronts reflected from the surfaces are evaluated using a white light interferometer based on a Michelson interferometer, as proposed in Depiereux et al. (2007). An overview of the setup is given in Fig. 3. The two specimens, which in the final version will be a specimen containing the SUT in the TWI (specimen 1) and the last lens of the TWI objective (specimen 2) are illuminated by a collimated light beam from a GRIN lens fiber collimator (50-630-APC, Thorlabs, Newton, NJ, USA). The light impinges perpendicularly to the surface and is partially reflected. The reflected light is then coupled back into the fiber. The fiber splitter (TN632R5A1, Thorlabs, Newton, NJ, USA) divides the back-reflected light into two equal parts, one of which is coupled into the white light interferometer (WLI), where the interference between different back-reflections is evaluated.
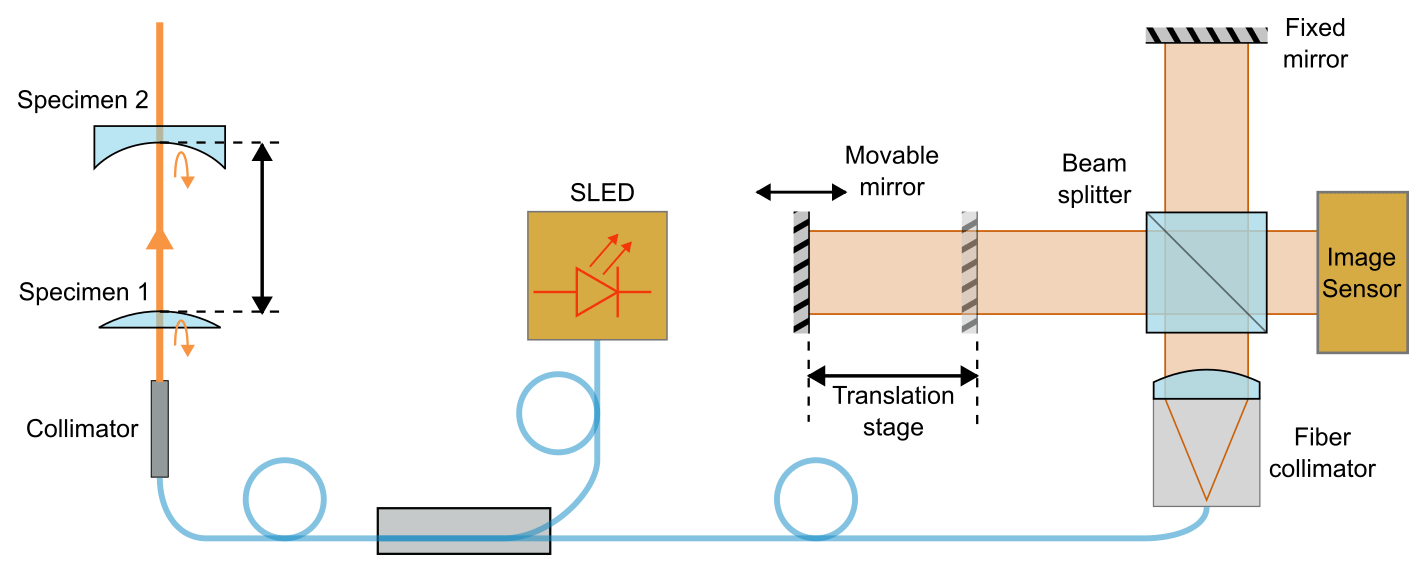
Figure 3Schematic of the measurement setup with the WLI. It includes the interferometer itself, the light source, and the optic table with two transparent test specimens.
The WLI consists of two interferometer arms, with one arm having a fixed length and the other arm being movable along a linear axis (ABL10150, Aerotech, Pittsburgh, PA, USA) with a travel range of 150 mm and a translation step size of 10 nm. The light from the optical fiber is collimated by an aspherical lens fiber collimator (F810APC-635, Thorlabs, Newton, NJ, USA) and the wavefront is split by a non-polarizing beam splitter cube (CCM1-BS013/M, Thorlabs, Newton, NJ, USA). Both interferometer arms are equipped with front surface plane mirrors and the back-reflected waves interfere on the image detector (a2A-4200-40um PRO, Basler, Ahrensburg, Germany). The recorded interferogram is digitized for evaluation on a measurement PC. To reduce the amount of data, the data acquired from the image sensor can be limited to a small region of interest. A photo of the setup of the WLI is shown in Fig. 4a, and a photo of the workbench test setup for testing the distance measurement is shown in Fig. 4b.
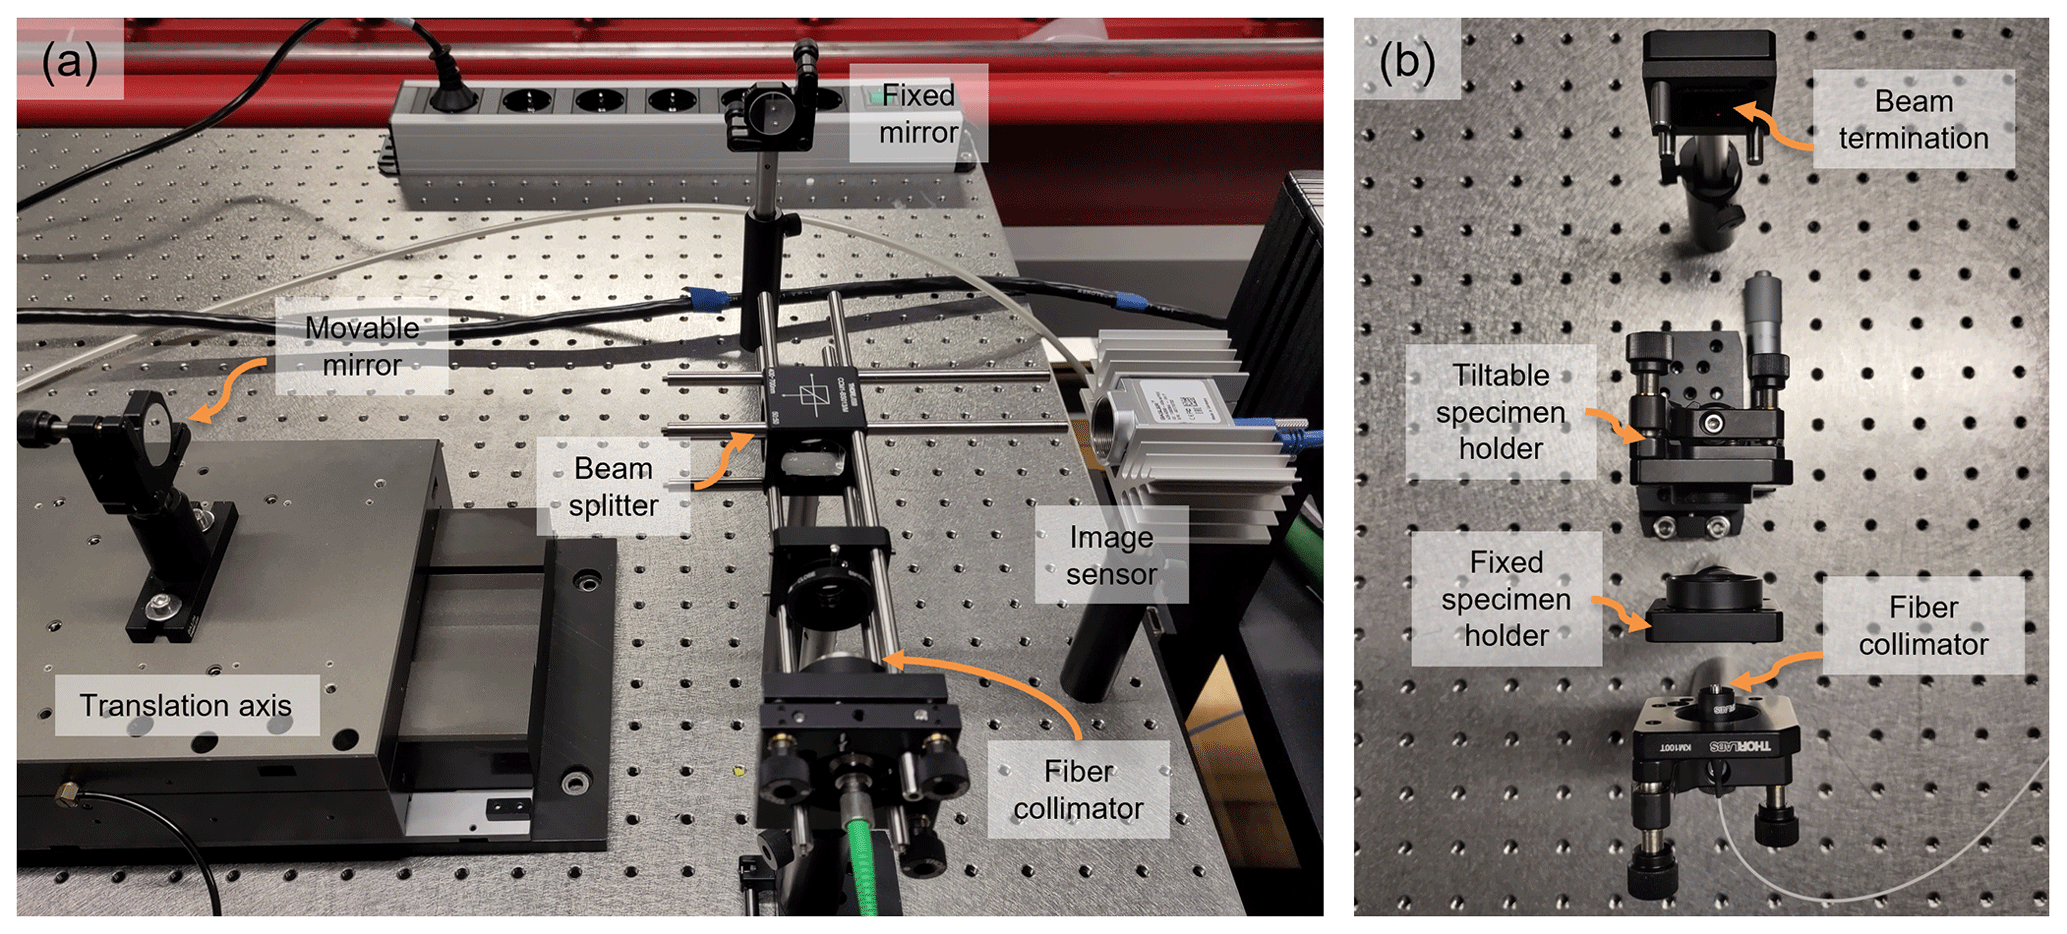
Figure 4(a) White light interferometer including illumination from a fiber collimator, a cube beam splitter, two interferometric arms (one with a fixed mirror on the optics table and one with a movable mirror on a motor stage), and the image sensor. (b) Measurement setup for thickness and distance measurements consisting of a fiber collimator, two specimen holders, and a beam termination.
As light source, an SLED (Exalos, EXS210098) is utilized with a mean wavelength of λmean=636.8 nm and a 3 dB bandwidth of Δλ3 dB=4.2 nm. The SLED is controlled by a laser diode controller with integrated temperature regulation (CLD1015, Thorlabs, Newton, NJ, USA).
3.2 WLI measurement principle
In a Michelson interferometer (see Figs. 3 and 4), the illuminating wavefront, here coming from the fiber collimator, is divided by the beam splitter into two secondary wavefronts. Both wavefronts travel to the mirror of their respective interferometer arm, get reflected, and travel back to the beam splitter. There, both wavefronts are combined again and cast onto a screen or detector where the interference between the two beams can be observed. The optical path length difference between the arms of the interferometer leads to a phase difference between the two wavefronts and results in an observable intensity modulation. This intensity modulation in relation to the interferometer arm optical path length difference d can be expressed as follows:
Here, I1 and I2 are the intensities coming from the individual interferometer arms, and is the wave number. For a quasi-monochromatic illumination, this modulation repeats itself with a period of half the illuminating wavelength λ. The contrast of the interference is constant over a large region of the optical path length difference.
However, for light sources with a broader wavelength range, the interference contrast depends on the optical path length difference between the two interferometer arms. Here, interference fringes are only observable when the absolute of the optical path difference (OPD) is within the coherence length lc of the light and the contrast is maximized when the OPD is zero. The equation for the intensity modulation has to be rewritten to (Hecht and Zajac, 1987)
Here, γ(d) is the complex degree of coherence in relation to d; it consists of an amplitude |γ(d)| and a phase . The wavenumber is related to the mean wavelength λ of the broadband light source. For a source with a Gaussian spectrum, the phase factor α is 0, and the absolute of γ is , with lc being the full width half maximum (FWHM) of the coherence peak. Due to the relation between γ and the optical path length difference d, the interference contrast can be used for length measurement.
To evaluate the WLI's interference contrast, the movable mirror is placed at different axis positions and camera images are recorded. Figure 5a shows a recorded interference image, and Fig. 5b shows the intensity profile plots for different positions of the translation axis that produce different interference contrasts. In order to see interference fringes, the reference mirror is slightly tilted so that d varies along the x axis of the camera's field of view. For a translation axis position of d= −29 µm with respect to the interference contrast maximum, almost no interference is seen since the optical path length difference d is outside the coherent region (|γ|≈0). For d= 11 µm there is a medium interference contrast (|γ|≈0.5), and for d=0 the interference contrast is maximized (|γ|≈1).
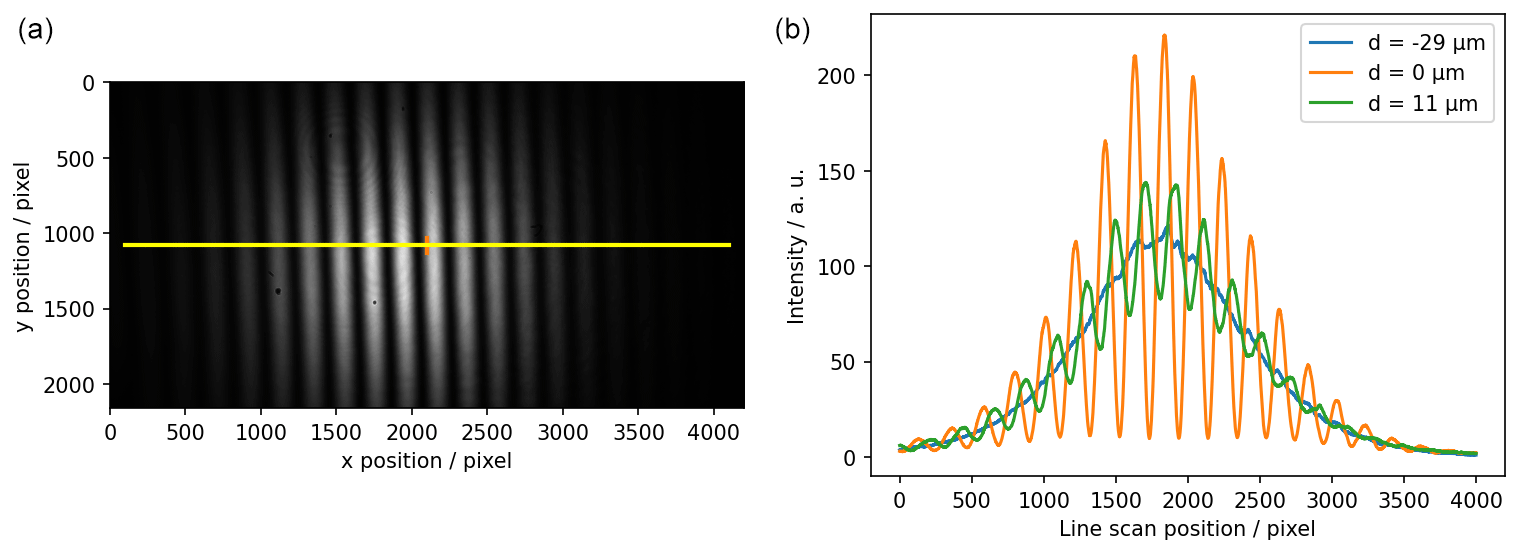
Figure 5(a) Camera image of a white light interferometer near the coherence maximum (with yellow and orange markings). (b) Profile plots across a camera image (marked in (a) by a yellow line) for three different positions of the translation axis (movable mirror) with the resulting variation in coherence levels.
In order to measure the intensity I over a larger range of d, the translation axis is moved with a constant velocity from the measurement's start position to its end position. During the movement, intensity measurements are made at constant translation intervals. This is done by selecting a region of the camera image with a constant d (e.g., a vertical region of 4 by 100 pixels in the center of the camera image; see orange marking in Fig. 5a) and averaging the pixel intensities to reduce local noise. In Fig. 6, an intensity measurement starting from an axis position of 99.44 mm and stopping at 99.5 mm is shown. The axis was moved with a velocity of 0.5 µm s−1, and intensity measurements were made at a constant rate of 30 measurements per second.
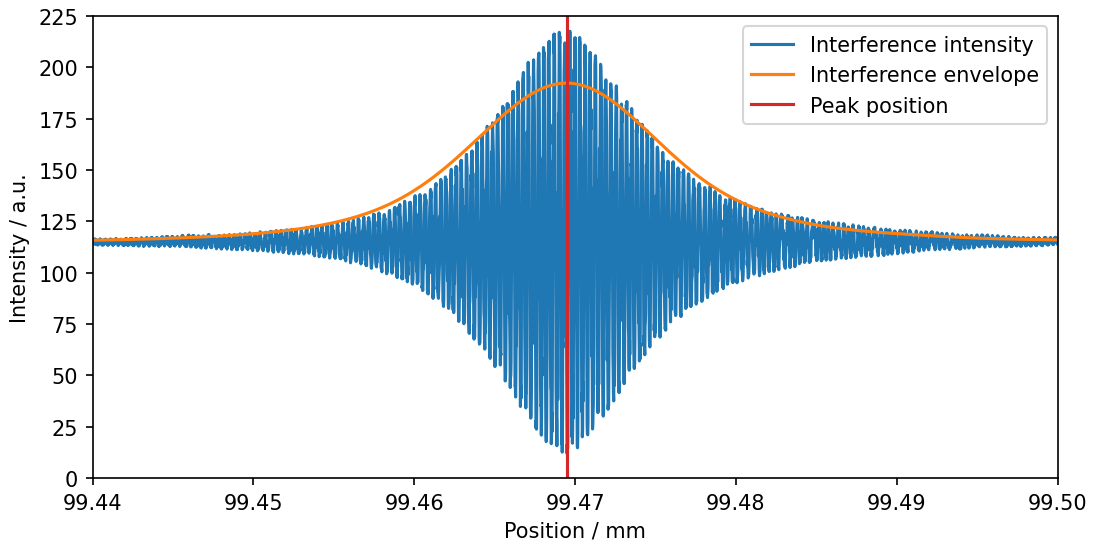
Figure 6Intensity scan by continuously moving the translation axis. A single intensity value is generated by calculating the mean of a vertical strip from the interference camera image. The envelope function (orange) is generated by a frequency-filtered Hilbert transform of the modulated intensity signal. The peak position is marked in red.
The maximum amplitude to the interference signal is reached when both interferometer arms are of equal optical path length (d=0). To find the related axis position, the envelope of the signal is determined using the Hilbert transform, as suggested by Chim and Kino (1991, 1992). To improve the signal quality, an additional Gaussian filter is applied around the mean frequency of the intensity modulation (see Tereschenko, 2018). The resulting interference envelope is shown in orange in Fig. 6. Subsequently, the maximum position of the envelope (which marks d=0) is estimated by a polynomial fit of the logarithm of the envelope function. Since at d=0 the wavefronts of both interferometer arms are in phase, the peak position estimation is further improved by calculating the signal's phase at estimated maximum and correcting the estimation accordingly (Sandoz et al., 1997; de Groot et al., 2002). The peak position for the data presented here is at a translation axis position of 99.469468 mm. The coherence length lc of the signal is 31 µm according to the FWHM of the interference envelope.
3.3 First measurement results from the laboratory setup of the WLI
Following the estimation of the interferometer's axis position of equal interferometer arm lengths, the system capability of distance measurement is investigated. To this end, the light from the SLED is coupled into a GRIN lens fiber collimator via a fiber splitter. The collimated beam is then cast onto a glass plate of 1 mm nominal thickness made from fused silica (WG41010, Thorlabs, Newton, NJ, USA). The light transmitted through the specimen is terminated by an absorbing material (Musou Black Fabric Kiwami, Koyo Orient Japan Co., Ltd., Saitama, Japan) to prevent additional reflections. Due to the difference in refractive index, the measurement beam gets partially reflected both at the front and the back of the glass specimen, and these reflections are coupled back into the fiber collimator. The subsequent fiber splitter directs half of the collected light into the interferometer. The part of the setup containing the fiber collimator, the glass specimen, and the beam termination is shown in Fig. 7a.
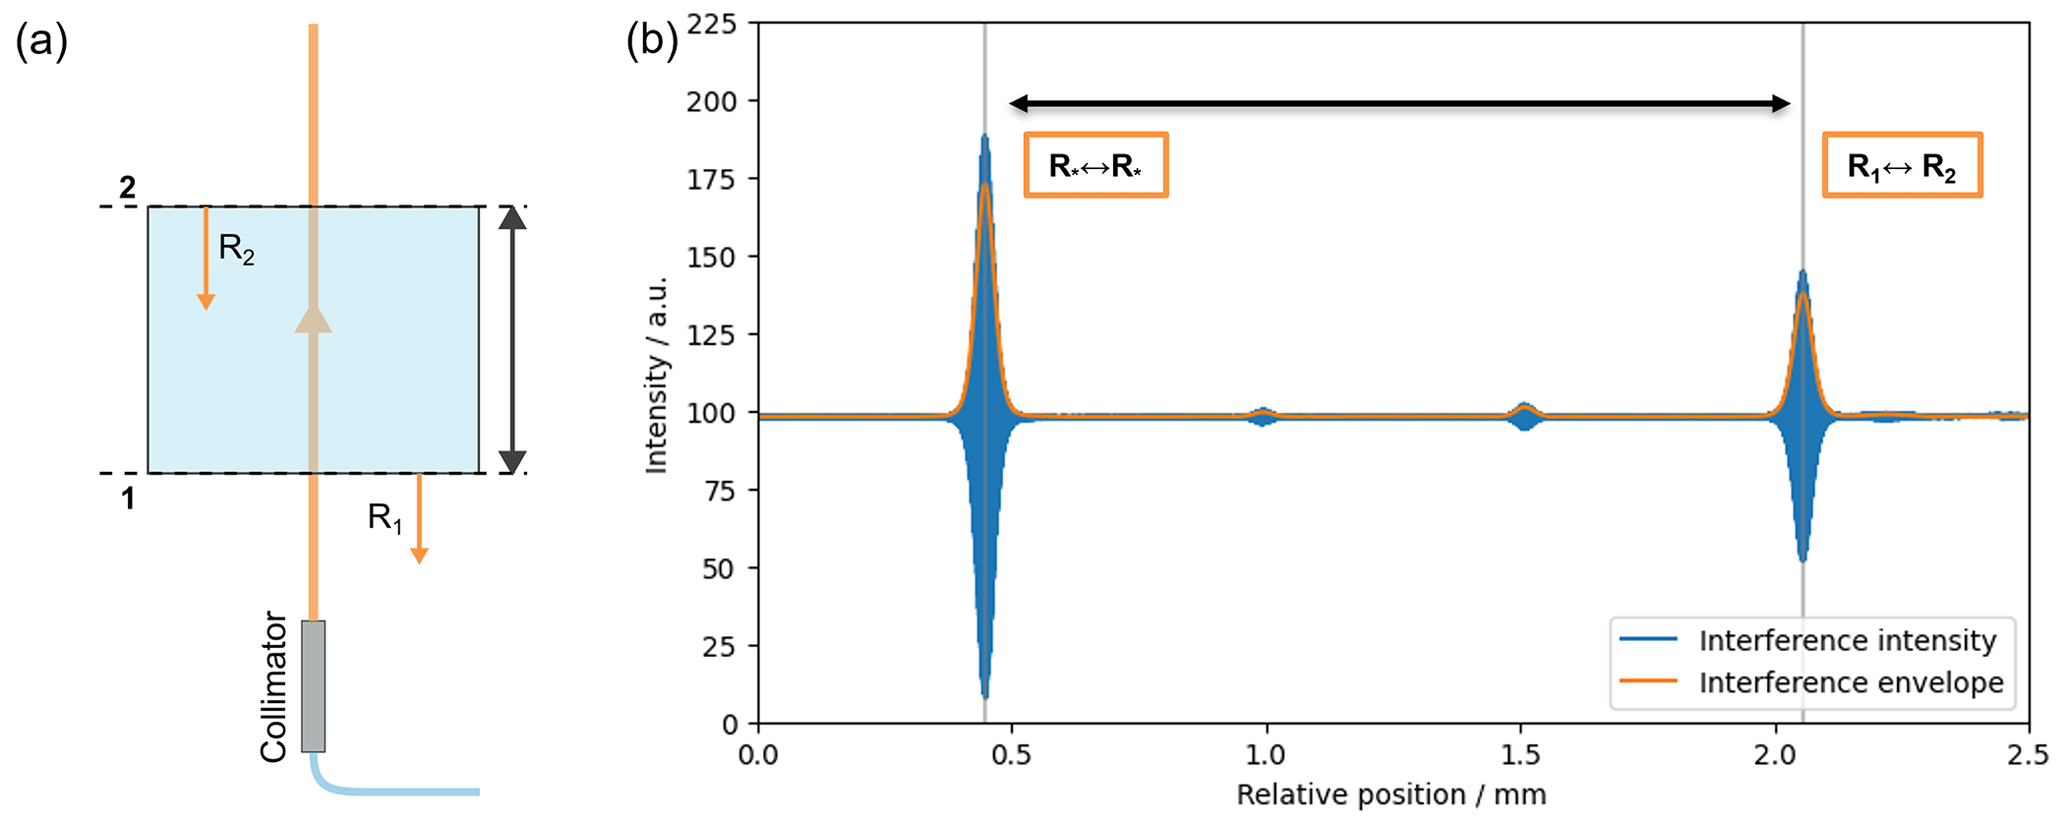
Figure 7(a) Scheme of the thickness measurement setup for a single glass plate. The measurement beam emerges from the fiber collimator, gets partially reflected at both the front surface and the back surface, and is then coupled back into the collimator. (b) Intensity scan along the translation axis including both the interference of both reflections with themselves (peak 1, ) and the mixed interference between the front reflection and the back reflection (peak 2, R1↔R2).
The axis is then moved slowly around the equidistant position (at 1 µm s−1), and measurements are taken at a rate of 30 images per second (again cropped to 4 × 100 pixels in the sensor's center and averaged). The resulting intensity measurements are plotted against the axis position in Fig. 7b. Besides smaller disturbances, two dominant peaks can be seen. The larger one is consistent with the equidistant position of the mirrors on the decoding Michelson interferometer. It can be attributed to the interference from the specimen's front-side reflection with a shifted version of itself and the interference from the specimen's back-side reflection with a shifted version of itself. The second peak, which is approximately half as large, comes from the interference between the front-side reflection and the back-side reflection from the glass specimen. The difference between both peak axis positions equals the optical path difference (OPD) between both reflections.
In order to evaluate this distance, the envelope of the signal is again calculated using the Hilbert transform, Gaussian-filtered for the central frequency . Then both maxima are pre-estimated using a second-order polynomial fit around the presumed peak position. The peak positions are then corrected by phase estimation as described above (see Tereschenko, 2018). Repeated measurements (n=16) reveal that the mean length difference between the two relevant peaks amounts to 1607.1 µm, with an empirical standard deviation σ of 0.7 µm. The length difference is equal to the optical path length through the glass plate. With the refractive index of fused silica of 1.4569 (derived from Sellmeier equation at 636.8 nm; data Malitson, 1965), the thickness of the glass plate can be estimated to be 1103.1 µm. Assuming a Gaussian distribution of the measured values, a refractive index standard uncertainty of , and a mean wavelength standard uncertainty of 0.2 nm, the combined standard uncertainty of the length measurement can be estimated to be 0.9 µm. The result is in good agreement with a tactile reference measurement of 1102±3 µm (MT60K, Heidenhain, Traunreut, Germany). The estimation does not include systematic influence factors, which still have to be characterized. Further has to be noted that the repeatability is dominated by the spreading of the measured optical distances, which might indicate that future improvement of the mechanical stability as well as an improved measurement strategy resulting in shorter measurement times may further improve the overall repeatability.
To evaluate the intended use case of measuring the distance between a surface in the TWI and the last lens' surface of the TWI objective (see Fig. 2), a workbench test setup consisting of the previously utilized 1.1 mm glass plate and a plano-concave lens (LC4918, Thorlabs, Newton, NJ, USA) is used. The concave surface of the lens has a similar surface curvature to the TWI objective's terminal surface. A scheme of the setup can be seen in Fig. 8a. To reduce unwanted additional reflections, the beam again is terminated by an absorbing surface. The axis is again moved with 1 µm s−1, and data are recorded at 30 data points per second with the same cropping. Applying the same image processing as before leads to an interference envelope as depicted in Fig. 8b. The distance between the back of the glass plate (surface 2) and the concave surface (surface 3) is measured between the peak of equidistant position and the peak of the interference between the reflections R2 and R3, as marked in Fig. 8b. With n=11 repetitions made, the mean measured distance is 20905.6 µm with an empirical standard deviation σ=1.5 µm. Since both the interferometer and the distance of the specimens are in ambient air, the refractive index, as a function of the wavelength, does not have to be taken into account. The higher spreading of the measured values might be originated in the longer measurement time and therefore higher mechanical drift of the setup. This again might indicate that the repeatability may be further improved by improving the mechanical stability of the setup as well as by reducing the measurement time. Compared to other major interference peaks, the peaks of the interference of R2 to R3 and R1 to R3 are rather small. This can be attributed to the focussing property of the curved surface. The reflected wavefront does not couple back into the fiber collimator as efficiently as the reflections from the plane surfaces. Nevertheless, the peaks can still be detected, showing that the setup is generally suitable for the use case intended.
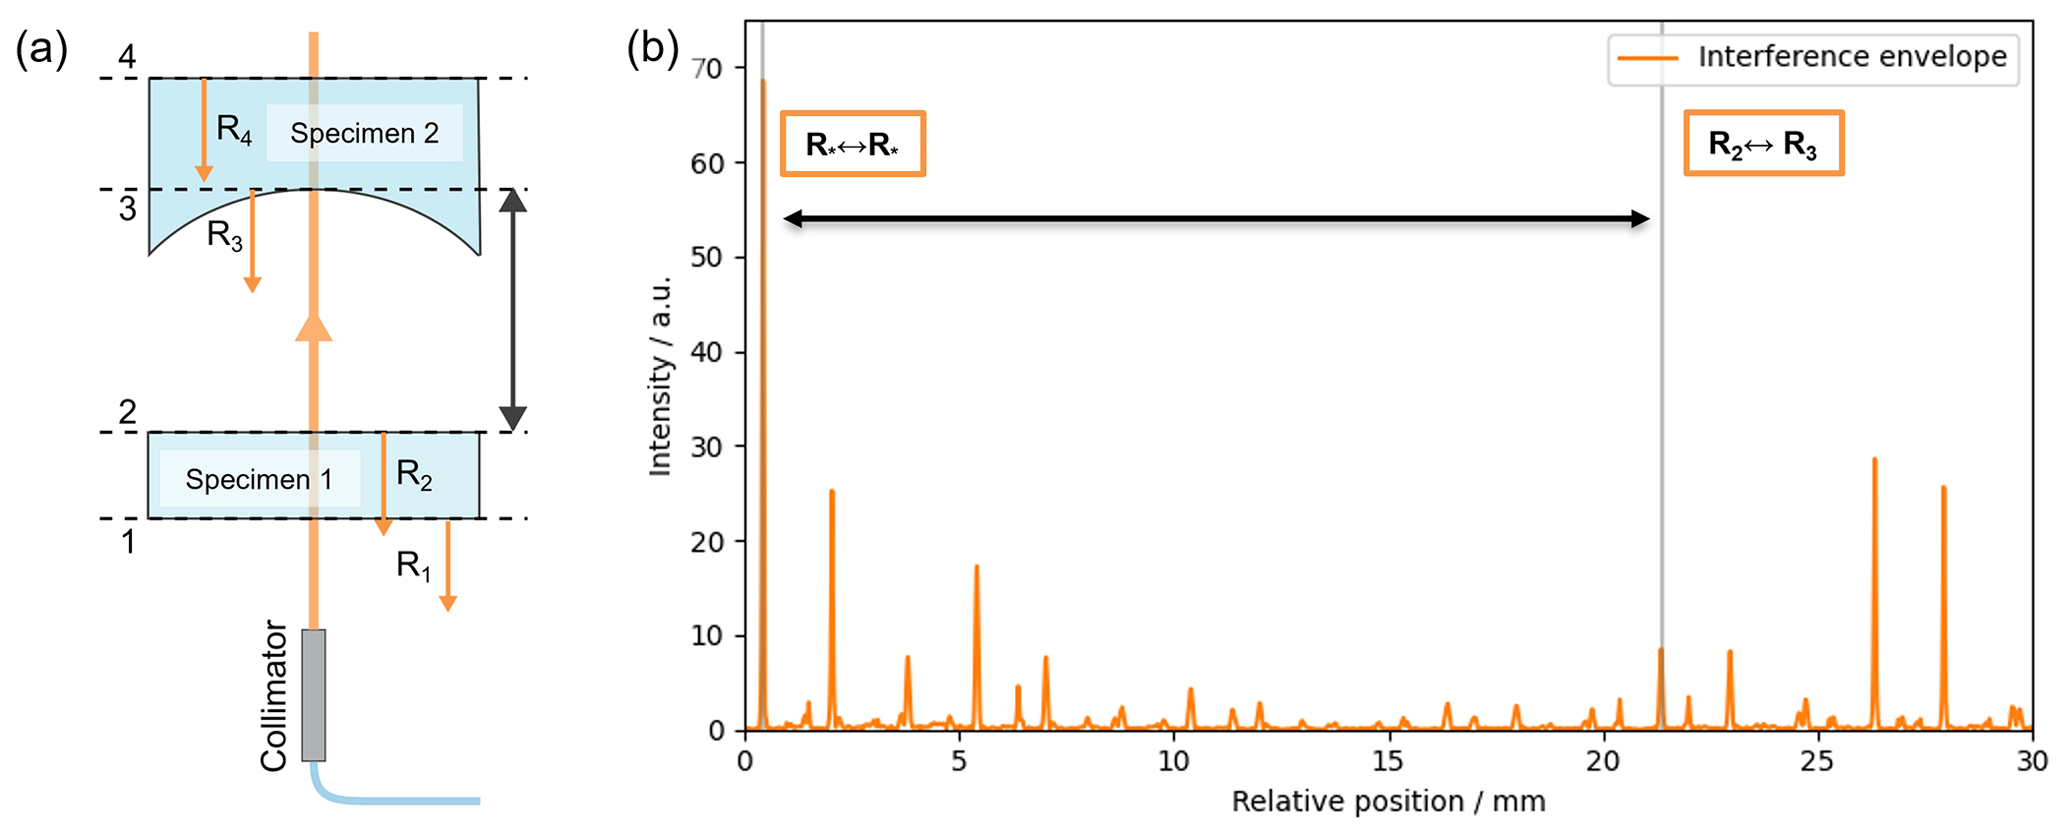
Figure 8(a) Scheme of the measurement setup for measuring the distance between a glass plate (specimen 1) and concave surface (specimen 2). (b) Interference envelope of the intensity scan along the translation axis for the distance measurement. The relevant peaks and the distance are marked.
In this work we proposed the concept of an additional absolute distance measurement of the position of the SUT to improve the results of the form measurement of aspheres and freeform surfaces with a TWI. The absolute distance measurement is based on a white light Michelson interferometer configuration. We discussed the basic ideas behind improving TWI measurement results by applying such a concept and presented initial results from a WLI laboratory test setup to qualify the WLI setup for the improvement of TWI measurements.
For evaluating the white light interference, the light source was directly connected to the Michelson interferometer. The contrast of the interference was tested both by images taken at different positions of the translation axis and by a time series of intensity measurements during continuous translation of the axis. An interference contrast suitable for position analysis was generated and the reference position of the WLI measured. In addition, a glass test specimen was introduced into the system, and the distance between the front and back surface of the specimen was measured and compared to a first reference value. Furthermore, the distance between a plane glass specimen and a concave surface, emulating the terminal surface of the TWI objective, was measured.
Future work will improve the mechanical stability of the WLI setup and introduce additional measurement modes that limit the measurement to the peaks of interest. This will lead to shorter measurement times and therefore better repeatability. To ensure suitable accuracy of the distance measurement for improving the specimen positioning within a TWI, the setup will be further characterized by measuring reference samples with well-known thickness and uncertainties in the range of tens of nanometers, and the uncertainty of the distance measurement will be estimated. Furthermore, future work will integrate the presented measurement system into the tilted-wave interferometer setup at PTB, investigate and improve the accuracy of the cat’s eye alignment procedure of the TWI, and enhance the overall accuracy of SUT position alignment within the TWI setup.
Source code and example data are available on reasonable request from the corresponding author.
GS, MS, and IF did the research planning; LY and GS built the WLI and implemented the measurement and evaluation software; and GS, MS, and IF performed the results' evaluation.
The contact author has declared that none of the authors has any competing interests.
Publisher’s note: Copernicus Publications remains neutral with regard to jurisdictional claims made in the text, published maps, institutional affiliations, or any other geographical representation in this paper. While Copernicus Publications makes every effort to include appropriate place names, the final responsibility lies with the authors.
This article is part of the special issue “Sensors and Measurement Science International SMSI 2023”. It is a result of the 2023 Sensor and Measurement Science International (SMSI) Conference, Nuremberg, Germany, 8–11 May 2023.
This research has been supported by the Deutsche Forschungsgemeinschaft (grant no. 496703792).
This open-access publication was funded by the Physikalisch-Technische Bundesanstalt.
This paper was edited by Thomas Fröhlich and reviewed by three anonymous referees.
Baer, G., Schindler, J., Pruss, C., Siepmann, J., and Osten, W.: Calibration of a non-null test interferometer for the measurement of aspheres and free-form surfaces, Opt. Express, 22, 31200, https://doi.org/10.1364/OE.22.031200, 2014. a
Beutler, A.: Metrology for the production process of aspheric lenses, Advanced Optical Technologies, 5, 211–218, https://doi.org/10.1515/aot-2016-0011, 2016. a
Chim, S. S. C. and Kino, G. S.: Phase measurements using the Mirau correlation microscope, Appl. Opt., 30, 2197, https://doi.org/10.1364/AO.30.002197, 1991. a
Chim, S. S. C. and Kino, G. S.: Three-dimensional image realization in interference microscopy, Appl. Opt., 31, 2550, https://doi.org/10.1364/AO.31.002550, 1992. a
de Groot, P., Colonna de Lega, X., Kramer, J., and Turzhitsky, M.: Determination of fringe order in white-light interference microscopy, Appl. Opt., 41, 4571, https://doi.org/10.1364/AO.41.004571, 2002. a
Depiereux, F., Lehmann, P., Pfeifer, T., and Schmitt, R.: Fiber-optical sensor with miniaturized probe head and nanometer accuracy based on spatially modulated low-coherence interferogram analysis, Appl. Opt., 46, 3425, https://doi.org/10.1364/AO.46.003425, 2007. a
Fortmeier, I., Stavridis, M., Wiegmann, A., Schulz, M., Osten, W., and Elster, C.: Evaluation of absolute form measurements using a tilted-wave interferometer, Opt. Express, 24, 3393, https://doi.org/10.1364/OE.24.003393, 2016. a, b
Fortmeier, I., Schachtschneider, R., Ledl, V., Matousek, O., Siepmann, J., Harsch, A., Beisswanger, R., Bitou, Y., Kondo, Y., Schulz, M., and Elster, C.: Round robin comparison study on the form measurement of optical freeform surfaces, J. Eur. Opt. Soc.-Rapid, 16, 2, https://doi.org/10.1186/s41476-019-0124-1, 2020. a
Fortmeier, I., Stavridis, M., Schulz, M., and Elster, C.: Development of a metrological reference system for the form measurement of aspheres and freeform surfaces based on a tilted-wave interferometer, Meas. Sci. Technol., 33, 045013, https://doi.org/10.1088/1361-6501/ac47bd, 2022. a, b, c
Goldstein, R. M., Zebker, H. A., and Werner, C. L.: Satellite radar interferometry: Two-dimensional phase unwrapping, Radio Sci., 23, 713–720, https://doi.org/10.1029/RS023i004p00713, 1988. a
Gronle, A., Pruss, C., and Herkommer, A.: Misalignment of spheres, aspheres and freeforms in optical measurement systems, Opt. Express, 30, 797, https://doi.org/10.1364/OE.443420, 2022. a, b
Hariharan, P., Oreb, B. F., and Eiju, T.: Digital phase-shifting interferometry: a simple error-compensating phase calculation algorithm, Appl. Opt., 26, 2504–2506, https://doi.org/10.1364/AO.26.002504, 1987. a
Hecht, E. and Zajac, A.: Optics, Addison Wesley Publishing Company, Boston, 2 edn., ISBN 978-0-201-11611-3, 1987. a
Henselmans, R., Nijkerk, D., Lemmen, M., and Kamphues, F.: Athermal design of the optical tube assemblies for the ESO VLT Four Laser Guidestar Facility, in: Integrated Modeling of Complex Optomechanical Systems, edited by: Andersen, T. and Enmark, A., Vol. 8336, 83360X, https://doi.org/10.1117/12.916127, 2011. a
Malitson, I. H.: Interspecimen Comparison of the Refractive Index of Fused Silica, J. Opt. Soc. Am., 55, 1205–1209, https://doi.org/10.1364/JOSA.55.001205, 1965. a
Pruss, C., Baer, G. B., Schindler, J., and Osten, W.: Measuring aspheres quickly: tilted wave interferometry, Opt. Eng., 56, 111713, https://doi.org/10.1117/1.OE.56.11.111713, 2017. a
Sandoz, P., Devillers, R., and Plata, A.: Unambiguous profilometry by fringe-order identification in white-light phase-shifting interferometry, J. Mod. Opt., 44, 519–534, https://doi.org/10.1080/09500349708232918, 1997. a
Schachtschneider, R., Fortmeier, I., Stavridis, M., Asfour, J., Berger, G., Bergmann, R. B., Beutler, A., Blümel, T., Klawitter, H., Kubo, K., Liebl, J., Löffler, F., Meeß, R., Pruss, C., Ramm, D., Sandner, M., Schneider, G., Wendel, M., Widdershoven, I., Schulz, M., and Elster, C.: Interlaboratory comparison measurements of aspheres, Meas. Sci. Technol., 29, 055010, https://doi.org/10.1088/1361-6501/aaae96, 2018. a
Scholz, G., Fortmeier, I., Marschall, M., Stavridis, M., Schulz, M., and Elster, C.: Experimental Design for Virtual Experiments in Tilted-Wave Interferometry, Metrology, 2, 84–97, https://doi.org/10.3390/metrology2010006, 2022. a, b
Tereschenko, S.: Digitale Analyse periodischer und transienter Messsignale anhand von Beispielen aus der optischen Präzisionsmesstechnik, PhD thesis, https://kobra.uni-kassel.de/handle/123456789/2018072655904 (last access: 11 July 2023), 2018. a, b
Woodard, K. S., Comstock, L. E., Wamboldt, L., and Roy, B. P.: Cost-effective lightweight mirrors for aerospace and defense, in: Infrared Technology and Applications XLI, edited by: Andresen, B. F., Fulop, G. F., Hanson, C. M., and Norton, P. R., Vol. 9451, 94511W, https://doi.org/10.1117/12.2177586, 2015. a