the Creative Commons Attribution 4.0 License.
the Creative Commons Attribution 4.0 License.
 | 24 Nov 2025
Underwater object detection using capacitive micromachined ultrasonic transducers (CMUTs)
Meghana Vishwanatha
Karman Selvam
Nooshin Saeidi
Maik Wiemer
Harald Kuhn
In an era of rapid technological advancement, object detection has become essential for enhancing efficiency and safety in various fields. Although significant progress has been made in air-based applications, underwater object detection remains relatively unexplored, especially in shallow aquatic environments such as coastal zones, harbors, and aquaculture facilities, due to its unique challenges. Ultrasonic technology, with its ability to travel long distances underwater and perform well in turbid and low-light conditions, stands out as a promising solution. Recent advances in micro-electromechanical system (MEMS) technology, particularly capacitive micromachined ultrasonic transducers (CMUTs), offer new opportunities for underwater detection. CMUTs are compact and highly sensitive and operate with a wide bandwidth, making them ideal for underwater applications. This research explores the use of CMUTs, fabricated by Fraunhofer ENAS with a resonant frequency of 1.5 MHz, for underwater object detection. Initial experiments confirmed their feasibility for detecting submerged objects of various sizes, shapes, and materials. Further investigations assessed the resolution of CMUTs in detecting minimum object sizes using an automated XYZ stage. Finally, the technology was used to map the topography of test objects, including intricate 3D structures and alphabet shapes, demonstrating its potential for high-resolution mapping. These results highlight the promising capabilities of CMUTs for underwater sensing applications, with substantial potential for further development.
- Article
(5750 KB) - Full-text XML
- BibTeX
- EndNote


Shallow aquatic environments, including coastal zones, harbors, aquaculture facilities, and confined inland waters, are critical to a wide range of underwater sensing applications (Caccia et al., 2007). These include structural inspection of bridge piers, pipelines, and offshore wind turbine foundations; monitoring of aquatic livestock in controlled pools; and terrain mapping by compact autonomous systems such as remotely operated vehicles (ROVs) and autonomous underwater vehicles (AUVs). Such tasks demand sensing technologies that are compact, energy-efficient, and capable of providing accurate data at short ranges and in challenging environments.
Several sensing modalities for underwater applications have been developed and are being used extensively, including radar (Cai, 2024), lidar (Filisetti et al., 2018), and the most widely used SONAR (Burguera and Oliver, 2016; Hurtós et al., 2017). Radar, while highly effective in the air, faces many challenges underwater due to the high attenuation of electromagnetic waves in water. Optical systems such as cameras and lidars are constrained by strong light absorption and scattering in water, particularly in turbid or low-light conditions, often requiring artificial illumination that adds to system complexity and power consumption. Conventional SONAR systems, though well established, face challenges in shallow regions due to multipath effects, reverberation from nearby surfaces, and limited resolution at short ranges (Stinco et al., 2023). Furthermore, their cost, size, and power requirements make them less suitable for integration into lightweight, portable platforms. Hence, their suitability in shallow or confined underwater environments is limited.
With the advancements in micro-electromechanical system (MEMS) technologies, capacitive micromachined ultrasonic transducers (CMUTs) have emerged as an attractive ultrasound-based sensing solution. CMUTs offer a range of unique advantages such as wide bandwidth (over 100 %), better impedance matching, high temperature stability, and no self-heating (Oralkan et al., 2002a). They also have a high design flexibility, enabling CMOS-compatible fabrication and batch production (Li et al., 2024). Because of their advantages, CMUTs are used for diverse applications such as in medical imaging and therapy, non-destructive testing, flow measurements, level measurements (Saeidi et al., 2022), and gas sensing. However, CMUTs for the purpose of underwater object detection have been relatively less explored. Oralkan et al. (2002b) established the viability of using CMUTs for object detection by realizing 2D and 3D imaging of wires in phantoms using 1D nd 2D rectangular CMUT arrays. Song et al. (2015) fabricated and tested a CMUT with a bandwidth of 155 % and a 540 kHz center frequency for use in underwater imaging. Zhang et al. (2016) demonstrated two-obstacle imaging using a CMUT with a resonant frequency of 700 kHz. In our research, we have advanced these efforts by fabricating a CMUT device with a resonant frequency of 1.5 MHz (in water) and then encapsulating it with silicone-based material for underwater usage. We began our research by testing the feasibility of using our CMUTs for underwater object detection. Following these initial tests, we conducted detailed resolution analysis to evaluate the precision of our device. Subsequently, the technology was adapted for topographic mapping, with thorough tests and validations being conducted to confirm the CMUT's ability to accurately map intricate 3D structures. While the immediate goal is to characterize their performance in controlled aquarium conditions, future research must explore its ability in realistic waterbodies through field tests. This work is a proof of concept for the further research and development of CMUTs for underwater use cases.
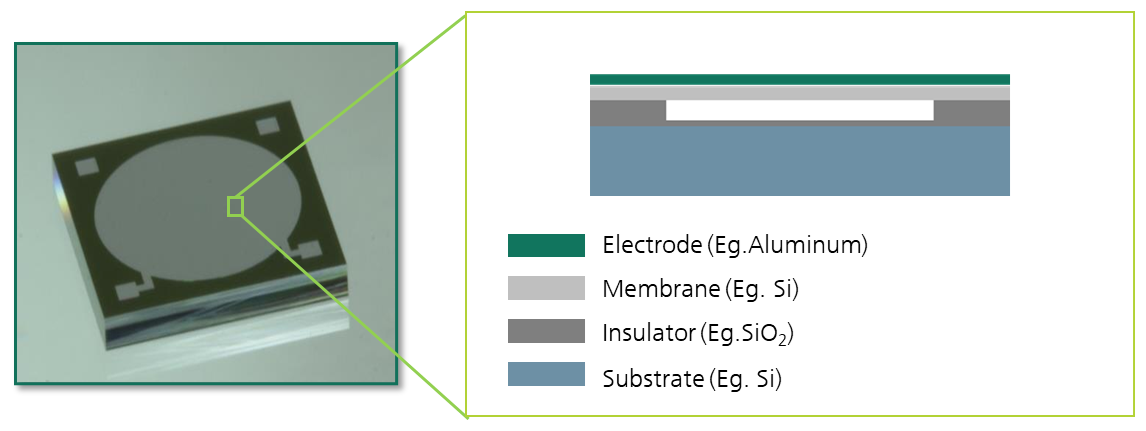
The sensor used in this research was a single-element CMUT fabricated in Fraunhofer ENAS using the wafer-bonding technology. The resonant frequency of the CMUTs is 1.5 MHz. Figure 1 shows the fabricated CMUT chip, with an active area of (5×5) mm2 (left) and consisting of numerous CMUT cells. Each CMUT cell consists of a fixed-bottom electrode, a substrate, an insulating layer, a vacuum cavity, and a movable membrane with a top electrode, as shown in the inset of Fig. 1. The membrane radius and thickness are 70 and 5.5 µm, respectively, with a cavity depth of approx. 470 nm. The CMUT has two functional modes: transmit and receive. In transmit mode, the alternating current (AC)- and direct current (DC)-excited membrane vibrates back and forth, producing ultrasonic signals. In receive mode, the incoming ultrasonic signals cause the membrane to vibrate, which, in turn, generates a displacement current because of the change in capacitance. In this way, the CMUT converts electrical energy into acoustic energy and vice versa using the principle of capacitive transduction.
Although the intricate structure of MEMS devices, such as CMUTs, poses challenges for deep-sea applications because of high underwater pressure, these limitations can be mitigated through suitable packaging techniques. By decoupling the membrane from external pressures, sensor performance can remain stable even in extreme conditions. In our previous work (Saeidi et al., 2021), we successfully adapted CMUTs for harsh environments by enclosing them in an oil-filled aluminum housing with an integrated acoustic window, effectively isolating the sensor from external vibrations. To extend the applicability of CMUTs to deep-sea exploration, similar structural modifications must be explored to ensure reliable operation in high-pressure underwater environments.
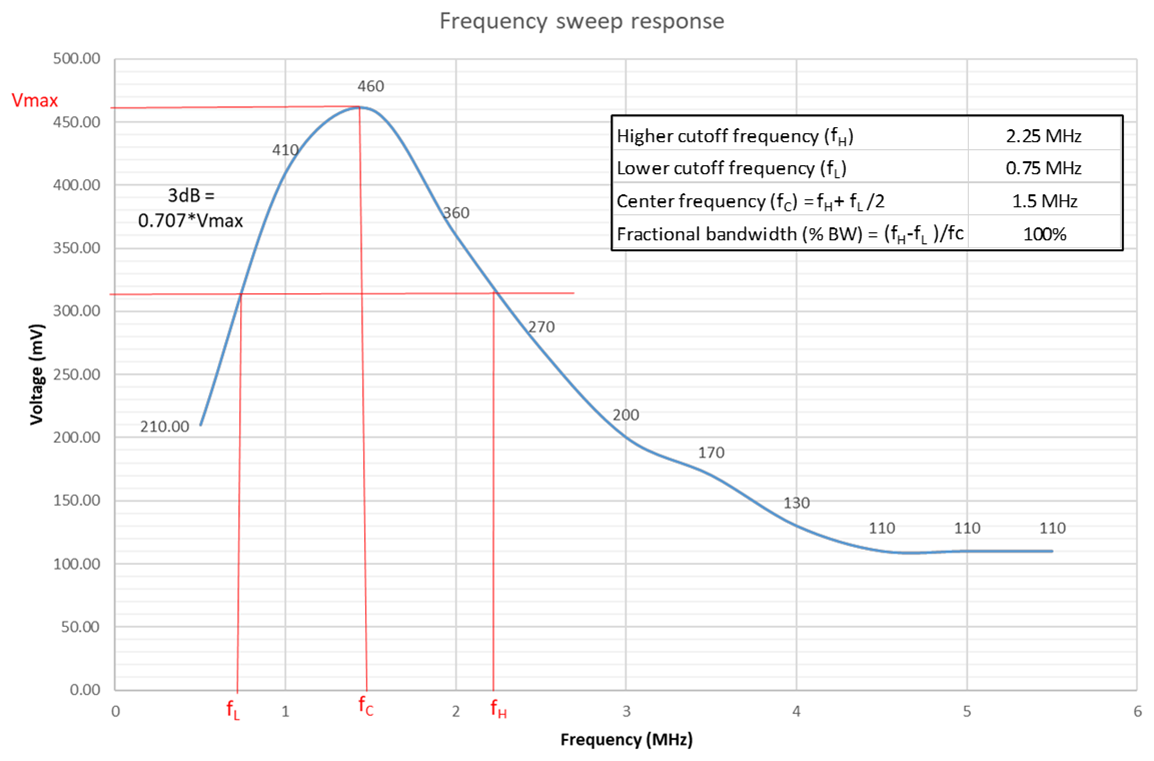
Understanding the behavior of CMUTs is crucial for identifying the optimal driving conditions for the CMUT. This is achieved through acoustic characterization studies such as frequency sweep. The hydrophone-assisted frequency sweep enables us to identify the resonant frequency and bandwidth of the CMUT.
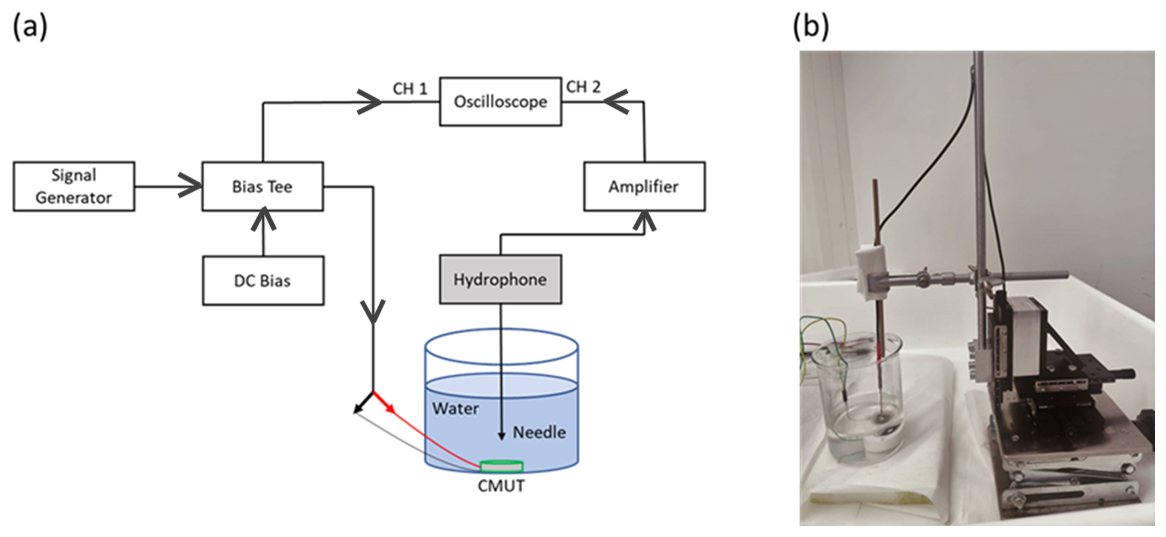
The schematic diagram and image of the experiment setup are shown in Fig. 2. The CMUT was actuated with 20 Vp-p AC signal and 30 V DC bias. A bias tee was used to couple the AC (Sigilent SDG 2042X Function/waveform generator) and DC (Teledyne Test Tools T3PS3000 DC power supply) signals as inputs into the CMUT. A needle hydrophone (Müller Hydrophone, stainless steel, sensitivity of −1.3 mV per bar, 0.3–10 MHz) was used as a receiver. It was immersed in the water and placed in line with the CMUT at a distance of 19.48 mm from it. A frequency sweep was carried out starting from 0.5 MHz, and the signal data were recorded at every 0.5 MHz interval. The frequency sweep response of the CMUT captured by the hydrophone is illustrated in Fig. 3. Notably, a peak amplitude of 460 mV was detected at 1.5 MHz, indicating the resonant frequency of the CMUT to be 1.5 MHz. Furthermore, by analyzing the frequency response graph, the 3 dB fractional bandwidth was determined to be 100 %, demonstrating the wide-bandwidth capability of CMUTs.
To address various aspects of underwater sensing, different experiment setups were designed, and tests were carried out. The first test was a feasibility study to examine the viability of our CMUTs for object detection underwater. Test objects such as steel rod, polycarbonate, and glass cubes and cuboids were used in a lab setup. The CMUT was operated in pulse echo mode, and it was able to detect the test objects accurately and track changes in their distances. A maximum distance of 60 cm was measured with this lab setup. The next test was designed to identify the resolution of the CMUT in terms of its ability to detect small objects. Subsequently, the technology was applied to topography mapping to test the ability of the CMUT to map complex structures.
4.1 Resolution of the CMUT
To evaluate the resolution of the CMUT, small objects such as screws (8 mm in length, 2.9 mm in diameter) and polycarbonate cubes (4 mm sides) were used as test samples. For the screw test, the object was mounted on a 3D-printed square-shaped holder attached to an automated XYZ stage. The screw, along with its holder, was systematically moved along the z axis (bottom-to-top direction) in controlled increments of 2 mm while keeping the x and y coordinates constant. The initial position of the XYZ stage was (28, 70, 155) mm, and the movements continued until (28, 70, 202) mm. Throughout this process, the CMUT remained stationary, secured in a 3D-printed holder facing the test object. CMUT signals were collected at each position as the object moved incrementally. The test setup is shown in Fig. 4, with an arrow indicating the direction of motion and an enlarged image of the screw in front of the CMUT. In the second setup, polycarbonate cubes were used as test objects and kept stationary in a water-filled glass beaker. The CMUT, secured in a holder facing the objects, was mounted on an XYZ stage to allow precise and controlled movements during the experiment. The data were collected at each position above the objects, as well as once away from the test objects, where only the beaker was in the CMUT's focus, for comparative reference purposes. Figure 5 shows the test setup and a magnified image of the three transparent polycarbonate cubes.
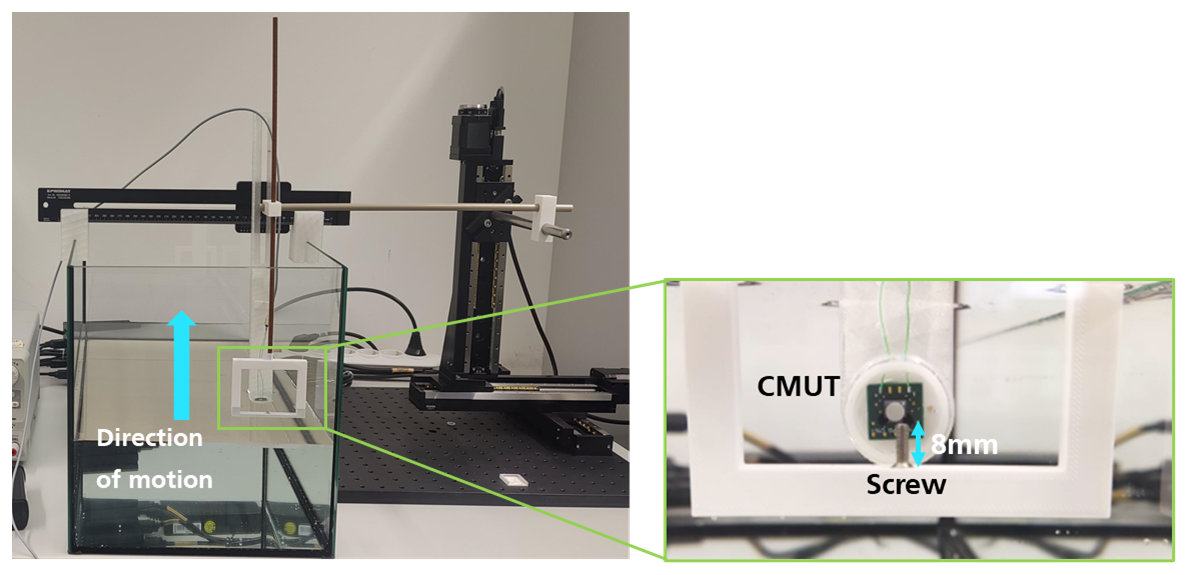
Figure 4Experiment setup to test the resolution of the CMUT, with an enlarged image of the screw as the test object.
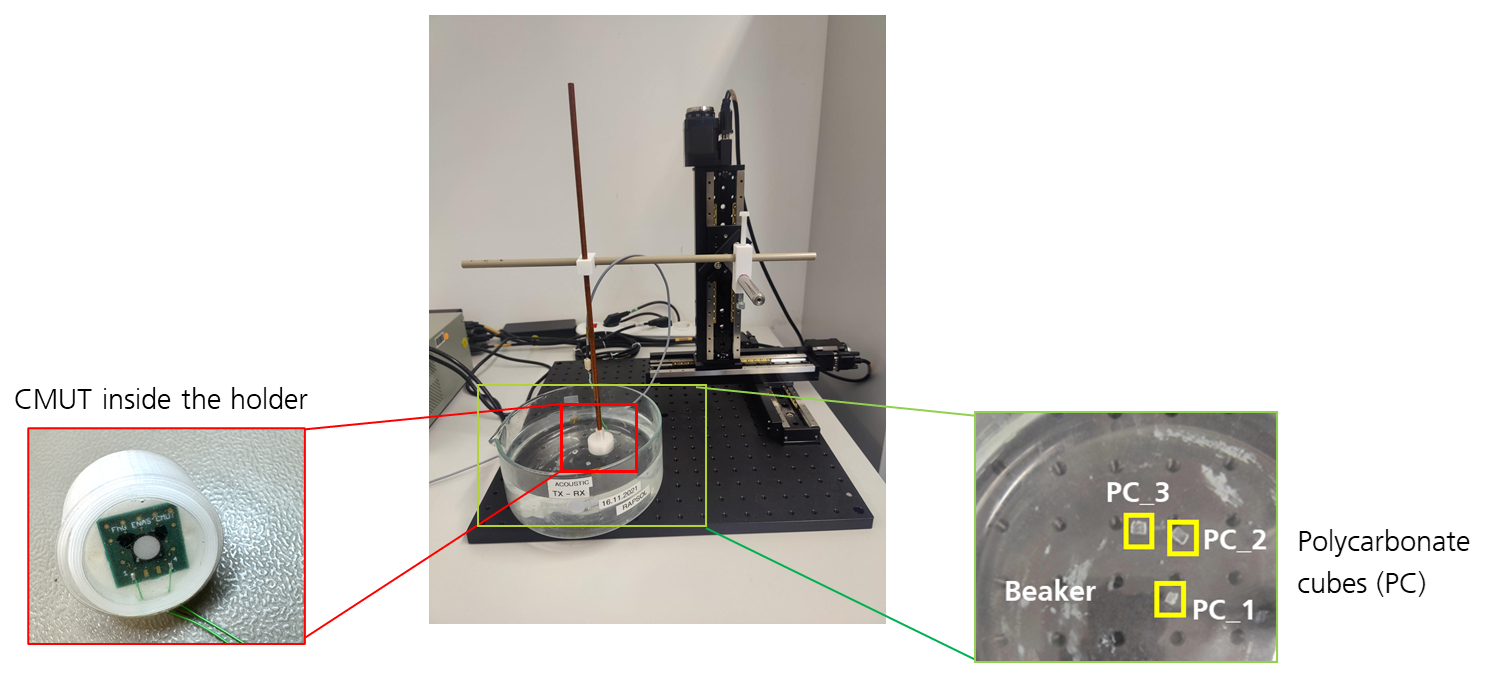
Figure 5Experiment setup to test the resolution of the CMUT, with an enlarged image of polycarbonate cubes of size 4×4 mm in a glass beaker.
4.2 Resolution as a function of distance and object size
To investigate how the resolution of the CMUT is affected by distance, this experiment was conducted using a hex nut with a thickness of 2.5 mm and a length of 5.45 mm. The CMUT was positioned facing downward toward the object and was incrementally moved upward along the z axis using the XYZ stage. The experiment setup, with enlarged images of the test object and CMUT, is shown in Fig. 6. Starting from the initial position (0, 0, 0), the height was increased in 5 mm steps until (0, 0, 45), with data being recorded at each step.
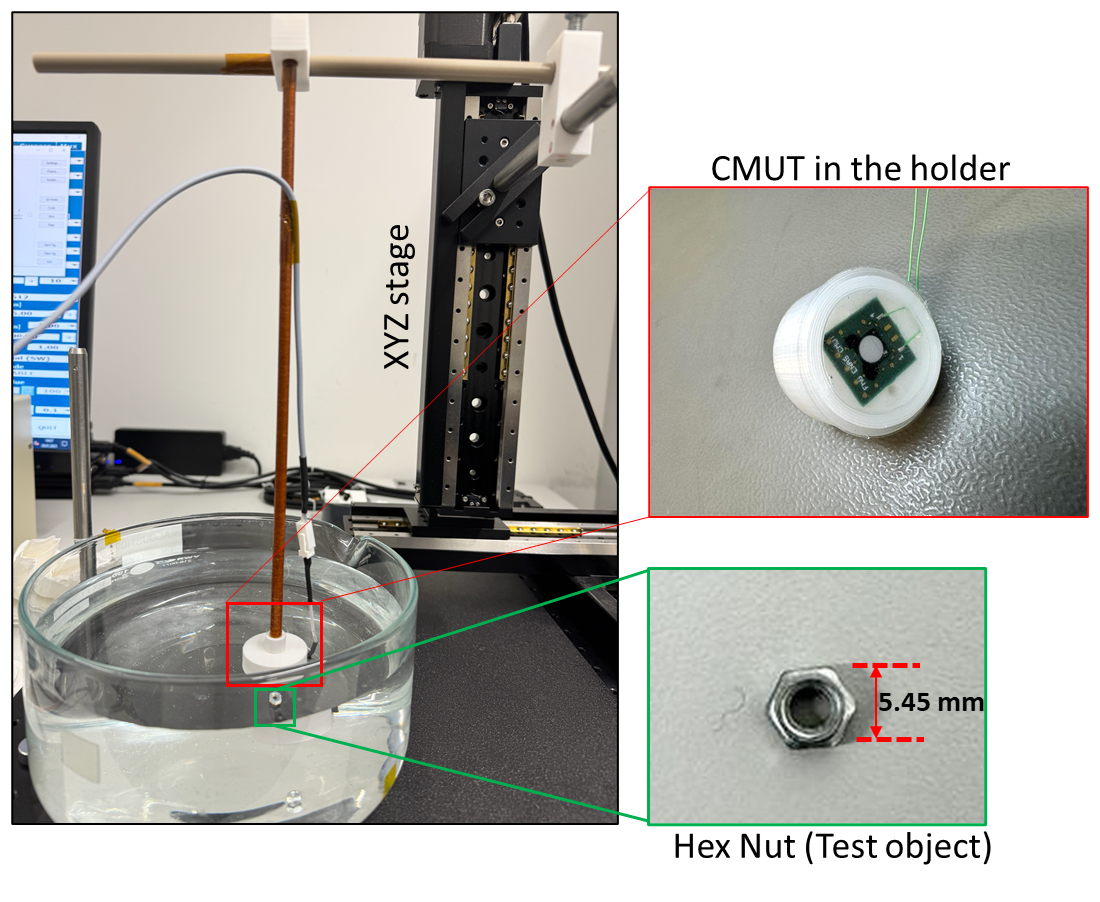
Figure 6Test setup to measure resolution as a function of distance, with enlarged image of the hex nut and CMUT.
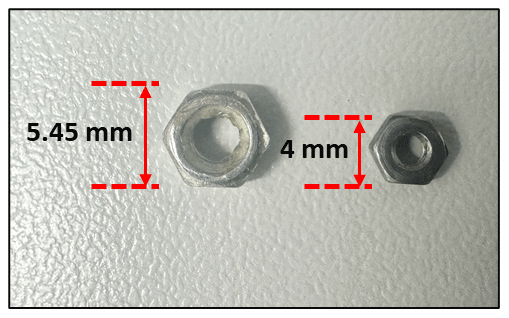
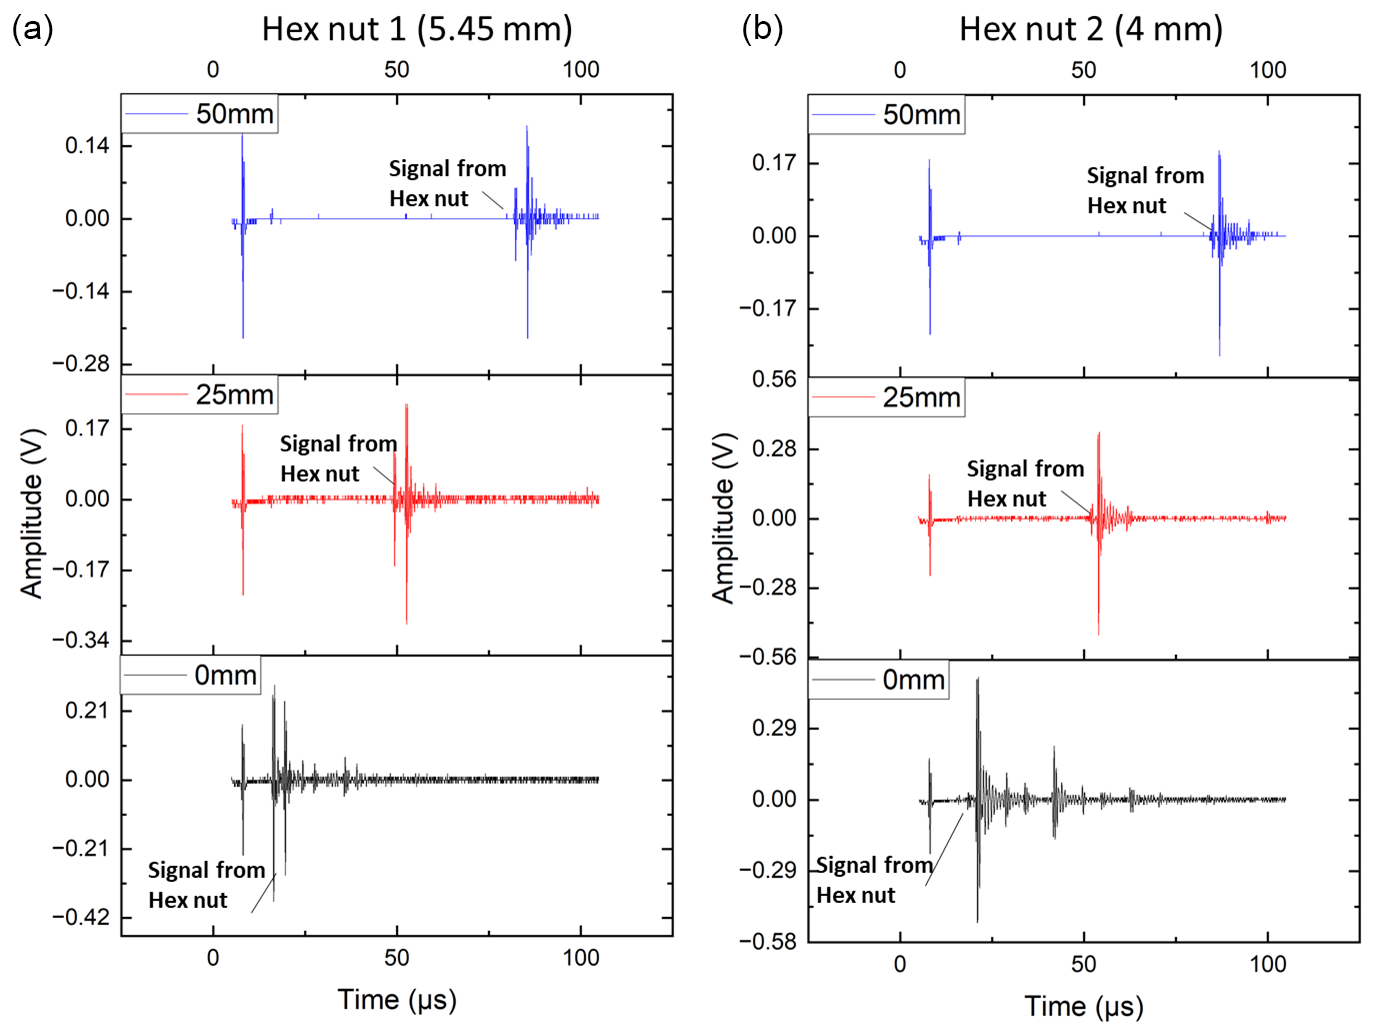
To examine the effect of object size on resolution, the experiment was repeated using a smaller hex nut measuring 4 mm in length and 1.5 mm in thickness. Pulse echo responses were recorded at three measurement points: 0 mm (minimum distance), 25 mm, and 50 mm. For comparison, the larger hex nut with a 5 mm length (used previously) was also tested under the same conditions, allowing for direct evaluation of size-dependent resolution changes. Figure 7 shows the two hex nuts.
4.3 Topography mapping
To test the ability of the CMUT for topography mapping, the CMUT was moved in controlled steps using an automated XYZ stage over the 3D-printed test objects, and data were captured at each step. Two 3D structures as shown in Fig. 8 were designed and printed to be used as test objects. The first test object was an irregular structure containing protrusions of varying heights (10, 15, 20 mm) on a 5 mm base. The CMUT was moved linearly over the test object, and a total of 30 data points were recorded. A Python script was designed to analyze the pulse echo data obtained from the CMUT as it moves across the object. It plots the time-of-flight (ToF) values against the positions along the scan, facilitating the interpretation and analysis of the object's dimensions. To further explore this ability, the second test structure was designed, containing 3D representation of the letters “E”, “N”, “A”, and “S”. First, the letter E was mapped, and the acquired data were then processed through a Python script to visualize the responses in a 3D contour plot. The image on the left side of Fig. 9 shows the grid pattern (with x, y coordinates) in which the CMUT was moved and from which the data were captured for the letter E. In order to improve the measurement accuracy, the number of grid points was increased to map the letter N, as shown in the image on the right side of Fig. 9. The acquired data were then processed similarly to render a 3D contour plot.
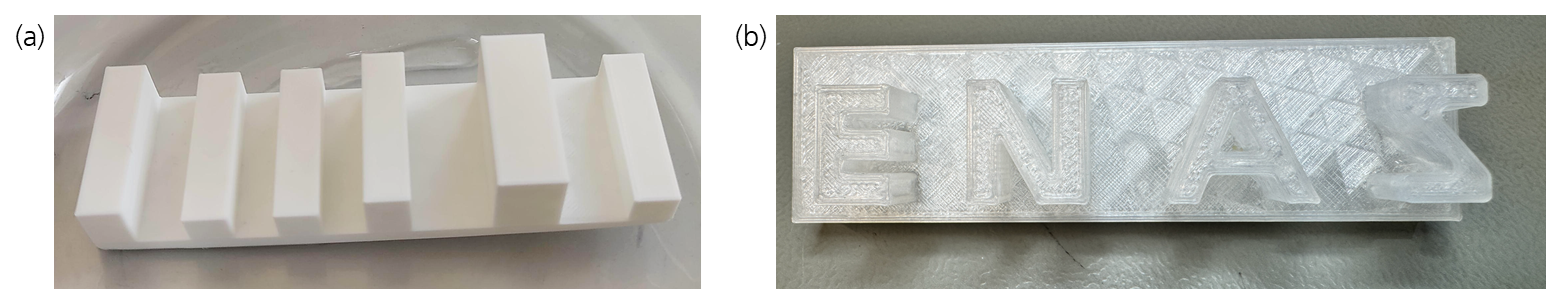
Figure 8The 3D-printed test objects. (a) Irregular structure and (b) 3D representation of letters.
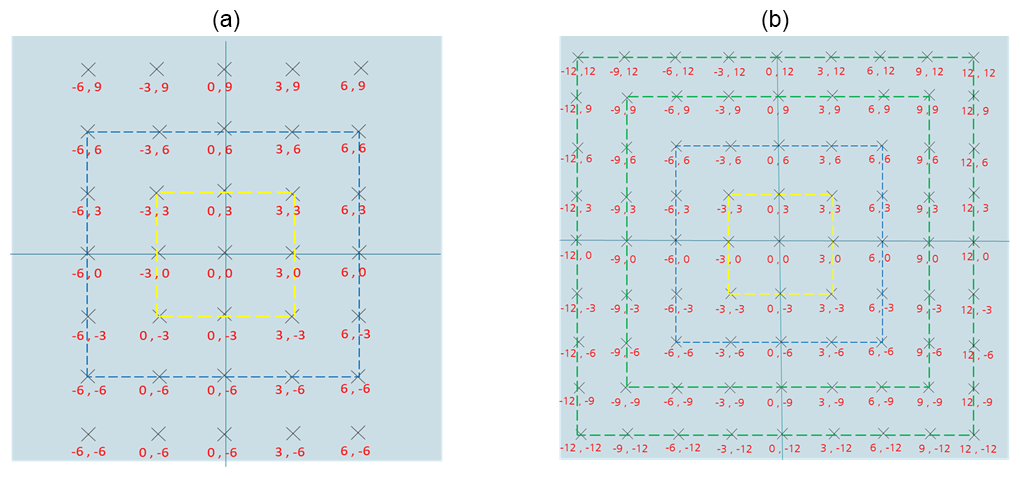
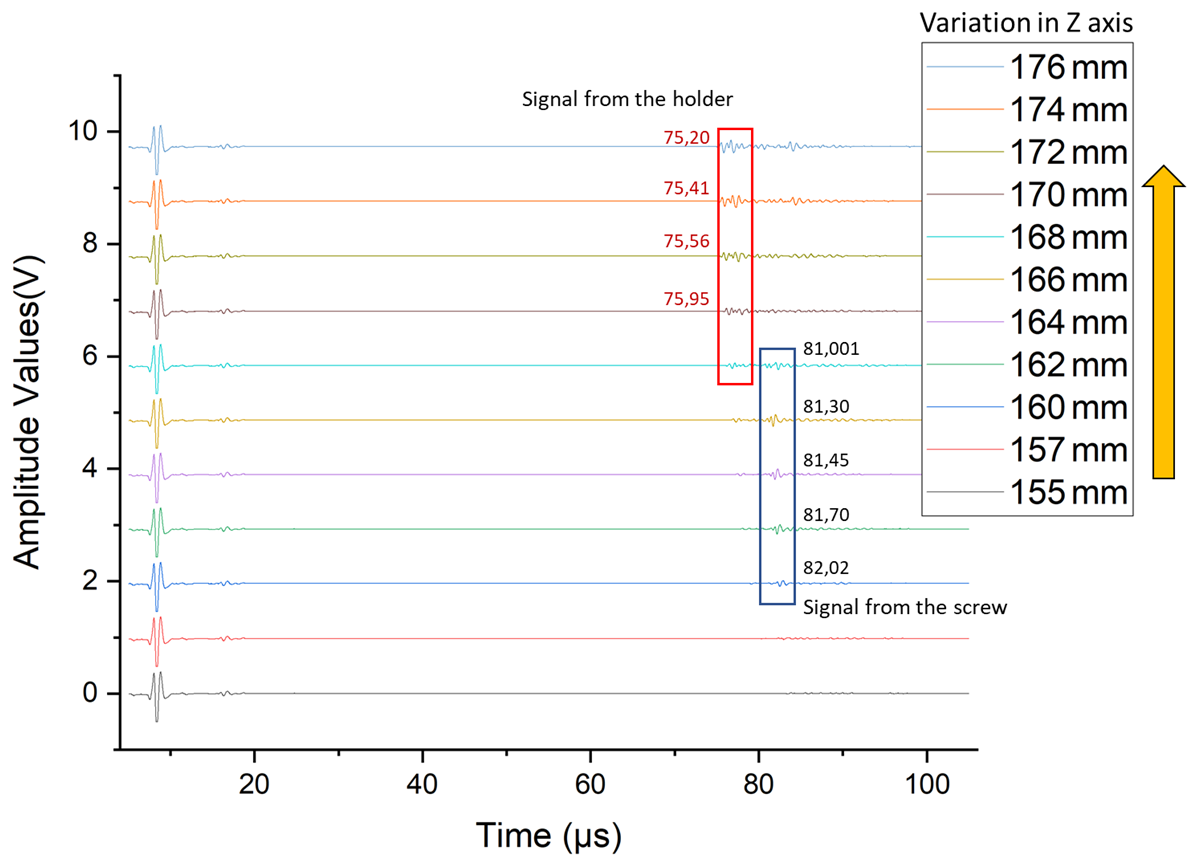
Figure 10Pulse echo response obtained from the 8 mm screw and its holder at various positions along the z axis.
5.1 Resolution results
To evaluate the minimum detectable object size, an experiment was conducted using a screw measuring 8 mm in length and 2.9 mm in diameter. The screw, mounted on a holder, was incrementally moved along the z axis in 2 mm steps, from (28, 70, 155) mm to (28, 70, 202) mm, while recording pulse echo responses. Figure 10 shows the stacked pulse echo signals collected at each position. The first detectable echo from the screw appeared at a z position of 160 mm and persisted until 166 mm. Beyond this point, echoes from the larger holder structure became dominant. In the pulse echo plots, the screw’s reflection was observed at around 81 µs, while the holder's stronger echo appeared earlier at approximately 75 µs. These results demonstrate that the CMUT is capable of detecting small objects (as small as 8 mm) and provides pulse echo responses that span the physical length of the object, thereby confirming its high resolution and sensitivity.
To conduct a more comprehensive analysis of the resolution aspect of the CMUT (in terms of the smallest detectable object size), three polycarbonate cubes measuring approximately 4×4 mm each were selected as test objects. The three pulse echo responses of the CMUT when it was directly above the cubes and one away from them and facing only the beaker are shown in Fig. 11. The results clearly demonstrate distinguishable echo signals from the polycarbonate cubes. The echo signals from the cubes are marked in rectangular boxes which are followed by the signal from the beaker. It can be seen that the echo pulses from the cubes appear in the time range of 64–66 µs, which is significantly earlier than the echo from the beaker, which appears at 69 µs, hence proving the CMUT's ability to detect and distinguish objects as small as 4×4 mm (length × breadth), marking the resolution of the CMUT at 4 mm. It is important to note that this resolution value could potentially be even better and is yet to be tested.
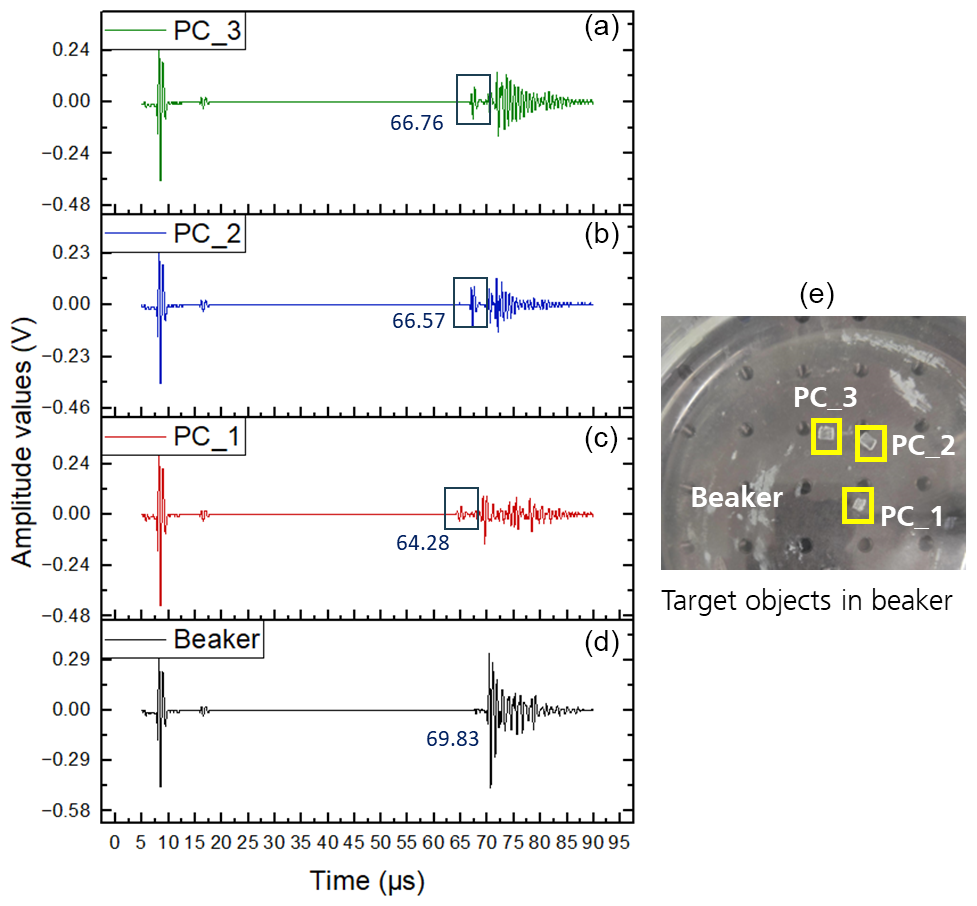
Figure 11Pulse echo response obtained from the three polycarbonate cubes and the bottom of the beaker for reference, along with an image of the target objects.
5.2 Resolution as a function of distance and object size
To investigate the resolution as a function of distance, a hex nut was used as test object, and the CMUT data were collected at different distances above it. The pulse echo responses obtained from the CMUT at each distance are shown in Fig. 12. The signals marked in the circles are received from the hex nut, and the following peak is from the beaker. It can be seen from the plots that CMUT resolution remains unchanged in the distance range of 40 mm. While there is no change in the resolution with distance, the signal amplitude does decrease to some extent with increasing distance owing to the attenuation in the medium. The signal amplitude versus distance is also depicted in Fig. 12 (right).
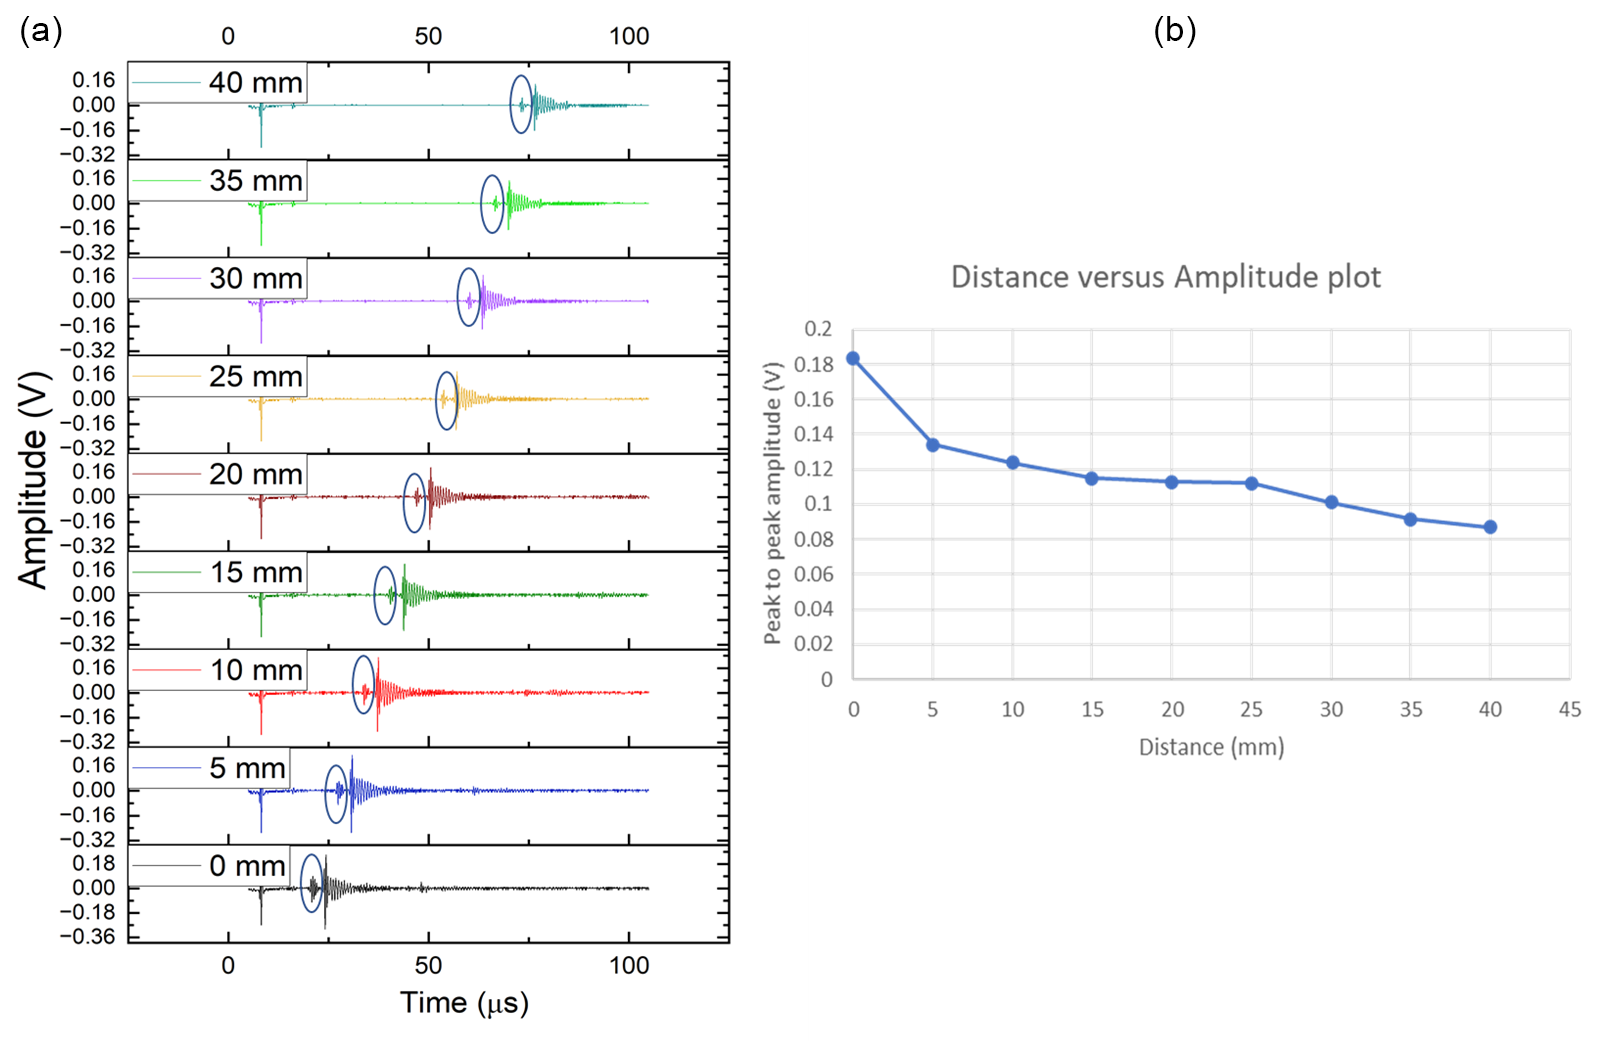
Figure 12Pulse echo response obtained from the hex at different distances (a) and a plot of distance from the object to the amplitude of the echo obtained (b).
To examine the impact of object size on resolution, two hex nuts measuring 5.45 and 4 mm were used as test objects. Measurements were taken at three positions, starting from a minimum distance of approximately 1 cm from the CMUT (taken as 0 mm start position) and extending up to 50 mm. The results presented in Fig. 13 indicate that resolution remains consistent within the tested range (50 mm), demonstrating good accuracy in terms of resolution.
5.3 Topography mapping results
To analyze the received CMUT signals obtained from the linear scan of the irregular structure with varying heights, a Python script was written that takes the receive signal data and identifies the ToF value of the echo pulse using a rising-edge detection function. Based on this value, the distance is computed using Eq. (1), where the speed of sound in water is taken to be 1500 m s−1 assuming a constant water temperature (experiment conducted at room temperature).
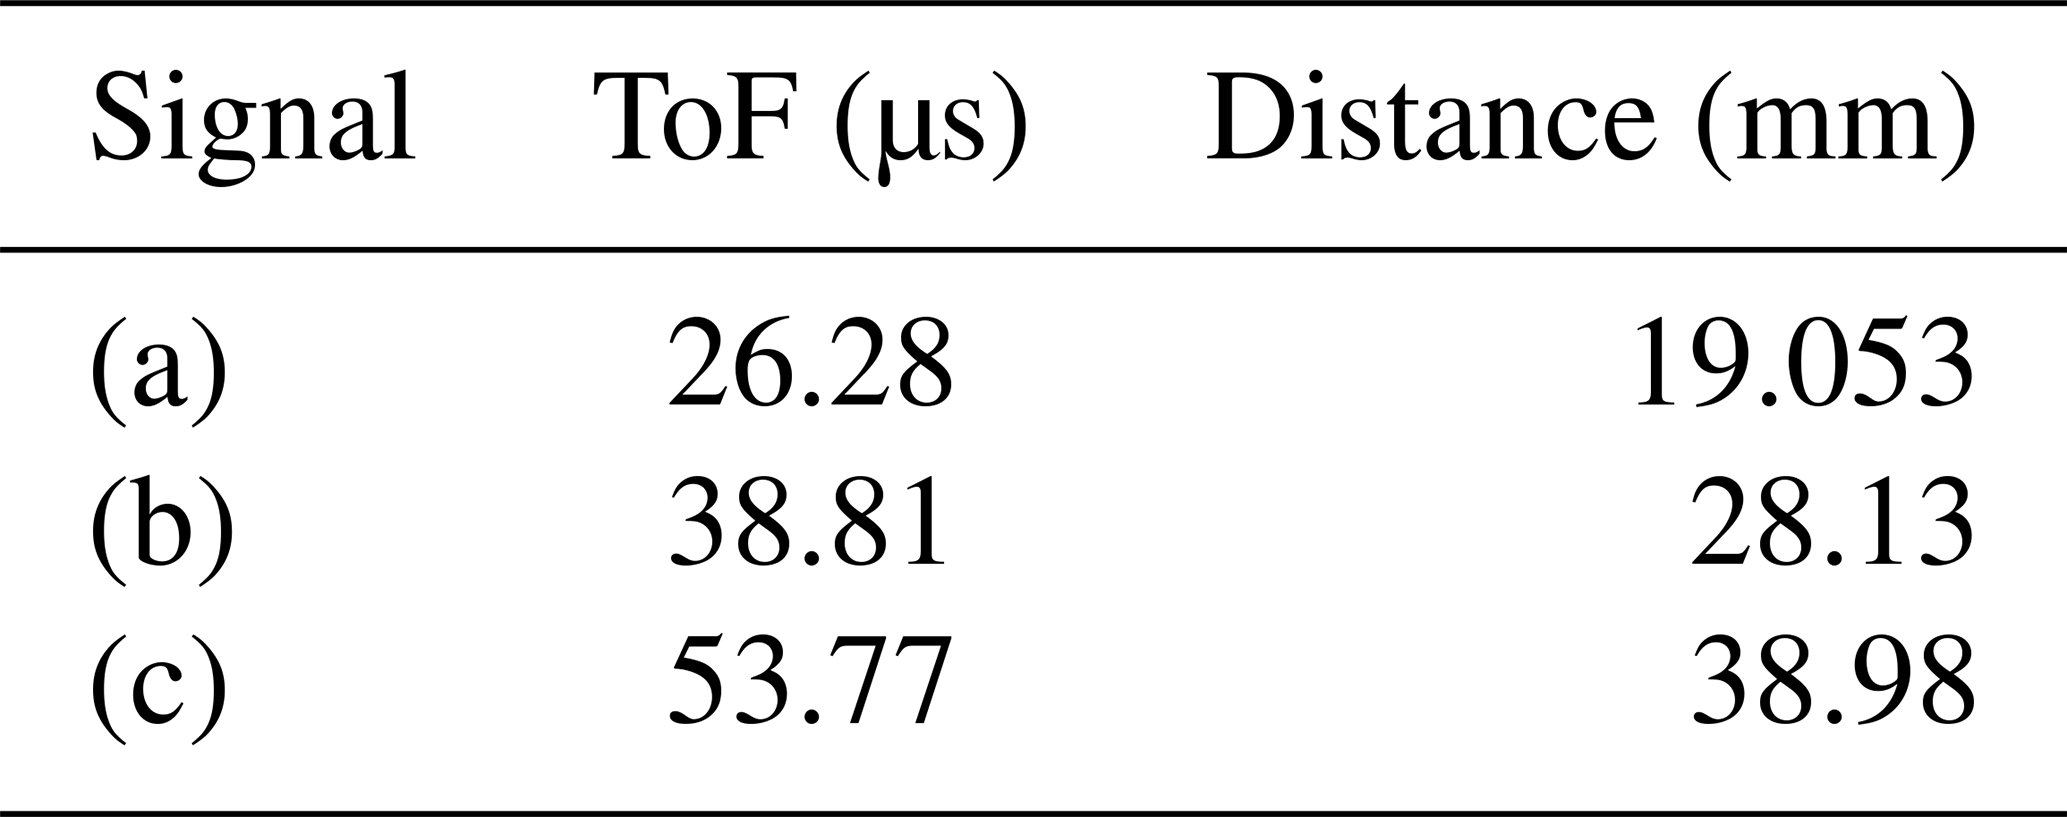
The result of the Python script yielded a plot of depth (computed distance from the CMUT to the object) versus the distance traversed along the x axis (Fig. 14), which closely reproduced the test structure and its dimensions, proving the CMUT's ability for topography mapping. Minor discrepancies were observed, likely due to the mounting of the test object on an uneven container surface or due to limited measurement points. Increasing the measurement points could enhance the reconstruction accuracy. To further analyze this ability, the test structures with a 3D representation of letters were used. The letters were situated on a 10 mm thick base structure and were individually mapped by the CMUT. These signals were then processed through a Python script that sequentially reads measurement data at each point, identifies the peak-to-peak voltage of the signal, and associates it with the corresponding coordinate on the grid. Subsequently, these data are visualized through both 3D contour plots for enhanced interpretation. The initial mapping focused on the letter E, which measured 16×10.7 mm2, with a distance of 2.81 mm between its arms. A total of 35 measurements were taken to cover the test structure. Pulse echo responses, along with their corresponding ToF readings obtained at the coordinates (0, 0), (0, 9) and from the beaker for reference, are depicted in Fig. 15. Signal (a) represents the top surface of the 3D alphabet, signal (b) corresponds to the top surface of the base plane, and signal (c) depicts the beaker (with the CMUT moved away from the test structure). For a preliminary analysis of the results, ToF values were identified from the plots manually using a data analysis and plotting software. These values were then used to compute the distance values using Eq. (1) as described previously and are shown in Table 1. Preliminary analysis of the obtained data revealed that the difference between the computed distance values of signal (a) and (b) is approximately 9 mm closer to the thickness of the 3D letter E (10 mm), and the difference between signal (c) and signal (b) is approximately 10 mm, corresponding to the thickness of the base structure (10 mm). This proves the ability of the CMUT for dimension mapping.
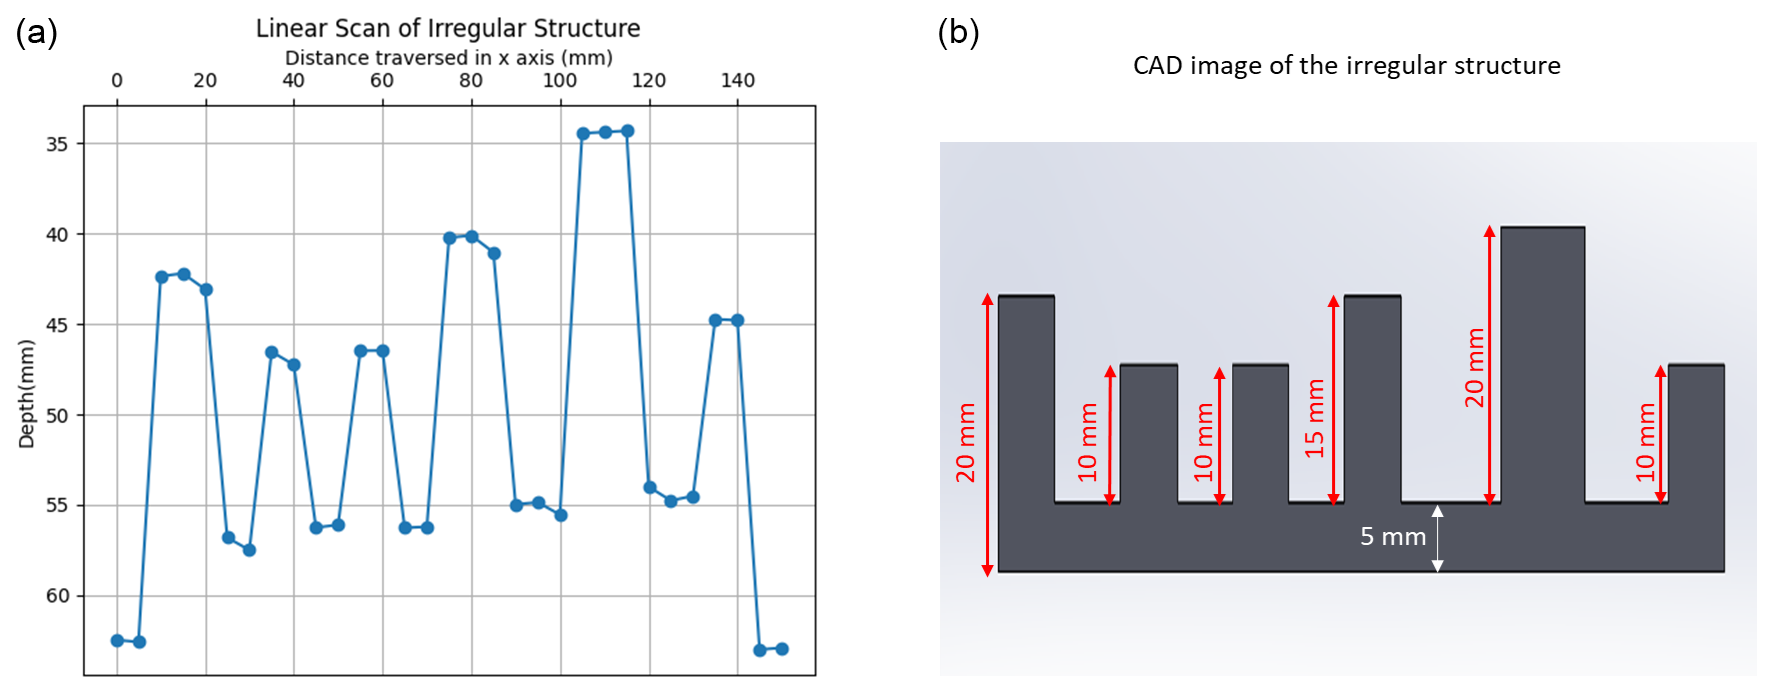
Figure 14(a) Plot of depth versus distance traversed along the x-axis and (b) CAD image of the object with dimensions for reference.
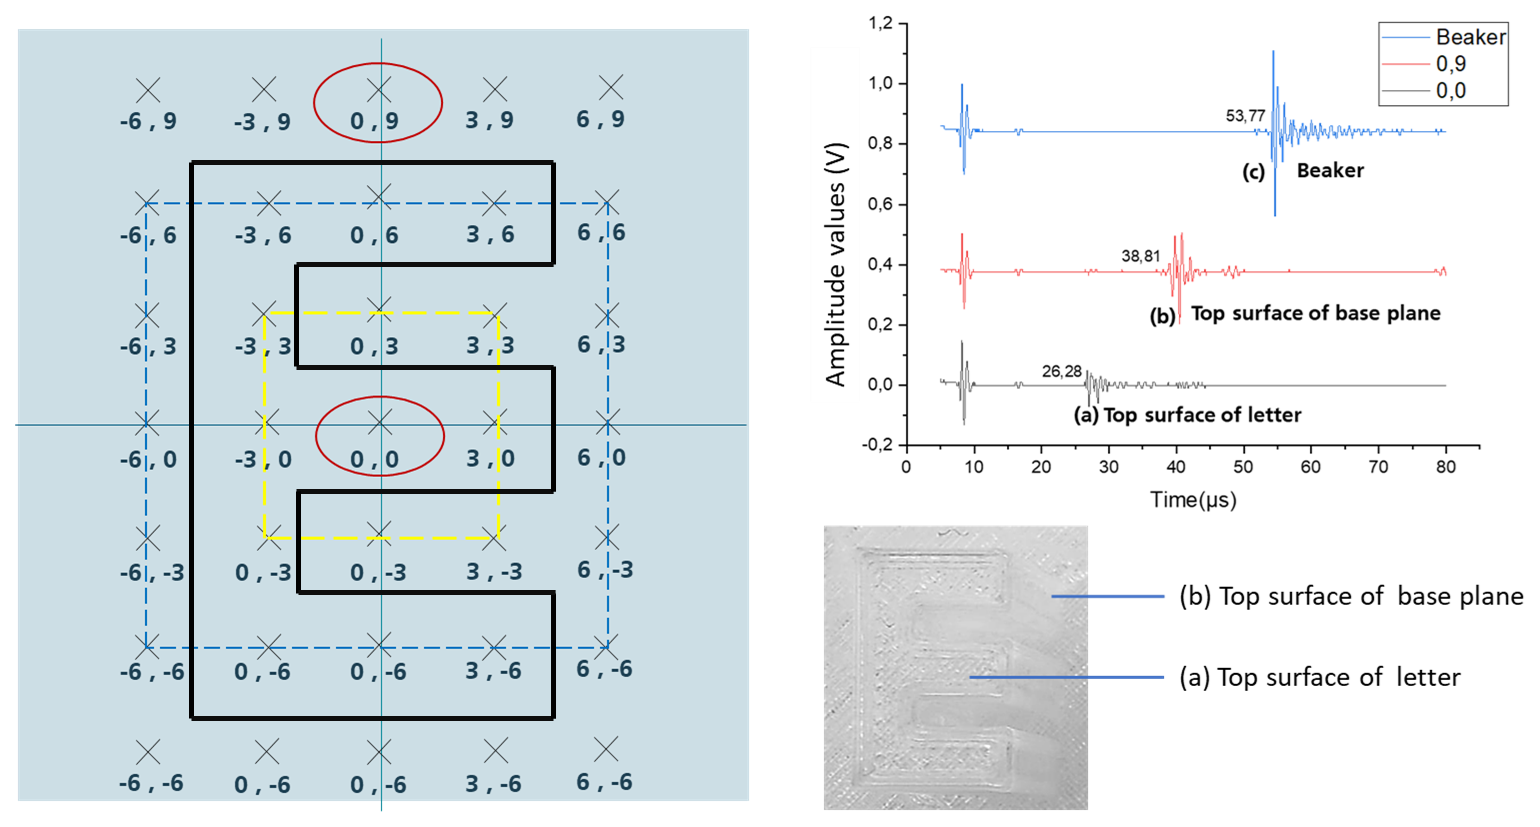
Figure 15Pulse echo measurements obtained over letter E at the coordinates (0, 0), (0, 9) and also from the beaker for reference.
Table 1ToF values and computed distances obtained from pulse echo measurements of letter E.
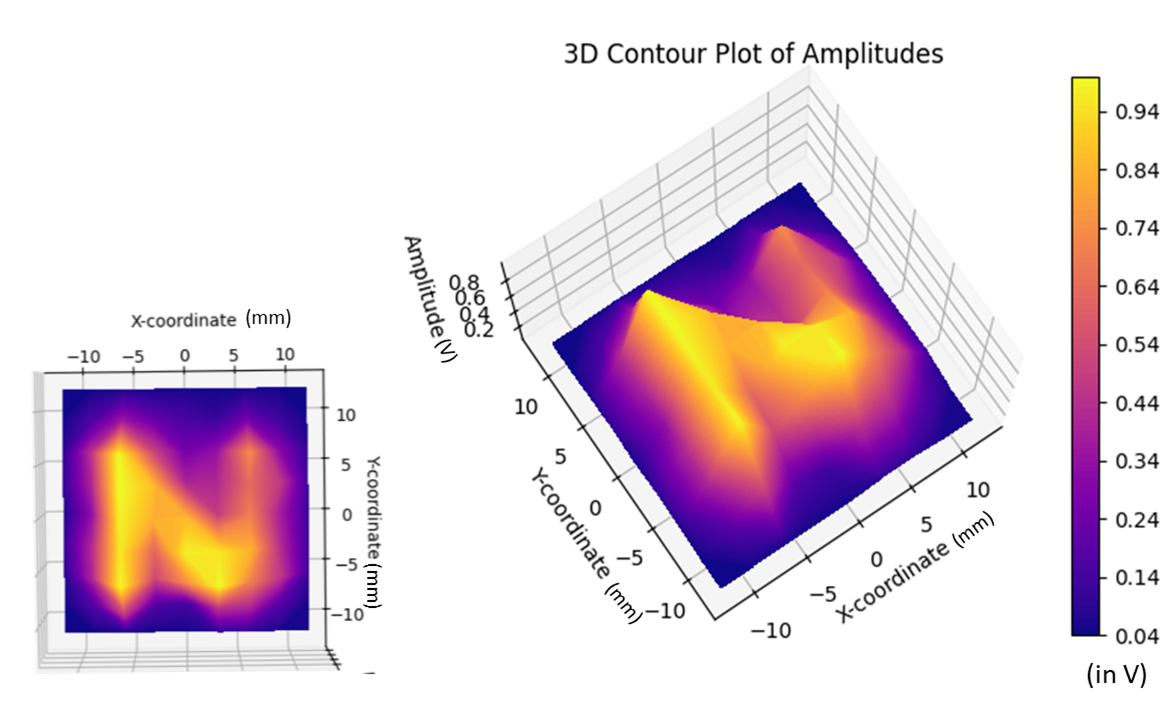
To visualize these data, a Python script was used to compute and plot the peak-to-peak amplitude of these response signals using the greatest amplitude method and to map them to their respective coordinates. The resulting 3D and 2D plots are shown in Fig. 16. The plot reveals a distinct structure resembling the letter E, yet some discrepancies are evident, likely due to the limited number of measurement points in the data collection process. Given the narrow 2.8 mm spacing between the arms in the structure E and the 3 mm measurement step, the arms are not clearly distinguishable. To enhance the results, the second letter, N, was mapped with increased measurement points. Subsequently, the data were processed using the Python script to generate a 3D plot of amplitudes, as illustrated in Fig. 17. The 3D plot exhibited an improved replication of the letter N due to both an increased number of measurement points and the inherent simplicity of the letter's structure itself.
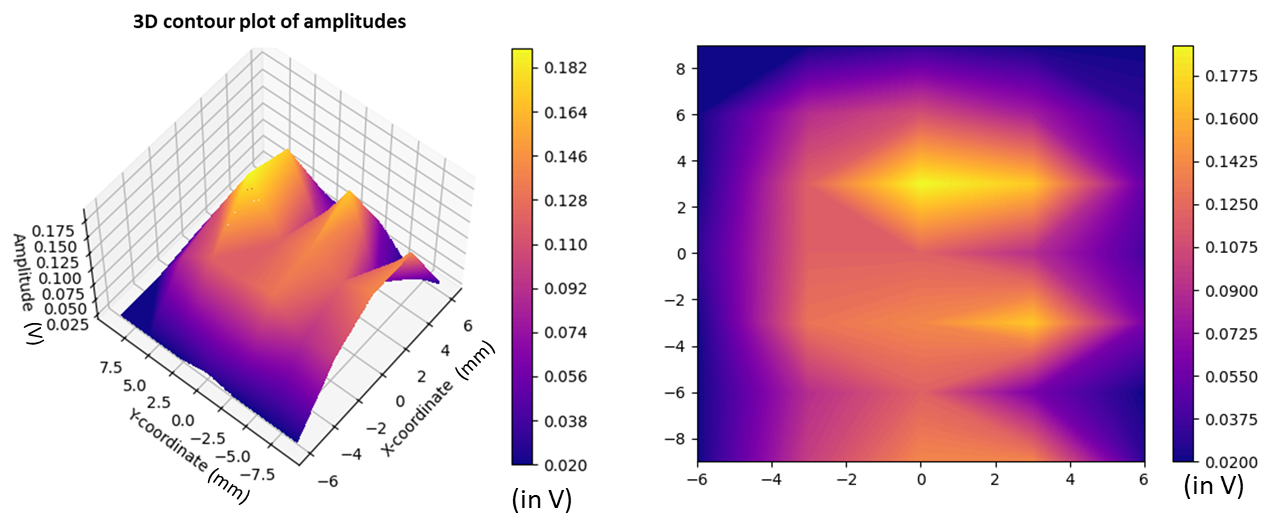
Figure 16Contour plots of pulse echo responses of the letter E as processed by the Python script.
The results of this study demonstrate the potential of CMUTs for high-resolution underwater imaging in short-range applications, particularly in shallow-water environments. The experimental findings confirmed the wide bandwidth of CMUTs and their ability to detect various objects precisely, including those made of transparent materials. Notably, CMUTs successfully detected small objects down to millimeter-scale dimensions, achieving high-resolution imaging. Additionally, topographic mapping experiments validated CMUTs' capabilities to accurately reconstruct the dimensions of structures, generating 3D representations of complex shapes, such as alphabets. This highlights their potential for detailed surface mapping in applications like AUV and ROV navigation, as well as submerged-infrastructure inspection. While the current detection range is confined to controlled lab conditions, the results demonstrate significant potential for further development of CMUTs in shallow-water underwater sensing applications. CMUT technology is not yet a replacement for existing underwater sensor modalities; however, its advantages in terms of miniaturization, integration, and high-resolution imaging would make it a compelling choice for several underwater applications. Future work will focus on scaling up the system by enhancing transducer performance, integrating small-size driving electronics into a portable system, optimizing signal processing, and exploring alternative packaging methods to enable various underwater deployments.
The authors wish to note that the data were acquired using a commercial pulser–receiver in a proprietary format, and the associated code was specifically developed for processing this format. As both the data and code remain integral to ongoing projects, and in order to avoid potential misinterpretation, they are not made publicly available at this stage.
NS and KS designed and fabricated the CMUTs and supported the paper preparation. KS encapsulated the CMUTs for underwater use. MV planned and executed the experiments, analyzed the data, and prepared the paper. NS, KS, MW, and HK supervised the work and revised the paper.
The contact author has declared that none of the authors has any competing interests.
Publisher's note: Copernicus Publications remains neutral with regard to jurisdictional claims made in the text, published maps, institutional affiliations, or any other geographical representation in this paper. While Copernicus Publications makes every effort to include appropriate place names, the final responsibility lies with the authors.
This article is part of the special issue “Sensors and Measurement Systems 2024”. It is a result of the 22. GMA/ITG Fachtagung Sensoren und Messsysteme 2024, Nuremberg, Germany, 11 to 12 June 2024.
The authors wish to thank the Center for Microtechnologies at Chemnitz University of Technology for their support with the fabrication of the transducers.
This research has been supported by the Fraunhofer-Gesellschaft (grant no. SME MAPMIND).
This paper was edited by Andreas Schütze and reviewed by two anonymous referees.
Burguera, A. and Oliver, G.: High-Resolution Underwater Mapping Using Side-Scan Sonar, PLoS ONE, 11, e0146396, https://doi.org/10.1371/journal.pone.0146396, 2016. a
Caccia, M., Bibuli, M., Bono, R., Bruzzone, G., Bruzzone, G., and Spirandelli, E.: Unmanned Surface Vehicle for Coastal and Protected Waters Applications: the Charlie Project, Mar. Technol. Soc. J., 41, 62–71, https://doi.org/10.4031/002533207787442259, 2007. a
Cai, C.: The applications of sonar and radar systems in underwater detection, Appl. Comput. Eng., 37, 254–258, 2024. a
Filisetti, A., Marouchos, A., Martini, A., Martin, T., and Collings, S.: Developments and applications of underwater LiDAR systems in support of marine science, in: OCEANS 2018 MTS/IEEE, 22–25 October 2018, Charleston, 1–10, https://doi.org/10.1109/OCEANS.2018.8604547, 2018. a
Hurtós, N., Palomeras, N., Carrera, A., and Carreras, M.: Autonomous detection, following and mapping of an underwater chain using sonar, Ocean Eng., 130, 336–350, https://doi.org/10.1016/j.oceaneng.2016.11.072, 2017. a
Li, Z., Yuan, J., Li, J., Zhao, Y., and Qin, S.: Modeling and Optimization of CMUTs Arrays for Improved Transmission and Reception Performance in Immersion, IEEE Sensors J., 24, 7548–7563, https://doi.org/10.1109/JSEN.2024.3355102, 2024. a
Oralkan, O., Ergun, A. S., Johnson, J. A., Karaman, M., Demirci, U., Kaviani, K., Lee, T. H., and Khuri-Yakub, B. T.: Capacitive micromachined ultrasonic transducers: Next-generation arrays for acoustic imaging?, IEEE Trans. Ultrason. Ferroelectr. Freq. Control, 49, 1596–1610, https://doi.org/10.1109/TUFFC.2002.1049742, 2002a. a
Oralkan, O., Ergun, A. S., Cheng, C.-H., Johnson, J. A., Karaman, M., and Khuri-Yakub, B. T.: Underwater acoustic imaging using capacitive micromachined ultrasonic transducer arrays, in: OCEANS '02 MTS/IEEE, 4, 29–31 October 2002, Biloxi, MI, USA, 2354–2360, https://doi.org/10.1109/OCEANS.2002.1191996, 2002b. a
Saeidi, N., Selvam, K. F. R. G. M., de Souza Tortato, F., Satwara, M., and Wiemer, M.: Characterization of Capacitive Micromachined Ultrasound Transducer (CMUT) for Targeted Applications in Harsh Environments, in: Proceedings of the 2021 IEEE 34th International Conference on Micro Electro Mechanical Systems (MEMS), 25–29 January 2021, Gainesville, FL, USA, 903–906, https://doi.org/10.1109/MEMS51782.2021.9375331, 2021. a
Saeidi, N., Selvam, K., Tortato, F., Wiemer, M., and Kuhn, H.: High Precision Liquid Level and Leak Detection Based on Capacitive Micromachined Ultrasound Transducer, SSI, 1–5, https://doi.org/10.1109/SSI56489.2022.9901430, 2022. a
Song, J., Xue, C., He, C., Zhang, R., Mu, L., Cui, J., Miao, J., Liu, Y., and Zhang, W.: Capacitive Micromachined Ultrasonic Transducers (CMUTs) for Underwater Imaging Applications, Sensors, 15, 23205–23217, https://doi.org/10.3390/s150923205, 2015. a
Stinco, P., Tesei, A., and LePage, K. D.: Unsupervised active sonar contact classification through anomaly detection, EURASIP J. Adv. Sig. Process., 59, https://doi.org/10.1186/s13634-023-01016-z, 2023. a
Zhang, R., Zhang, W., He, C., Zhang, Y., Song, J., and Xue, C.: Underwater Imaging Using a 1×16 MUT Linear Array, Sensors, 16, 312, https://doi.org/10.3390/s16030312, 2016 a