the Creative Commons Attribution 4.0 License.
the Creative Commons Attribution 4.0 License.
 | 12 May 2025
A versatile development platform for odor monitoring systems
Maximilian Koehne
Omar Tarek Penagos Carrascal
Michael Czerny
Tilman Sauerwald
The measurement of odors offers a high potential for non-destructive, on-line, real-time quality monitoring of many different products, such as food and cosmetics. Although numerous laboratory devices are capable of such odor measurements, required laboratory background and trained workers prevent the widespread use of such devices in the industry and in public. Hence, cheap and commercial instrumental odor monitoring systems (IOMSs) are needed. To ensure a timely and cost-effective experience during the development of such IOMSs, a gas chromatography selective odorant measurement sensor array (GC-SOMSA) combining three detector ports (a mass spectrometer, an odor detection port, and a sensor chamber) is set up as an element of a structured development concept for IOMSs. This device is tested with a commercially available sensor and spiked sunflower oils, which emulate odor-active oxidation of fatty oils that occur during oil aging in food or cosmetics. The sensor was able to detect pentane (4 µL 100 mL−1) and the odor-active oxidation markers hexanal (1.4 µL 100 mL−1) and octanal (8.2 µL 100 mL−1) within a sunflower oil matrix. When applying different sensor temperatures, the sensor was able to detect a more intense signal for hexanal than for pentane at 250 °C. Furthermore, it was found that the (siloxane) protective membrane of the sensor discriminates between different molecules. This has an influence on the synchronicity of the detectors by adding a possible time offset to the sensor signals. This offset could be considered by forming the first derivative of the sensor signal. The odor detection port measurements revealed a weak odor impression at calculated target concentrations. For 10 and 100 times higher concentrations, hexanal (grassy) and octanal (citrus-like) could be detected. All three detectors were in parallel, and odor impressions could be assigned to mass spectrometer and sensor peaks. Thus, the sensor could be characterized sufficiently and is suitable for detecting odor-active compounds in the fat oxidation of a fatty matrix. The GC-SOMSA can be used in the future as an element of a structured IOMS development concept since it can be extended to a wide range of applications for rapid sensor characterization and, due to the flexible design of the sensor chamber, for many different sensors.
- Article
(3902 KB) - Full-text XML
-
Supplement
(3401 KB) - BibTeX
- EndNote


The measurement of odor and volatile compounds can play a significant role in industrial and quality monitoring processes, especially for food products. Thereby, odor consisting of odor-active volatile organic compounds (VOCs) can be used as an indicator of quality. A well-known example is the use of odor for the indication of food spoilage (Costello et al., 2003; Costello et al., 2000; Joppich et al., 2022); hence, its detection can be used to identify spoiling food to prevent it from contaminating other foods in storage. Further, odor can be used to evaluate the different qualities of foods (Poghossian et al., 2019; Rusinek et al., 2020). As humans perceive and evaluate their environment partly by odorants (Oleszkiewicz et al., 2021; Proserpio et al., 2017), the quality of non-food products can be evaluated by its odor in addition. For instance, recycled plastics should not have an off-odor (Reimringer et al., 2024) when used further as raw material (Prado et al., 2020). In addition, odor pollution becomes more important, as industrial plants or agricultural sources may release off-odors into residential areas (Laor et al., 2014). Objective and continuous long-term measurements are necessary to target these versatile applications. However, the detection of odors faces a few challenges. First, odor is defined as a (subjective) interpretation of the sensory stimuli provided by chemoreceptors of the (human) nose (VDI/VDE 3518 part 3, 2018) and can therefore not be measured quantitatively. Furthermore, human odor perception differs for each individuum as sensitivities are different, perception depends on the individual, and anosmia might occur (Keller et al., 2007). An objective generalization is hard to realize. Moreover, odor is not directly correlated with the concentration of single compounds. First, an odor can consist of a single or many different components in a characteristic composition. Second, a component with a very low concentration can also cause a very strong odor impression, while components with a high concentration might have no odor impression on humans (Czerny et al., 2008). A solution to this issue is the combination of chemical entities and physiological odor impressions for the measurement of odors (Wang et al., 2023). For example, common odor measurements use humans (often trained panels) as a physiological reference in combination with instrumental analysis as in the case of olfactometers and field olfactometers (Motalebi Damuchali and Guo, 2019). They offer odor samples in various dilution stages to trained human panels, who evaluate the intensity of the odor impression. However, this method does not consider the measurement of chemical entities such as concentrations of single compounds. Therefore, another way for the measurement of odor impressions and chemical entities of such complex gas mixtures is gas chromatography (GC) – mass spectrometry (MS) coupled with olfactometry (O) (Mahmoud and Zhang, 2024; Song and Liu, 2018). In there, an odor detection port (ODP) is coupled to the GC in parallel with a MS, which allows for a detection of the odor impression of an eluting substance together with its mass. Unfortunately, conventional GC-MS/O is laboratory-based and requires trained personnel, which makes it complex and expensive. This method is therefore not suitable for in-field applications such as in-line and/or on-line odor analysis. To make such measurements possible, small and inexpensive instrumental odor monitoring systems (IOMSs), which enable measurements for in-field applications, are needed.
Metal oxide semiconductor sensors (MOS sensors) are promising detectors to build low-cost IOMSs for such applications, as they are inexpensive and commercially available and offer high sensitivity towards a variety of oxidizing and reducing gases. High sensitivity towards many gases unfortunately also leads to limited selectivity. Since some odorants are odor-active at low concentrations and need to be measured against a high concentration of non-odor-active compounds, a simple headspace measurement with a sensor, offering such limited selectivity, is not suitable for odor identification. Hence, evaluation models must be developed and tested prior to the system development, or additional chromatographic separation units must be installed upstream of the sensors, to achieve clear differentiation between individual markers. In addition, a previous sensor characterization towards the target analytes needs to be done to identify suitable sensors and operation modes for sensors. As this needs to be done for every new approach, it increases the development time and costs of IOMSs, limiting them from being used in the field. A solution to this problem is to structure and standardize the development of IOMSs and thus create a development platform for such systems (Zeh et al., 2022). The gas chromatography selective odorant measurement sensor array (GC-SOMSA) can function as an element of such a development platform. The GC-SOMSA was first developed in 1997 by Hofmann and colleagues. In there, a sensor array of seven sensors placed in a 1.8 mL brass chamber is connected to a gas chromatograph in parallel with a flame ionization detector (FID). The sensor response to corresponding test measurements, desired by required applications of the pre-selected sensors, can be considered thereout. This allows for a characterization of the sensors with respect to their signal response to the eluting volatile markers (Kohl et al., 2000; Hofmann et al., 1997). In addition, the direct measurement of a sample can be used to assess whether a separation unit is required or whether sensors are already sufficiently selective for the desired application, e.g., only due to their different reaction properties to individual markers and interfering substances. Moreover, for sensor arrays, a direct comparison between the used sensors is possible to find a sensor which is best suited for the desired application. An additional ODP would allow for the detection of odor-active compounds even if their concentration is low and interfering compounds with much higher concentration might be present as well. Using a MS instead of a FID could allow for a parallel identification of compounds via mass traces. Thus, a GC-SOMSA based on a MS and an ODP is a useful development platform for inexpensive and sensor-based IOMSs.
In this work, a GC-SOMSA system consisting out of a conventional GC-MS, an additional ODP, and a sensor chamber with much smaller dead volume (0.025 mL) than reported previously is developed as an element of such a structured development concept. It is tested with aroma-active oxidation products of fat and characterized for its sensor response of a commercially available sensor and for the olfactory response. These oxidation products appear as a result of fat degradation, which is caused by light, oxygen, or microbial spoilage. In addition to the odor-active compounds, interfering compounds such as non-odor-active pentane can be produced in much higher concentrations as well (Belitz et al., 2012), making the detection of odor-active components such as hexanal more difficult. The results could be used to develop a low-cost monitoring system for fat quality and thus save ecological and economical resources by detecting potential quality loss of a product at an early stage.
The GC-SOMSA system is assembled of a conventional GC (Trace 1610 gas chromatograph; Thermo Scientific, USA), a MS detector (ISQ 7610 Single Quadrupole Mass Spectrometer; Thermo Scientific, USA) with an ODP (Thermo Scientific, USA), and a sensor chamber described earlier (Koehne et al., 2024). The sensor chamber was mounted onto an optional port provided by the manufacturer of the GC oven. The GC-MS system is operated with the software Chromeleon, version 7.3.2 (Thermo Scientific, USA). Electronics and software from Baur et al. (2018b) were used to control and read out the sensors (Baur et al., 2018b; Fuchs et al., 2021). The column setup consisted of a pre-column, a main column, and the corresponding restrictions downstream to the main column in front of the respective detectors. The pre-column, a deactivated fused silica (FS) column (3 m length, 0.25 mm inner diameter, ID; Agilent USA) served as a trap for contamination and connected the injector with the main column. A polar free-fatty-acid-phase (FFAP) FS column served as the main column (15 m length, 0.25 mm ID; Agilent, USA) for analyses. A UniFit connector (Chromatographie Handel Müller GmbH, Germany) combines the pre-column with the main column. Two Y splitters (CZT, Germany) were used in a row to connect the main column with the respective restrictions in front of each detector. The restrictions consisted of deactivated FS columns. Their dimensions were calculated according to Oliver Brieger using Eq. (1), the Hagen–Poiseuille equation for compressible fluids (Oliver Brieger, personal communication, 2020).
Qout corresponds to the flow out of a restriction; r corresponds to the radius; pin and pout correspond to the inlet and outlet pressure; L corresponds to the length of a restriction; and μ (T) corresponds to the dynamic viscosity of the used carrier gas, which depends on the temperature, T. Here, the restrictions need to be different, as the MS operates at reduced pressure (∼ 10−5 Pa), while the sensor chamber and the ODP operate at ambient pressure (1013.25 hPa). The generally used carrier gas flow of 1.7 mL min−1 is divided differently for each detector due to the different dimensions of the restrictions. Thereby, 1.0 mL min−1 is directed towards the MS, while 0.35 mL min−1 is directed towards the ODP, and another 0.35 mL min−1 is directed towards the sensor chamber. This was checked and confirmed with a mass flow meter (MFM; MKS Instruments, USA) that was mounted downstream of the sensor chamber. A schematic overview of the entire GC-SOMSA setup is depicted in Fig. 1.

Figure 1Schematic overview of the GC-SOMSA setup from (Koehne et al., 2024). S: sample, I: injector, GC: gas chromatography, FR: flow restriction, MS: mass spectrometer, and ODP: odor detection port.
2.1 Sensor chamber
In order to set up the sensor chamber and connect it with the GC system, several specific requirements must be fulfilled. The chamber must have a low dead volume, and it needs an oxygen supply; the chamber should be heatable and contain a cooling system for the electronics and finally be tested gas-tight. The low dead volume is necessary to avoid peak broadening and hence a lower resolution of the chromatogram. An oxygen supply is necessary as the GC systems operates with helium as its carrier gas to avoid column bleeding during high analysis temperatures. As MOS sensors operate under ionosorped oxygen on their surfaces, an oxygen supply is required, which can be solved with an oxygen containing make-up stream. Additionally, such a make-up stream can be used to sharpen the peaks within the sensor chamber. The sensor chamber needs to be heated to prevent condensation of less volatile compounds. As the increased temperature can affect the electronics, a cooling system is required to keep the electronics in regular manufacturing conditions. The gas tightness is mandatory as a leak can cause impurities. It can be controlled via a downstream mounted MFM. To develop a sensor chamber that fulfills all these requirements, a system based on the work of Baur et al. (2018b) was specifically designed for the GC-SOMSA. It consists of three basic parts. First, an aluminum substructure is serving as a connection unit for the column, the make-up flow, the MFM line, and the sealing screws. The column can be tightened via a small cylinder that is connected with a heated (RCF 200; Acim Jouanin, France) transfer line. A mass flow controller (MFC; MKS Instruments, USA) supplies a continuous make-up stream of 10 sccm synthetic air. A heating cartridge (RS Pro 860 7139; RS Components GmbH, Germany) with a commercial Pt100 resistor enables the chamber, especially the gas channels, to be heated with a closed loop temperature control. Controlling is operated via a regulation unit (UR3274S1; Wachendorff GmbH, Germany). Second, a polytetrafluoroethylene (PTFE) sealing serves as actual sensor housing. It consists of channels (1 × 1 mm) guiding the gas from the column towards the sensors and two recesses (5 × 5 × 1 mm = 0.025 mL) for two sensors, therefore being much smaller than the previous reported sensor chamber (Kohl et al., 2000). The recesses can be adjusted for other sensor types. In here, a commercial VOC sensor SGP40 (Sensirion, Switzerland) and a commercial sensor for the secondary parameter temperature and humidity, SHT35 (Sensirion, Switzerland), is used. The SGP40 contains a protection membrane, protecting it from siloxane poisoning and four different sensing layers (layers 0–3) (Sensirion, 2023). Third, an aluminum frame connects all three parts and ensures a uniform contact pressure on all parts. Finally, a ventilation unit (9GA0612G9001; Sanyo Denki Germany GmbH, Germany) on top of the other structure is used to cool down the electronics. An overview of the GC-SOMSA sensor chamber construction can be found in Fig. 2.
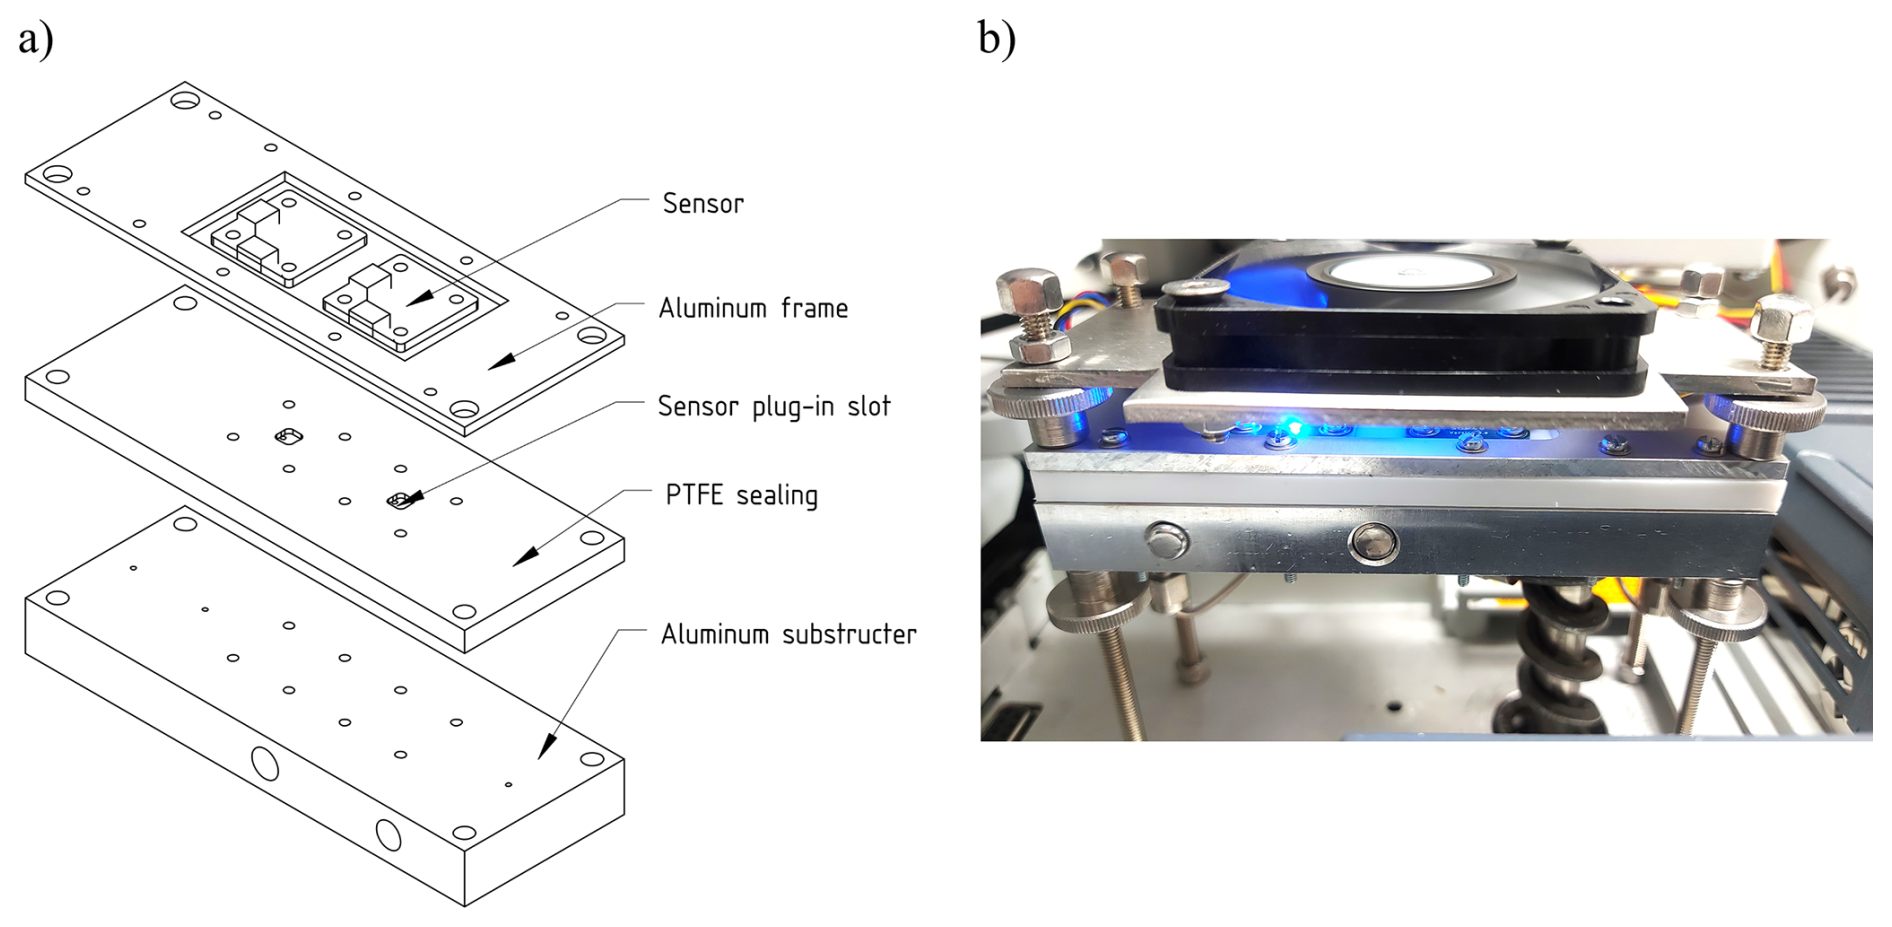
Figure 2(a) Explosion sketch of the GC-SOMSA sensor chamber with (from the bottom up) an aluminum substructure, polytetrafluoroethylene (PTFE) sealing with sensor plug-in slots for two sensors and two sensors, and aluminum frame on top. (b) Photograph of the finally assembled sensor chamber taken from Koehne et al. (2024).
2.2 Test measurements
To characterize the sensor towards rancidity markers occurring in fat/oil oxidation, markers need to be selected. Therefore, a mixture of odor-active oxidation markers, dissolved in neutral sunflower oil (Thomy Deutschland, Germany), was used. According to Ortner et al. (2016), sunflower oil is a suitable matrix as it has a negligible VOC emission in the headspace. Inherent oxidation products in particular are of minor concentrations, and no odor-active components could be expected. Our investigations could confirm this as no further peaks could be detected and no significant odor impression could be perceived. Moreover, it imitates the matrix “fat” and is less volatile, so there is no solvent such as ethanol affecting the measurement. Due to the low polarity of the triglycerides in the fat, the exact composition of the sunflower oil is irrelevant for the calculation of the headspace concentrations. Hexanal (1.4 µL), octanal (8.2 µL), nonanal (31 µL), and pentane (4 µL) were dissolved in 100 mL of sunflower oil. According to a modified Raoult equation (Eq. 2), this spike would lead to approximately 1.55 ppm for hexanal, 1.67 ppm for octanal, 1.71 ppm for nonanal, and 112.61 ppm for pentane at 40 °C in glycerol trilinoleate. Calculation was done with a concentration-dependent activity coefficient (Schultealbert et al., 2017; Penagos Carrascal et al., 2024):
Here, zA corresponds to the proportion of species A in the gas phase; pA corresponds to the partial pressure of species A in the gas phase; xA corresponds to the molar fraction in the liquid phase; γA corresponds to the concentration-dependent activity coefficient, which is calculated via a UNIFAC model; and psat,A corresponds to the vapor pressure of species A as a pure substance. According to Belitz et al. (2012), pentane was chosen to be at a higher concentration (here 4 µL 100 mL−1). For measurements, 2 mL of the final rancid mixture was added to a standard 20 mL headspace vial. Samples were incubated for 5 min at 40 °C. Afterwards, 2 mL of headspace volume was injected into the GC with a split relation of 1:10. The temperature profile of the oven starts at 40 °C for 2 min and rises by 3 °C min−1 over 20 min to 100 °C. Afterwards, the oven was heated in 20 °C min−1 increments to 160 °C, which was maintained for another 2 min. For the sensors, a make-up stream of synthetic air with 10 sccm was applied.
The sensor was operated at 400 °C in a static temperature mode for test measurements and for the comparison of the synchronicity of the detectors. For ODP measurements, a trained person (member of the Fraunhofer IVV sensory panel) sniffs the gas outlet of the heated ODP (250 °C) and records the odor quality and intensity together with the respective retention time of eluting aroma-active compounds. The sensor was operated at 400 °C in a static temperature mode again. For a sensor-temperature characterization, the sensor was operated in a static condition, starting with 100 °C and increasing the temperature in 50 °C steps to 400 °C. Each temperature step was measured in duplicates. The sensor was operated for 1 h with the respective temperature before each temperature step was measured. A blank was measured in accordance with 100, 200, and 400 °C temperatures. In addition, the sensor was operated with the differential surface reduction (DSR) mode, which improves the sensor signal (Baur et al., 2015, 2018a, b).
3.1 Test measurements and synchronicity test
The sensor data were analyzed using the software OriginPro 2022b SR1 (OriginLab Corporation, USA). The sensor signal, which is given as a raw signal in ticks, is proportional to the logarithm of the resistance of the sensor material according to the manufacturer specifications (Sensirion). For preprocessing the data, the raw signal was subtracted from the maximum value of n = 216. Furthermore, the signal was smoothed using the moving average over 200 data points. To exclude possible artifacts when starting and ending the measurement, the first and the last second were each cut out. The MS signal was taken directly from the Chromeleon software. According to the high intensity of the air peak, an insert was added to the MS chromatogram for the 400 °C measurement to visualize the smaller peaks for hexanal and octanal (Figs. 3 and 4). Since there were no differences in the chromatograms for the same measurements with only different sensor modifications, only the enlarged MS chromatograms were shown in all further measurements for better visualization (Figs. 5 and 6 and the Supplement). MS peaks were labeled according to the NIST database proposal and the mass spectra of the suspected compounds. To investigate the synchronism of the sensor and the MS, all signals were aligned according to their time stamp (Fig. 3).
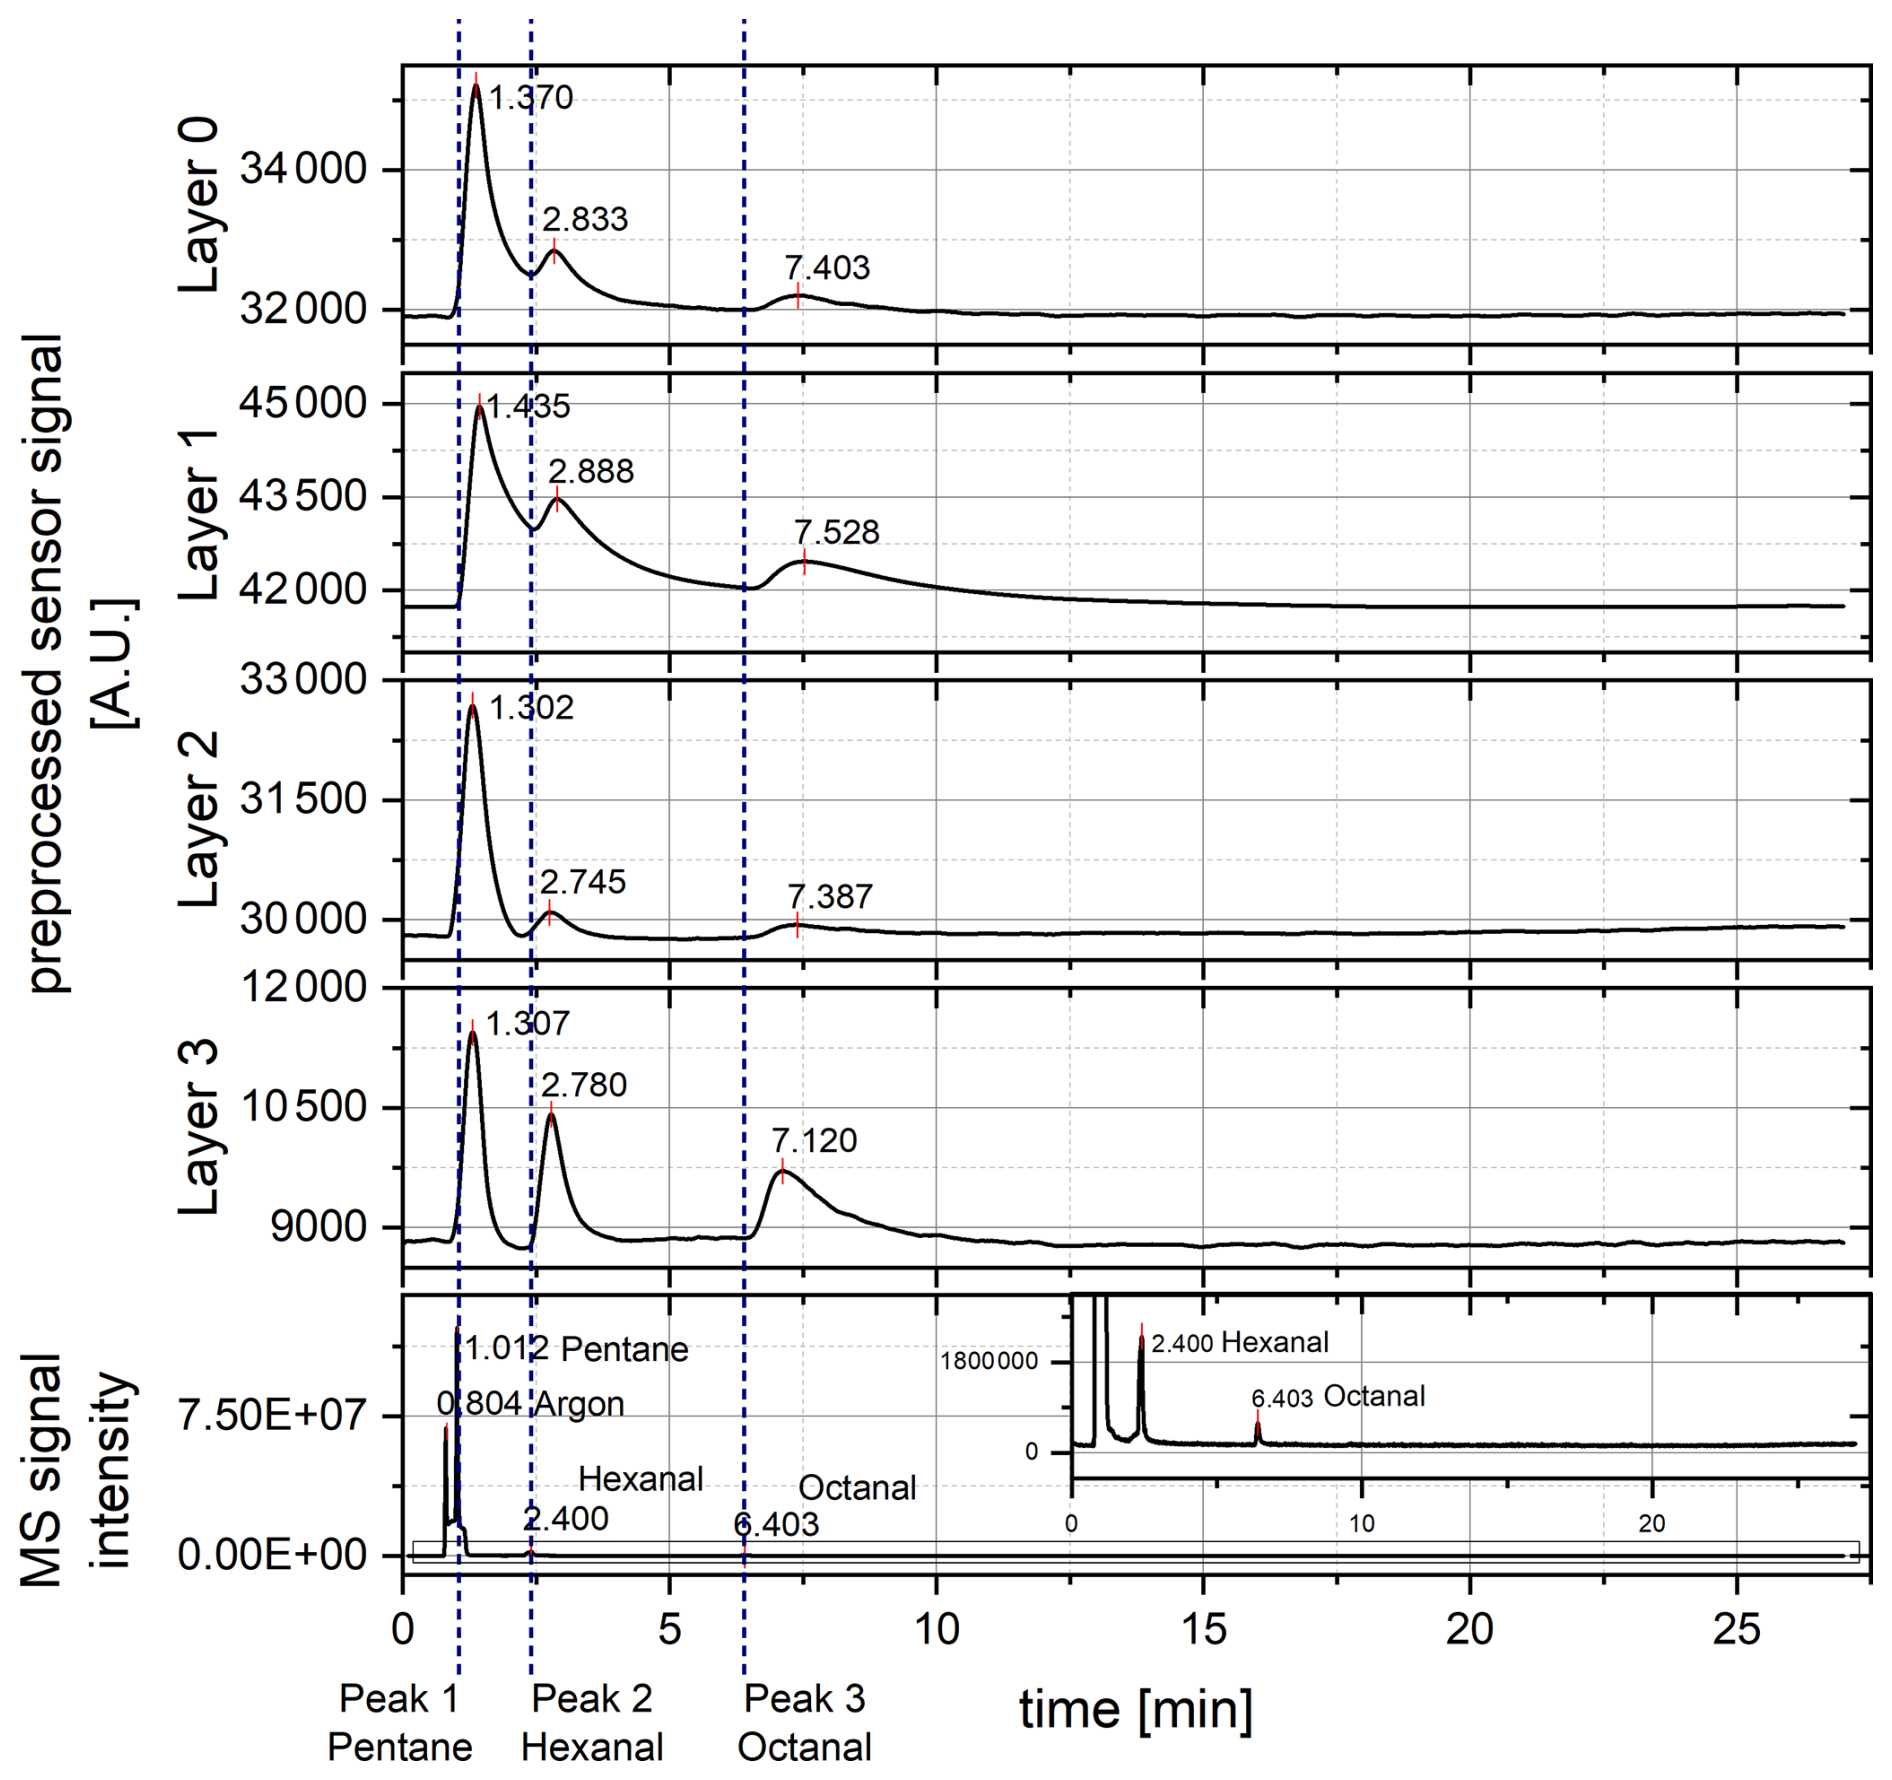
Figure 3Preprocessed sensor signal at an operational sensor temperature of 400 °C for layers 0–3 and mass spectrometer (MS) signal with an enlarged insert of the entire chromatogram. The x axes are linked to test the synchronism of the detectors. MS peaks are labeled according to the NIST database proposal and the respective mass spectra.
Looking at the signals of the MS, just four peaks are detected. According to the NIST database and the mass spectra (mass traces), they belong to argon (from air) with a retention time of 0.804 min, pentane with a retention time of 1.012 min, hexanal with a retention time of 2.400 min, and octanal with a retention time of 6.403 min (see also Sect. S1 in the Supplement). The air peak and the pentane peak have a much higher intensity than the peaks for octanal and hexanal. This is because argon occurs within air ubiquitously. Pentane was calculated to show a much higher intensity than hexanal and octanal. No further peaks are detected. In the raw signal view of the sensors, it is noticeable that three peaks occur in each layer (0–3). This thereby shows that the first peak in all layers has the highest intensity. In layer 0 and layer 1, a tailing of the peaks occurs, which is why the peaks are not completely baseline separated. For layer 2 and layer 3, a baseline separation could be achieved. Layer 3 reacts much stronger compared to peak no. 2 (presumably hexanal) than layer 2 does. The same applies to peak no. 3 (presumably octanal), which is much stronger in layer 3 than in layer 2. Peak no. 1 (presumably pentane) has the highest intensity in all layers, although its intensity compared to the other peaks is lower in layer 1 and layer 3. This might be due to different surface reactions of the single-sensor layers, which are more sensitive towards hexanal and octanal than towards pentane.
Previously reported measurements even showed (for layer 1) a less intense pentane peak and more intense hexanal peak (Koehne et al., 2024). Although both measurements were performed in the same way with the same samples, the intensity of the first peak is slightly higher than the intensity of the second peak in contrast to the previously reported measurements. Since in a semi-quantitative analysis of the MS data the mean pentane peak area in the measurement shown here (3 015 377 counts ⋅ min) has increased significantly compared to the mean area of the pentane peak reported previously (1 029 571 counts ⋅ min), it is assumed that there was a pentane contamination of the injection syringe during the measurements (see Sect. S2). This is supported by the fact that later conducted ODP measurements (Fig. 5) also revealed a less intense pentane peak for sensor layer 1, indicating a pentane contamination. Fluctuations in the peak area were also observed for the hexanal and the octanal peak. For hexanal, a mean peak area of 212 177 counts ⋅ min was reported in the previous measurement compared to 274 025 counts ⋅ min recorded here. For octanal, a mean peak area of 86 510 counts ⋅ min was reported previously compared to 56 663 counts ⋅ min recorded here. Since these fluctuations are much smaller than those of pentane, it is assumed that the contaminant is primarily pentane. A comparison between previous and current measurements can be found in Sect. S2. In general, the measurement of pentane should be treated with caution as pentane is highly volatile (boiling point of ∼ 36 °C) and can therefore cause inaccuracies already at the sample preparation stage. It was nevertheless further considered here because the sensor reacts clearly to pentane.
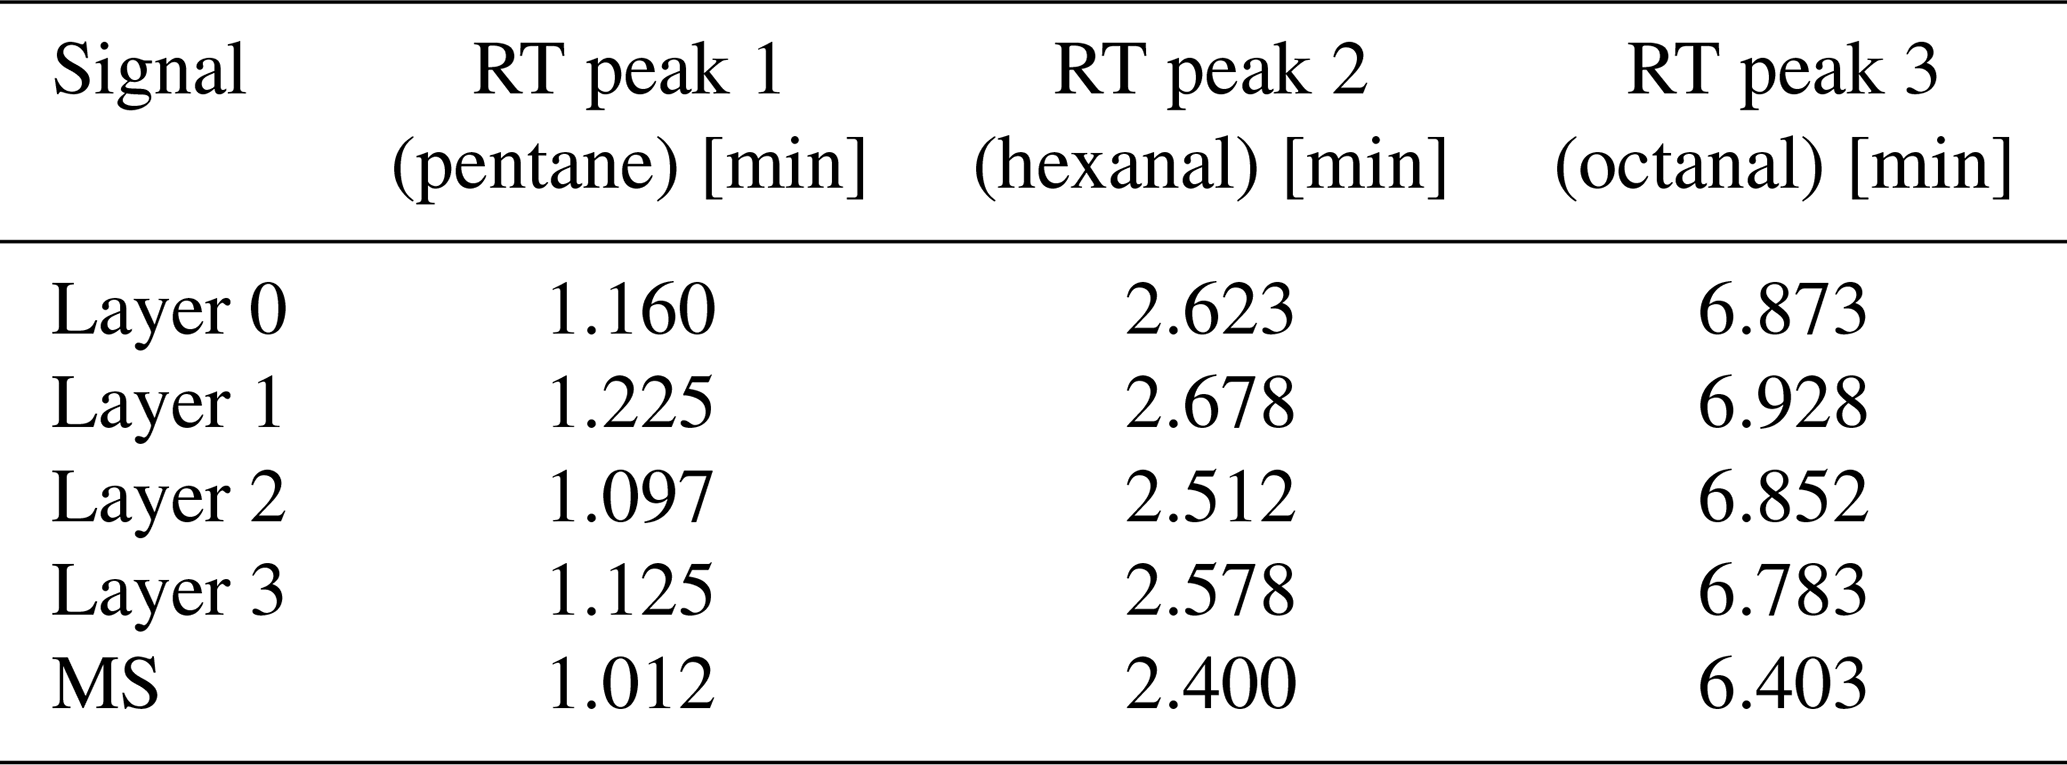
However, in layer 1 and layer 3, the peak intensity of pentane is still lower compared to in layer 2, which offers an opportunity for the detection of the odor-active compounds hexanal and octanal in layers 1 and 3. Argon is an inert gas and is therefore not visible in the sensor response due to the sensor's reactive behavior to just reducing and oxidizing gases. Possible reactions of the other air components are superimposed by the synthetic air carrier gas flow. For an unknown reason nonanal could not be detected in any of the chromatograms. When comparing the sensor and MS results regarding the retention times of the different peaks, a shift for all retention times occurs (Table 1).
Table 1Retention times (RTs) of the detected peaks for the SGP40 operated at 400 °C.
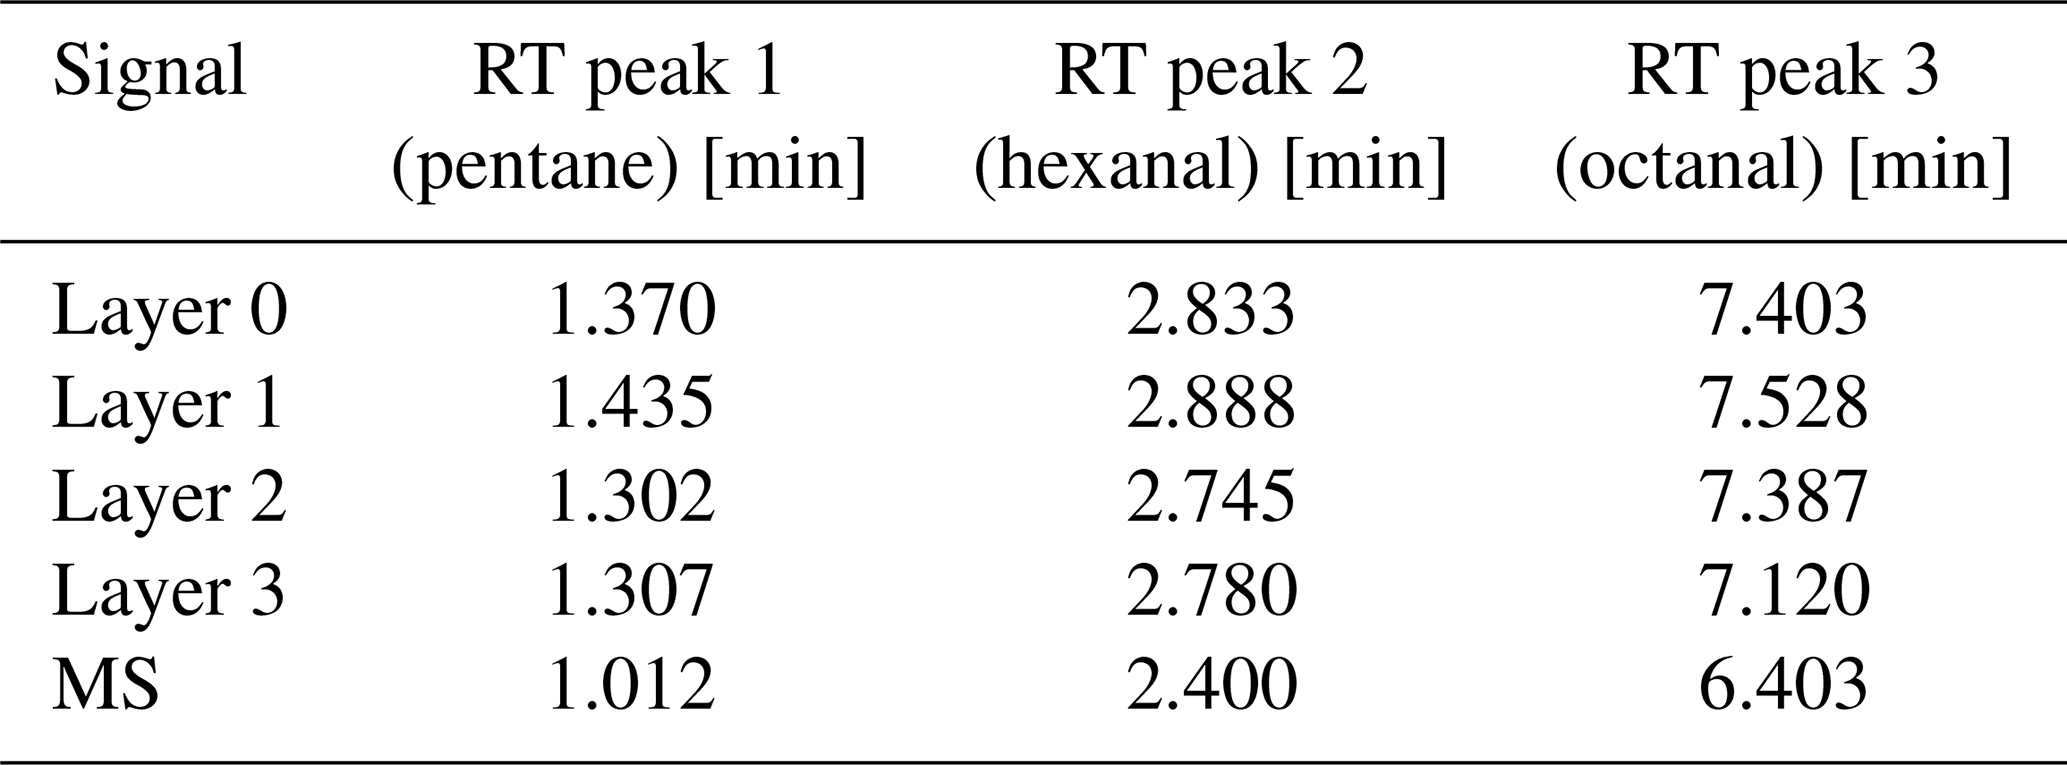
This shift is not constant for all peaks and all layers. Since all four layers are placed in parallel to each other, eluting fractions reach the layers at the same time. Inter-layer differences indicate a different reaction of the compounds on the different-sensor layers. Hence, just the shortest time distance from the MS peak to a corresponding sensor response can indicate a time delay due to the built-in flow restrictions. For peak 1, this is layer 2, with a difference of 0.290 min (17.4 s); for peak 2, this is layer 2, with a difference of 0.345 min (20.7 s); and for peak 3, this is layer 3, with a difference of 0.717 min (43.0 s).
Furthermore, the time offset increases with increasing retention time. As the sensor used is equipped with a membrane protecting it from siloxane poisoning (Sensirion; Schultealbert et al., 2021), the increase in the time offsets with increasing retention time can also be explained by a discriminatory effect of the membrane on larger molecules. These larger molecules such as octanal need a longer diffusion time through the membrane than smaller molecules such as pentane. Therefore, the cause of the offset may not be influenced by the flow restriction but by the sensor itself. Additionally, even small molecules need this extra diffusion time, leading to a general offset in the retention time. Hence, the response of the sensors to the eluting fractions can be better observed by monitoring the rate of change of the sensor signal to compare the retention times of both detectors. For a clearer comparison of the retention times and for a better peak separation, the first derivative of the smoothed raw signals was formed in addition and smoothed with a 150-point moving average. To eliminate artifacts that occur when starting and ending the measurement and when the derivative is formed, the first 2 s and the last 1 s were each cut out. The signals were aligned with the MS signal from the Chromeleon software according to their time stamp for the synchronism test (Fig. 4). When considering the first derivative, the peak separation is enhanced compared to the preprocessed sensor signal. Peak 1 shows the highest intensity again, while for layer 3, the intensity of peak 2 and peak 3 is also high. Comparing the results of the first derivative of the sensor signal and the MS signal regarding the retention times, the shift decreases (Table 2).
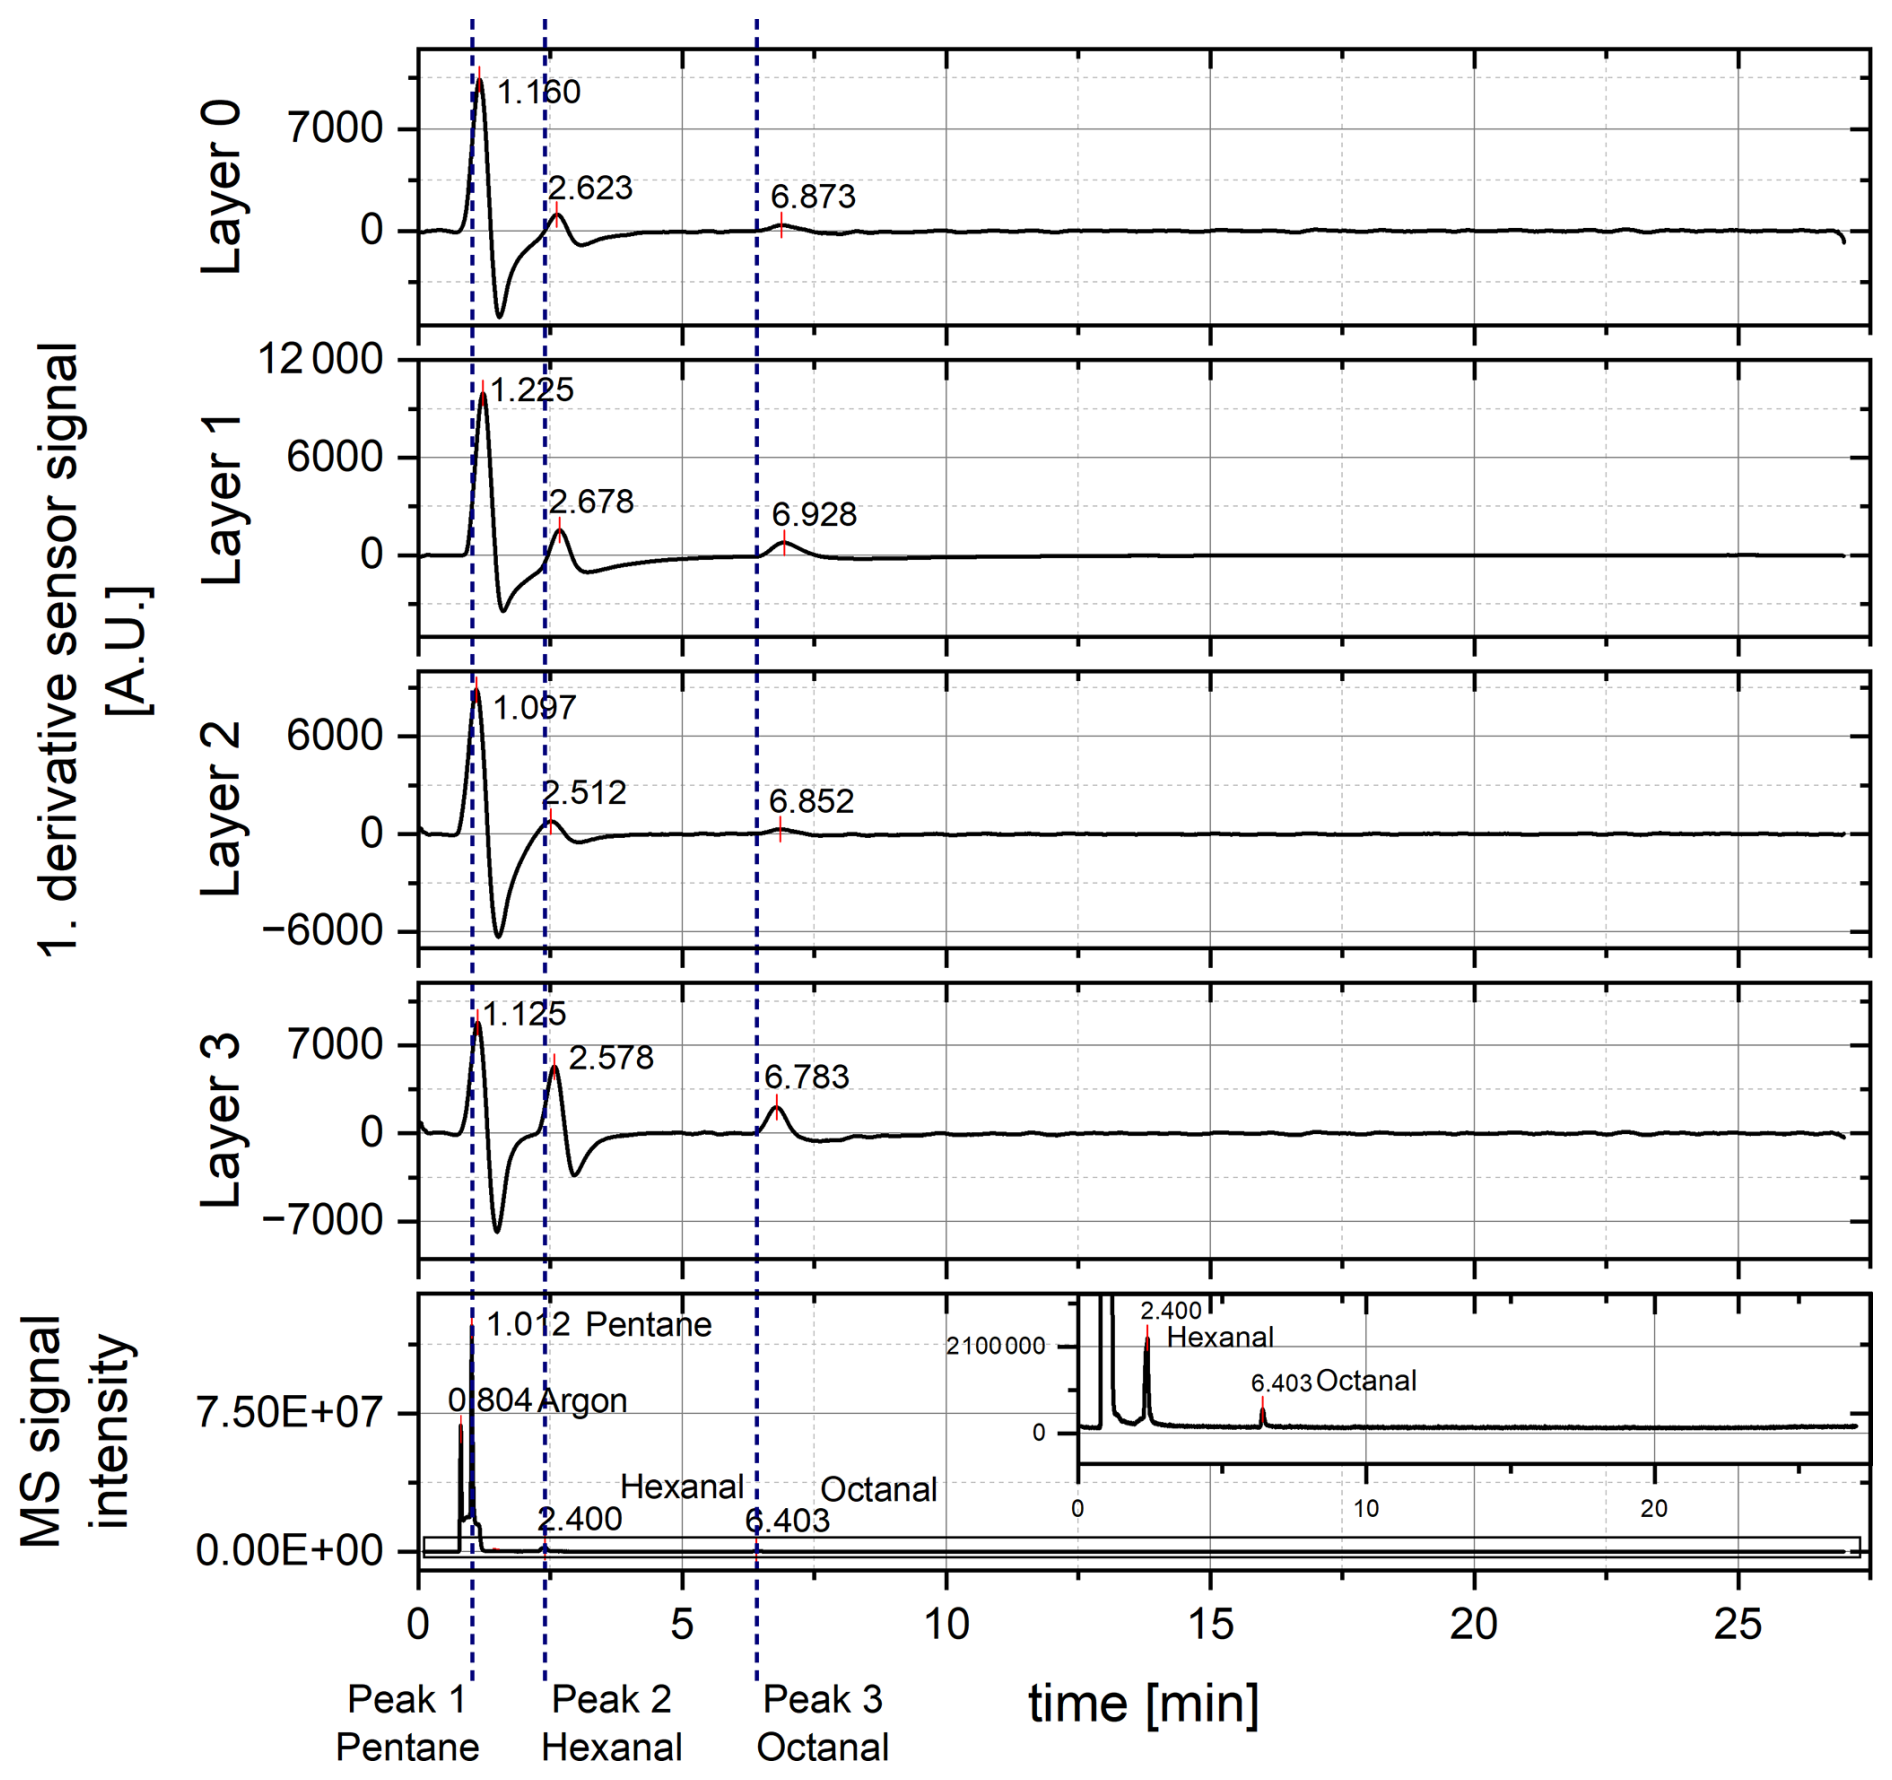
Figure 4First derivative of the preprocessed sensor signal and mass spectrum (MS) signal with an enlarged insert of the entire chromatogram. Measurements were conducted at a 400 °C sensor temperature. The x axes are linked to test the synchronism of the detectors regarding the response behavior of the sensor.
Table 2Retention times (RTs) of the detected peaks for the SGP40 operated at 400 °C from the first derivative of the sensor signal.
Looking at the shortest time differences between the MS signal and the sensor signal, peak 1 offers a difference of only 0.085 min (5.1 s) between layer 2 and the MS. For peak 2, the difference between layer 2 and MS is 0.112 min (6.7 s), and for peak 3, the difference between layer 3 and MS is 0.380 min (22.8 s). In terms of the retention time comparison, this is much better than considering the preprocessed sensor signal, although the derivative cannot completely compensate for the diffusion-delay effect of the protection membrane. Nevertheless, membrane removal can cause quick poisoning of the sensor surface as regularly occurring column bleeding from the column used here contains siloxanes. For removal of the membrane, a change in the column or a reduction in the analysis temperature would be needed. Alternatively, the flow restriction towards the sensor chamber could be shortened to achieve an exact match of the retention times. As the retention time is influenced by the membrane diffusion and accordingly by the size of the molecules, a different flow restriction length would have to be selected depending on the respective target molecule. As the length influences the flow distribution, the number of eluting fractions would be different for each analysis. Therefore, the flow restriction should not be changed, and the offset needs to be considered for the further development of IOMSs. However, when considering the first derivative of the sensor signal, negative peaks occur in particular for the peaks with higher intensity. As this is caused by a strong change in the slope, it may be advantageous to consider lower sensor surface temperatures in the next step.
3.2 ODP measurements
To test the synchronicity of all three detectors, including the ODP, a trained person of the Fraunhofer IVV sensory panel recorded the retention times, the odor qualities, and the odor intensity of the eluting aroma-active compounds. The intensities of odorants detected were scaled from 1 (weak) to 4 (intense). A blank (surrounding laboratory air), a sample with the calculated target concentrations, a sample with 10 times higher target concentrations, and a sample with 100 times higher target concentrations were measured as odor qualities were only very faintly perceptible for lower concentrations and the odor impression of octanal could not be perceived for the originally calculated target concentration (Table 3). The 100 times higher concentration was measured as a duplicate due to the clearest odor impressions.
Table 3Evaluation of the rancid mixture of the odor qualities (grassy for hexanal and citrus-like for octanal) and the respective intensities (int.).
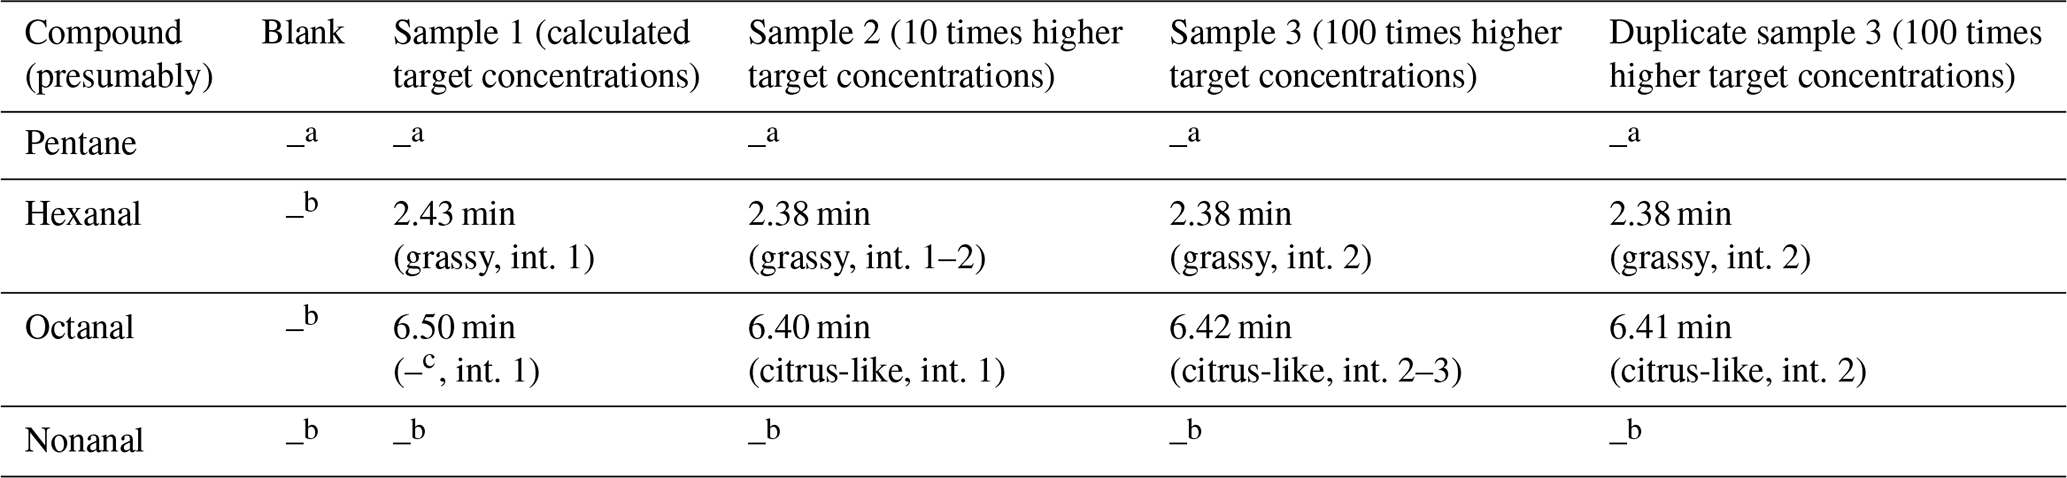
a Pentane is not an aroma-active compound; hence, it cannot be recorded nor b not detected; c odor impression could not be perceived.
The retention times of detected peaks in sample 1 differ slightly from the retention times of the other samples. A reason therefore might be the lower concentration, leading to a slower reaction of the trained person. For the 10 times higher concentration and for the 100 times higher concentration, the retention time was similar. Pentane could not be detected as pentane is not an aroma-active component. For an unknown reason, we could not measure any odor impression matching nonanal for any of the tested concentrations. The odor impressions for the calculated target concentrations were very low (intensity 1), and the odor quality of octanal could not even be perceived. This changed for higher concentrations. To compare the synchronicity of the detectors, the preprocessed sensor signals, the derived sensor signals, and the MS signals for sample 3 (best odor perceiving) were compared with the ODP results (Table 4). The chromatograms were prepared as previously (Sect. 3.1). To eliminate artifacts that occur when the derivative is formed, the first 2 s and the last 2 s were each cut out. The MS signal from Chromeleon was aligned with the sensor signals according to their time stamps (Fig. 5).
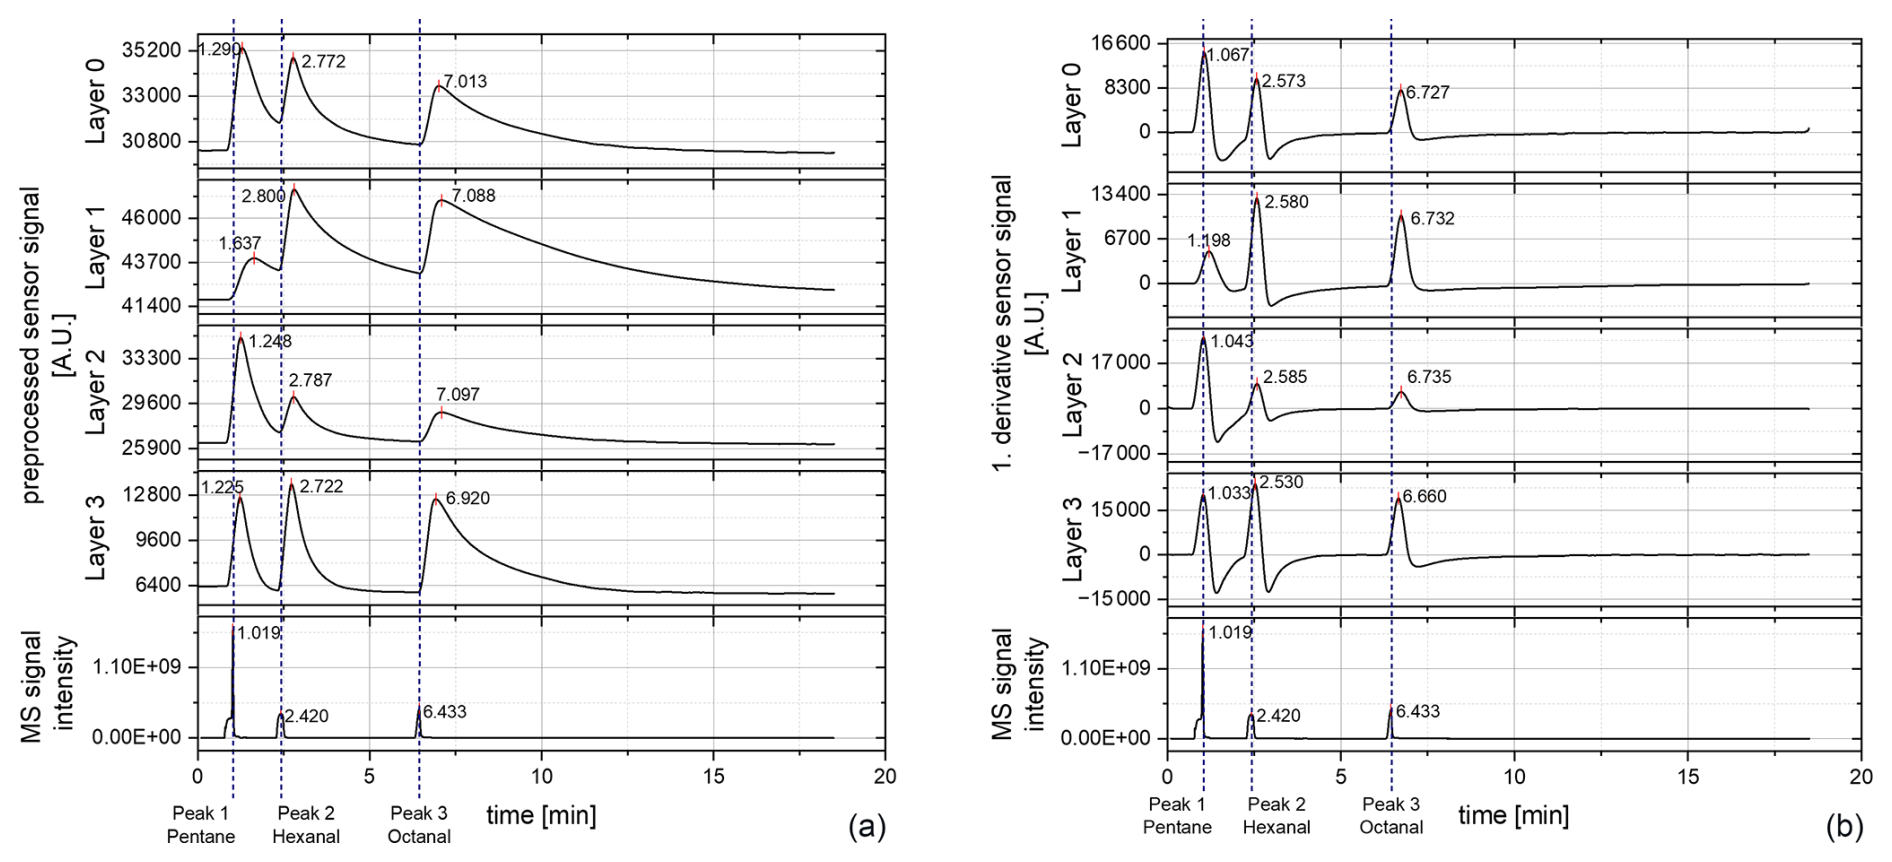
Figure 5Chromatograms of the sensor layers (0–3) measured at a sensor temperature of 400 °C and mass spectrum (MS) signals; samples with 100 times higher target concentration: (a) preprocessed raw signal of the sensor and (b) first derivative of the preprocessed raw signal.
Table 4Retention times (RTs) of the detected peaks (preprocessed signal and first derivative) for the SGP40 operated at 400 °C with the 100 times higher target concentration compared with the odor detection port (ODP) and the mass spectrometer (MS) retention times.
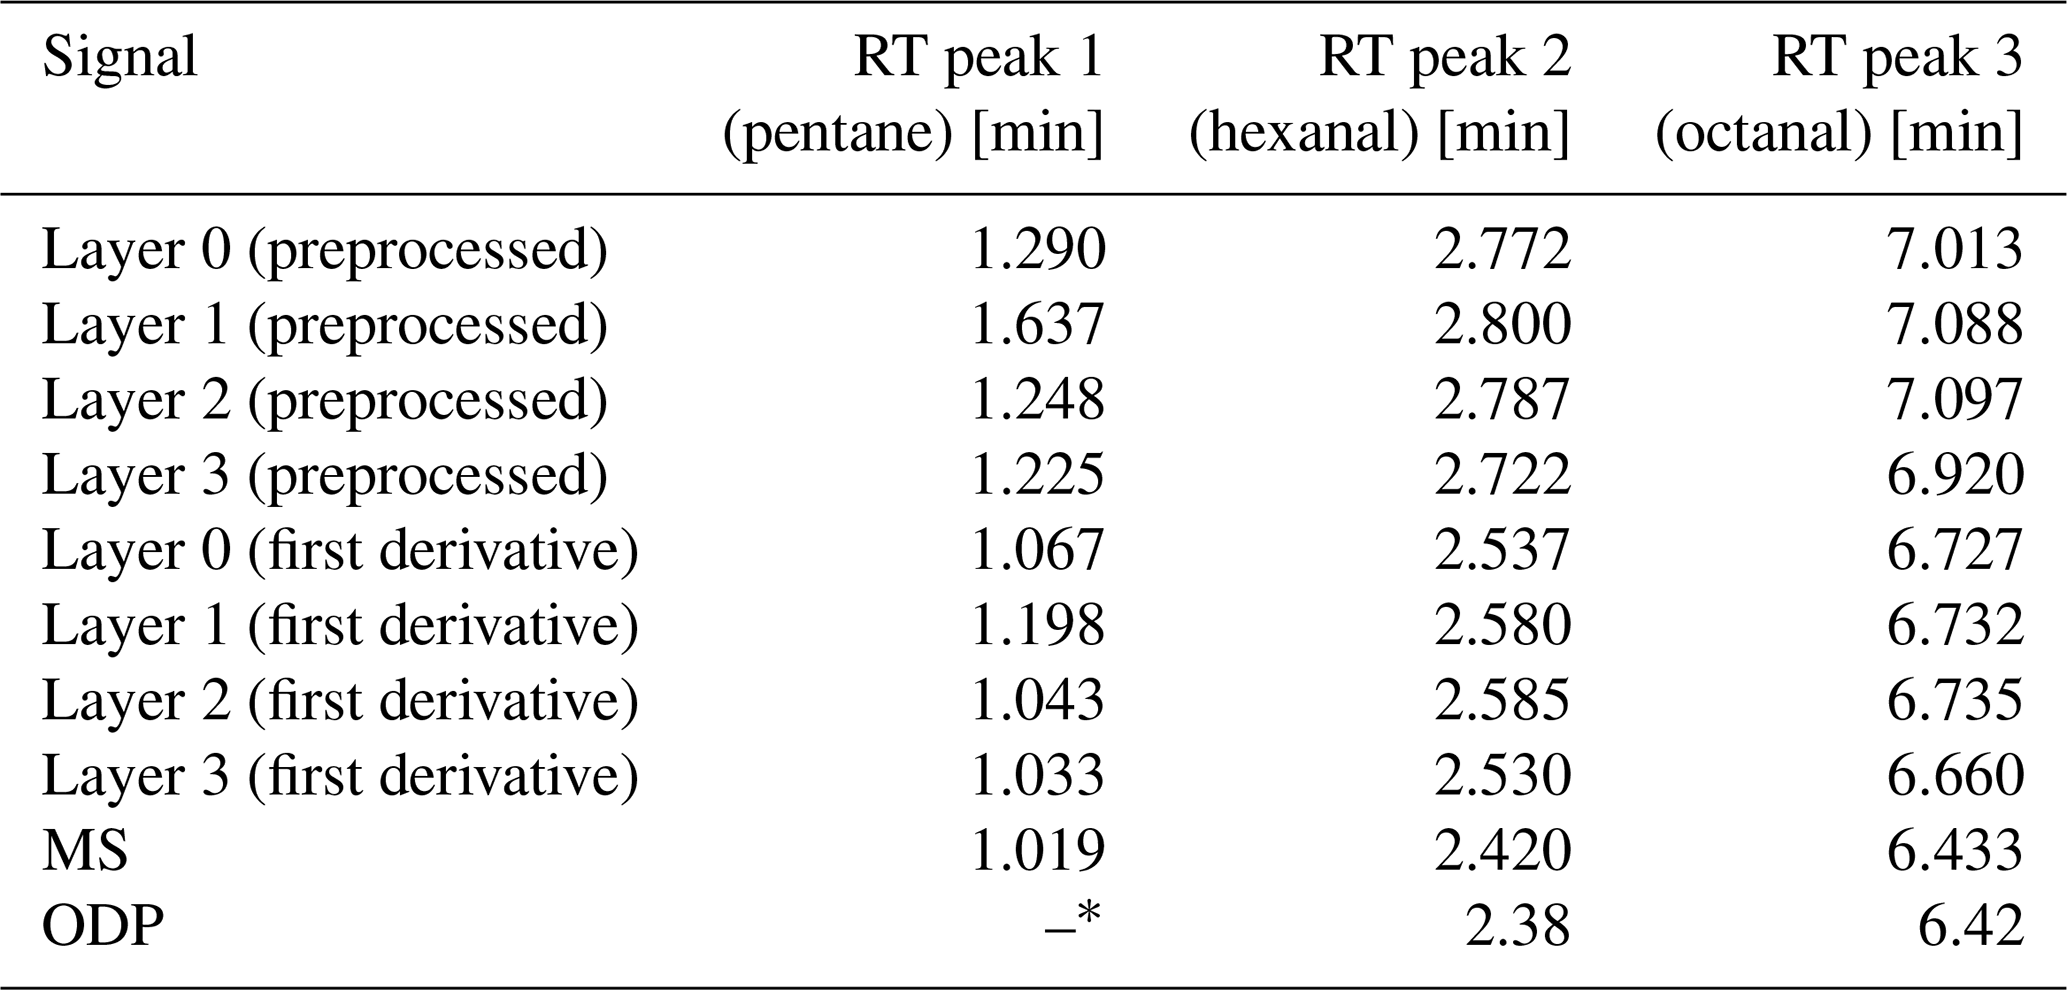
* Pentane is not an aroma-active compound; hence, it cannot be recorded with the ODP.
The results of sample 3 (100 times higher) tend to be similar to the first measurement with the lower concentration. For the preprocessed sensor signal, a slight shift in the retention times occurs, which increases with higher retention times. This shift is smaller when forming the first derivative. In contrast to the first measurement, for layer 1, the pentane peak is less intense again like in the previous measurements (reported in Koehne et al., 2024), which also indicates a probable contamination of the injection syringe with pentane during the first measurement. However, in contrast to the first measurement, a much stronger tailing behavior of all peaks occurs in all layers. The reason therefore might be the high concentration and the, respectively, increased diffusion time of the target molecules through the protection membrane to the sensor surface and especially back again. However, the response behavior otherwise remains the same. When comparing the retention times, the ODP has a slight shift from the MS (about −0.04 min for peak 2 and about −0.01 min for peak 3). This shift is negligibly small, especially as the sniffing frequency is much lower than the MS detection frequency, so the ODP and the MS can be regarded as parallel. The shift of the sensor response to the MS and the ODP is similar to the previous measurement. As the restrictions for the ODP and for the sensor chamber have the same dimensions, and as both detectors are switched against ambient pressure, the shift of the sensor response cannot be based on the restriction but just on the sensor behavior. Hence, all three detectors can generally be regarded as parallel. For future measurements with different sensors, the respective sensor behavior needs to be taken into account.
3.3 Variation in the sensor temperature
To improve the sensor signal, the sensor was operated at different temperature steps, starting at 100 °C and rising in 50 °C steps towards 400 °C. The measurements were conducted with the previously calculated target concentrations. The sensor was started 1 h before each temperature step. As no signals could be detected for 100 °C, an additional measurement with a previous operation time of 15 h was conducted. No signals could be detected in that one either. Hence, the operation at 100 °C is not feasible for the sensor used here. For 150 °C and for 200 °C, just a few but not all peaks could be detected; thus, they were not considered further. The chromatograms for each temperature step can be found within the Supplement (Sect. S3). The first temperature step revealing nearly all peaks was at 250 °C (Fig. 6).
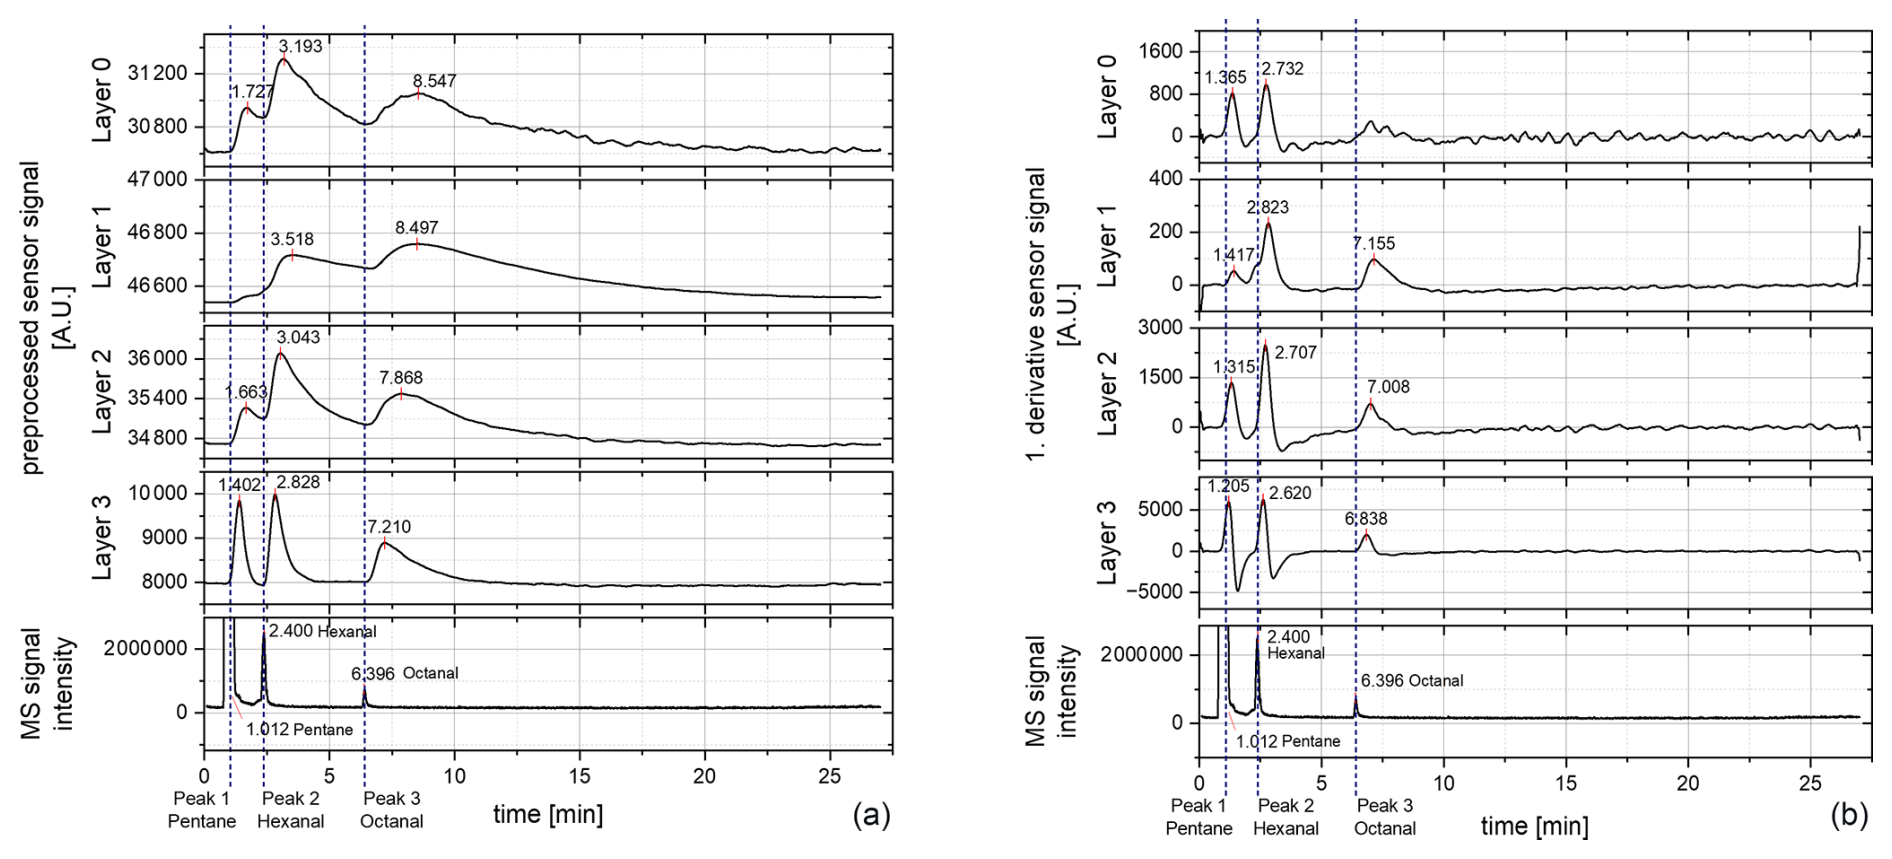
Figure 6Chromatograms of the sensor layers (0–3) measured at a sensor temperature of 250 °C: (a) preprocessed raw signal of the sensor and (b) first derivative of the preprocessed raw signal. MS: mass spectrometer.
In this case, for the preprocessed raw signal three peaks could be detected for nearly all layers (Fig. 6a). Only for layer 1 was the first peak (presumably pentane) not clearly detected. However, the second peak (retention time, RT of 3.518 min) shows a fronting behavior that looks like a shoulder peak before the second peak. For layers 0, 1, and 2, a strong tailing behavior occurs. Furthermore, peak 1 shows the smallest intensity out of all peaks although the pentane concentration was much higher than the concentration of hexanal and octanal. This indicates that pentane might be less reactive at lower temperatures and thus can be masked using lower sensor temperatures when occurring as strong background noise. Therefore, layer 1 seems to be the most suitable, which is in accordance with previous findings (Koehne et al., 2024), but layer 0 and layer 2 show smaller pentane peaks. Layer 3 seems to offer an overview of all detected compounds, showing all peaks clearly. When forming the first derivative of the preprocessed raw signal, all peaks can be detected as well, except for layer 0 (Fig. 6b). In layer 0, peak no. 3 is missing, although it was clearly seen at the raw signal. This may be due to a small change in the slope of the peak, which is why the actual peak may be lost in the baseline noise. When comparing the positions at the retention time of the other layers, a small elevation in the baseline can be seen, although this is not recognized as a peak. But therefore, in layer 1, all three peaks can be observed in the first derivative. This indicates again that the reaction temperature for pentane is too low in this layer and that pentane could be masked when occurring as background noise together with the odor-active markers. Layer 3 already shows similar behavior to that of the measurement at 400 °C.
At the other temperature steps (300 and 350 °C), no different behavior than for the 400 °C measurement occurs (Sect. S3). The intensity of the pentane peak is stronger compared to the other peaks. Hence, a sensor temperature of 250 °C might therefore be suitable for the detection of hexanal and octanal as possible odor-active oxidation markers.
3.4 DSR mode
As no peak could be detected with the measurements at 100 °C, the sensors were operated with a DSR mode to improve the sensitivity of the sensor. In DSR mode, the oxygen occupancy of the sensor surface is not in equilibrium, which results in increased sensitivity (Baur et al., 2018a). Therefore, the sensor is first operated at 400 °C for 1 h to achieve a high oxygen occupancy. Then, measurements are taken directly afterwards at a sensor temperature of 100 °C (Fig. 7).
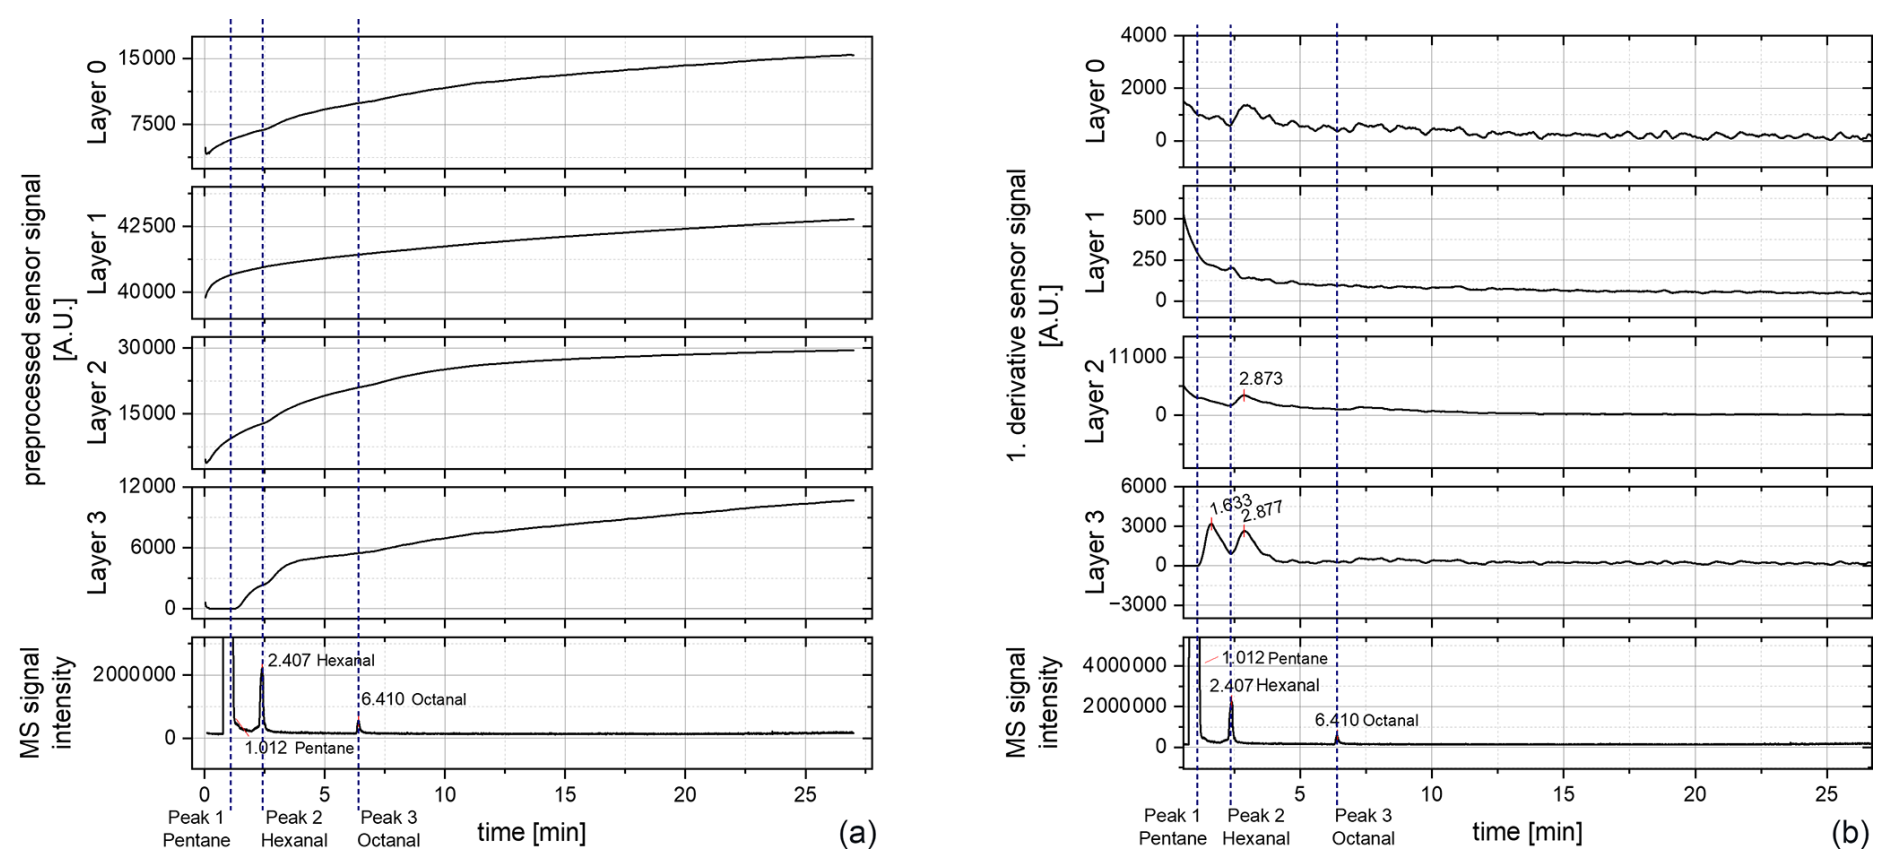
Figure 7Chromatogram of 100 °C after a 400 °C step (DSR mode): (a) preprocessed raw signal and (b) first derivative of the preprocessed raw signal. MS: mass spectrometer.
In contrast to the simple 100 °C measurements, peaks can be observed using the DSR mode. When looking at the preprocessed raw signal, the running-in behavior can be observed clearly by a continuously rising baseline (Fig. 7a). For layer 0 and layer 1 no clear peak can be seen, although layer 1 shows a small change within the slope at the retention time of the hexanal peak. Layer 2 and layer 3 also show a strong running-in behavior of the sensor, but in addition, a change in the slope can be initially observed. Hence, the first derivative was formed to visualize the change in the slope (Fig. 7b). For layer 2 and layer 3, peaks can now be observed. Thereby, layer 2 offers a peak at 2.873 min, which might belong to hexanal (compare to the MS hexanal peak at 2.407 min). No further peaks could be detected within layer 2. For layer 3, two peaks occur even. The first has a retention time of 1.633 min and might belong to pentane (compare to the MS pentane peak at 1.012 min). The second peak has a retention time of 2.877 min and might belong to hexanal (compare to the MS hexanal peak at 2.407 min). No further peaks could be observed here. The shift in the retention times appears to be stronger than at the previous measurement at 400 °C (see Fig. 4). This might be due to the reduced temperature at the sensor surface. As no further peaks are detected either, this temperature mode seems to not be suitable for the tested sensor and the desired application. However, as at least a few peaks could be detected, the DSR mode might fit other sensors for GC measurements in future.
A GC-SOMSA system containing three detection ports was conceptualized as an element of a structured development concept for IOMSs. Thereby, a MS detector, an ODP, and a sensor chamber made a fast characterization of a sensor possible. The parallel detection allows for a correlation of the MS signal with the sensor signal and with the odor impression and hence allows for an instrumentation of odor measurements. For this purpose, a commercially available sensor was characterized towards odor-active fat oxidation products as a use case. Hexanal, octanal, and nonanal were chosen as oxidation markers known in the literature, and pentane was added in a higher concentration as an additionally occurring component. Test measurements with the MOS sensor SGP40 operated at 400 °C revealed that the sensor was able to detect all components besides nonanal. Nevertheless, hexanal and octanal were clearly visible, especially for layer 3. Pentane was also clearly detectable at all sensor layers.
The tested the synchronism of the MS, and the sensor response showed a time offset, which was influenced by the sensor layers and by a sensor protection membrane. First, inter-layer differences in the retention times of the parallel sensor layers indicate different reactions of the eluting fractions on each layer surface. Second, a membrane protects the used sensor from siloxanes that occur during column bleeding, making this particular sensor ideal for GC applications. However, this membrane also causes a time delay of the peaks as an eluting fraction has to diffuse through the membrane first. Thereby, larger molecules are hindered stronger than smaller molecules, which is indicated through an increase in the time offsets with increasing retention times (Sensirion; Schultealbert et al., 2021). Therefore, the cause of the offset may not be influenced by the flow restriction but by the sensor itself. To minimize such time offset effects and to optimize the peak separation within the sensor signal, the first derivative was formed. As the retention time offset was much lower, especially for pentane, the detectors were considered to be in parallel. ODP measurements confirmed that the detectors are in parallel with each other. The retention times of the ODP and the MS were nearly the same. As the flow restriction for the ODP has the same dimension as the flow restriction of the sensor chamber, since both detectors are switched against ambient air pressure and the inherent flow restriction of the sensor chamber is negligibly small compared to the actual flow restriction, all retention time shifts are presumably caused by the sensor itself (by either the protection membrane or slow surface reactions).
As the derived signal shows negative peaks, an optimization of the sensor temperature was considered afterwards, and other operating temperatures were applied. Thereby, the sensor did not show a sufficient response towards 100, 150, and 200 °C. At 250 °C, the sensor could detect all peaks. In addition, the pentane peak seemed to be less prominent than the other peaks, which offers the possibility of specifically detecting the odor-active compounds hexanal and octanal against a higher pentane background. The other temperatures (300 and 350 °C) revealed results similar to the 400 °C measurement. In addition, the DSR mode revealed an improved signal response for 100 °C (Baur et al., 2018a) but did not reveal a detection of all relevant peaks. The DSR mode is therefore promising for future applications with other sensor types, but it is not suitable for the sensor used here. Nevertheless, as clear signals were detected from a temperature of 250 °C with layers 0 and 1, the sensor is suitable to monitor oxidation products of aging fat. Hence, a further developed GC-SOMSA using a SOMSA setup with a MS, ODP, and much smaller dead volumes made a fast and comprehensive characterization of a commercial sensor possible to build an IOMSs for a special use case.
In future, the sensor membrane could be removed or sensors without a protecting membrane could be used to test the influence of the membrane on the offset of the retention times and hence on the synchronism of the detectors. Furthermore, GC programs with lower temperatures can be used to decrease a possible column bleeding. Columns without any siloxanes, such as packed columns, could also be used and tested in order to make the membrane redundant. Using different sensors, the DSR mode might also improve the sensor signal, which is why this mode of operation should be considered for further measurements. A humidification unit could be inserted to the make-up stream to test the influence of different humidity levels to the sensor reaction. Finally, any reasonable sensor can be characterized as suitable for a broad field of applications. The compact design will reduce the required development times for IOMSs and hence enable a faster and cheaper development. Thus, GC-SOMSA becomes an integral element of a structured development concept.
All data can be provided by the corresponding authors on reasonable request; no specific code was used.
The supplement related to this article is available online at https://doi.org/10.5194/jsss-14-75-2025-supplement.
MK, TS, and GZ: conceptualization. MK, OTPC, and MC: investigation. MK and TS: formal analysis and methodology. GZ and TS: supervision. MK, GZ, and TS: writing (original draft preparation). MK, TS, and GZ: writing (review and editing).
The contact author has declared that none of the authors has any competing interests.
Publisher’s note: Copernicus Publications remains neutral with regard to jurisdictional claims made in the text, published maps, institutional affiliations, or any other geographical representation in this paper. While Copernicus Publications makes every effort to include appropriate place names, the final responsibility lies with the authors.
This article is part of the special issue “Sensors and Measurement Systems 2024”. It is a result of the 22. GMA/ITG Fachtagung Sensoren und Messsysteme 2024, Nuremberg, Germany, 11 to 12 June 2024.
We like to thank Oliver Brieger for providing his master's thesis and for his support in the calculation of the flow restrictions. Further information can be given by Oliver Brieger, “Konzeption und Aufbau einer GC-MS-Erweiterung zur synchronen Gassensormessung”, master's thesis, Universität Saarbrücken, 14 February 2020.
This work was funded by the Bayerisches Staatsministerium für Wirtschaft, Landesentwicklung und Energie (Bavarian State Ministry of Economic Affairs, Regional Development and Energy) as part of the project Campus der Sinne (Campus of the Senses; grant no. 20-3410-2-14-3) and by the SENT-GC-MOS project (grant no. 01IF22938N) as part of the Industrielle Gemeinschaftsforschung (Industrial Community Research) program of the Bundesministerium für Wirtschaft und Klimaschutz (Federal Ministry of Economic Affairs and Climate Protection).
This paper was edited by Andreas Schütze and reviewed by two anonymous referees.
Baur, T., Schütze, A., and Sauerwald, T.: Optimierung des temperaturzyklischen Betriebs von Halbleitergassensoren, Tech. Mess., 82, 187–195, https://doi.org/10.1515/teme-2014-0007, 2015.
Baur, T., Schultealbert, C., Schütze, A., and Sauerwald, T.: Novel method for the detection of short trace gas pulses with metal oxide semiconductor gas sensors, J. Sens. Sens. Syst., 7, 411–419, https://doi.org/10.5194/jsss-7-411-2018, 2018a.
Baur, T., Schultealbert, C., Schütze, A., and Sauerwald, T.: Device for the detection of short trace gas pulses, Tech. Mess., 85, 496–503, https://doi.org/10.1515/teme-2017-0137, 2018b.
Belitz, H.-D., Grosch, W., and Schieberle, P.: Lehrbuch der Lebensmittelchemie, 6., vollst. überarb. Aufl., Nachdruck, Springer-Lehrbuch, Springer, Berlin, 1118 pp., ISBN 978-3-540-73201-3, 2012.
Costello, B. P. J. d. L., Ewen, R. J., Gunson, H., Ratcliffe, N. M., Sivanand, P. S., and Spencer-Phillips, P. T. N.: A prototype sensor system for the early detection of microbially linked spoilage in stored wheat grain, Meas. Sci. Technol., 14, 397–409, https://doi.org/10.1088/0957-0233/14/4/301, 2003.
Costello, B. P. J. d. L., Ewen, R. J., Gunson, H. E., Ratcliffe, N. M., and Spencer-Phillips, P. T. N.: The development of a sensor system for the early detection of soft rot in stored potato tubers, Meas. Sci. Technol., 11, 1685–1691, https://doi.org/10.1088/0957-0233/11/12/305, 2000.
Czerny, M., Christlbauer, M., Christlbauer, M., Fischer, A., Granvogl, M., Hammer, M., Hartl, C., Hernandez, N. M., and Schieberle, P.: Re-investigation on odour thresholds of key food aroma compounds and development of an aroma language based on odour qualities of defined aqueous odorant solutions, Eur. Food Res. Technol., 228, 265–273, https://doi.org/10.1007/s00217-008-0931-x, 2008.
Fuchs, C., Lensch, H., Brieger, O., Schütze, A., and Baur, T.: P9.6 – Versatile platform for metal oxide semiconductor gas sensors for application specific optimization of temperature cycled operation, 15th Dresdener Sensor-Symposium, Poster, online, 6–8 December, 2021, 316–320, https://doi.org/10.5162/15dss2021/P9.6, 2021.
Hofmann, T., Schieberle, P., Krummel, C., Freiling, A., Bock, J., Heinert, L., and Kohl, D.: High resolution gas chromatography/selective odorant measurement by multisensor array (HRGC/SOMSA): a useful approach to standardise multisensor arrays for use in the detection of key food odorants, Sensor. Actuat. B-Chem., 41, 81–87, https://doi.org/10.1016/S0925-4005(97)80280-8, 1997.
Joppich, J., Su, Z., Marschibois, M., Karst, K., Bur, C., and Schütze, A.: 2.3 – MOS Sensors for Spoilage Detection of Milk using GC-MS and Human Perception as Reference, 16. Dresdener Sensor-Symposium, Dresden, Germany, 5–7 December 2022, Vorträge, 17–22, https://doi.org/10.5162/16dss2022/2.3, 2022.
Keller, A., Zhuang, H., Chi, Q., Vosshall, L. B., and Matsunami, H.: Genetic variation in a human odorant receptor alters odour perception, Nature, 449, 468–472, https://doi.org/10.1038/nature06162, 2007.
Koehne, M., Penagos Carrascal, O. T., Sauerwald, T., and Zeh, G. (Eds.): C2.3 – Entwicklungsplattform für Geruchsmesssysteme, 22. GMA/ITG-Fachtagung Sensoren und Messsysteme, Nürnberg, Germany, 11–12 June 2024, Vorträge, 230–235, https://doi.org/10.5162/sensoren2024/C2.3, 2024.
Kohl, D., Heinert, L., Bock, J., Hofmann, T., and Schieberle, P.: Systematic studies on responses of metal-oxide sensor surfaces to straight chain alkanes, alcohols, aldehydes, ketones, acids and esters using the SOMMSA approach, Sensor. Actuat. B-Chem., 70, 43–50, https://doi.org/10.1016/S0925-4005(00)00552-9, 2000.
Laor, Y., Parker, D., and Pagé, T.: Measurement, prediction, and monitoring of odors in the environment: a critical review, Rev. Chem. Eng., 30, 139–166, https://doi.org/10.1515/revce-2013-0026, 2014.
Mahmoud, M. A. A. and Zhang, Y.: Enhancing Odor Analysis with Gas Chromatography-Olfactometry (GC-O): Recent Breakthroughs and Challenges, J. Agr. Food Chem., 72, 9523–9554, https://doi.org/10.1021/acs.jafc.3c08129, 2024.
Motalebi Damuchali, A. and Guo, H.: Evaluation of a field olfactometer in odour concentration measurement, Biosyst. Eng., 187, 239–246, https://doi.org/10.1016/j.biosystemseng.2019.09.007, 2019.
Oleszkiewicz, A., Heyne, L., Sienkiewicz-Oleszkiewicz, B., Cuevas, M., Haehner, A., and Hummel, T.: Odours count: human olfactory ecology appears to be helpful in the improvement of the sense of smell, Sci. Rep., 11, 16888, https://doi.org/10.1038/s41598-021-96334-3, 2021.
Ortner, E., Granvogl, M., and Schieberle, P.: Elucidation of Thermally Induced Changes in Key Odorants of White Mustard Seeds (Sinapis alba L.) and Rapeseeds (Brassica napus L.) Using Molecular Sensory Science, Agr. Food Chem., 64, 8179–8190, https://doi.org/10.1021/acs.jafc.6b03625, 2016.
Penagos Carrascal, O., Zeh, G., and Sauerwald, T. (Eds.): A4.3 – PC-MOS-Sensorsysteme zur Detektion von flüchtigen organischen Verbindungen in Luft, 22. GMA/ITG-Fachtagung Sensoren und Messsysteme, Nürnberg, Germany, 11–12 June 2024, Vorträge, 101–107, https://doi.org/10.5162/sensoren2024/A4.3, 2024.
Poghossian, A., Geissler, H., and Schöning, M. J.: Rapid methods and sensors for milk quality monitoring and spoilage detection, Biosens. Bioelectron., 140, 111272, https://doi.org/10.1016/j.bios.2019.04.040, 2019.
Prado, K. S., Strangl, M., Pereira, S. R., Tiboni, A. R., Ortner, E., Spinacé, M. A. S., and Buettner, A.: Odor characterization of post-consumer and recycled automotive polypropylene by different sensory evaluation methods and instrumental analysis, Waste Manage., 115, 36–46, https://doi.org/10.1016/j.wasman.2020.07.021, 2020.
Proserpio, C., Graaf, C. de, Laureati, M., Pagliarini, E., and Boesveldt, S.: Impact of ambient odors on food intake, saliva production and appetite ratings, Physiol. Behav., 174, 35–41, https://doi.org/10.1016/j.physbeh.2017.02.042,2017.
Reimringer, W., Haug, H., Seifert, L., and Sauerwald, T.: Sampling Apparatus for the Process Monitoring of Contaminants in Polyolefin Recycling, 2024 IEEE International Instrumentation and Measurement Technology Conference (I2MTC), Glasgow, United Kingdom, 20–23 May 2024, 6 pp., https://doi.org/10.1109/I2MTC60896.2024.10560580, 2024.
Rusinek, R., Siger, A., Gawrysiak-Witulska, M., Rokosik, E., Malaga-Toboła, U., and Gancarz, M.: Application of an electronic nose for determination of pre-pressing treatment of rapeseed based on the analysis of volatile compounds contained in pressed oil, Int. J. Food Sci. Tech., 55, 2161–2170, https://doi.org/10.1111/ijfs.14392, 2020.
Schultealbert, C., Baur, T., Schütze, A., Böttcher, S., and Sauerwald, T.: A novel approach towards calibrated measurement of trace gases using metal oxide semiconductor sensors, Sensor. Actuat. B-Chem., 239, 390–396, https://doi.org/10.1016/j.snb.2016.08.002, 2017.
Schultealbert, C., Amann, J., Baur, T., and Schütze, A.: Measuring Hydrogen in Indoor Air with a Selective Metal Oxide Semiconductor Sensor, Atmosphere, 12, 366, https://doi.org/10.3390/atmos12030366, 2021.
Sensirion: SGP40 – VOC sensor for HVAC and air quality applications: Datasheet SGP40, https://sensirion.com/products/catalog/SGP40, last access: 30 August 2023.
Song, H. and Liu, J.: GC-O-MS technique and its applications in food flavor analysis, Food Res. Int., 114, 187–198, https://doi.org/10.1016/j.foodres.2018.07.037, 2018.
VDI/VDE 3518 Part 3: Multigassensoren – Geruchsbezogene Messungen mit elektronischen Nasen und deren Prüfung, https://www.vdi.de/richtlinien/details/vdivde-3518-blatt-3-multigassensoren-geruchsbezogene-messungen-mit-elektronischen-nasen-und-deren-pruefung (last access: 20 October 2023), 2018.
Wang, Y., Shao, L., Kang, X., Zhang, H., Lü, F., and He, P.: A critical review on odor measurement and prediction, J. Environ. Manage., 336, 117651, https://doi.org/10.1016/j.jenvman.2023.117651, 2023.
Zeh, G., Koehne, M., Grasskamp, A., Haug, H., Singh, S., and Sauerwald, T. (Eds.): Towards Artificial Intelligent Olfactory Systems, 2022 IEEE International Symposium on Olfaction and Electronic Nose (ISOEN), Aveiro, Portugal, 29 May–1 June 2022, 2 pp., https://doi.org/10.1109/ISOEN54820.2022.9789600, 2022.