
the Creative Commons Attribution 4.0 License.
the Creative Commons Attribution 4.0 License.
 | 15 Jul 2026
Development and optimization of an OF-CEAS system for stable isotopic ratio analysis of methane (δ13C-CH4) in the mid-infrared
Ponkanok Nitzsche
Jens Goldschmidt
Christian Weber
Leonard Nitzsche
Katrin Schmitt
Jürgen Wöllenstein
High-precision analysis of the stable isotopic composition of atmospheric methane (CH4) is essential for attributing its sources and sinks and for a more precise understanding of the global methane cycle. Although conventional isotope ratio mass spectrometry (IRMS) provides high accuracy, it lacks in situ capabilities and provides only low data rates. Tunable laser spectrometers offer higher acquisition rates and high sensitivity. In accordance with the Beer–Lambert law, the absorption signal increases proportionally with the optical path length, requiring kilometer-scale paths for atmospheric CH4 detection and thus the use of optical cavities. Here, we present an optical feedback cavity-enhanced absorption spectroscopy (OF-CEAS) system for determining the isotopic ratio (δ13C) of the stable isotopologues 12CH4 and 13CH4 in the mid-infrared range at 3000 cm−1 (3333 nm wavelength). The optical setup comprises a high-finesse V-shaped cavity with highly reflective mirrors (r=0.999893), resulting in a theoretically effective path length of 22.53 km, which is integrated into an Invar cell with active temperature and pressure stabilization. Allan deviation analysis of the temperature regulation shows a minimum of σ=8.85 µK at an integration time of , and for the gas temperature inside the cell, it gives a minimum of σ=600 µK at τ=6 s, which shows thermal stability that is compatible with an uncertainty in the isotopic ratio of ≤0.1 ‰ (Bergamaschi et al., 1994). Spectral measurements confirm active cavity locking, a symmetric mode structure and frequency calibration using a germanium etalon and a methane reference cell. The spectral resolution of the measurement is given by the free spectral range (FSR) of the cavity with FSR≈84 MHz. The system presented here demonstrates the stability and resolution required for high-precision isotopic methane analysis.
- Article
(4319 KB) - Full-text XML
- BibTeX
- EndNote


The study of greenhouse gases such as methane (CH4) and carbon dioxide (CO2) is crucial to understanding the impact of greenhouse gas emissions on global warming and making accurate climate predictions. The current concentration of CH4 in the atmosphere is 1.9 ppm, a value that has doubled over the last 200 years and continues to rise steadily. In addition, it has a greenhouse potential 30 times higher than CO2, making it the second most important greenhouse gas after CO2 (Masson-Delmotte et al., 2023; Myhre et al., 2014). It is therefore particularly important to identify and monitor CH4 sources and sinks, which allows the cycle of CH4 to be studied, as well as its contribution to global warming. Sources and sinks can be identified by determining the stable isotopic ratio (δ13C) between the two stable isotopologues, 12CH4 and 13CH4. This ratio is referenced to the Vienna Pee Dee Belemnite (VPDB) standard and gives a distinct fingerprint of every source and sink of atmospheric methane. The resulting δ13C values are −43 ‰ for natural gas (the largest anthropogenic source of CH4) and −60 ‰ for natural sources such as wetlands (Schaefer et al., 2016; Quay et al., 1999).
Isotope ratio mass spectrometry (IRMS) is the established reference method for δ13C determination and provides excellent precision (Brand, 1996). However, IRMS typically requires laboratory infrastructure, sample collection in flasks, and chemical pre-treatment of the sample prior to analysis, which prevents continuous in situ operation and limits the achievable temporal resolution at remote field sites. These limitations have motivated the development of optical absorption-based methods, which can be operated as compact field instruments and, in modern implementations, achieve precision approaching that of IRMS while offering high temporal resolution and continuous monitoring capability.
A broad range of laser-based optical absorption techniques has been developed for trace gas and isotopic ratio analysis, differing primarily in their effective optical path length, the spectral region addressed, and the detection scheme. Tunable diode laser absorption spectroscopy (TDLAS) in direct-absorption or wavelength-modulation configurations (Werle, 1998) represents the most straightforward implementation but is limited in sensitivity by the short single-pass interaction length. Multi-pass cells of Herriott or White type extend the optical path to several tens of meters and have been combined with both near-infrared diode lasers and mid-infrared quantum cascade lasers (QCLAS) to access the stronger fundamental absorption bands of CH4 and its isotopologues (McManus et al., 1995; McManus, 2010; Tuzson et al., 2008). Photoacoustic and quartz-enhanced photoacoustic spectroscopy (QEPAS) (Patimisco et al., 2014) provide an alternative detection principle particularly suited to compact and miniaturized instrument designs. Cavity-based methods, in which the optical interaction length is enhanced by coupling light into a high-finesse optical cavity, achieve effective path lengths of several kilometers and enable trace gas detection at the parts-per-billion level or below. The most established variants are cavity ring-down spectroscopy (CRDS) (Crosson, 2008; Long et al., 2011; Zellweger et al., 2016; Dahnke et al., 2001), integrated cavity output spectroscopy (ICOS) and its off-axis variant (OA-ICOS) (Baer et al., 2002; O'Keefe, 1998), and cavity-enhanced absorption spectroscopy (CEAS) in its various implementations.
In this work, optical feedback cavity-enhanced absorption spectroscopy (OF-CEAS) is utilized, a CEAS variant in which a fraction of the resonant intracavity field is fed back into the laser source to act as injection seeding (Morville et al., 2002, 2005). OF-CEAS has been successfully demonstrated for high-precision trace gas and isotopologue measurements across the near- and mid-infrared using diode lasers (Kerstel et al., 2006; Habig et al., 2012), quantum cascade lasers (Bergin et al., 2013; Manfred et al., 2015), and interband cascade lasers (Lechevallier et al., 2019). The key mechanism is resonant optical feedback, coupling the laser source to a high-finesse optical cavity. A V-shaped cavity geometry is employed to provide controlled and stable optical feedback: the non-collinear configuration spatially separates the injected and reflected fields, thereby suppressing parasitic back reflections and enabling selective feedback of the cavity fundamental mode, which is essential for robust frequency locking. A portion of the intra-cavity field that is phase-coherent with the cavity modes is coupled back into the laser, thereby influencing the oscillation conditions of the laser medium. This feedback acts analogously to injection seeding, forcing the laser frequency to adapt to one of the cavity's longitudinal modes (Ohshima and Schnatz, 1992; Morville et al., 2002). Consequently, the laser becomes locked to the cavity modes during wavelength tuning. In addition to frequency stabilization, resonant feedback significantly suppresses phase and frequency noise, resulting in strong narrowing of the laser linewidth. Under favorable conditions, the effective laser linewidth can be smaller than the linewidth of the cavity modes. These effects ensure stable resonance matching between the laser and the cavity, forming the basis for the exceptional sensitivity and spectral resolution achievable with OF-CEAS (Morville et al., 2005). The resulting high spectral resolution and frequency stability are especially beneficial for stable isotopic ratio analysis, enabling accurate discrimination of weak isotopologue absorption lines in the presence of much stronger neighboring transitions.
The strongest absorption band for CH4 is the ν3 fundamental in the mid-infrared (MIR) region at around 3000 cm−1 (∼ 3333 nm wavelength). Precise and selective measurements require the selection of absorption lines satisfying the following criteria.
-
The absorption lines of the stable isotopologues should lie within the laser's spectral tunability range so that the isotopic ratio can be determined in a single scan.
-
Cross-sensitivities to interfering atmospheric species should be minimized. This is achieved through the selection of a spectral window in which the targeted CH4 lines are not overlapped by strong transitions of atmospheric interferents and by applying reduced pressure, which narrows the absorption features through suppression of pressure broadening and provides clear spectral separation between otherwise overlapping lines.
-
The selected absorption lines should have similar strengths to minimize the detector saturation at specific spectral frequency and optimize the signal-to-noise ratio (SNR).
The Q branch of the ν3 band satisfies the first criterion. In this branch, strong 13CH4 lines lie next to weaker 12CH4 lines. However, the weaker 12CH4 lines generally have a higher ground state energy than the 13CH4 lines. According to Bergamaschi et al. (1994), this results in a higher temperature dependence of the isotopic ratio, given by
with the energy difference between the ground state energies ΔElower of the two relevant lines of 12CH4 and 13CH4, the absolute temperature T, and the Boltzmann constant kB.
A spectral window satisfying all specified criteria was found by simulating the absorption spectrum using spectroscopic parameters from the HITRAN database (Gordon et al., 2022). For the simulation, an absorption path length of l=10 km, a pressure of p=40 mbar, and a temperature of T=308.15 K were specified. The low-pressure condition was selected to minimize pressure broadening and thus achieve well-resolved, distinct absorption lines. The temperature was set to 308.15 K to ensure stable measurement conditions independent of ambient temperature fluctuations, as this value exceeds the expected ambient temperature range and allows thermal stabilization through heating alone, without the need for active cooling. The CH4 concentration corresponds to the ambient atmospheric concentration of . To assess cross-sensitivities, all atmospheric species with known absorption features in the simulation window were included at their representative tropospheric background concentrations: CO2 (), ozone (O3) (), nitrous oxide (N2O) (), carbon monoxide (CO) (cCO=100 ppb) (Masson-Delmotte et al., 2023), and ethane (C2H6) () (Helmig et al., 2016). The H2O concentration was set to such that its absorption is comparable in magnitude to the species of interest, for illustration purposes. The simulation results are shown in Fig. 1. The area between 3000.5 and 3001.5 cm−1 lies within the laser's tuning range and contains the two stable isotopologues, 12CH4 and 13CH4 with the selected transitions corresponding to the 12CH4 Q(18) and 13CH4 Q(12) lines (Gordon et al., 2022; Bergamaschi et al., 1994).
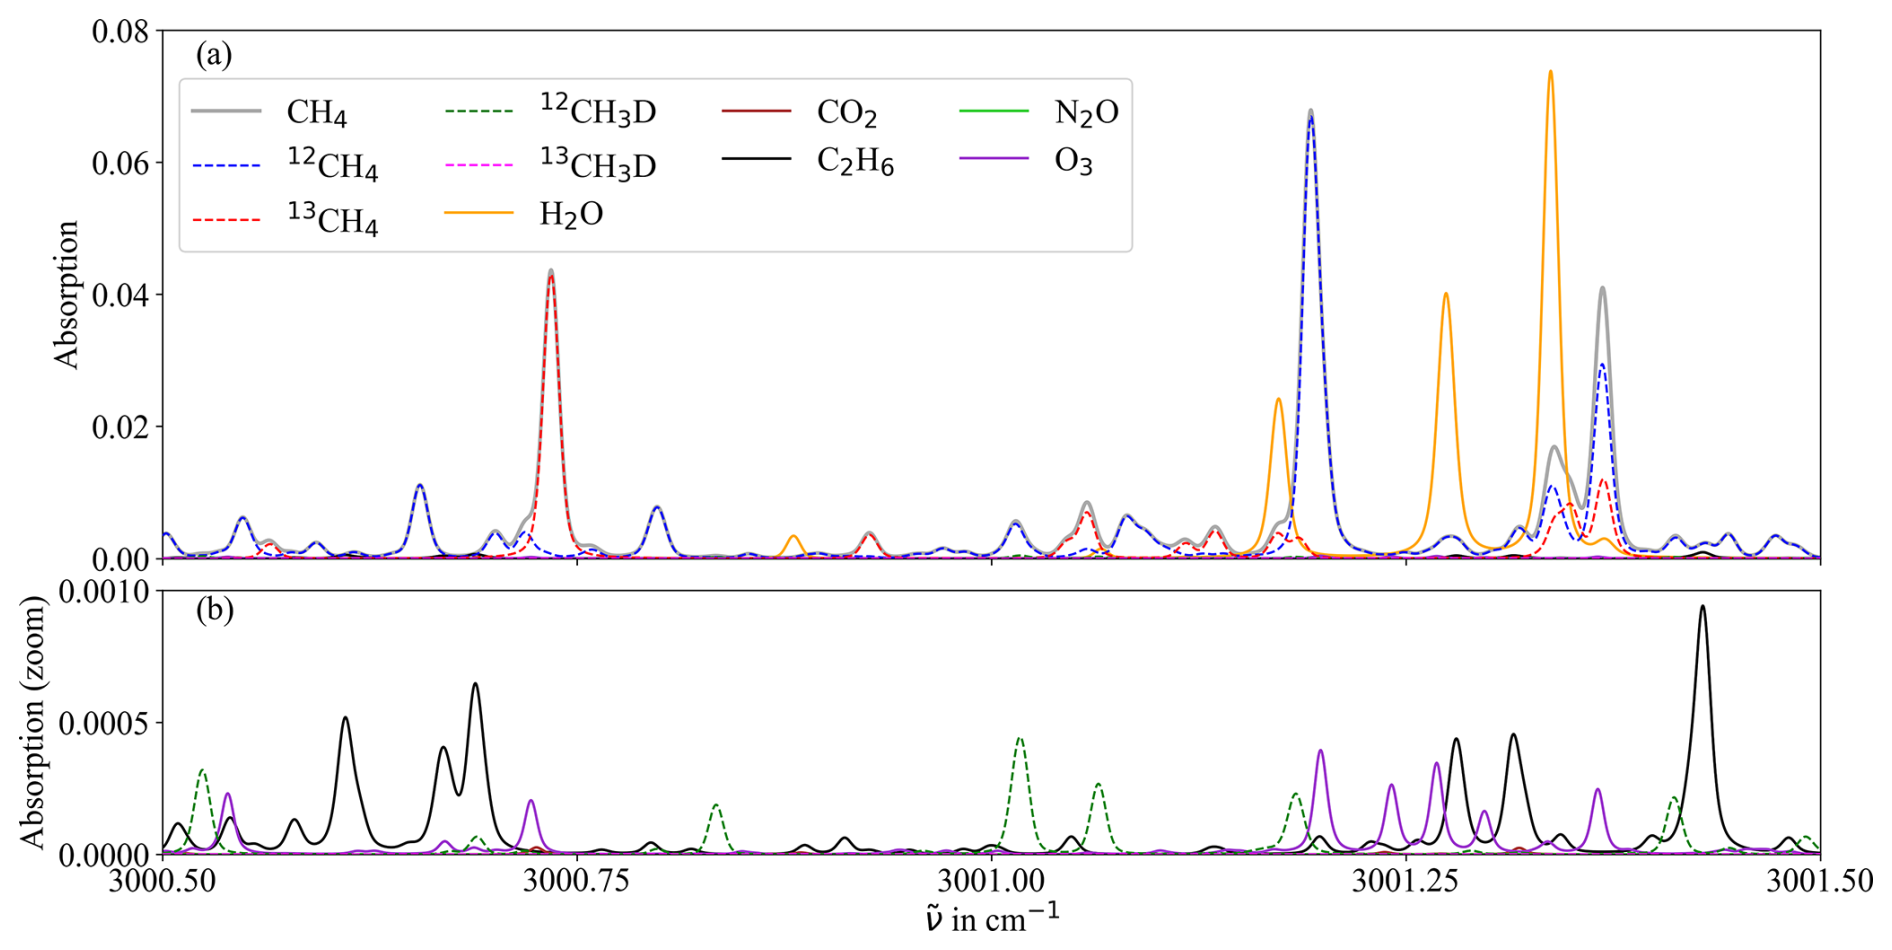
Figure 1Simulated absorption spectra of CH4 and relevant atmospheric interferents in the spectral window 3000.5–3001.5 cm−1, calculated using line parameters from the HITRAN database (Gordon et al., 2022) at p=40 mbar, T=308.15 K, and an effective absorption path length of l=10 km. Panel (a) shows the full absorption range with all simulated species. Panel (b) shows an enlarged view of the low-absorption region (zoom), revealing the spectral contributions of C2H6, 12CH3D, N2O, and O3, which are not visible on the scale of (a). Concentrations used in the simulation: , , , , , cCO=100 ppb, . The H2O concentration was set to 1000 ppm for illustration purposes, such that its absorption is comparable in magnitude to the species of interest.
The central peak positions of these transitions are 3001.1926 cm−1 for 12CH4 and 3000.7342 cm−1 for 13CH4, with line strengths of for 12CH4 and for 13CH4. The corresponding ground state energies in HITRAN-units are and . As mentioned above and to illustrate the resulting temperature influence, a further simulation was carried out with temperature changes of ±5 K at a constant pressure of 40 mbar. The results are shown in Fig. 2, where Fig. 2a and b depict the temperature dependence of the selected 12CH4 and 13CH4 absorption lines, respectively. The simulations show that the response of the two isotopologues to temperature changes differs in magnitude and depends on the energy of the ground states of the corresponding transitions. For 12CH4 (Fig. 2a), temperature variations lead to a pronounced change in absorption strength, whereas for 13CH4 (Fig. 2b) the corresponding variation is about a factor of 7 weaker within the investigated temperature range and therefore not readily apparent on the chosen scale. This difference arises from the lower ground-state energy of the selected 13CH4 transition. According to the Boltzmann distribution, populations of higher-energy ground states are more sensitive to temperature variations, resulting in stronger changes in absorption intensity. Using this information and the given values, Eq. (1) can be used to determine the resulting uncertainty in the isotopic ratio for a temperature deviation. The isotopic ratio is expressed in the conventional δ-notation relative to the Vienna Pee Dee Belemnite (VPDB) standard as
where and RVPDB=0.0111105 (Dunn et al., 2024). Since the concentrations of both isotopologues are retrieved from temperature-dependent absorption line parameters, even small temperature deviations lead to unequal changes in the fitted line strengths and thus to systematic errors in the derived isotopic ratio. Applying Eq. (1) shows that, to achieve an uncertainty of ≤0.1 ‰ in δ13C, the deviation of the gas temperature must be limited to ≤6.8 mK. In comparison, pressure variations affect both isotopologues in a similar manner and therefore have no significant influence on the accuracy of the isotopic ratio determination. This behavior is illustrated in Fig. 2c and d for 12CH4 and 13CH4, respectively, based on simulations carried out at constant temperature while varying the pressure around 40 mbar by ±5 mbar. Nevertheless, pressure-induced changes in absorption strength and linewidth are clearly observable and reduce the achievable measurement precision. Although the gas temperature can in principle be measured and used for spectroscopic corrections, isotopic ratio retrieval is highly sensitive to small temporal temperature drifts and spatial temperature gradients along the optical path. These effects alter the line strengths and line shapes of the 12CH4 and 13CH4 absorption features with different magnitudes due to their different temperature dependencies, leading to a systematic bias in the retrieved isotopic ratio that cannot be fully compensated for by the temperature readout alone. For this reason, active temperature stabilization of the gas cell is required to ensure reproducible isotopic ratio determination over extended measurement periods. The remaining weak absorption features in the investigated spectral window have no significant influence on the measurement due to their low line strengths and their spectral position relative to the targeted 12CH4 and 13CH4 transitions. Nevertheless, residual spectral contributions from atmospheric trace gases, such as C2H6, are rigorously accounted for by incorporating all identified interferents into a multispecies HITRAN fit. The cross-sensitivity to H2O can be significantly reduced by drying the sample gas prior to analysis by, e.g., using a cold trap (Bergamaschi et al., 1994).
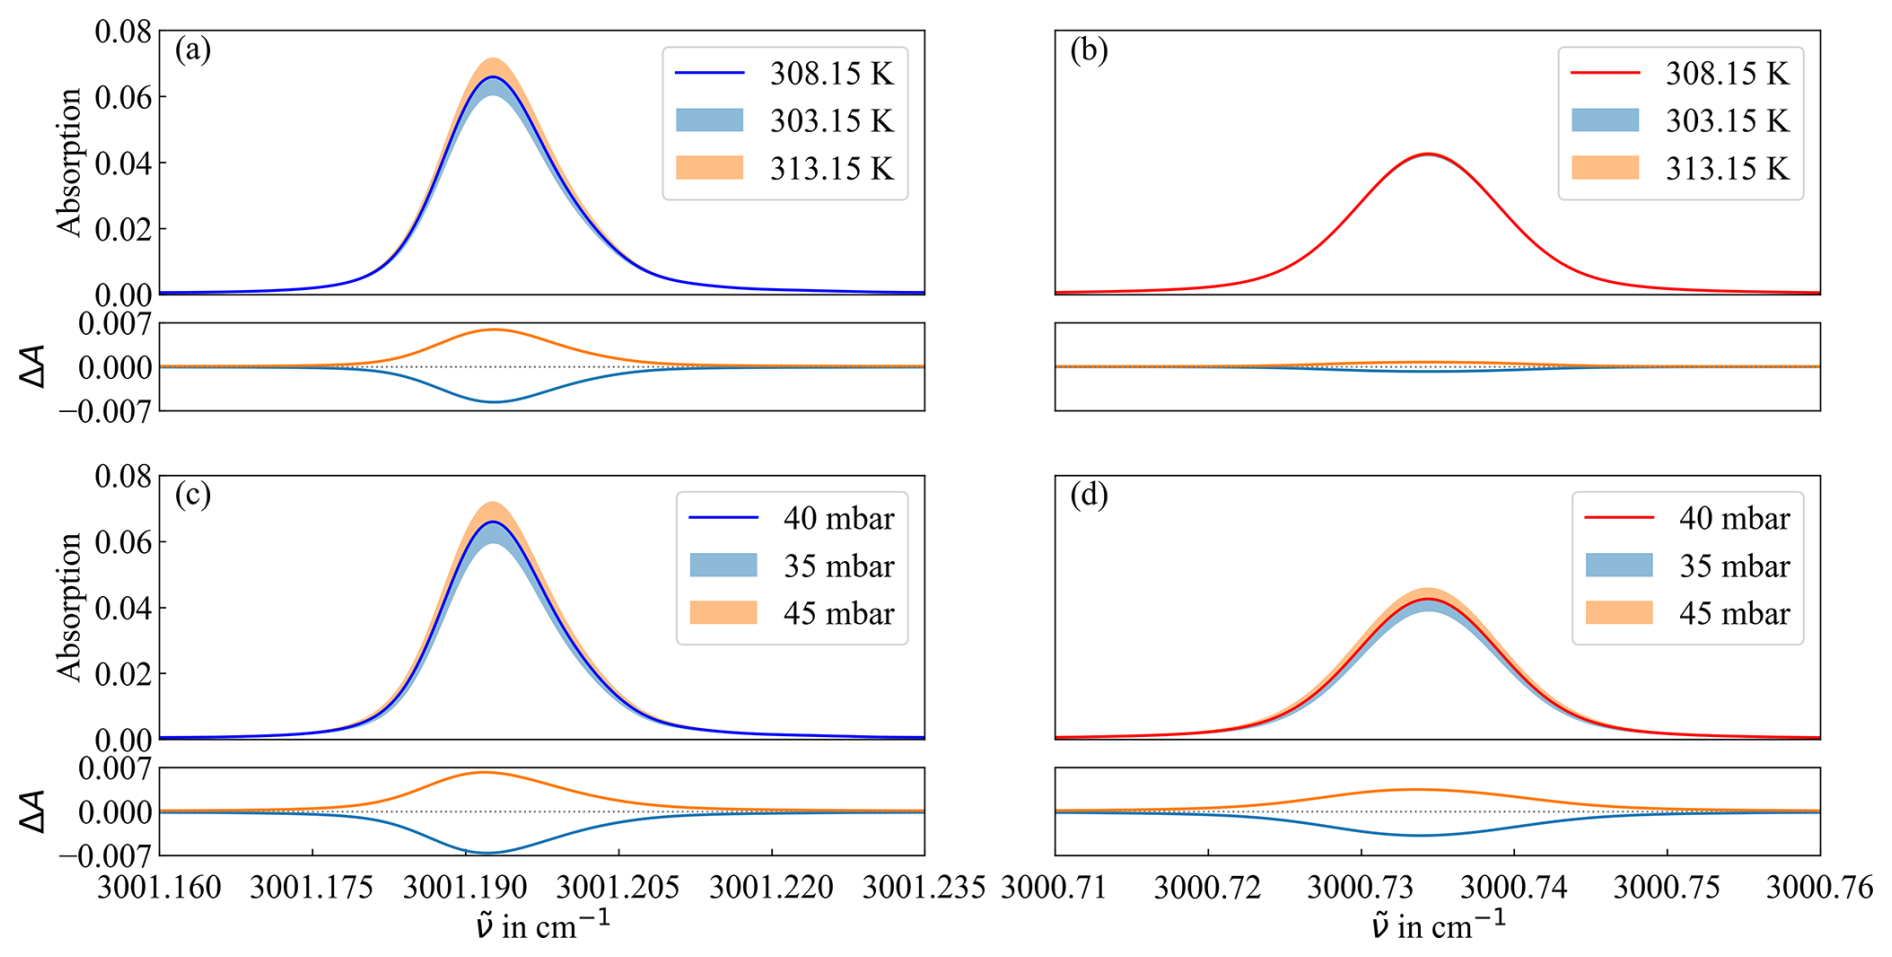
Figure 2Simulation of the influence of temperature and pressure variations on the selected absorption lines of 12CH4 and 13CH4 based on HITRAN data. Panels (a), (b) show the temperature dependence of the 12CH4 and 13CH4 lines, respectively, for temperatures of 303.15, 308.15, and 313.15 K at a constant pressure of 40 mbar. The corresponding lower subpanels display the differential absorption ΔA relative to the reference temperature of 308.15 K. Panels (c), (d) illustrate the effect of pressure variations (35, 40, and 45 mbar) at a constant temperature of 308.15 K, again with the lower subpanels showing ΔA relative to 40 mbar. While pressure changes induce comparable variations for both isotopologues, temperature variations lead to significantly larger changes in absorption for 12CH4 than for 13CH4, reflecting their different lower-state energies and resulting in a higher temperature sensitivity of the isotopic ratio determination.
The schematic of the experimental setup is shown in Fig. 3. An interband cascade laser (ICL) from Nanoplus GmbH with a central wavenumber of 2998.5 cm−1 (3335 nm wavelength) is used. The operating wavelength was selected based on prior spectroscopic simulations using the HITRAN database, following the line selection procedure described earlier. The laser current is controlled by QubeDL02-TD from ppqSense with a set point of IICL=45 mA, while the laser temperature is controlled by a LDC-3722 from ILX Lightwave at TICL=10.4 °C. The laser is modulated via a ramp signal generated by a function generator (SDG 2122X, Siglent) with a ramp frequency of framp=1 Hz and an amplitude of . We use the LDC-3722 temperature controller at this ramp rate because it offers more stable operation in this range than the internal controller of the QubeDL02-TD. The laser beam is split via pellicle beam splitters (BP145B4, Thorlabs) (BS1 and BS2), leading to the cavity on one side and to the reference cell and a germanium (Ge) etalon on the other. The reference cell (wavelength references) is filled with CH4 and hermetically sealed at a pressure of approximately 40 mbar. The Ge-etalon (QMACS, neoplas control) is passively temperature stabilized by being mounted in thermally insulated housing, reducing short-term temperature fluctuations, and it has a length of 76.31 mm, resulting in a free spectral range (FSR) of 477.87 MHz (0.01594 cm−1) with a refractive index of n=3.99 in this wavenumber region (Amotchkina et al., 2020). A Ge-etalon in combination with a reference gas cell is used to calibrate the wavenumber axis of the laser scan. The etalon provides evenly spaced transmission fringes, enabling correction of scan nonlinearities, while the reference cell supplies absolute frequency markers. This combined calibration yields an accurate and linear wavenumber scale across the entire scan range. Based on this calibrated axis, key cavity parameters such as the free spectral range, resonance linewidth, and finesse are determined.
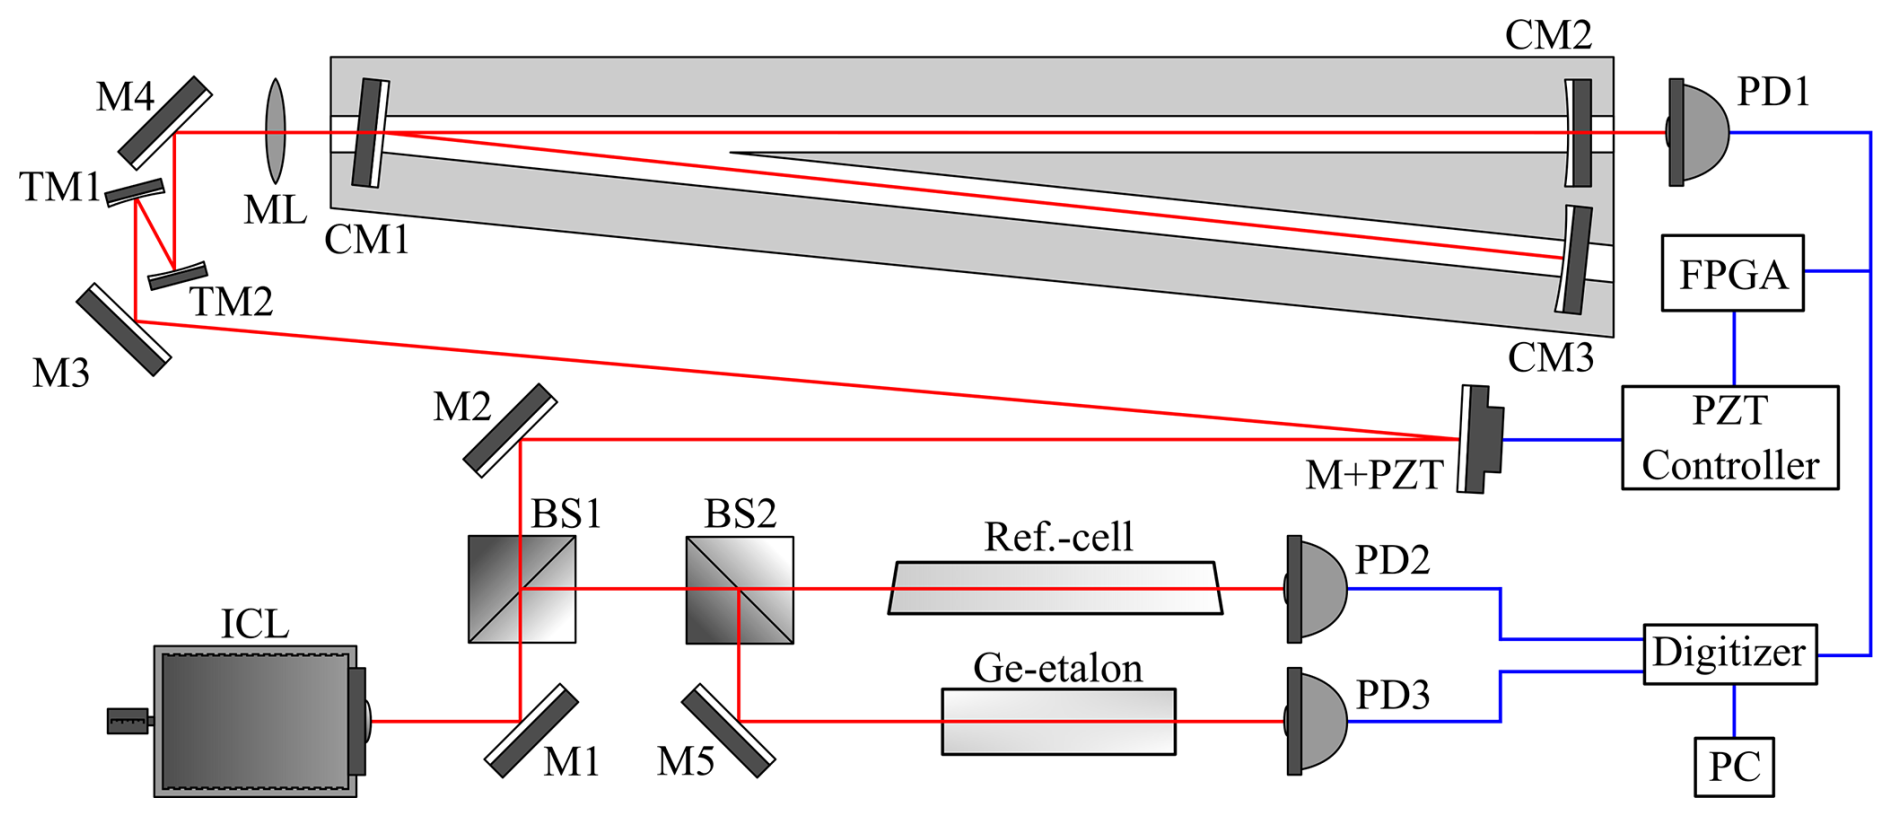
Figure 3Schematic representation of the optical setup for the OF-CEAS. The beam (red) of an ICL is split into two paths. One path goes to a reference cell filled with CH4 and a Ge-etalon, which is used for wave number axis calibration. The other beam path leads to the cavity with mode matching, which uses a telescope setup (TM1 and TM2) and a matching lens (ML). The cavity is located inside housing made of Invar with temperature stabilization and a pressure sensor, as well as PT1000 temperature sensors for determining the gas temperature. The electronic schematic (blue) shows the photodetector signals' path with the signal of PD1 used to generate the error signal with the FPGA for active phase stabilization by adjusting the distance in the sub-micron range using a mirror and precisely controlling its position with a piezo stack (M+PZT).
Data are recorded using a photodetector (PVI-4TE-3.4, Vigo Systems) for the cavity transmission and two for the transmission through the reference cell and the Ge etalon. The photodetector signals are digitized with a four-channel digitizer (M4i.4421-x8, Spectrum Instrumentation) with 16 bit resolution and a maximum sampling rate of 250 MS s−1. To ensure precise timing and phase coherence, a multi-clock board (Si5341-EB, Silicon Labs) is used to synchronize the digitizer, function generator, and all relevant electronic components. The design of the cavity and the parameters for mode matching, including the calculated beam waist and the relative positions of the telescope, mode-matching optics, and cavity, are derived from simulations based on Gaussian beam optics (Kogelnik and Li, 1966).
The cavity is basically a folded linear cavity forming a “V” shape with one planar mirror (CM1) and two concave mirrors (CM2 and CM3) with radii of curvature R=1000 mm and a reflectivity of r=0.999893 (Layertec). The two cavity arms have a length of each with an angle of about in between. The theoretically achievable effective absorption path length is 22.53 km with an FSR of 83.1 MHz. From the chosen design parameters, the corresponding cavity parameters were derived. The beam waist of 0.56 mm is located on mirror CM1, the beam radius on each of the two concave mirrors is 1.79 mm, and the Rayleigh length is 295.7 mm. In the beam path to the cavity, mode matching is performed using a telescope assembly consisting of two concave 0.5 in. mirrors with focal lengths f1=25 mm (TM1) and f2=9.5 mm (TM2) mounted on clear-edge mirror mounts (KM05FL/M, Thorlabs). This enables compact design and reduces the angle of incidence to ≤10°, which also minimizes astigmatism effect. The telescope adapts the beam diameter and, in combination with a mode-matching lens with a focal length of f=250 mm (ML), is positioned according to the calculated mode-matching parameters, with a distance of d1≈105 mm from the telescope focus and d2≈85 mm to the cavity beam waist located at mirror CM1. A beam profiling camera (WinCamD-IR-BB, DataRay) was used to adjust and optimize the beam profile for mode matching. For OF-CEAS, the V-shaped cavity offers the advantage that the deflected beam path effectively suppresses unwanted parasitic feedback from direct mirror reflections, which could otherwise destabilize the coupling. This means that only the portion of light that circulates resonantly in the cavity and exits via the mirrors is coupled back into the laser. Injection seeding is thus achieved while maintaining the phase condition (Morville et al., 2005). The phase of the returning beam must match that of the beam emerging from the laser. The phase condition can be fulfilled by adjusting the distance between the laser and the cavity (LLC), which has to be met throughout the entire scanning process of the laser. The optimal phase for all longitudinal modes is achieved when the distance is , where . Whether k is an even or odd number has an effect on the spectral resolution. With an odd number, every longitudinal mode has the optimal phase, while with an even number, this only applies to every second longitudinal mode. To keep the design compact, k was set to 1 in this work, resulting in LLC=902 mm. The optical components were placed accordingly and the ICL was mounted on a translation stage (XR50C/M, Thorlabs) for rough adjustment of the distance. To adjust the distance in the sub-micron range and actively stabilize the phase, the mirror positions are precisely controlled by a piezo stack. Deviations from LLC result in a transmission signal with a beating pattern consisting of mode groups of varying intensities, whose period increases as LLC is approached until it finally reaches infinity at LLC. Upon closer inspection of individual modes, an asymmetry of the modes is observed, and symmetry is only achieved when LLC=902 mm. This influence on the symmetry of the modes is used to generate an error signal with a FPGA (STEMlab 125-14, Red Pitaya), which is used to move the mirror on the piezo stack. For this purpose, the transmission signal of the cavity is detected, and the detector signal is split in two branches via a power splitter (ZFRSC-183-S+, Mini-Circuits). The detector signal is recorded with the digitizer and, additionally, it is fed into the FPGA for real-time error signal generation. The FPGA runs a Python script, which derives the signal in real time and generates the error signal by determining the amplitudes of the maxima and minima of the first derivative and calculating their sum. In the case of symmetry, the sum is zero; in the case of asymmetry, the sum is nonzero with a positive or negative sign, depending on the direction of the shift in the mode maxima. This results in the error signal, whose sign indicates the direction in which the phase must be adjusted (Habig et al., 2012). Finally, the error signal is forwarded to a piezo controller (MDT693B, Thorlabs) to control the piezo stack's displacement.
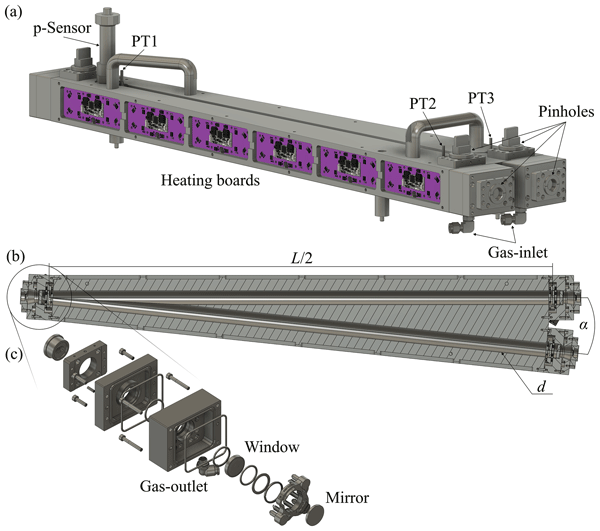
The cavity is located inside a specially designed Invar cell containing cylindrical bores with a diameter of that merge at one end, thereby defining a V-shaped cavity geometry (Fig. 4). The cell is equipped with gas connections, a pressure sensor (PAA-33X, Keller), and three Pt1000 temperature sensors, one at each end of the cell, allowing the temperature distribution along the full cavity length to be monitored. The internal volume of the gas cell is approximately . Twelve electronic heating elements with implemented PID control were designed and installed on the sides of the cell to stabilize the temperature to 308.15 K. In addition, the cell was thermally insulated with 10 mm thick expanded polystyrene (EPS). The cavity mirrors are mounted inside vacuum-compatible end caps that integrate both the mirror holders and wedged optical windows. The end caps allow precise cavity alignment and subsequently provide a gas-tight seal of the cell using FKM O-rings. Internal gas channels within the end caps ensure complete flushing of the entire cell volume. For optical alignment, temporary pinholes can be inserted at designated positions at the window sides and on the top of the cell, which are replaced by sealing plugs after alignment. The windows are wedged and made of sapphire with anti-reflection coatings (WW31050-E1, Thorlabs). The mirror mounts for the highly reflective cavity mirrors (Polaris series K1S5, Thorlabs) are specially designed for vacuum applications and are integrated into custom-designed end caps. This design enables precise cavity alignment followed by gas-tight sealing of the cell using FKM O-rings, while integrated gas ports and internal gas routing within the end caps ensure complete flushing of the entire cell volume. The reduced pressure in the cell with p=40 mbar is achieved using a vacuum pump system (NG920G pump and the associated VC900 controller, KNF).
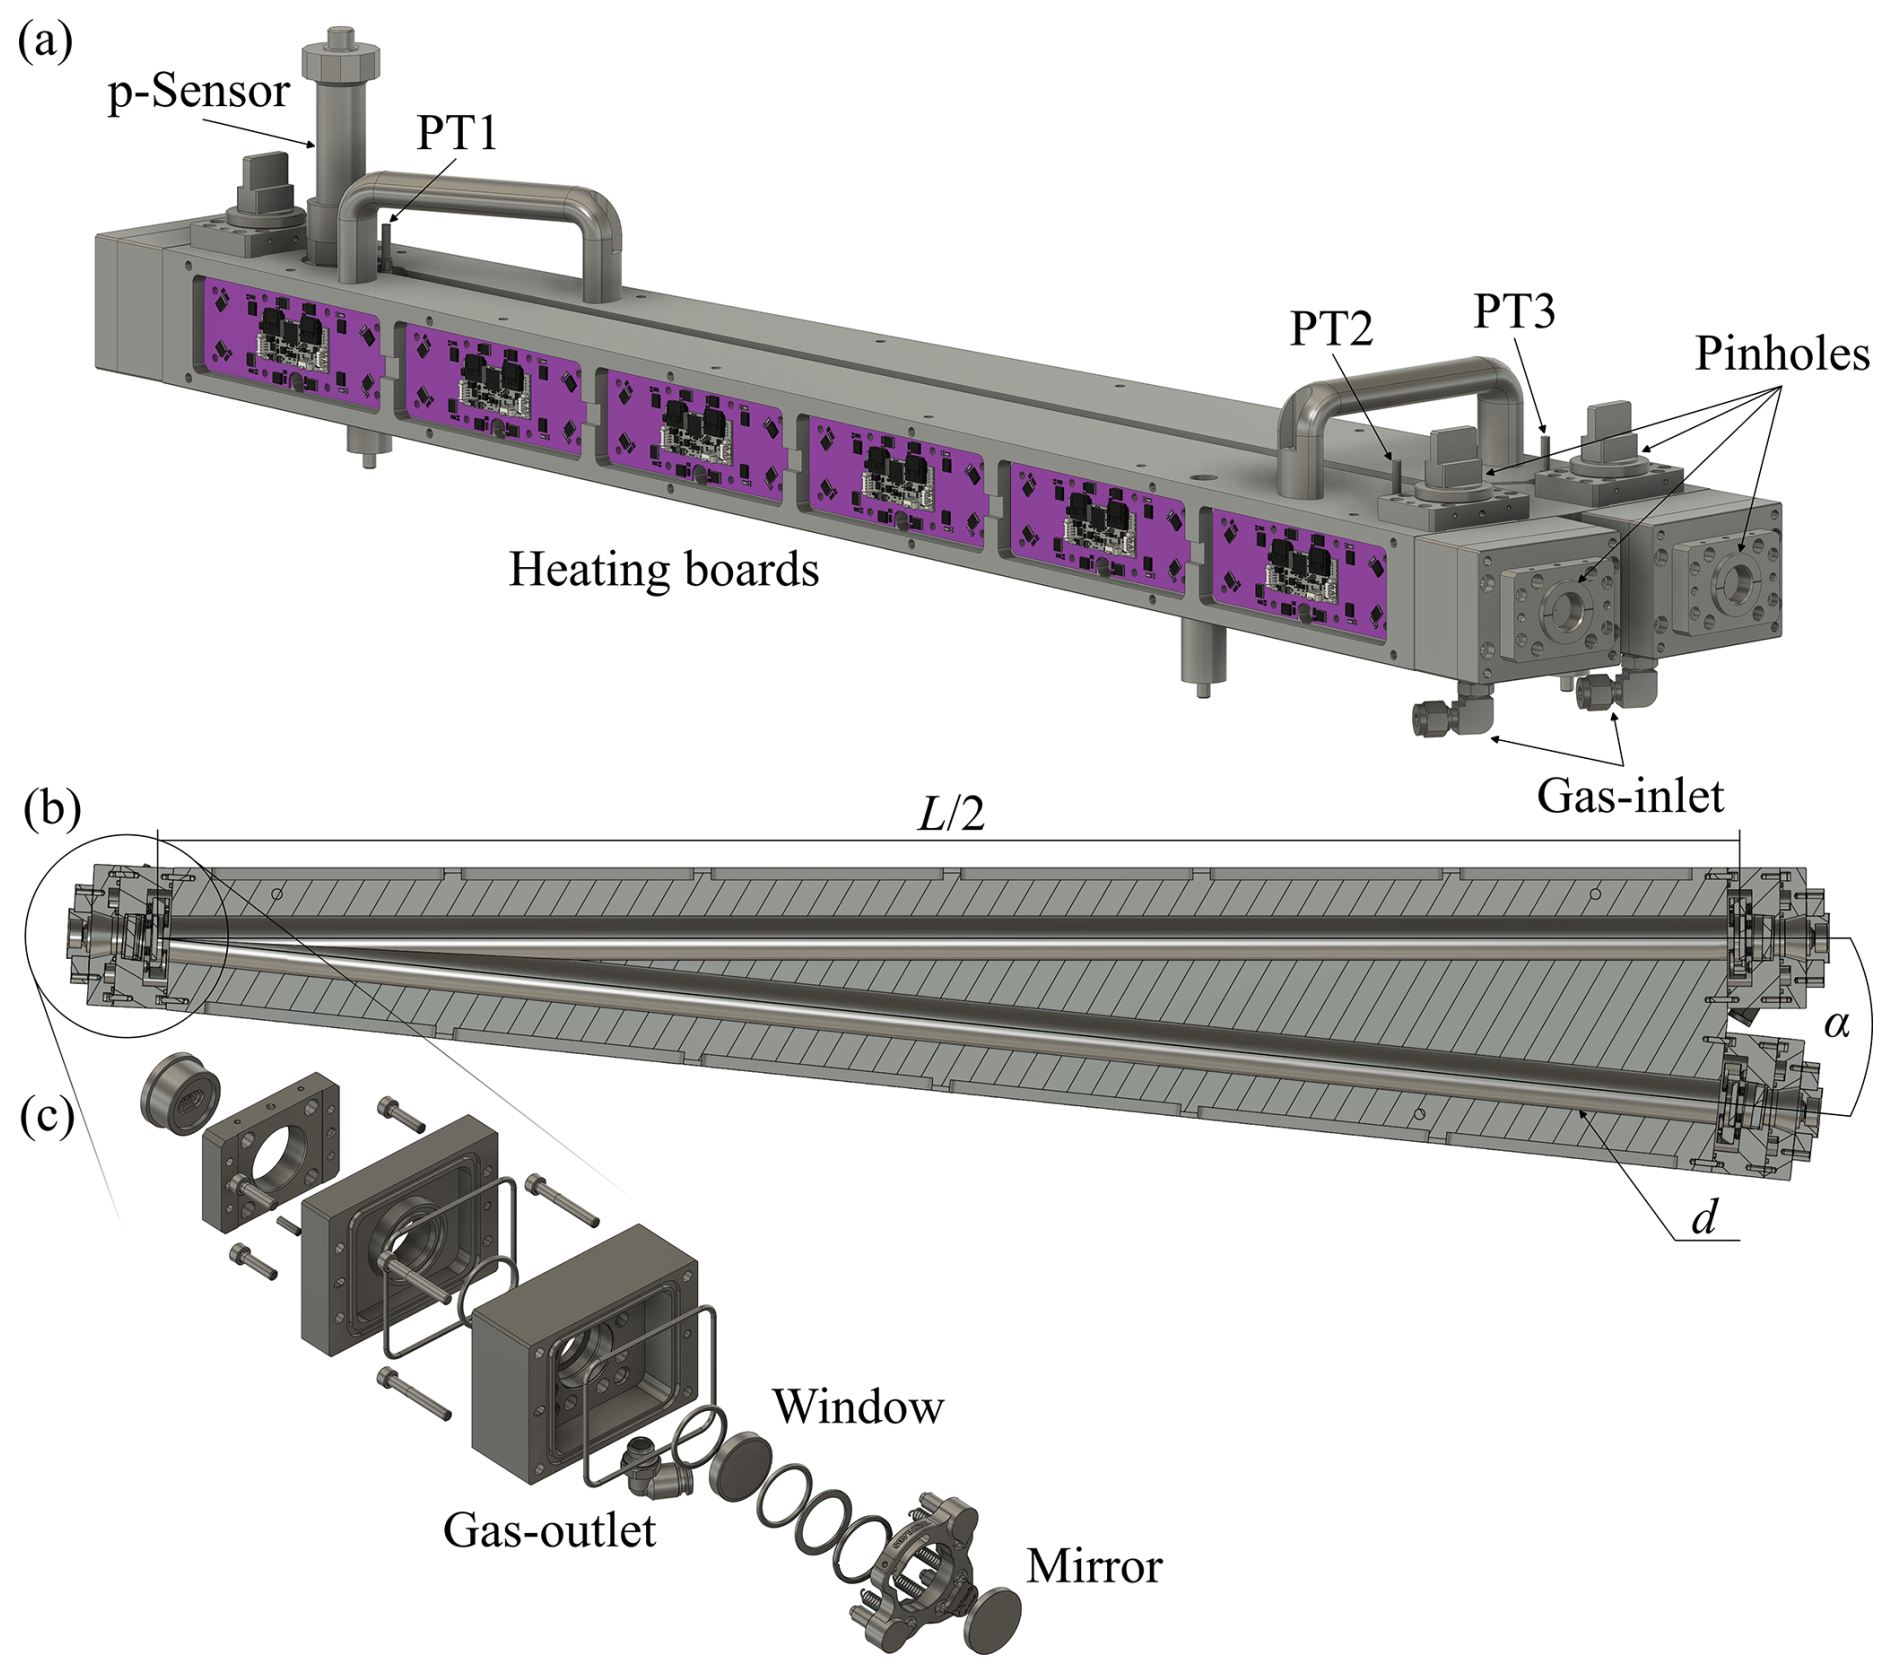
Figure 4(a) Invar cell housing the V-shaped cavity, equipped with six heating plates on each side, gas connections, a pressure sensor, and three Pt1000 temperature sensors mounted at each end of the cell. The design further allows the temporary insertion of pinholes for cavity alignment, which are subsequently replaced by sealing plugs. (b) Cross-sectional view of the cell illustrating the optical beam path through two boreholes that merge at one end. The borehole diameter is . The individual cavity arm lengths – defined as the mirror-to-mirror distances – are and are separated by an angle of . (c) Detailed view of one end cap integrating the wedged window and the mirror mount holding the cavity mirror. The design enables precise cavity alignment followed by a gas-tight sealing of the cell using FKM O-rings. The gas port and internal gas routing within the end caps ensure complete flushing of the cell volume with a value of approximately .
As already described, temperature is a critical parameter to precisely determine the stable isotopic ratio of atmospheric methane that should be precisely controlled. Therefore, the cell was designed in such a way that it is possible to regulate and precisely determine the cell temperature while ensuring long-term stability of the cavity's temperature. To minimize thermally induced dimensional changes, Invar was selected as the cavity material. Invar exhibits an exceptionally low coefficient of thermal expansion, resulting in only negligible deformation under temperature variations. This is particularly advantageous in optical assemblies, as the alignment of sensitive components, such as the cavity mirrors, remains stable even under mild fluctuations in the ambient temperature. Consequently, positional drift and optical misalignment are effectively suppressed. In addition to thermal stability, the pressure stability inside the cavity is important since the isotope ratio is measured under reduced pressure. The assembled cell was therefore subjected to a leak test and was found to have a leak rate of . This ensures negligible pressure drift, especially since the effect of a pressure change has a comparable effect on both isotopologues. Active thermal stabilization is implemented using heating boards regulated by PID controllers. Six heating modules are symmetrically mounted on each side of the cell to ensure uniform temperature distribution. Feedback for the control loop is provided by embedded thermistors (NTC, negative temperature coefficient) in the cell material. The 12 NTC sensors were all calibrated precisely under the same conditions. Following integration of the heating boards onto the cell, the PID parameters were tuned. For this purpose, each heating board was actuated individually first and subsequently all boards were driven collectively to verify stable and coordinated thermal control.
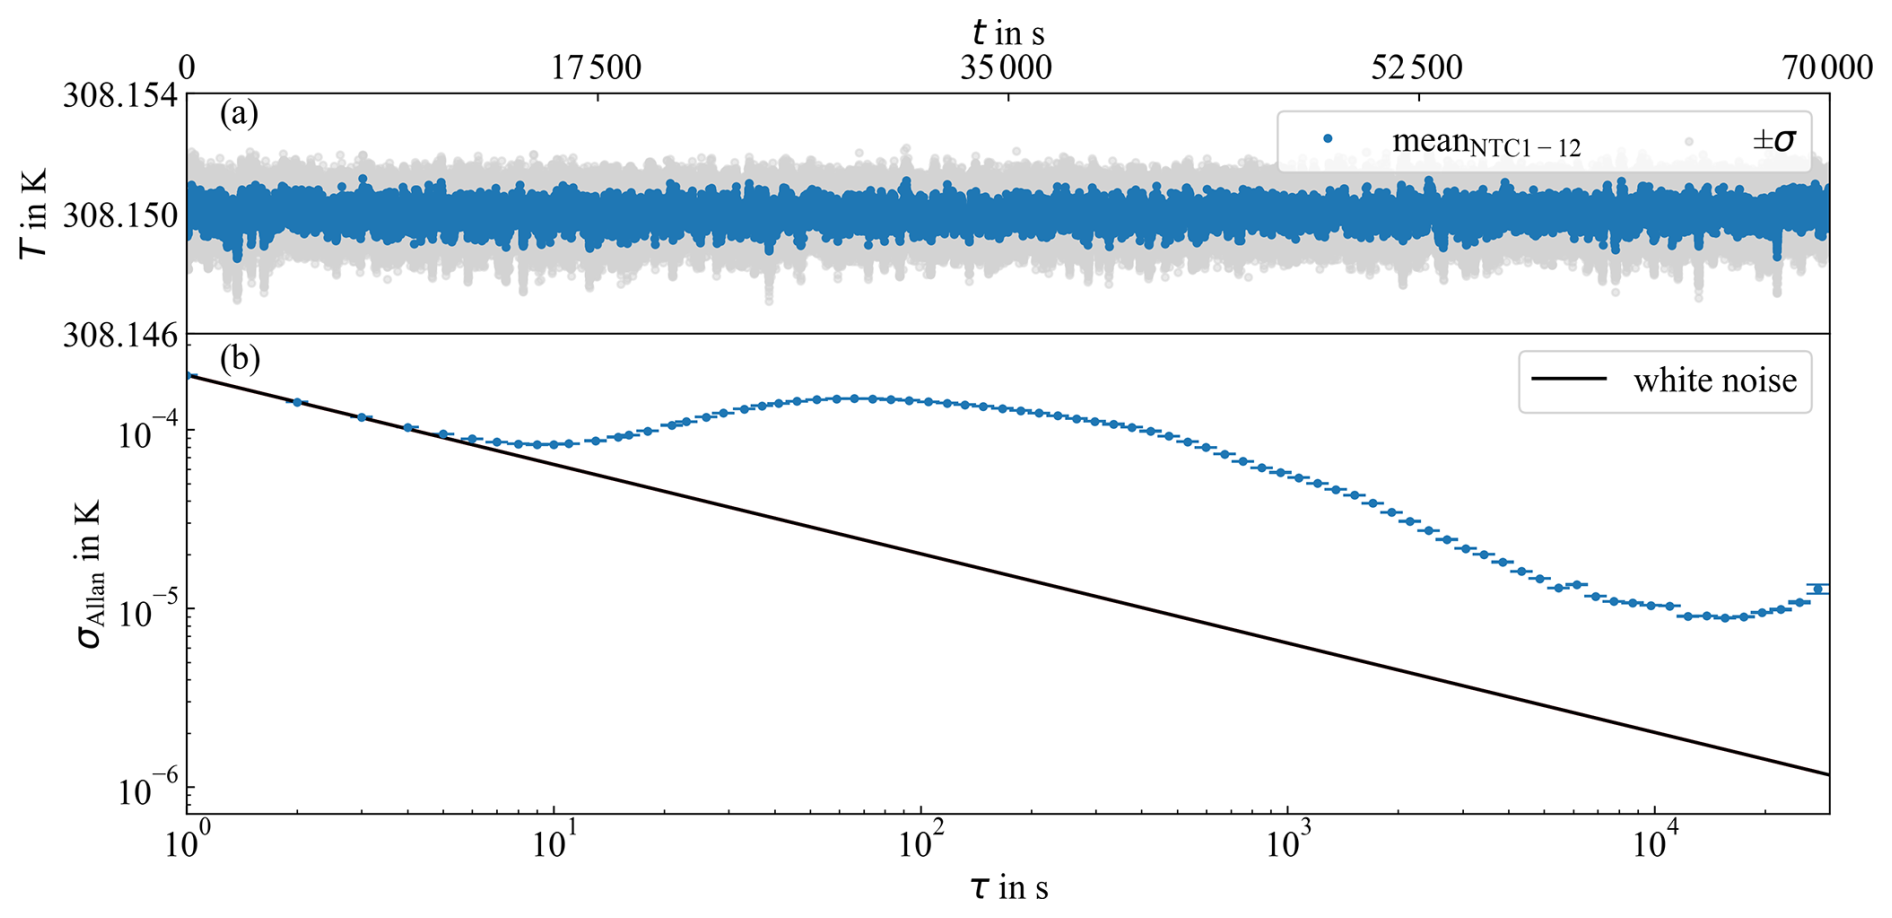
Figure 5Long-term temperature stability at a set point of 308.15 K. (a) Mean of the 12 NTC sensors with ±1σ band over 19 h, showing no detectable drift. (b) Allan deviation indicating white noise behavior at short τ and a long-term floor of about 10−5 K set by slow environmental perturbations.
An over 19 h long-term stability measurement of the actively controlled heater assembly regulated to 308.15 K was carried out and is presented in Fig. 5. Figure 5a shows the mean temperature of all 12 NTC sensors together with the single σ envelope. No systematic drift is observed on the timescale of the measurement and the ensemble remains confined within a ±2 mK band, indicating stable loop performance and uniform thermal distribution across the cell. Figure 5b shows the Allan deviation of the mean temperature (Allan, 1966; Werle et al., 1993). For short averaging times (τ≤10 s), the data follow a dependence, consistent with a white-noise-dominated regime set by sensor and readout noise. At intermediate times (), a shallow peak emerges, indicating that in this band the residual error is dominated by correlated loop-internal effects, such as finite PID gain, quantization in the heater actuation, and partially correlated sensor offsets. For , the Allan deviation decreases again, demonstrating continued temporal averaging after the internal loop correlation time. For the longer averaging times (τ≥104 s), the Allan deviation approaches a floor on the order of 10−5 K, consistent with very low frequency perturbations outside the control bandwidth, such as slow ambient thermal cycles, conductive coupling through the table, or long-term equilibration processes within the assembly. The measurements demonstrate drift-free temperature control for periods of tens of hours, as well as long-term stability on the order of 10−5 K (σ=8.85 µK at τ=15.557 s). The residual limit is not set by the loop itself but rather by slow perturbations outside its bandwidth. The system maintains 10 mK stability over long durations and achieves averaged instability below 10 µK, sufficient for high-precision isotopic-ratio measurements. In combination with a stable gas temperature, measured by the Pt1000 sensors, an isotopic ratio precision of ≤0.1 ‰ is expected. For the spectral analysis, the cell was first flushed with nitrogen (N2) after which compressed air from the building supply line was introduced, which complies with clean room standards and is therefore dried ambient air. The pressure in the cell was stabilized at 40 mbar. A 1000 s measurement of the gas absorption was performed. Figure 6 shows the temperature recorded by the three Pt1000 sensors mounted at different positions in the cell measuring the gas temperature. The traces depict a static offset of around 1 K with respect to the set point of 308.15 K and deviations between the sensor measurements of about ±0.2 K. These differences are consistent with the thermal geometry and gas flow conditions. PT1 is positioned near the gas outlet on the narrow side of the cell, whereas PT2 and PT3 are located on the wider face, close to the gas inlet. Therefore, the observed deviations reflect spatial gradients and flow-dependent heat transport within the gas volume rather than any instability of the controlled Invar body. Due to the temperature distribution within the cell, the temperature is averaged across all three sensors, as presented in Fig. 7. The average temperature data and the corresponding Allan deviation (Fig. 7b) reflect the performance of the heating control loop itself. Therefore, the observed behavior characterizes the control dynamics of the Invar cell rather than local temperature fluctuations in the gas phase.
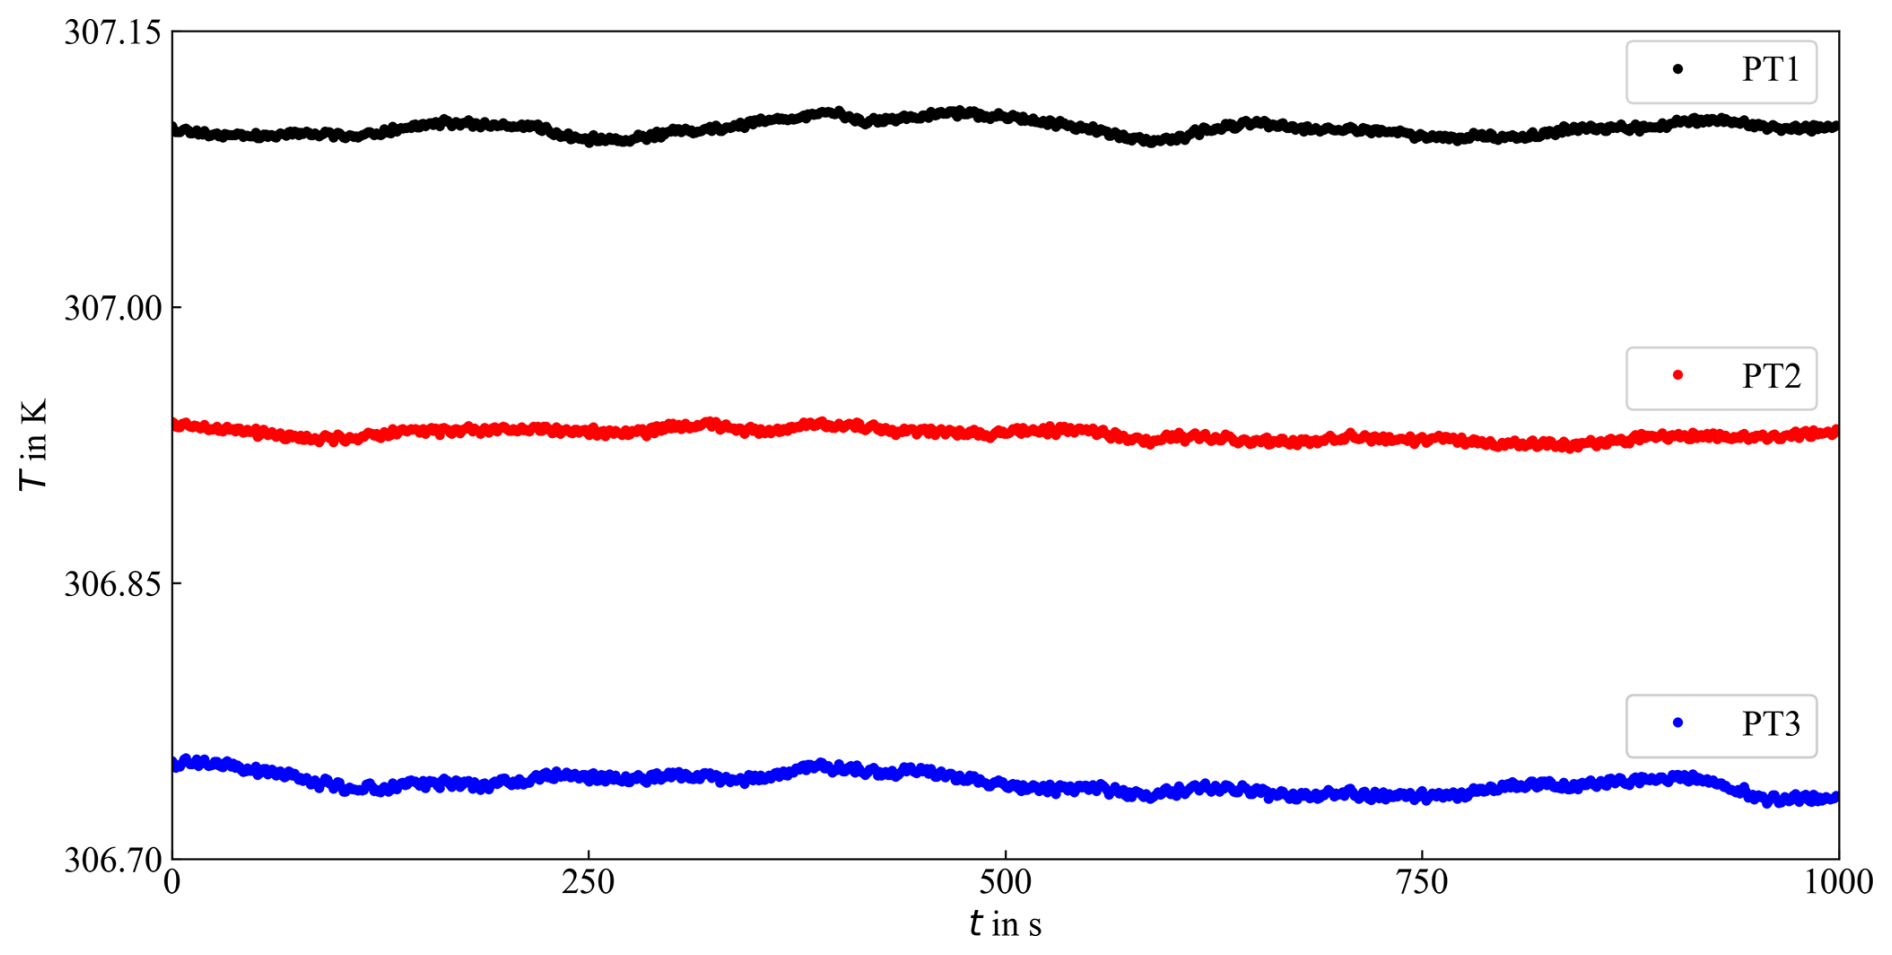
Figure 6Temperature measurement data from the three Pt1000 sensors over a period of 1000 s. The sensors are integrated into the respective ends of the cell and measure the gas temperature. There is a deviation of approximately 1 K from the set point of 308.15 K and a deviation of ±0.2 K between the sensors.
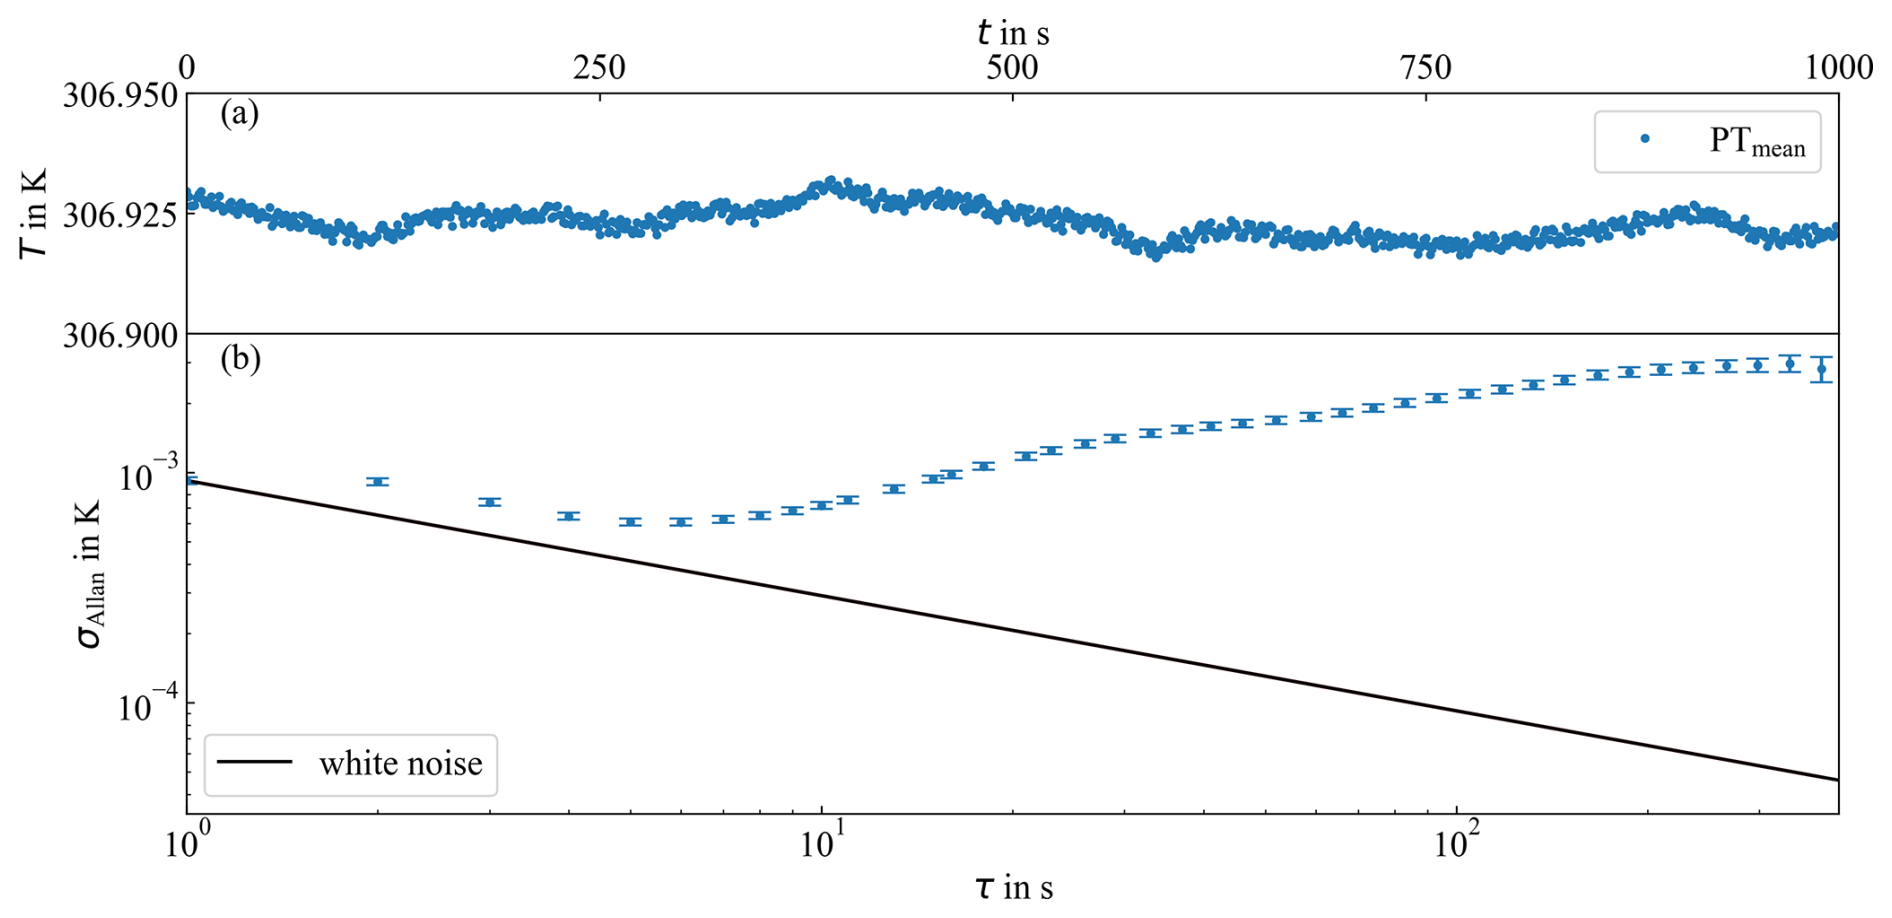
Figure 7Average over the three Pt1000 sensors over a period of 1000 s. (a) Mean Pt1000 temperature showing a static offset and spatial gradient caused by geometry and gas flow but no temporal drift on this timescale. Panel (b) refers to a decreasing Allan deviation at short τ and low-frequency environmental contributions at long τ.
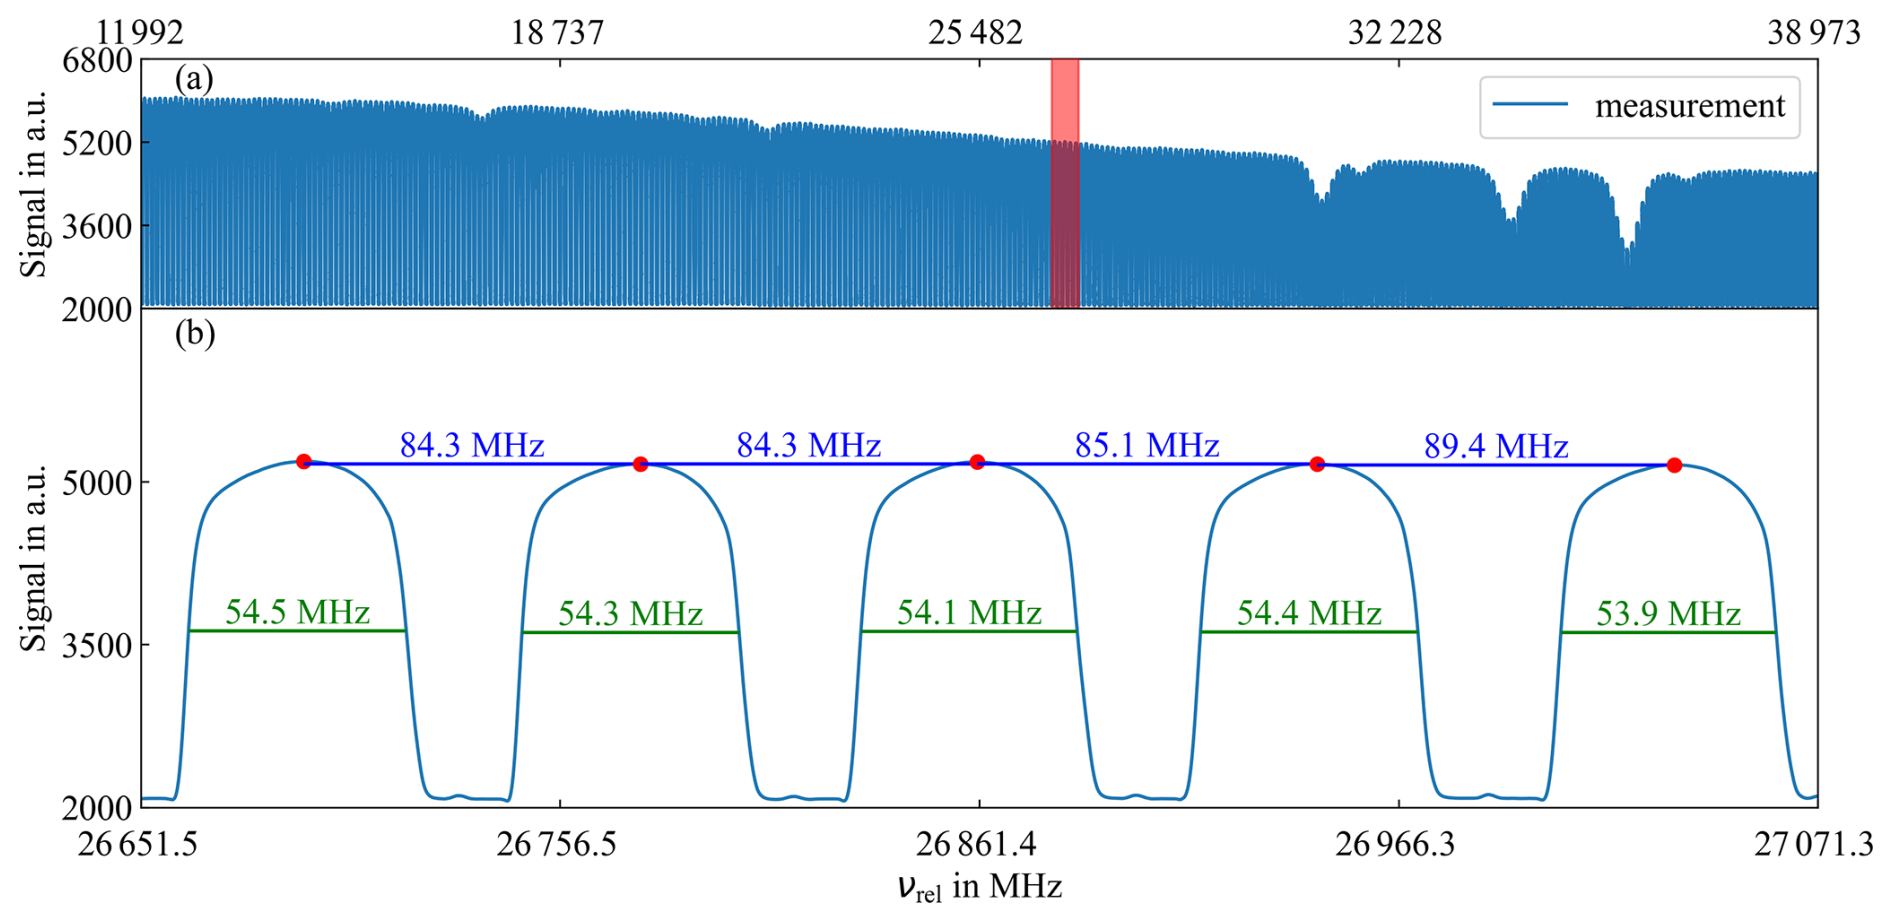
Figure 8Measurement of the cavity transmission signal. (a) The entire spectrum including the absorption lines of the isotopologues 12CH4 and 13CH4 as well as the H2O lines, reproducing the simulation in the line selection. (b) Enlarged area marked in red. The modes of the cavity transmission, their symmetry, and representations of the FWHM and the FSR of five modes can be seen.
The data of the mean value show that the closed-loop control system maintains a stable operating point with no measurable drift. Therefore, the residual fluctuations in the mean and the Allan deviation are not due to instability in the thermal regulation but originate from external disturbances outside the control bandwidth (e.g., slow ambient coupling, gas flow-induced gradients, and conductive exchange through the mounting on the table). Based on the Allan deviation and the optimum integration time of about τ=6 s with a deviation of σ=600 µK, the transmission spectrum of the cavity was accordingly averaged and is shown in Fig. 8. Figure 8a shows the measured transmission signal, which reproduces the simulated absorption structure obtained in the line selection. For mode-resolved analysis, the red-marked region is enlarged in the lower panel. The expected symmetry of the cavity modes is clearly visible, achieved by active locking via the algorithm running on the FPGA. The relative x axis was calibrated against the FSR of the Ge-etalon in order to extract the FSR and the full width at half maximum (FWHM) of the individual modes. Mode-by-mode evaluation yields averages over 344 modes of and , which are in good agreement with the theoretical FSR of 83.1 MHz. The measurement uncertainties can be attributed to the lock-in control, in which slight deviations result in a shift in the maxima and a narrowing of the mode, leading to inaccuracies in the detection of the points for determining the FWHM and FSR by the algorithm. However, the relevant CH4 absorption lines exhibit a typical FWHM of approximately 358 MHz, resulting in about four sampling points per absorption FWHM for the measured FSR of 84 MHz. This fulfills the Nyquist sampling condition and permits robust model-based fitting using a Voigt profile with spectroscopic parameters from the HITRAN database, which is presented in Fig. 9 (Nyquist, 1928; Shannon, 1949). A noise-equivalent absorbance of was obtained from the N2 reference measurement for an integration time of τ=6 s and ramp frequency of framp=1 Hz. The noise-equivalent absorbance was determined from the nitrogen reference measurement by converting the baseline-corrected transmission signal peaks of individual cavity modes to absorbance using and calculating the standard deviation (1σ). Given the expected effective absorption path length of 22.53 km, the corresponding equivalent noise absorption coefficient is . However, the measured noise level is dominated by mode-dependent residual structures attributed to etalon interference across the cavity modes. The single-shot NEA values of the individual ramps range between and . Compared to the single-shot NEA of reported by Lechevallier et al. (2019), the present single-shot NEA is about 1 order of magnitude higher, indicating that the sensitivity is currently limited by residual structures rather than by fundamental noise sources and thus leaves room for further optimization. The corresponding 3σ detection limits (LOD) for the isotopologues were derived from NEα using HITRAN-based Voigt simulations at the measurement conditions, yielding 0.19 ppm for 12CH4 and 3.3 ppb for 13CH4. Both detection limits lie about 1 order of magnitude below the atmospheric background mole fractions of 1.9 ppm for 12CH4 and 21 ppb for 13CH4, corresponding to factors of 10 and 6.4 above the respective LOD. This margin provides a sufficient signal-to-noise ratio for the simultaneous detection of both isotopologues at ambient concentrations and thus enables the determination of the δ13C signature targeted in this work. Figure 9 shows the cavity transmission together with a fit based on a Voigt profile physical model applied to the cavity transmission mode peaks, including spectroscopic parameters from the HITRAN database.
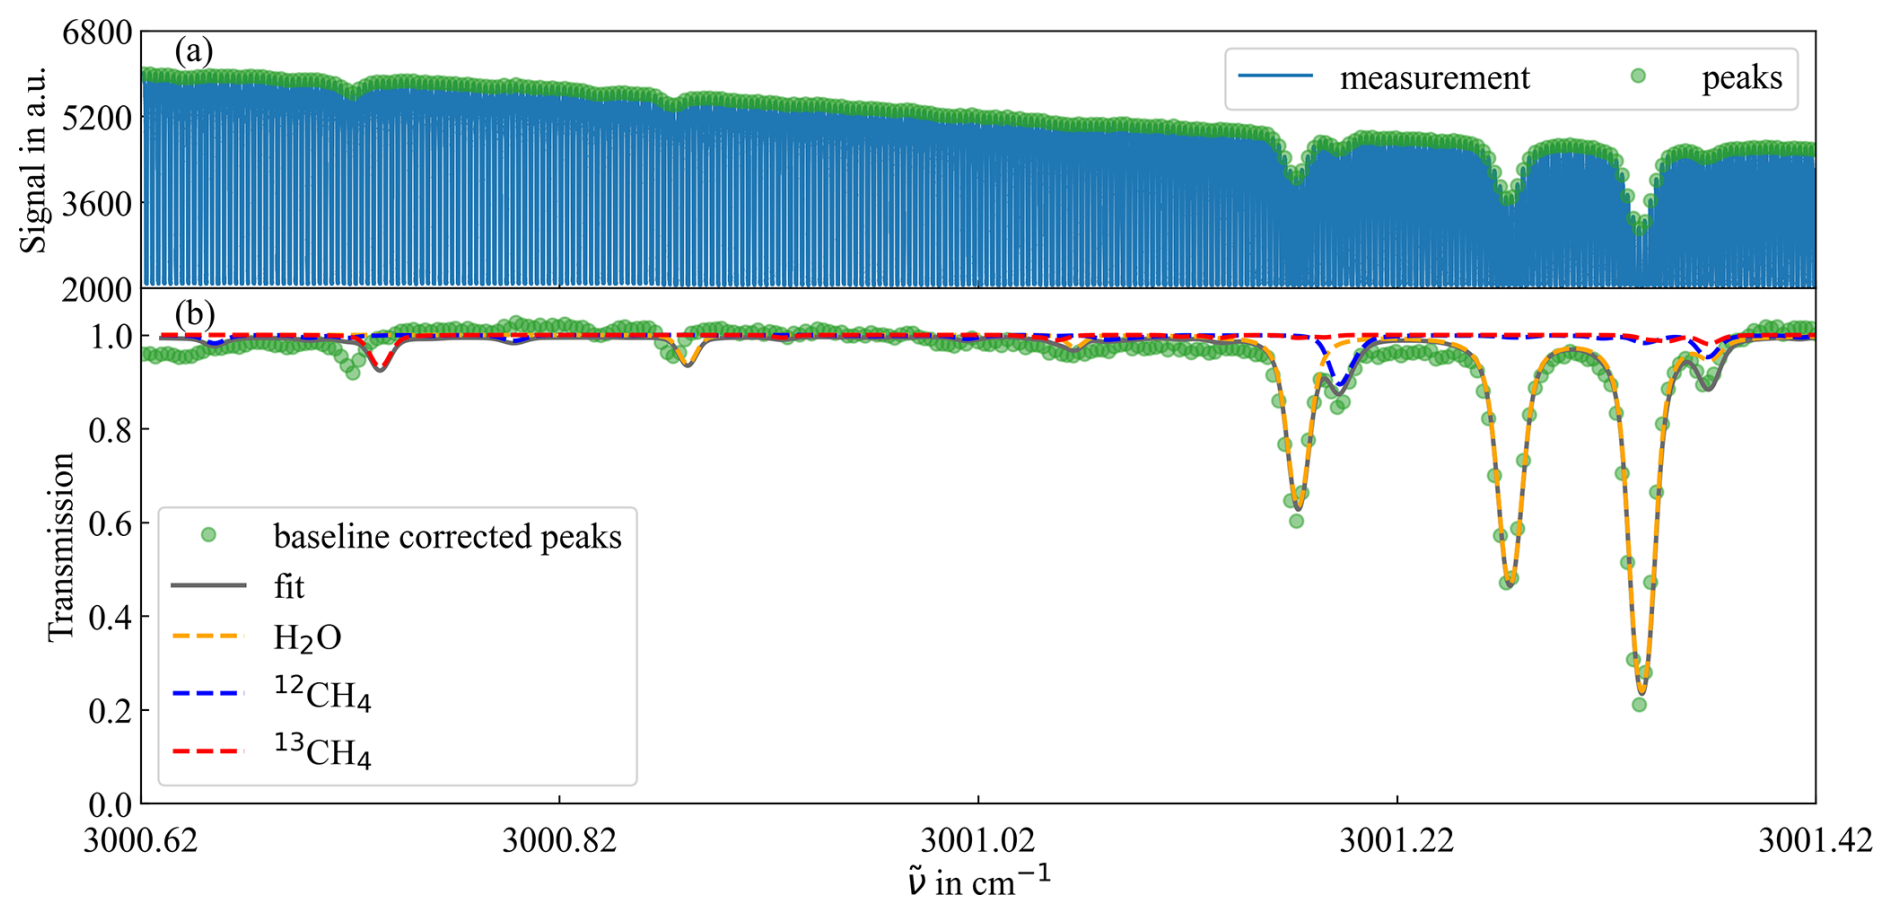
Figure 9Measured cavity transmission spectrum (a) and baseline-corrected transmission (b) and the corresponding fit. H2O absorption with a fitted concentration of 8132 ppm influences the spectrum and overlaps the 12CH4 feature, resulting in an fitted total CH4 concentration of just 1.365 ppm, leading to a relative error of ≈28 % from the expected value of 1.9 ppm. Residual misalignment of the low-wavenumber region is consistent with imperfect wavenumber calibration.
The cavity transmission signal shown in Fig. 9a corresponds to the raw output of the photodetector recorded by the digitizer. Consequently, a constant offset of the detector signal of approximately 2000 a.u. is visible, which originates from the photodetector preamplifier and is present even in the absence of an optical signal. This electronic offset shifts the baseline to a non-zero value but is explicitly accounted for and corrected within the fitting procedure. The measured mean temperature and pressure during the acquisition were and , respectively.
Although the gas cell was connected to the laboratory dry-air line, the retrieved spectrum indicates a fitted H2O concentration of approximately 8132 ppm. This residual water vapor is attributed not to the gas sources themselves but most likely can be traced back to humidity present in the in-house gas distribution system or to moisture ingress through gas lines and fittings, which could not be fully excluded under the experimental conditions. The strong H2O absorption features dominate the investigated spectral region, distort the baseline, and partially overlap the 12CH4 absorption line. As a result, the global fit across the full spectral range underestimates the methane concentration, yielding a value of 1.365 ppm compared to the expected ambient concentration of approximately 1.9 ppm. This corresponds to a relative deviation of about 28 % and arises from spectral interference and baseline distortion caused by water vapor. This directly affects isotopic analysis, as it becomes difficult to determine the isotopologues' concentrations and thus the isotopic ratio from the line profiles when water covers the spectrum. Once the dominant isotopologue is suppressed and the baseline is modulated by H2O, the isotopic ratio becomes systematically biased and cannot be reliably interpreted. In addition, the visible mismatch on the low-wavenumber side of the spectrum is consistent with remaining limitations in the wavenumber calibration, which further constrain the accuracy of the global fit. The effective absorption path length was included as a free parameter in the global fitting procedure and was determined from the optimized fit parameters to be 22.535 km. Given additional loss mechanisms such as residual misalignment, non-ideal mirror reflectivity, and intracavity absorption, this value is expected to represent an upper estimate, and a reduced effective path length is anticipated under more realistic conditions. A more detailed experimental validation of the effective absorption path length is therefore deferred to future work. To further investigate the origin of the methane concentration deviation, a refined fitting approach was applied to a reduced spectral interval between 3001.10 and 3001.25 cm−1, which contains the 12CH4 absorption line and is not affected by the low-wavenumber calibration mismatch. In this restricted window the baseline distortion is reduced while only 12CH4 and H2O are included in the fit model. The result of this targeted fit is shown in Fig. 10. The retrieved methane concentration is 1.87 ppm, while the fitted H2O concentration is 10 933 ppm. The effective absorption path length was included as a free parameter in the fitting procedure and was determined to be 12.6 km, which is considered more realistic under the present experimental conditions. With this refined analysis, the relative deviation of the methane concentration is reduced to approximately 1.6 %. The residuals of the refined fit shown in Fig. 10b exhibit no pronounced systematic structures and fluctuate symmetrically around zero. This behavior represents a clear improvement compared to the global fit across the full spectral range and confirms that the dominant source of error in the initial analysis originates from water-induced spectral overlap and baseline distortion rather than from deficiencies in the line-shape model or the cavity transmission data.
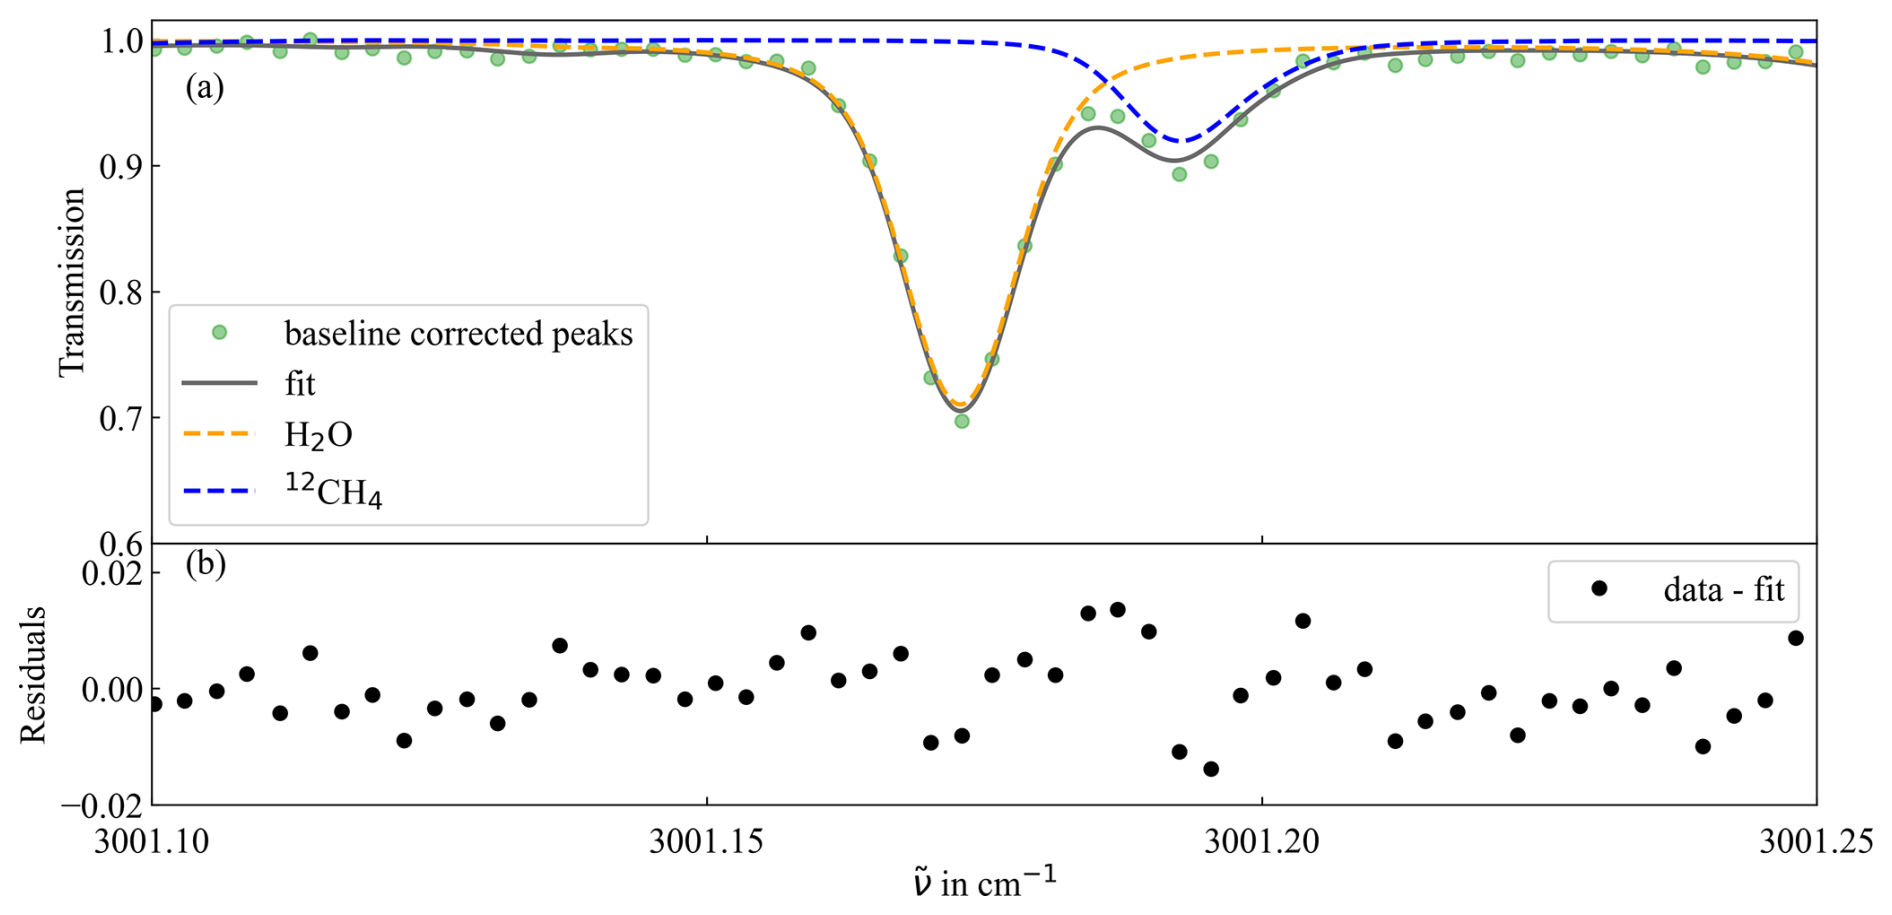
Figure 10Fit of the cavity transmission in a reduced spectral interval between 3001.10 and 3001.25 cm−1, focused on the 12CH4 absorption line. (a) Baseline-corrected transmission mode peaks together with a Voigt-profile-based fit. The individual contributions of 12CH4 (dashed blue line) and H2O (dashed orange line) are shown separately. By restricting the fit window to this interval, spectral regions affected by strong baseline distortion and wavenumber calibration mismatch are excluded. (b) Residuals (data minus fit) of the refined fit, demonstrating a substantial reduction in systematic structures compared to the global fit and indicating that the remaining deviations are dominated by statistical noise. The refined analysis yields a methane concentration of 1.87 ppm and an effective absorption path length of 12.6 km.
The improved residual structure supports the robustness of the refined fitting approach and confirms a methane concentration of 1.87 ppm in agreement with the expected ambient value. These results demonstrate that, once spectral interference is sufficiently mitigated, the OF-CEAS system is capable of quantitatively accurate methane retrieval.
In conclusion, the present data demonstrate that residual H2O interference, rather than the cavity design or the OF-CEAS detection principle itself, currently limits spectroscopic accuracy. The observed baseline distortions and partial spectral overlap induced by water vapor directly affect quantitative methane retrieval and prevent an unbiased determination of isotopic ratios under the present experimental conditions. The present measurements should therefore be regarded as a proof-of-principle demonstration of the spectroscopic performance of the OF-CEAS system, rather than providing fully quantitative isotopic results. Achieving quantitative accuracy and reliable isotopic ratio determination will require further optimization of the experimental conditions. In particular, improved gas handling with verified leak-tight operation and active gas drying is essential to suppress H2O-induced spectral overlap. In addition, calibration measurements using certified methane gas mixtures and the experimental determination of the effective absorption path length are necessary to fully characterize the system performance and are explicitly planned for future work. Once these measures are implemented under fully optimized gas handling conditions, the system is expected to permit accurate and reproducible methane concentration measurements and unbiased isotopic ratio analysis in this spectral window.
In this work, we present the design, implementation, and characterization of an OF-CEAS system for isotopic analysis of CH4 in the MIR ν3 band around 3000 cm−1, where the 12CH4 Q(18) and 13CH4 Q(12) transitions can be probed within a single laser scan. The high-finesse V-shaped cavity (theoretical effective path length of 22.53 km, FSR=83.1 MHz) is integrated into an Invar cell with a measured leak rate of and is actively temperature-stabilized at 308.15 K via 12 PID-controlled heating boards. The thermal architecture meets the precision targets imposed by stable isotopic ratio analysis. Allan deviation analysis yields a long-term cell-temperature stability of σ=8.85 µK at and a gas temperature stability, measured by embedded Pt1000 sensors, of σ=600 µK at τ=6 s. Both values lie well below the 6.8 mK gas temperature budget required for an isotopic ratio uncertainty of ≤0.1 ‰ derived from the ground state energy difference in the selected lines, confirming that thermal noise does not limit isotopic precision in this configuration.
Active FPGA-based phase locking yields cavity transmission spectra with the symmetric mode structure expected from successful optical feedback. Mode-by-mode evaluation over 344 modes gives and , in good agreement with the theoretical FSR of 83.1 MHz, and provides approximately four sampling points per absorption FWHM, satisfying the Nyquist condition for Voigt profile retrieval. From the N2 reference measurement, a noise-equivalent absorbance of at τ=6 s is obtained, corresponding to a noise-equivalent absorption coefficient of at the theoretical effective path length. The corresponding 3σ detection limits of 0.19 ppm for 12CH4 and 3.3 ppb for 13CH4 lie about 1 order of magnitude below the atmospheric background mole fractions of 1.9 ppm and 21 ppb, demonstrating that the system is in principle sensitive enough to detect ambient methane and to access the stable isotopic ratio δ13C.
Cross-sensitivity to water vapor was identified as the dominant systematic effect under the present gas conditions. Despite operation on the laboratory dry-air line, the retrieved spectrum contains a residual H2O content of approximately 8132 ppm, which influences the spectral baseline and partially overlaps the 12CH4 feature. A global fit across the full investigated range therefore systematically underestimates the methane concentration at 1.365 ppm against an expected ambient value of 1.9 ppm, corresponding to a relative deviation of about 28 %, and precludes an unbiased determination of the isotopic ratio. A refined fit restricted to a narrower window centered on the 12CH4 line, with only 12CH4 and H2O included in the model, recovers a methane concentration of 1.87 ppm, a residual deviation of approximately 1.6 % and residuals that fluctuate symmetrically around zero without a pronounced systematic structure. This localizes the limitation to the gas state during the measurement rather than to the optical design, cavity performance, or detection chain of the OF-CEAS system and shows that, once the H2O overlap is excluded from the analysis, the instrument delivers quantitatively accurate methane concentrations.
Future work will accordingly focus on the gas-handling chain, in particular verified leak-tight operation and active drying, to suppress water-induced cross-sensitivity at the source rather than only in post-processing. Calibration measurements with certified methane gas mixtures and an experimental determination of the effective absorption path length are planned to complete the quantitative characterization of the spectrometer. In the longer term, the integration of the optical bench, the gas handling, and the control electronics into a transportable enclosure is envisioned, motivated by the in situ application targets that originally distinguish optical absorption methods from IRMS-based laboratory analysis. Combined with the demonstrated thermal stability, spectral fidelity, and calibration chain, these steps are expected to enable unbiased ratio determination at the targeted ≤0.1 ‰ precision in this spectral window.
The underlying software code is not publicly available and can be requested from the authors if required.
The underlying measurement data are not publicly available and can be requested from the authors if required.
CD designed and built the spectrometer, carried out the experiments, performed the data visualization, and wrote the original manuscript. The experiments were planned by CD, PN, JG, and LN. CW designed the temperature control electronics. KS and JW supervised the work. The text was revised by all contributing authors and all authors approved of the final article.
The contact author has declared that none of the authors has any competing interests.
Publisher's note: Copernicus Publications remains neutral with regard to jurisdictional claims made in the text, published maps, institutional affiliations, or any other geographical representation in this paper. The authors bear the ultimate responsibility for providing appropriate place names. Views expressed in the text are those of the authors and do not necessarily reflect the views of the publisher.
The authors thank Ulrich Ulmer for the design of the Invar cell and Nicolas Brugger for his support.
This work was supported by the Georg H. Endress Stiftung, whose financial contribution is gratefully acknowledged.
This open-access publication was funded by the University of Freiburg.
This paper was edited by Michael Kraft and reviewed by three anonymous referees.
Allan, D. W.: Statistics of atomic frequency standards, Proc. IEEE, 54, 221–230, https://doi.org/10.1109/PROC.1966.4634, 1966.
Amotchkina, T., Trubetskov, M., Hahner, D., and Pervak, V.: Characterization of e-beam evaporated Ge, YbF3, ZnS, and LaF3 thin films for laser-oriented coatings, Appl. Optics, 59, A40–A47, https://doi.org/10.1364/AO.59.000A40, 2020.
Baer, D. S., Paul, J. B., Gupta, M., and O'Keefe, A.: Sensitive absorption measurements in the near-infrared region using off-axis integrated-cavity-output spectroscopy, Appl. Phys. B, 75, 261–265, https://doi.org/10.1007/s00340-002-0971-z, 2002.
Bergamaschi, P., Schupp, M., and Harris, G. W.: High-precision direct measurements of (13)CH(4)(12)CH(4) and (12)CH(3)D(12)CH(4) ratios in atmospheric methane sources by means of a long-path tunable diode laser absorption spectrometer, Appl. Optics, 33, 7704–7716, https://doi.org/10.1364/AO.33.007704, 1994.
Bergin, A. G. V., Hancock, G., Ritchie, G. A. D., and Weidmann, D.: Linear cavity optical-feedback cavity-enhanced absorption spectroscopy with a quantum cascade laser, Opt. Lett., 38, 2475–2477, https://doi.org/10.1364/OL.38.002475, 2013.
Brand, W. A.: High Precision Isotope Ratio Monitoring Techniques in Mass Spectrometry, J. Mass Spectrom., 31, 225–235, https://doi.org/10.1002/(SICI)1096-9888(199603)31:3<225::AID-JMS319>3.0.CO;2-L, 1996.
Crosson, E. R.: A cavity ring-down analyzer for measuring atmospheric levels of methane, carbon dioxide, and water vapor, Appl. Phys. B, 92, 403–408, https://doi.org/10.1007/s00340-008-3135-y, 2008.
Dahnke, H., Kleine, D., Urban, W., Hering, P., and Mürtz, M.: Isotopic ratio measurement of methane in ambient air using mid-infrared cavity leak-out spectroscopy, Appl. Phys. B, 72, 121–125, https://doi.org/10.1007/s003400000509, 2001.
Dunn, P. J. H., Malinovsky, D., Ogrinc, N., Potočnik, D., Flierl, L., Rienitz, O., Paul, D., and Meijer, H. A. J.: Re-determination of R(13C/12C) for Vienna Peedee belemnite (VPDB), Rapid Commun. Mass Sp., 38, e9773, https://doi.org/10.1002/rcm.9773, 2024.
Gordon, I. E., Rothman, L. S., Hargreaves, R. J., Hashemi, R., Karlovets, E. V., Skinner, F. M., Conway, E. K., Hill, C., Kochanov, R. V., Tan, Y., Wcisło, P., Finenko, A. A., Nelson, K., Bernath, P. F., Birk, M., Boudon, V., Campargue, A., Chance, K. V., Coustenis, A., Drouin, B. J., Flaud, J.-M., Gamache, R. R., Hodges, J. T., Jacquemart, D., Mlawer, E. J., Nikitin, A. V., Perevalov, V. I., Rotger, M., Tennyson, J., Toon, G. C., Tran, H., Tyuterev, V. G., Adkins, E. M., Baker, A., Barbe, A., Canè, E., Császár, A. G., Dudaryonok, A., Egorov, O., Fleisher, A. J., Fleurbaey, H., Foltynowicz, A., Furtenbacher, T., Harrison, J. J., Hartmann, J.-M., Horneman, V.-M., Huang, X., Karman, T., Karns, J., Kassi, S., Kleiner, I., Kofman, V., Kwabia–Tchana, F., Lavrentieva, N. N., Lee, T. J., Long, D. A., Lukashevskaya, A. A., Lyulin, O. M., Makhnev, V., Matt, W., Massie, S. T., Melosso, M., Mikhailenko, S. N., Mondelain, D., Müller, H., Naumenko, O. V., Perrin, A., Polyansky, O. L., Raddaoui, E., Raston, P. L., Reed, Z. D., Rey, M., Richard, C., Tóbiás, R., Sadiek, I., Schwenke, D. W., Starikova, E., Sung, K., Tamassia, F., Tashkun, S. A., Vander Auwera, J., Vasilenko, I. A., Vigasin, A. A., Villanueva, G. L., Vispoel, B., Wagner, G., Yachmenev, A., and Yurchenko, S. N.: The HITRAN2020 molecular spectroscopic database, J. Quant. Spectrosc. Ra., 277, 107949, https://doi.org/10.1016/j.jqsrt.2021.107949, 2022.
Habig, J. C., Nadolny, J., Meinen, J., Saathoff, H., and Leisner, T.: Optical feedback cavity enhanced absorption spectroscopy: effective adjustment of the feedback-phase, Appl. Phys. B, 106, 491–499, https://doi.org/10.1007/s00340-011-4804-9, 2012.
Helmig, D., Rossabi, S., Hueber, J., Tans, P., Montzka, S. A., Masarie, K., Thoning, K., Plass-Duelmer, C., Claude, A., Carpenter, L. J., Lewis, A. C., Punjabi, S., Reimann, S., Vollmer, M. K., Steinbrecher, R., Hannigan, J. W., Emmons, L. K., Mahieu, E., Franco, B., Smale, D., and Pozzer, A.: Reversal of global atmospheric ethane and propane trends largely due to US oil and natural gas production, Nat. Geosci., 9, 490–495, https://doi.org/10.1038/ngeo2721, 2016.
Kerstel, E., Iannone, R. Q., Chenevier, M., Kassi, S., Jost, H.-J., and Romanini, D.: A water isotope (2H, 17O, and 18O) spectrometer based on optical feedback cavity-enhanced absorption for in situ airborne applications, Appl. Phys. B, 85, 397–406, https://doi.org/10.1007/s00340-006-2356-1, 2006.
Kogelnik, H. and Li, T.: Laser beams and resonators, Appl. Optics, 5, 1550–1567, https://doi.org/10.1364/AO.5.001550, 1966.
Lechevallier, L., Grilli, R., Kerstel, E., Romanini, D., and Chappellaz, J.: Simultaneous detection of C2H6, CH4, and δ13C−CH4 using optical feedback cavity-enhanced absorption spectroscopy in the mid-infrared region: towards application for dissolved gas measurements, Atmos. Meas. Tech., 12, 3101–3109, https://doi.org/10.5194/amt-12-3101-2019, 2019.
Long, D. A., Okumura, M., Miller, C. E., and Hodges, J. T.: Frequency-stabilized cavity ring-down spectroscopy measurements of carbon dioxide isotopic ratios, Appl. Phys. B, 105, 471–477, https://doi.org/10.1007/s00340-011-4518-z, 2011.
Manfred, K. M., Ciaffoni, L., and Ritchie, G. A. D.: Optical-feedback cavity-enhanced absorption spectroscopy in a linear cavity: model and experiments, Appl. Phys. B, 120, 329–339, https://doi.org/10.1007/s00340-015-6140-y, 2015.
Masson-Delmotte, V. P., Zhai, A., Pirani, S. L., Connors, C., Péan, S., Berger, N., Caud, Y., Chen, L., Goldfarb, M. I., Gomis, M., Huang, K., Leitzell, E., and Lonnoy, J.: IPCC, 2021: Climate Change 2021: The Physical Science Basis, Contribution of Working Group I to the Sixth Assessment Report of the Intergovernmental Panel on Climate Change, Cambridge University Press, https://doi.org/10.1017/9781009157896, 2023.
McManus, J. B., Kebabian, P. L., and Zahniser, M. S.: Astigmatic mirror multipass absorption cells for long-path-length spectroscopy, Appl. Optics, 34, 3336–3348, https://doi.org/10.1364/AO.34.003336, 1995.
McManus, J. B.: Application of quantum cascade lasers to high-precision atmospheric trace gas measurements, Opt. Eng., 49, 111124, https://doi.org/10.1117/1.3498782, 2010.
Morville, J., Kassi, S., Chenevier, M., and Romanini, D.: Fast, low-noise, mode-by-mode, cavity-enhanced absorption spectroscopy by diode-laser self-locking, Appl. Phys. B, 80, 1027–1038, https://doi.org/10.1007/s00340-005-1828-z, 2005.
Morville, J., Romanini, D., Chenevier, M., and Kachanov, A.: Effects of laser phase noise on the injection of a high-finesse cavity, Appl. Optics, 41, 6980–6990, https://doi.org/10.1364/AO.41.006980, 2002.
Myhre, G. D., Shindell, F.-M., Bréon, W., Collins, J., Fuglestvedt, J., Huang, D., Koch, J.-F., Lamarque, D., Lee, B., Mendoza, T., Nakajima, A., Robock, G., Stephens, T., Takemura, T. and Zhang, H.: An thropogenic and Natural Radiative Forcing, in: Climate Change 2013: The Physical Science Basis, Contribution of Working Group I to the Fifth Assessment Report of the Intergovernmental Panel on Climate Change, edited by: Stocker, T. F., Qin, D., Plattner, G.-K., Tignor, M., Allen, S. K., Boschung, J., Nauels, A., Xia, Y., Bex, V., and Midgley, P. M., Cambridge University Press, 659–740, https://doi.org/10.1017/CBO9781107415324.018, 2014.
Nyquist, H.: Certain Topics in Telegraph Transmission Theory, Trans. Am. Inst. Electr. Eng., 47, 617–644, https://doi.org/10.1109/T-AIEE.1928.5055024, 1928.
Ohshima, S. and Schnatz, H.: Optimization of injection current and feedback phase of an optically self-locked laser diode, J. Appl. Phys., 71, 3114–3117, https://doi.org/10.1063/1.351006, 1992.
O'Keefe, A.: Integrated cavity output analysis of ultra-weak absorption, Chem. Phys. Lett., 293, 331–336, https://doi.org/10.1016/S0009-2614(98)00785-4, 1998.
Patimisco, P., Scamarcio, G., Tittel, F. K., and Spagnolo, V.: Quartz-enhanced photoacoustic spectroscopy: a review, Sensors (Basel, Switzerland), 14, 6165–6206, https://doi.org/10.3390/s140406165, 2014.
Quay, P., Stutsman, J., Wilbur, D., Snover, A., Dlugokencky, E., and Brown, T.: The isotopic composition of atmospheric methane, Global Biogeochem. Cy., 13, 445–461, https://doi.org/10.1029/1998GB900006, 1999.
Schaefer, H., Mikaloff Fletcher, S. E., Veidt, C., Lassey, K. R., Brailsford, G. W., Bromley, T. M., Dlugokencky, E. J., Michel, S. E., Miller, J. B., Levin, I., Lowe, D. C., Martin, R. J., Vaughn, B. H., and White, J. W. C.: A 21st-century shift from fossil-fuel to biogenic methane emissions indicated by 13CH4, Science (New York, NY), 352, 80–84, https://doi.org/10.1126/science.aad2705, 2016.
Shannon, C. E.: Communication in the Presence of Noise, P. IRE, 37, 10–21, https://doi.org/10.1109/JRPROC.1949.232969, 1949.
Tuzson, B., Mohn, J., Zeeman, M. J., Werner, R. A., Eugster, W., Zahniser, M. S., Nelson, D. D., McManus, J. B., and Emmenegger, L.: High precision and continuous field measurements of δ13C and δ18O in carbon dioxide with a cryogen-free QCLAS, Appl. Phys. B, 92, https://doi.org/10.1007/s00340-008-3085-4, 2008.
Werle, P., Mcke, R., and Slemr, F.: The limits of signal averaging in atmospheric trace-gas monitoring by tunable diode-laser absorption spectroscopy (TDLAS), Appl. Phys. B, 57, 131–139, https://doi.org/10.1007/BF00425997, 1993.
Werle, P.: A review of recent advances in semiconductor laser based gas monitors, Spectrochim. Acta A, 54, 197–236, https://doi.org/10.1016/S1386-1425(97)00227-8, 1998.
Zellweger, C., Emmenegger, L., Firdaus, M., Hatakka, J., Heimann, M., Kozlova, E., Spain, T. G., Steinbacher, M., van der Schoot, M. V., and Buchmann, B.: Assessment of recent advances in measurement techniques for atmospheric carbon dioxide and methane observations, Atmos. Meas. Tech., 9, 4737–4757, https://doi.org/10.5194/amt-9-4737-2016, 2016.