
the Creative Commons Attribution 4.0 License.
the Creative Commons Attribution 4.0 License.
 | 19 Nov 2026
Toward in situ PEM fuel cell diagnostics: humidity-sensitive optical fibers for integration into additively manufactured bipolar plates

Gerald Auböck
Cem Odaci
Ivan Shishkin
Alexander Bergmann
Christof Sommitsch
Andreas Klug
Proton exchange membrane (PEM) fuel cells (FCs) are important technologies for sustainable energy systems that are already established in commercial applications. However, limited diagnostic access to local operating conditions constrains their broader deployment and long-term reliability. This study presents the fabrication and proof-of-concept validation of relative-humidity-sensitive optical fiber sensors intended for future integration into additively manufactured PEM fuel cell bipolar plates. The sensing principle is based on humidity- and droplet-induced perturbations of optical transmission in the modified fiber region. Tapered fibers and D-shaped femtosecond-laser-cut fibers were fabricated from standard single-mode fiber and characterized under droplet exposure and in a climate chamber between 20 % and 80 % relative humidity (rH). Over the common range from 20 % to 80 % rH, TF1-10 exhibited an approximately 14 % signal decrease, compared with approximately 9 % for LF-CC. However, tapered fibers showed limited mechanical robustness during the investigated handling and integration procedures and, for ultrashort geometries, high insertion losses. Laser-cut fibers provided a higher detected signal level than the ultrashort tapered fiber and improved handling, particularly when combined with silica-capillary packaging. An additively manufactured smart bipolar plate and a compatible capillary-based integration concept were developed. However, full in-cell validation, long-term drift characterization, cyclic repeatability testing, and traceable calibration remain subjects for future work. Within these limitations, the results establish the feasibility of the sensor and integration concepts, and identify laser-cut fibers as a promising compromise between sensitivity, optical throughput, practical handling, and prospective integration capability.
- Article
(8257 KB) - Full-text XML
- BibTeX
- EndNote


Fuel cells (FCs) are a core technology for green hydrogen conversion in future mobility solutions and sustainable energy systems. Among the different types, proton exchange membrane (PEM) fuel cells have garnered particular attention due to their high efficiency, low operating temperature, and suitability for integration in both the electromobility and stationary power sectors. A PEM FC unit typically consists of several components, including the membrane electrode assembly (MEA), gas diffusion layers, and bipolar plates (BPs). The bipolar plate plays a crucial role in ensuring uniform gas distribution, current collection, and thermal and water management across the cell's active area. Its geometry, material properties, and surface structure critically influence internal cell conditions such as relative humidity (rH) and temperature near the membrane, which strongly affect durability and performance (Qasem, 2024; Mo et al., 2023).
However, under operating conditions, local inhomogeneities such as uneven humidification, H2 starvation, and flooding can occur within the flow field. These local events can cause degradation hotspots and irreversible voltage losses, significantly shortening the cell's lifetime (Liu et al., 2023; Barbir, 2012). Therefore, in situ monitoring and detection of such variations are essential to better understand real conditions in the FC and degradation mechanisms, to optimize control strategies, and to improve predictive modeling for FC reliability and lifetime (Wang et al., 2021; Kang et al., 2024).
Advanced sensing and simulation tools have already demonstrated potential for monitoring local current-density distribution in PEM fuel cells. In particular, segmented cell approaches enable spatially resolved measurements of current density, and in some cases, temperature, providing valuable insight into performance inhomogeneities and degradation phenomena (Mitzel et al., 2020; Fink et al., 2020; Shao et al., 2019; Barbir, 2012; Belhadj et al., 2018). However, such in situ monitoring concepts are often inherently intrusive. Segmented current collectors or measurement plates are integrated into the electrochemical assembly and may influence local electrochemical conditions, for example, through altered current paths, modified contact resistances, or locally changed boundary conditions. Moreover, many established techniques require cutting, retrofitting, or structural modification of bipolar plates, which can compromise mechanical integrity and restrict sensor position flexibility (Toharias et al., 2024). In previous approaches in which fiber-optic sensors were implemented in machined bipolar plates to detect flooding events or uneven humidification, both of which can cause current-density variations, the structural modifications could also impair flow-field uniformity, with their impact remaining insufficiently controlled (David et al., 2014). Other fiber-optic-based systems were integrated at the stack level, providing only temperature data and lacking exchangeability due to integration into a full-stack prototype assembly (Muck et al., 2024). Although previous studies have demonstrated the integration of fiber optical (FO) sensors into bipolar plates, to the authors' knowledge, no humidity-sensitive fiber sensors have yet been reported that are fully embedded in bipolar plates in a minimally invasive manner. For the proposed integration concept, sensor dimensions, handling, response dynamics, and compatibility with liquid-water exposure remain important design constraints (David et al., 2014).
To address these challenges, an innovative smart bipolar plate (SBP) concept has been developed that combines additive manufacturing (AM) with provisions for future fiber-optic sensor integration. In the present study, the bipolar plate was fabricated, whereas humidity-sensor characterization and silica-capillary packaging were performed ex situ; full sensor integration and in-cell validation remain future work. The concept is intended to enable spatially resolved, multi-parameter in situ measurements, including humidity, temperature, and potentially strain, while minimizing changes to the electrochemical and flow characteristics of standard bipolar plates (Hartbauer, 2023; Reiter, 2021).
The applied AM process, laser powder bed fusion (LPBF) (Nabavi et al., 2025), provides the design flexibility required to embed FO sensors within the SBP structure, preserving mechanical robustness and enabling compact sensor integration (Ahmed et al., 2024).
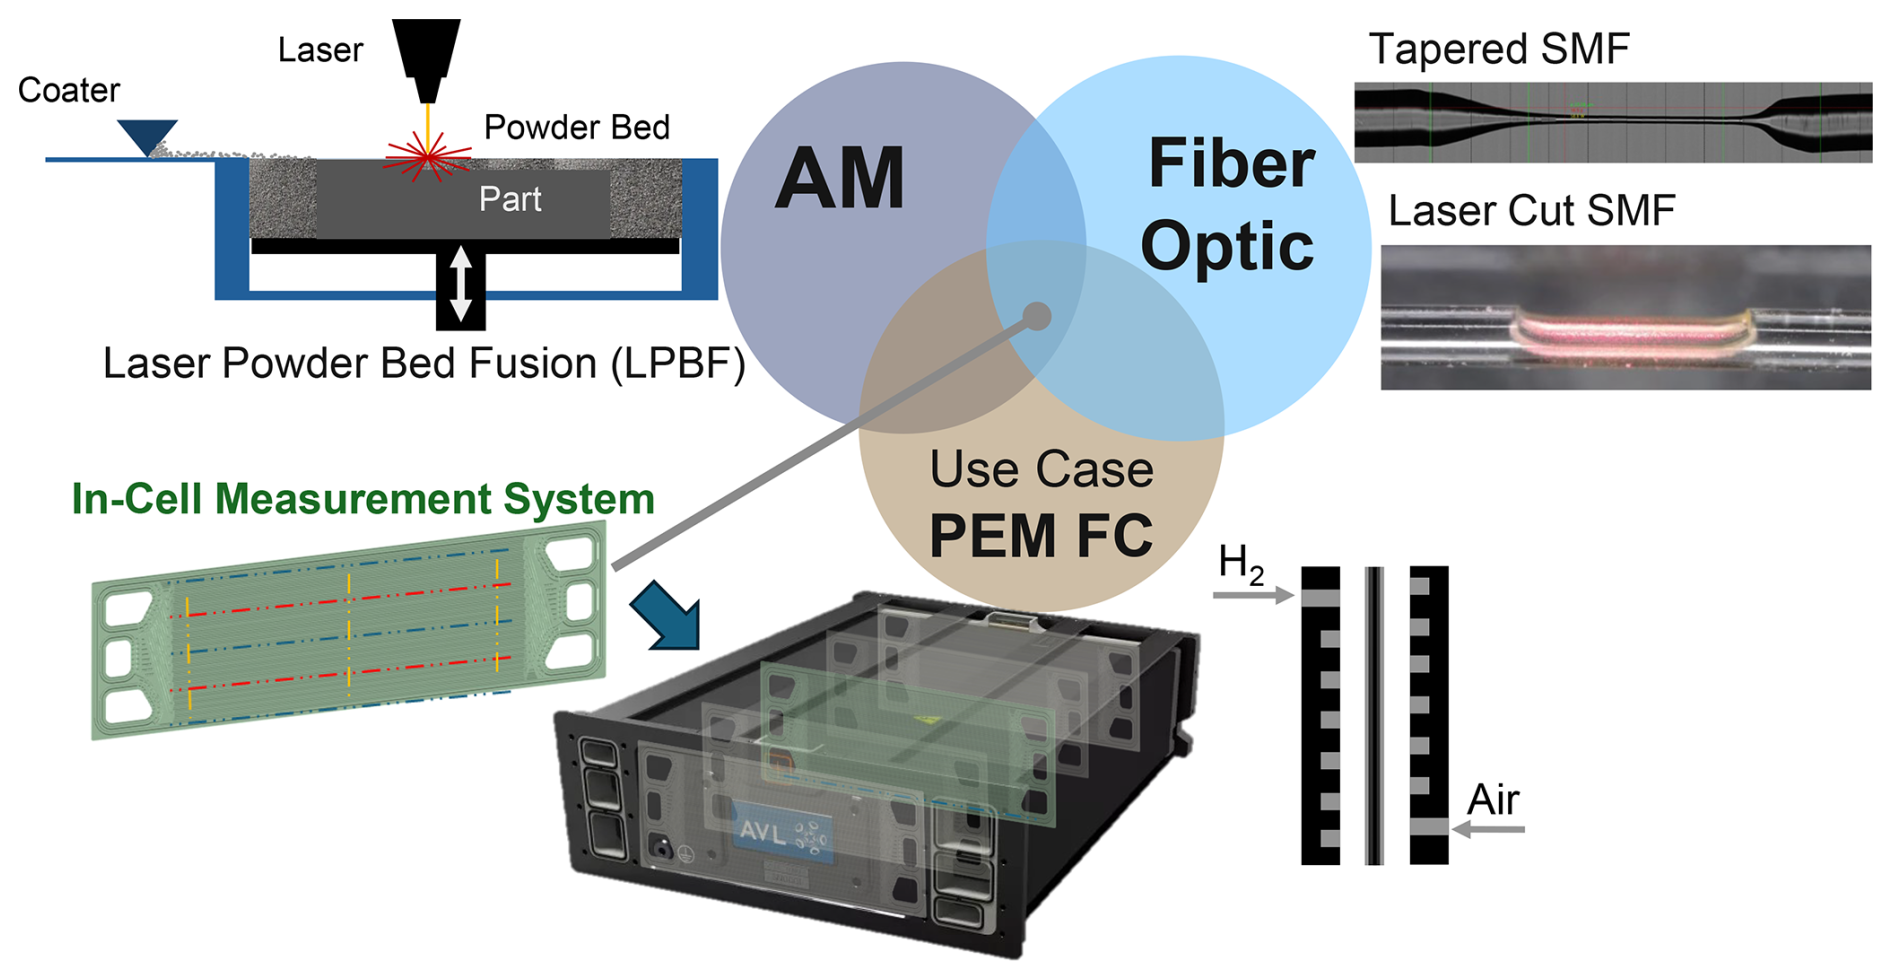
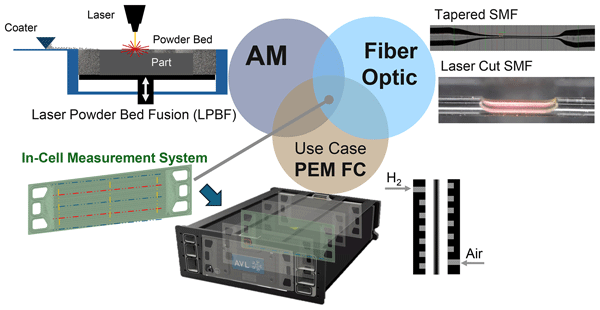
Figure 1Multidisciplinary convergence of a smart bipolar plate for PEM fuel cell applications: combination of additive manufacturing and fiber-optic sensor technology, adapted from Reiter et al. (2025).
This study focuses on advancing fiber-optic sensors for relative humidity monitoring, tailored for integration into a 3D-printed SBP in PEM FCs. Within this framework, two different fiber-optic humidity sensing approaches have been developed and investigated with a view to FC integration:
- 1.
Tapered optical fibers – for these optical fiber sensors, the fiber diameter is reduced to a few tens of micrometers or less (10–30 µm in this work), enabling interaction of the optical field with the surrounding medium. The optical response arises from surface interaction and from changes in the modal propagation conditions within the tapered region. Depending on the taper geometry and transition adiabaticity, higher-order modes may be excited and affected by the surrounding medium (Zhang et al., 2023). When tapered fibers are coated with hygroscopic materials, such as polyvinyl alcohol or chitosan, water absorption causes volumetric expansion and changes in the coating thickness. These changes modify the interaction between the guided optical field and the coating, resulting in measurable variations in transmitted optical power (Korposh et al., 2019).
- 2.
Laser-structured optical fibers – here, ultrashort-pulse laser machining selectively removes part of the fiber cladding, creating a D-shaped interaction region near the core–cladding boundary. The modified region enables interaction of the guided optical field with the surrounding medium, which can alter transmitted intensity through changes in local optical boundary conditions. This approach provides compact, spatially localized interaction regions that can be tailored for sensing applications in dynamic environments such as fuel cells or electrolysis cells (Chen et al., 2023; Hussain et al., 2025).
Both sensor designs rely on the interaction of the optical field with water molecules near the fiber surface but differ in structural definition and tuning flexibility. The laser-cut variant is expected to allow the size and position of the interaction region to be tailored precisely, whereas tapered fibers provide a larger, less localized interaction region. The implemented packaging concept employs silica capillaries for mechanical reinforcement while maintaining optical access, supporting minimally invasive integration; long-term stability under FC operating conditions remains to be established.
2.1 Additively manufactured smart bipolar plate design and sensor integration
Graphite-based bipolar plates offer low interfacial contact resistance and high corrosion resistance, and are typically manufactured using mature molding processes, whereas thin stamped metallic plates dominate current automotive PEM fuel cell stacks owing to their high-power density and suitability for fast, cost-efficient mass production (Irshad and Shahgaldi, 2025).
In addition, stainless-steel bipolar plates, although requiring additional mitigation of corrosion and contact resistance effects during PEM operation, can also be fabricated additively by LPBF. This allows the fabrication of complex internal geometries, such as micro-channel structures (Lin et al., 2023), providing a basis for advanced concepts involving thin-walled, complex channel geometries and embedded fiber sensor integration.
Optical fibers or protective capillary channels can be incorporated into the SBP during controlled process interruptions. Whereas fiber Bragg grating (FBG) sensors represent a well-established approach for strain monitoring in additively manufactured metal structures (Ahmed et al., 2024), FBG fibers can also be embedded to turn the bipolar plate into a multiparameter diagnostic tool. The presented SBP concept extends beyond this by enabling the integration of a broader range of FO sensing approaches, either through direct embedding into the metal structure or via loosely guided fibers within metallic capillary channels, which could be embedded during LPBF process interruptions in predefined cavities. Such configurations are expected to reduce parasitic strain coupling and friction-induced effects, and would enable spatially resolved temperature distribution measurements along the flow field. The metallic capillary channels provide mechanical stability and shield the fibers from unconsolidated powder during the LPBF process. The primary innovation of this work, however, lies in the development of humidity-sensitive fibers: tapered single-mode fibers (SMFs) are complemented by D-shaped laser-cut fibers whose localized sensing region can be placed precisely in the flow field. This configuration is intended to enable direct interaction with reactant gases and liquid water while retaining most of the fiber cross-section.
The flow-field design of the SBP prototype adopts a single serpentine-channel geometry similar to that of automotive PEM FCs but modified to create controlled, non-uniform temperature zones through deliberate variations in the flow-field geometry and local heat-transfer conditions. These zones are intended to accelerate degradation processes and increase local parameter gradients along the flow field. In addition, a single serpentine layout gives rise to pronounced humidity gradients along the channel and to local liquid-water accumulation, for example, at channel bends, which motivates spatially resolved humidity monitoring.
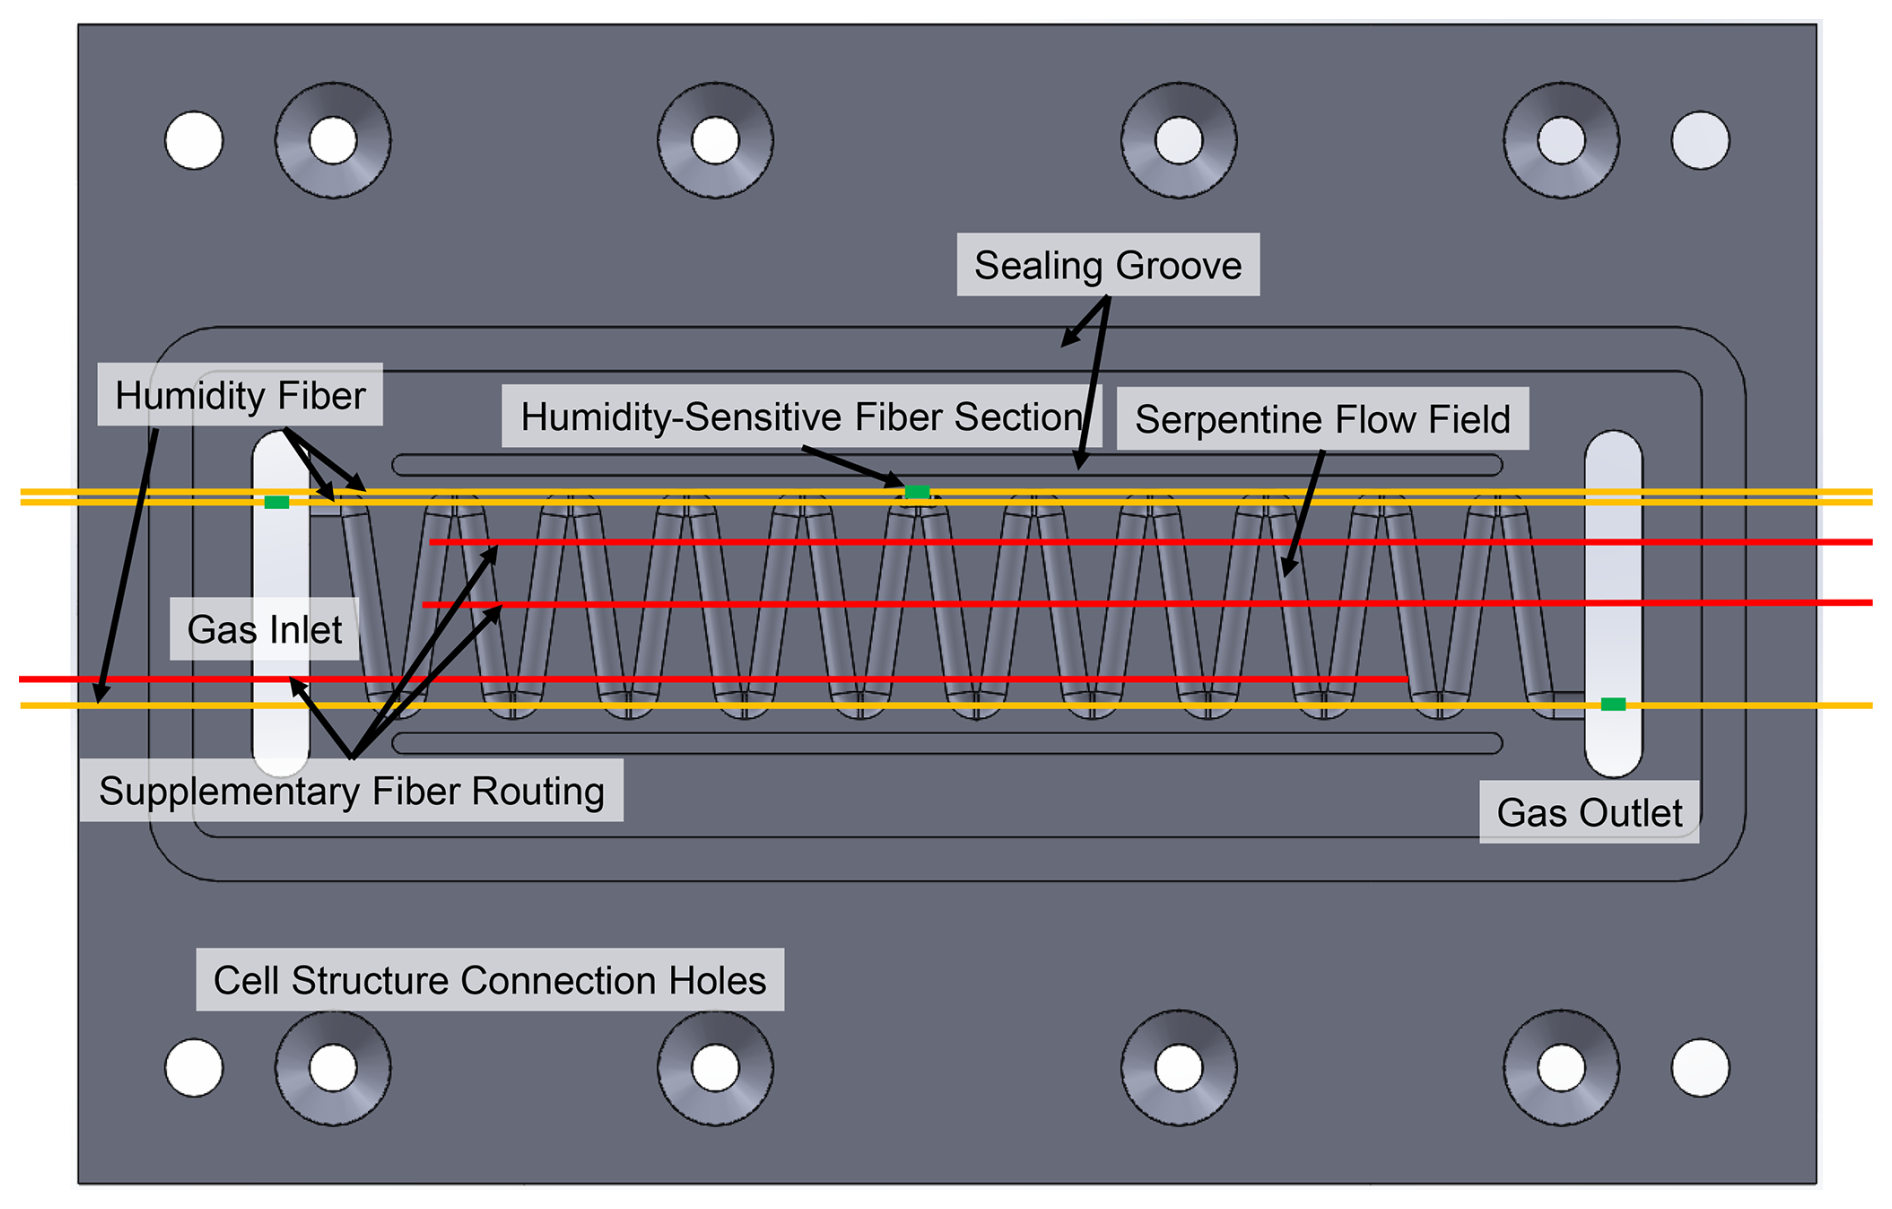
Figure 2Design of the smart bipolar plate with a serpentine flow field and proposed routing and positions of optical humidity-measurement fibers, including supplementary fiber routing for optional integration of additional FO sensors. The drawing depicts the integration concept, not a fully integrated and validated humidity-sensor assembly.
Manufacturing of the SBP was performed using an SLM Solutions 280HL system and 316L stainless-steel powder. Selected LPBF parameters were applied to support the fabrication of high-fidelity thin-channel structures and to reduce residual stress. Gas tightness was a design requirement but was not quantitatively assessed within the scope of the present study. If needed, stainless-steel capillary channels with inner diameters of 250 µm or 0.5 mm were integrated during process interruptions to enable guided fiber insertion, depending on the outer diameter of the fibers. The 250 µm capillaries were intended for direct integration of standard optical fibers, such as FBG sensors, whereas the 0.5 mm capillaries were designed to accommodate the packaged humidity-sensor assemblies based on fused-silica capillaries (OD 360 µm). Machining comprised selective mechanical finishing steps, including surface grinding and milling applied only to functionally relevant areas, as well as drilling, in order to compensate for LPBF-induced roughness and to support the dimensional tolerances, surface flatness, and sealing conditions required for future PEM test-bed operation.
The overall design of the additively manufactured SBP, including the serpentine flow-field layout and the intended positions of the fiber-optic sensing elements, is illustrated in Fig. 2. However, the SBP with a single-channel flow field represents an experimental research structure that was deliberately modified for diagnostic purposes in a single-cell test-bed environment.
2.2 Design and fabrication principles of relative humidity fiber sensors
Tapered optical fibers are a well-established approach for humidity sensing because reducing the fiber diameter modifies the modal propagation conditions and enables interaction of the optical field with the surrounding medium. When coated with hygroscopic materials, changes in water content modify the effective refractive index, enabling the detection of humidity and condensation via intensity or spectral shifts (Korposh et al., 2019). In this work, only uncoated tapered fibers were investigated to enable straightforward processing without additional coating-induced thickening, thereby keeping the sensor footprint small for embedding.
To improve robustness, laser-cut fibers were additionally introduced. Ultrashort-pulse laser processing generates controlled microstructures that enhance light–water interaction, allowing tailored sensitivity and compact sensor designs suitable for harsh environments (Chen et al., 2023; Hussain et al., 2025).
Both approaches exploit evanescent-field interaction but differ structurally and were investigated regarding humidity response, optical throughput, and compatibility with the proposed SBP integration concept.
2.2.1 Tapered and laser-cut humidity-sensitive fibers
Both sensor variants are fabricated from SMF-28 Ultra® single-mode fiber (Corning®; operating wavelength: 1260–1625 nm; mode-field diameter: 9.2 ± 0.4 µm at 1310 nm and 10.4 ± 0.5 µm at 1550 nm; cladding diameter: 125 ± 0.7 µm; coating diameter: 242 ± 5 µm; cut-off wavelength: < 1260 nm).
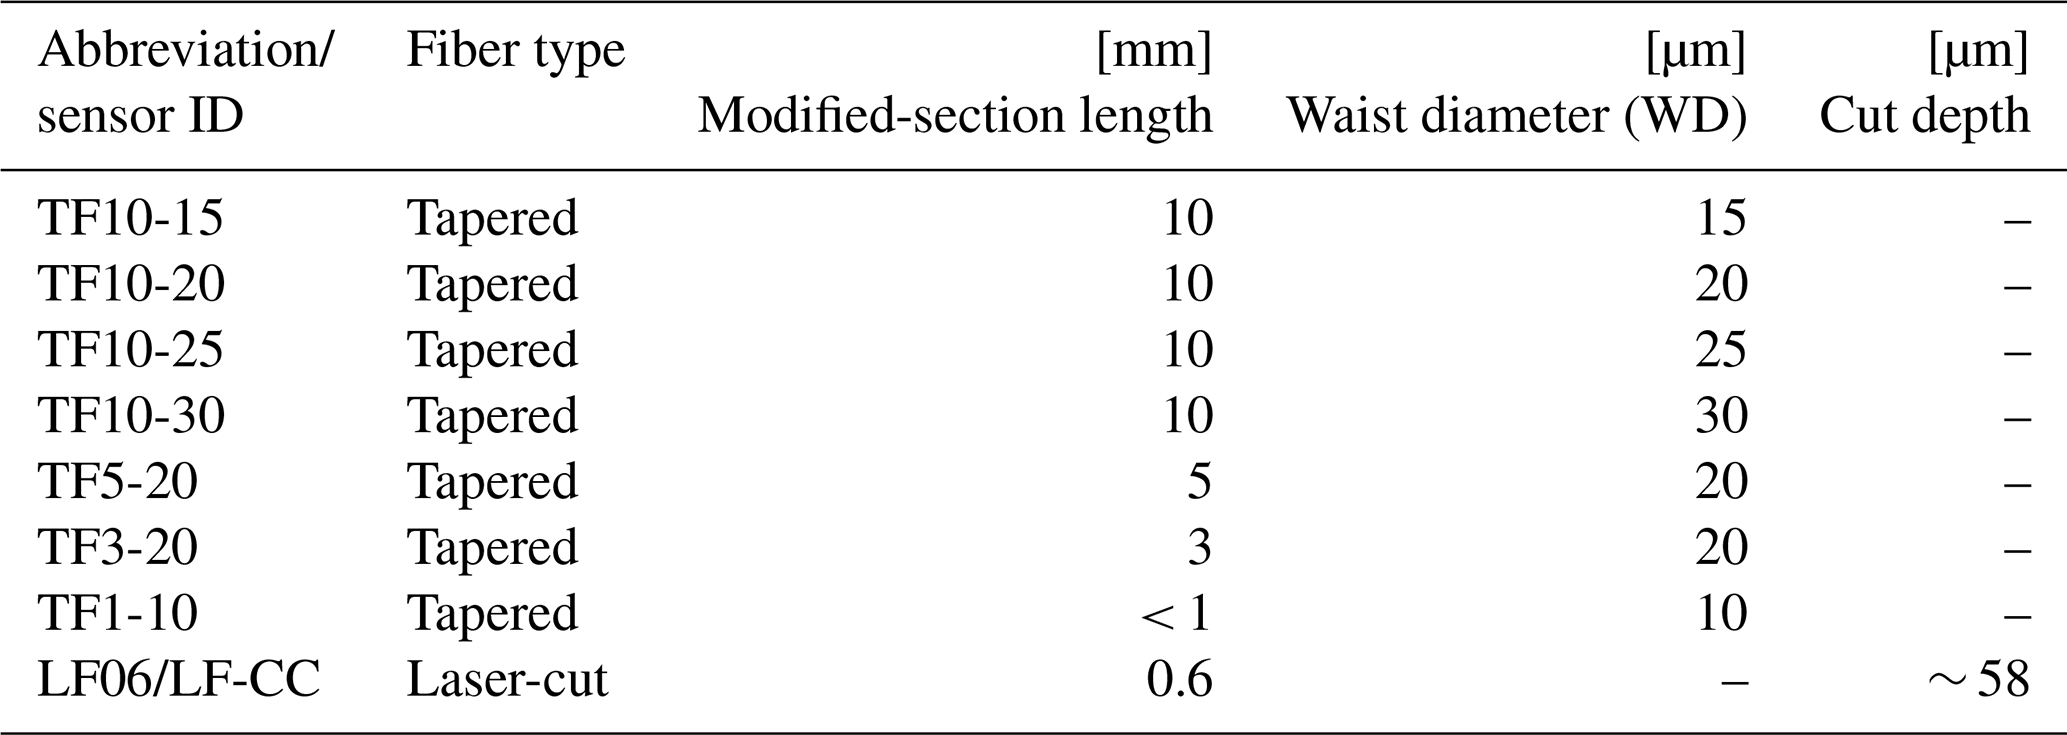
Table 1Overview of targeted rH optical fiber sensor dimensions.
2.2.2 Tapered fibers
Tapered sensors are produced by localized heating and controlled axial pulling, forming a waist region with a reduced waist diameter (WD) and a defined length. Fabrication was performed on a Thorlabs-Vytran GPX3850 workstation with a CCD (charge-coupled device)-based metrology system providing real-time geometric feedback (WD/waist length, taper profile). For the longer taper geometries (5 and 10 mm waist length), the standard tapering mode of the workstation was used, whereas the shorter geometries (3 and < 1 mm waist length) were fabricated using the heat-pull mode, which yielded uniform surface profiles in the investigated specimens. The taper geometries, including waist diameter and interaction length, are summarized in Table 1. Process parameters such as heating power and pulling force, aside from the target waist diameter and waist length, were kept almost constant across all specimens with the aim of minimizing process-induced variations. Nevertheless, with one specimen per tapered-fiber geometry, the effects of the target waist geometry cannot be separated from specimen-to-specimen variation in the fabricated taper transitions and associated modal propagation conditions. Differences in optical behavior are therefore interpreted as responses of the investigated specimens, rather than being attributed primarily to the target taper geometry.
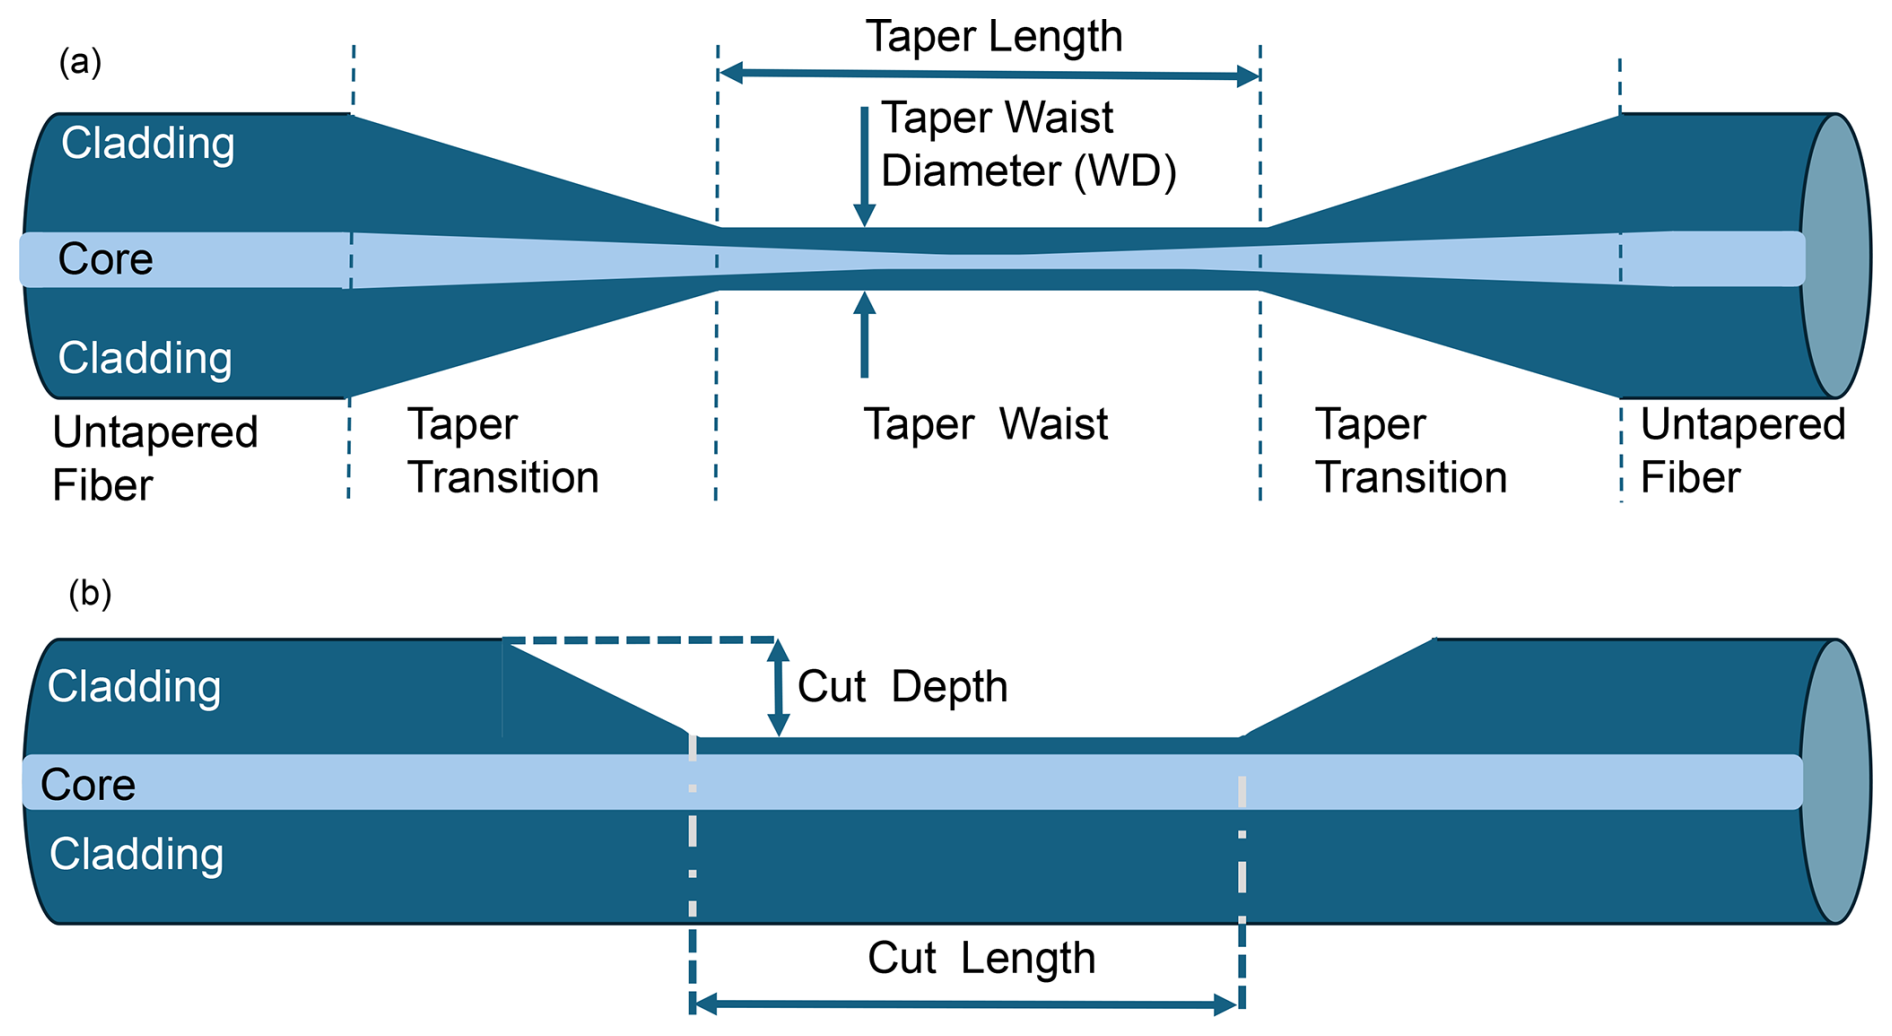
Figure 3Scheme and sections of the (a) tapered and (b) laser-cut fibers, indicating the geometrical modification of the fiber structure.
Condensation events introduce abrupt changes in scattering/reflectivity, producing distinct intensity variations that may allow discrimination between high relative humidity and droplet formation. However, this discrimination was not systematically investigated in the present study. The selected geometries and associated metrology are summarized in Fig. 3a and Table 1.
2.2.3 Laser-cut fibers
Laser-structured sensors are realized by ultrashort-laser-pulse machining of the fiber to create micro-notches or shallow trenches that function as engineered interaction zones for evanescent coupling and resonant effects (localized Bragg or Fabry–Pérot responses) (Hussain et al., 2025). In the present work, a single D-shaped cut was used, which acts as a localized evanescent-field interaction zone and is not expected to produce resonant spectral features. Processing was performed on a precision positioning system (PI L-731) using a PHAROS PH2 femtosecond laser operated at the second-harmonic wavelength (λ = 515 nm). The laser processing was conducted under ambient atmospheric conditions without the use of a controlled environment. The laser was focused onto the fiber using a 10× objective (NA = 0.3), with a pulse energy of approximately 5 µJ and a repetition rate of 333.3 Hz, corresponding to an estimated laser fluence of ∼ 6.3 J cm−2 (assuming an effective spot diameter of approximately 10 µm at the fiber surface). The use of ultrashort laser pulses minimizes the heat-affected zone and suppresses cracking during fiber processing. For laser cutting, a scanning speed of 200 µm s−1 was used. Post-process inspection using a KEYENCE VHX-7000 optical microscope was performed to assess the processed geometry and edge quality. Detailed designs and dimensional metrics are provided in Fig. 3b.
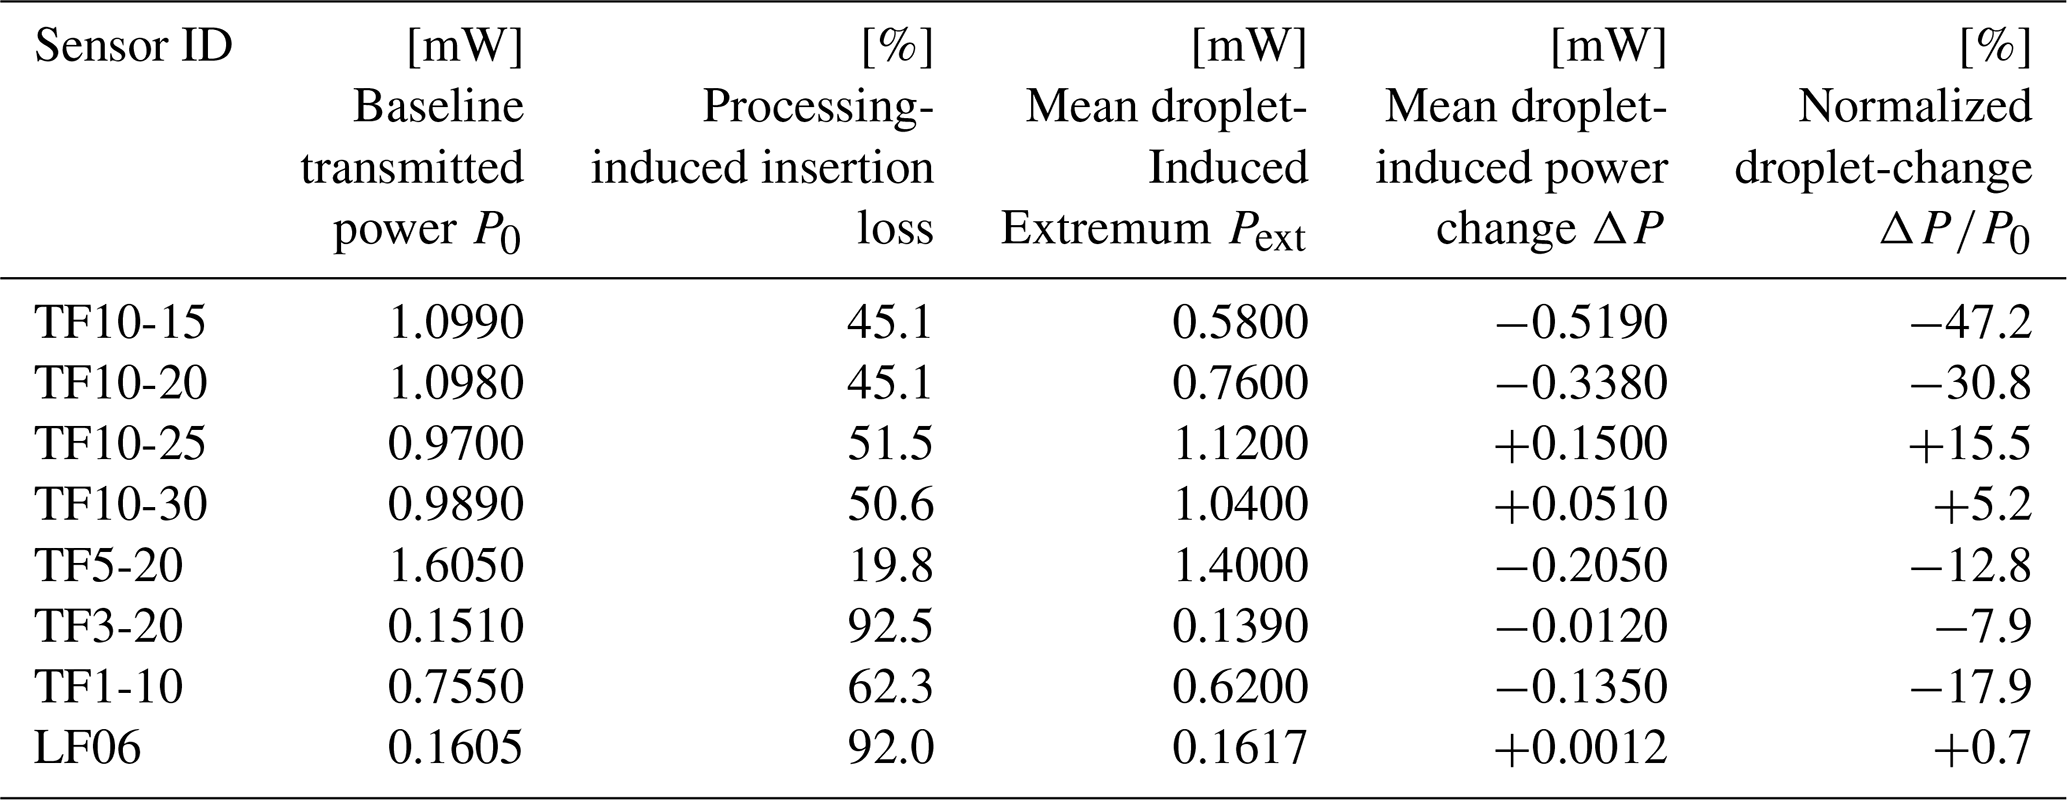
Table 2Overview of intensity-based fiber sensor performance under droplet exposure for a launched optical power of Pin = 2 mW. P0 denotes the baseline transmitted optical power measured after fiber processing and before humidity or droplet interaction. The processing-induced insertion loss is defined as the relative loss between the launched optical power Pin and the baseline transmitted power P0. For each measurement sequence, local extrema associated with visually identifiable vaporizer activation events were extracted, and their arithmetic mean was reported as Pext. Because droplet size and impact position were uncontrolled, these values represent descriptive response metrics rather than metrologically traceable estimates. The droplet-induced power change is defined as ΔP = Pext−P0, where negative values indicate attenuation and positive values indicate transient transmission enhancement. The normalized response ΔP/P0 is reported to enable comparison among the investigated fiber geometries. Values represent mean responses calculated from repeated droplet deposition events. The number of evaluated events ranged from seven to 20, depending on the investigated sensor geometry.
The laser-cut specimens LF06 and LF-CC were fabricated using the same manufacturing procedure and the same nominal dimensions: a modified-section length of 0.6 mm and a cut depth of approximately 58 µm. LF06 was used for the piezo-vaporizer droplet measurements in Fig. 12 and Table 2, whereas a different physical specimen, designated LF-CC, was used for the climate-chamber measurements in Fig. 13. Exact specimen-to-specimen deviations in the fabricated dimensions were not investigated. The measured cut depth of approximately 58.4 µm shown in Fig. 12 therefore characterizes LF06 and should not be taken as an independently measured dimension of LF-CC.
Using the same SMF-28 Ultra platform simplifies splicing and optical coupling, avoiding mode-field mismatch. For future PEM fuel cell deployment, the sensors are intended to be positioned near serpentine-channel transitions where condensate formation may occur. This positioning would expose the sensitive region to gas and liquid phases while maintaining a small sensor footprint.
2.3 Packaging concept for humidity-sensitive fiber integration
To support defined alignment and more robust fixation of humidity-sensitive fibers for future SBP integration, a dedicated silica-capillary packaging concept was implemented and tested ex situ. A flexible polyimide-coated fused-silica capillary (ID 250 µm ± 6 µm, OD 360 µm ± 10 µm; CM Scientific TSP250350) was employed both as a positioning aid during laser processing and as a protective housing for prospective integration. The capillary was modified using the same PHAROS PH2 femtosecond laser system applied for fiber structuring, with identical processing parameters, except for a repetition rate of 1 kHz. A 2.5 mm long opening with a depth exceeding half of the capillary outer diameter was introduced to expose the sensitive fiber region while retaining a protective capillary structure (see Fig. 14). The workflow comprised (i) capillary cutting, (ii) fiber insertion, (iii) adhesive fixation to prevent displacement during laser cutting and measurement, and (iv) fiber processing. Future work will include post-process insertion of the packaged assembly into the metallic channels of the additively manufactured bipolar plate and subsequent connection to the optical interrogation system via SMF splices.
2.4 Experimental setup for humidity-sensor characterization
Droplet-exposure and climate-chamber measurements were complementary tests with different exposure conditions and optical configurations. For the laser-cut design, separate specimens with the same nominal dimensions and manufacturing procedure were used; this does not establish identical actual dimensions or directly comparable responses. The light source was a fiber-coupled super luminescent diode (SLD1550S-A2, Thorlabs) with a center wavelength of 1550 nm (specified range 1520–1580 nm) and a typical 3 dB bandwidth of 90 nm and a nominal output of 2.5 mW. For measurements, the output power was set to 2 mW and controlled using a laser diode driver with integrated temperature stabilization (CLD1010LP, Thorlabs). Stable drive current and active thermoelectric cooler (TEC)-based temperature control of the super luminescent diode (SLD) are essential for reliable intensity-based sensing, but no dedicated reference channel or tap-coupler-based source-power monitoring was implemented during the measurements. Consequently, potential source-power fluctuations cannot be separated from sensor-induced intensity changes and therefore represent a limitation of the present proof-of-concept study. Optical power was monitored using a Thorlabs PM100D power meter equipped with an S154C InGaAs photodiode sensor (700–1800 nm), whereas spectral behavior was analyzed using an Anritsu MS9740B optical spectrum analyzer (0.6–1.7 µm) connected via a 50/50 fiber splitter to the sensor output.
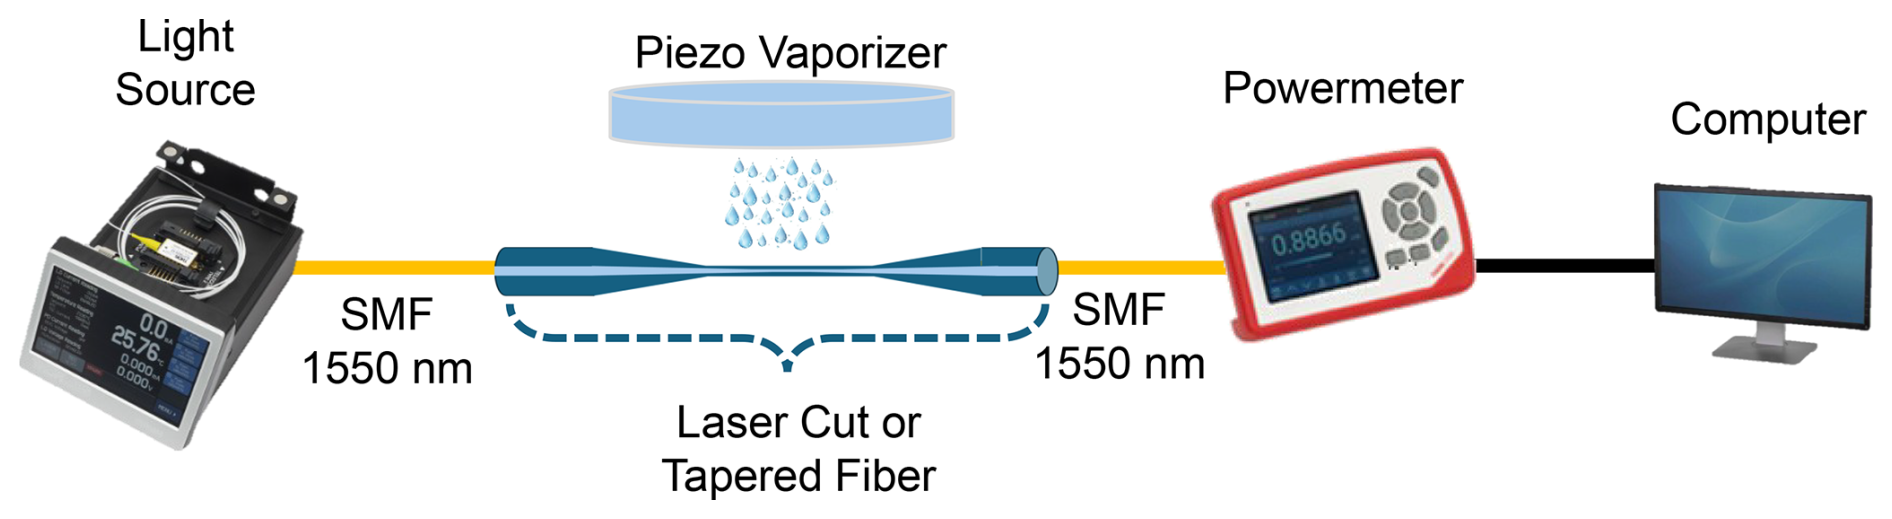
Figure 4Experimental setup for testing humidity-sensitive fiber samples using a broadband light source, a piezo vaporizer, and a power measurement system.
Humidity was set using a climate chamber (Vötsch VC3 4018), whereas droplet exposure was generated using an ultrasonic piezo vaporizer (Arduino-based, Reichelt Elektronik) supplied with deionized water. The vaporizer was operated manually and activated for a few seconds at a time until a distinct signal change was observed. The activation duration and interval were therefore not fixed but depended on the observed sensor response. Care was taken to avoid excessive water accumulation on the fiber surface, such that the measurements primarily reflected transient droplet-interaction events rather than prolonged immersion or persistent water films. Similar ultrasonic nebulizers have been reported to generate droplets predominantly in the range of 3–7 µm. Figure 4 illustrates the experimental setup for humidity testing, comprising the fiber-coupled SLD as a broadband light source, the piezo vaporizer, and a single optical power measurement unit for signal readout.
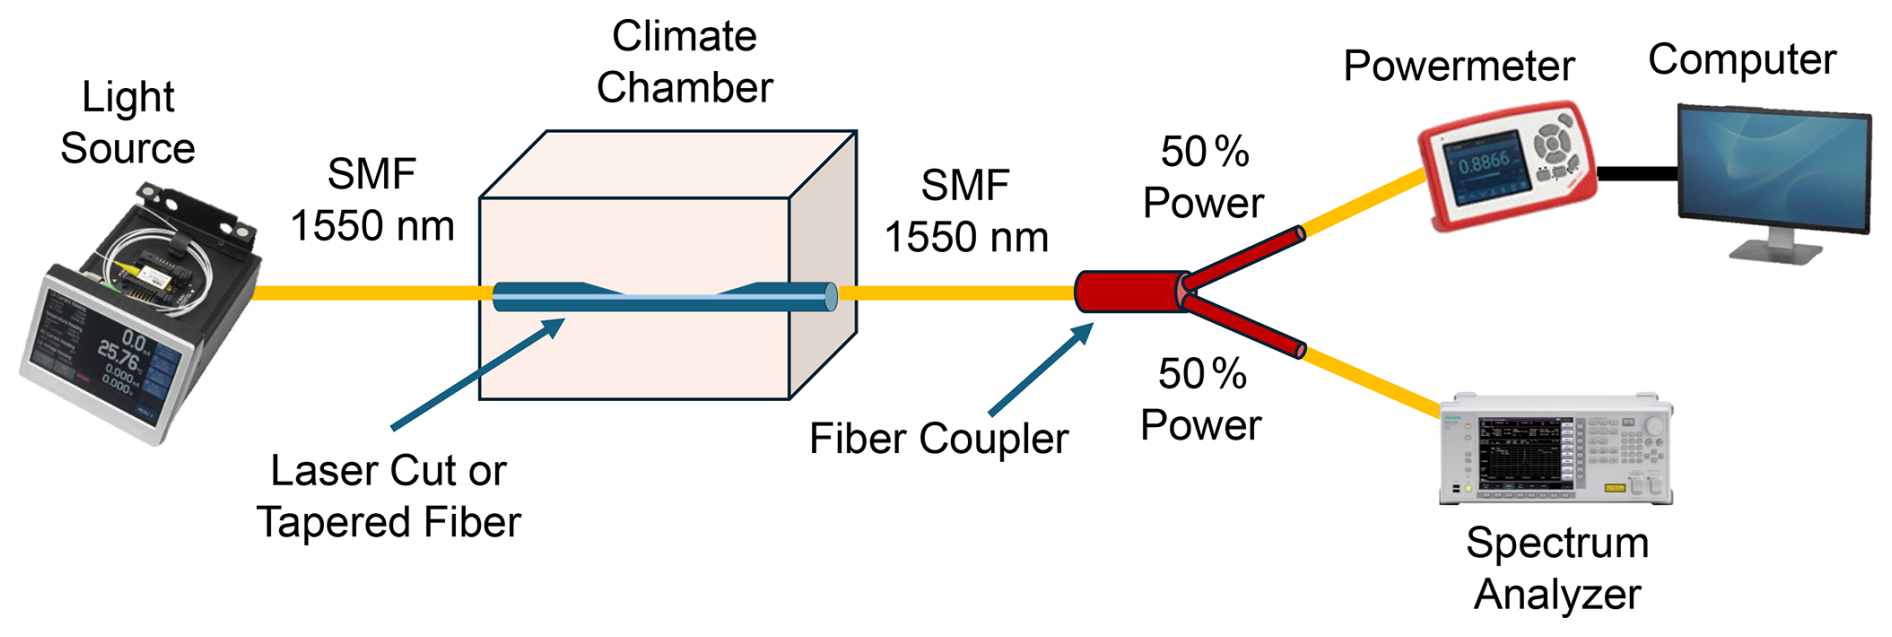
Figure 5Experimental setup with a climate chamber for humidity control and alternative measurements using a spectrum analyzer via a 50/50 fiber splitter.
Figure 5 depicts the experimental configuration within the climate chamber, which was used to set defined humidity levels for sensor characterization. The chamber temperature was kept constant at 70 °C, and the relative humidity was increased stepwise from 20 % to 80 % rH in steps of 10 % rH; each level was held for 30 min before a 3 min record was acquired. The internal humidity sensor of the chamber, with a specified uncertainty of ±1 % to ±3 % rH, served as reference. No independent external reference hygrometer was used. In general, two types of measurement modes were employed: (i) direct optical power monitoring using the Thorlabs PM100D power meter and (ii) combined spectral and power analysis via a 50/50 fiber splitter connected to the Anritsu MS9740B optical spectrum analyzer and the power meter.
Unless stated otherwise, one specimen was fabricated and tested for each geometry due to the exploratory nature of the study.

Figure 6CCD images of tapered fibers produced with different WD and a 10 mm tapering length: (a) TF10-15, (b) TF10-20, (c) TF10-25, and (d) TF10-30 with a 30 µm WD.
2.5 Fabrication and sensitivity analysis of tapered optical fibers
Tapered fibers exhibited pronounced responses to humidity and droplets, but these responses cannot be attributed solely to an increased evanescent-field fraction of the fundamental mode. To investigate the influence of geometry, tapered fibers with a 10 mm waist length and varying waist diameters of 15, 20, 25, and 30 µm were fabricated using a Thorlabs-Vytran GPX3850 workstation. At these waist diameters, the original core is reduced to approximately 1–2 µm, and conventional core guidance is replaced by guidance at the glass–air interface. The measured response therefore depends on the waist geometry and interaction length as well as on the adiabaticity of the transitions, the resulting modal distribution, insertion loss, and mode stripping when water contacts the taper. The tapering process employed a heating power of 58.0–58.9 W and pulling tensions of 12.7–16.9 g (workstation setting, corresponding to approximately 0.12–0.17 N), resulting in smooth transitions but minor asymmetries, as shown in Fig. 6.
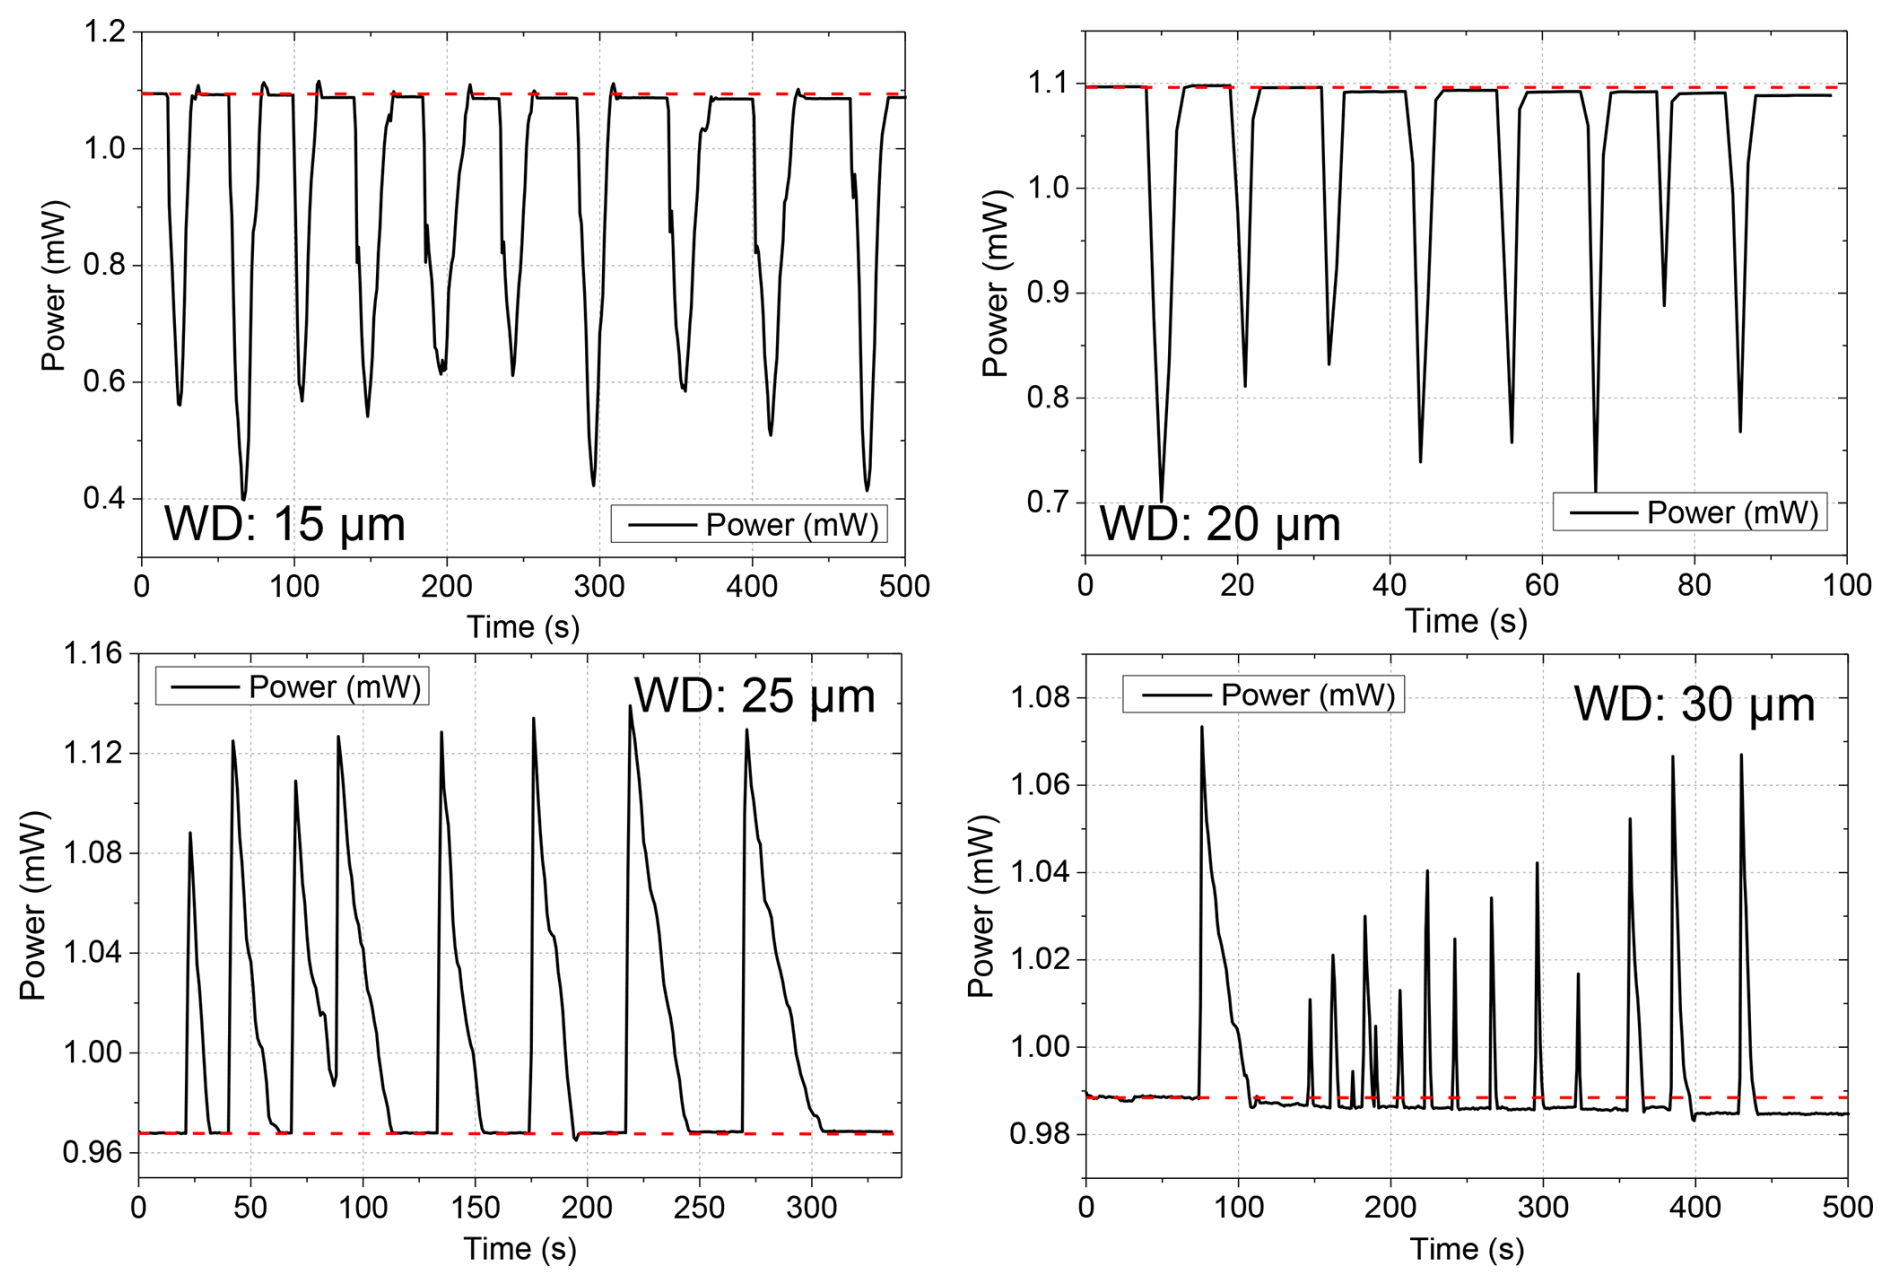
Figure 7Transmitted optical power through fibers with different WD and a 10 mm waist length, showing stepwise changes over time due to water droplets applied by a piezo vaporizer. The recording durations differ because the individual measurements were stopped after completion of the respective event sequence. The dashed red lines indicate the baseline power, P0.
Evaluation measurements were performed with a constant optical input power of 2 mW while recording transmitted power under aerosol exposure from a piezo vaporizer (Fig. 7). Fibers with smaller diameters (15–20 µm) exhibited pronounced power drops (from ≈ 1.1 mW to minima of ≈ 0.4–0.6 mW for TF10-15 and ≈ 0.7–0.9 mW for TF10-20), indicating high droplet-induced response signal changes. Table 2 summarizes the corresponding mean event extrema and normalized mean responses, rather than the deepest individual minima. Larger diameters of 25–30 µm showed smaller signal changes with positive transmission excursions, corresponding to normalized mean responses of +15.5 % for TF10-25 and +5.2 % for TF10-30 (Table 2), while retaining a larger fiber cross-section. A potential contribution from multimode-interference effects at larger taper diameters cannot be excluded. However, this interpretation remains a hypothesis and was not experimentally verified in the present study, although related effects have been discussed in the literature (Wang et al., 2018).
At this stage, the qualitative change from dominant transmission dips to occasional peaks in transmitted power cannot be attributed to a single, fully resolved physical mechanism. The systematic dependence on waist diameter is consistent with changes in the modal content and in the interaction of those modes with water. In particular, non-adiabatic down- and up-taper transitions can couple part of the launched fundamental core mode into higher-order modes of the silica waist. On contact with water, modes whose effective refractive indices fall below the refractive index of water can be stripped from the waist, whereas liquid-water absorption and scattering can introduce additional attenuation. Variations in transition geometry, modal excitation, droplet position, and local coupling conditions can therefore produce either negative dips or occasional positive excursions. The observed events should consequently be interpreted as qualitative, configuration-dependent responses rather than as a monotonic fundamental-mode evanescent-field effect. Representative power changes for the investigated fiber geometries are summarized in Table 2.
Event-to-event variability includes uncontrolled differences in droplet exposure and therefore cannot be interpreted as intrinsic sensor repeatability. Ultrasonic vaporization systems produce a broad droplet-size distribution. In this experimental setup, the vaporizer was positioned 10 cm away from the fiber and manually switched on and off. Droplet interaction events occurred in sequences influenced by the manual activation and subsequent evaporation dynamics. Longer activation times may increase local moisture accumulation and prolong recovery before the next vaporization cycle, resulting in a temporally structured but non-deterministic droplet interaction regime.
The droplet size was not measured in the present setup. For comparable ultrasonic nebulizers, characteristic droplet sizes of approximately 3–7 µm have been reported (Mühleisen et al., 2024).
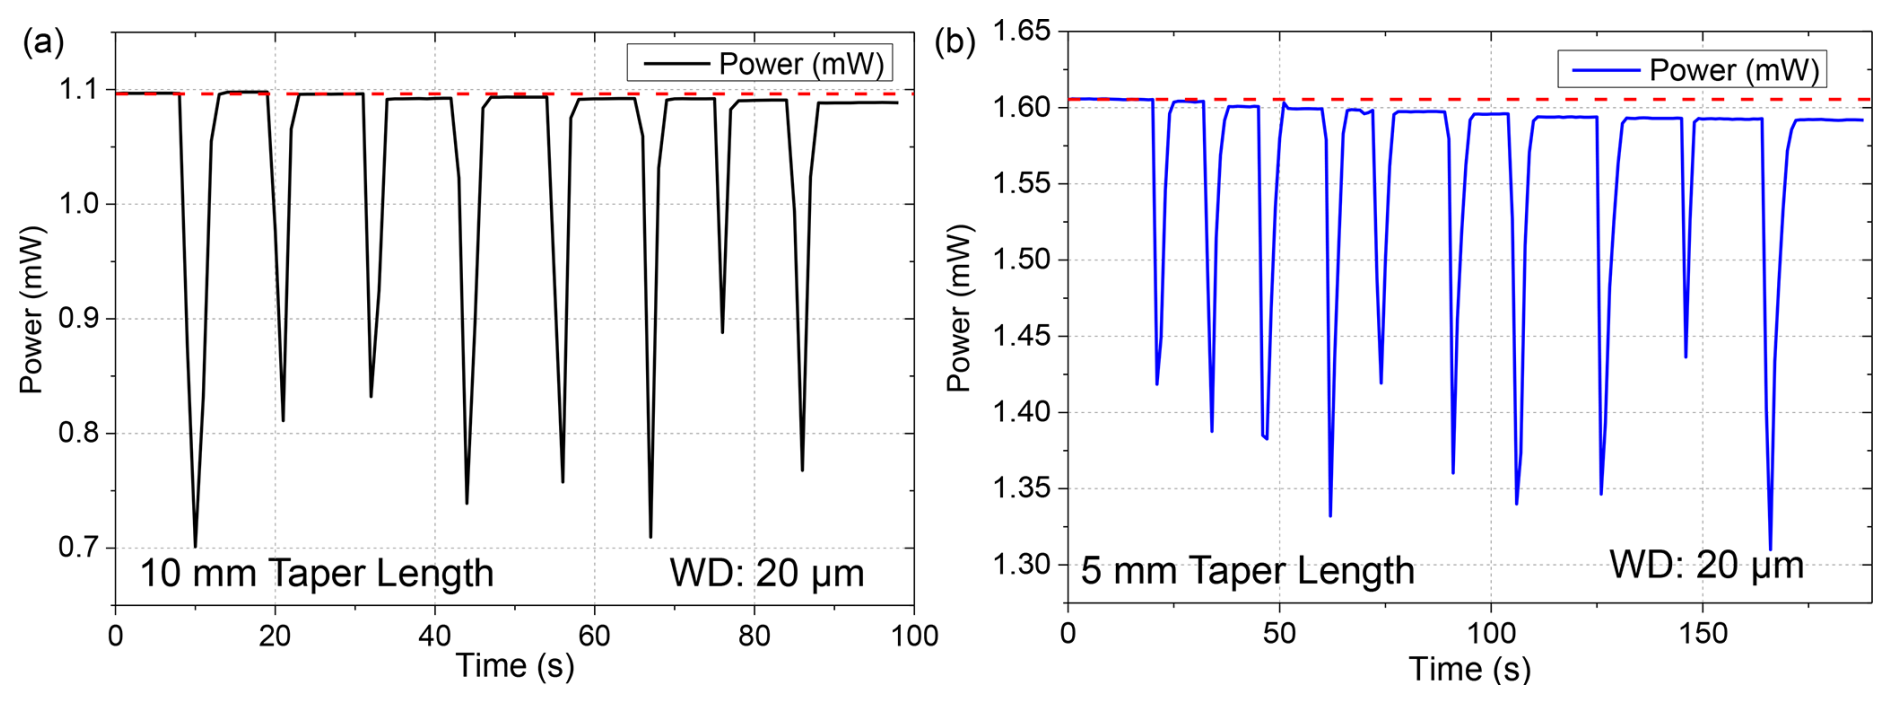
Figure 8Comparison of transmitted optical power through fibers with a 20 µm diameter and (a) a 10 mm (TF10-20; same as shown in Fig. 7b) and (b) a 5 mm (TF5-20) waist length, showing stepwise changes over time due to water droplets applied by a piezo vaporizer. The dashed red lines indicate the baseline power, P0.
Fibers with an identical nominal waist diameter (20 µm) but different lengths (10 mm vs. 5 mm) were evaluated at the same nominal input power (2 mW) under aerosol exposure. TF10-20 exhibited larger observed droplet-associated signal changes than TF5-20 under the applied exposure conditions (Fig. 8), with transmitted power decreasing from approximately 1.10 mW to 0.76 mW. The longer interaction region may have contributed to this difference, but its effect was not isolated from uncontrolled droplet size and position or specimen-specific taper-transition geometry. The 5 mm taper maintained a higher baseline (∼ 1.6 mW) and showed narrower dips. Its normalized response was −12.8 %, compared with approximately −30.8 % for TF10-20 using the visually estimated baseline and the retained mean event extremum in Table 2. Both geometries exhibited recurring signal variations on a few-second timescale during the investigated vaporizer sequences. These observed event times include droplet-delivery and evaporation dynamics, and do not constitute intrinsic sensor response or recovery times. The uncontrolled droplet conditions also do not allow a quantitative assessment of intrinsic sensor repeatability.
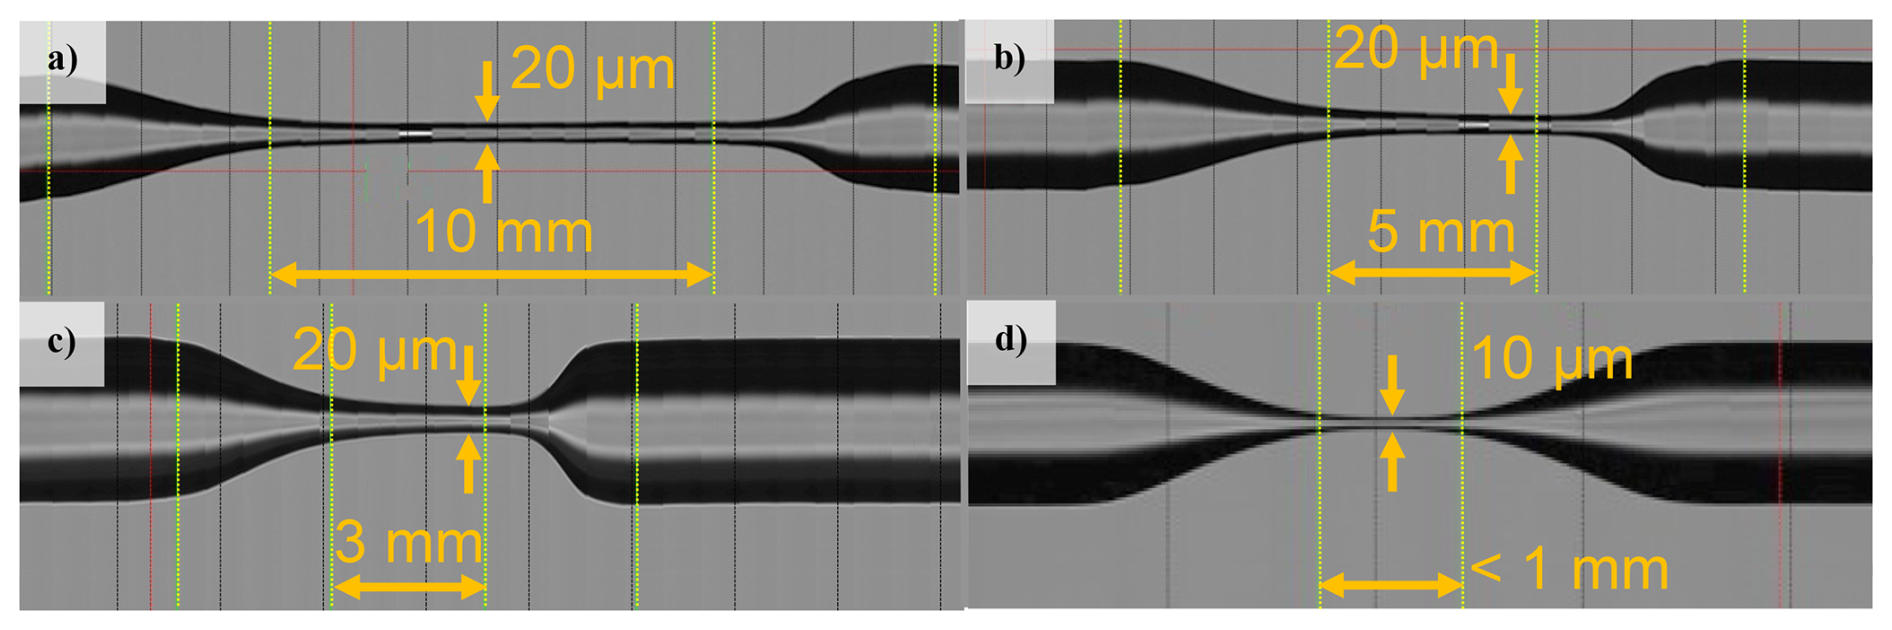
Figure 9CCD images of tapered FO sensors with varying geometries: (a) TF10-20, (b) TF5-20, (c) TF3-20, and (d) TF1-10 with a waist length of < 1 mm and a WD of 10 µm.
To explore the effect of extreme length reduction, tapered fibers with waist lengths of 3 mm (TF3-20, 20 µm waist diameter) and below 1 mm (TF1-10, 10 µm waist diameter) were fabricated using precision heat-pull processing. The CCD images in Fig. 9 show the investigated taper profiles, including the ultrashort TF1-10 geometry in Fig. 9d.
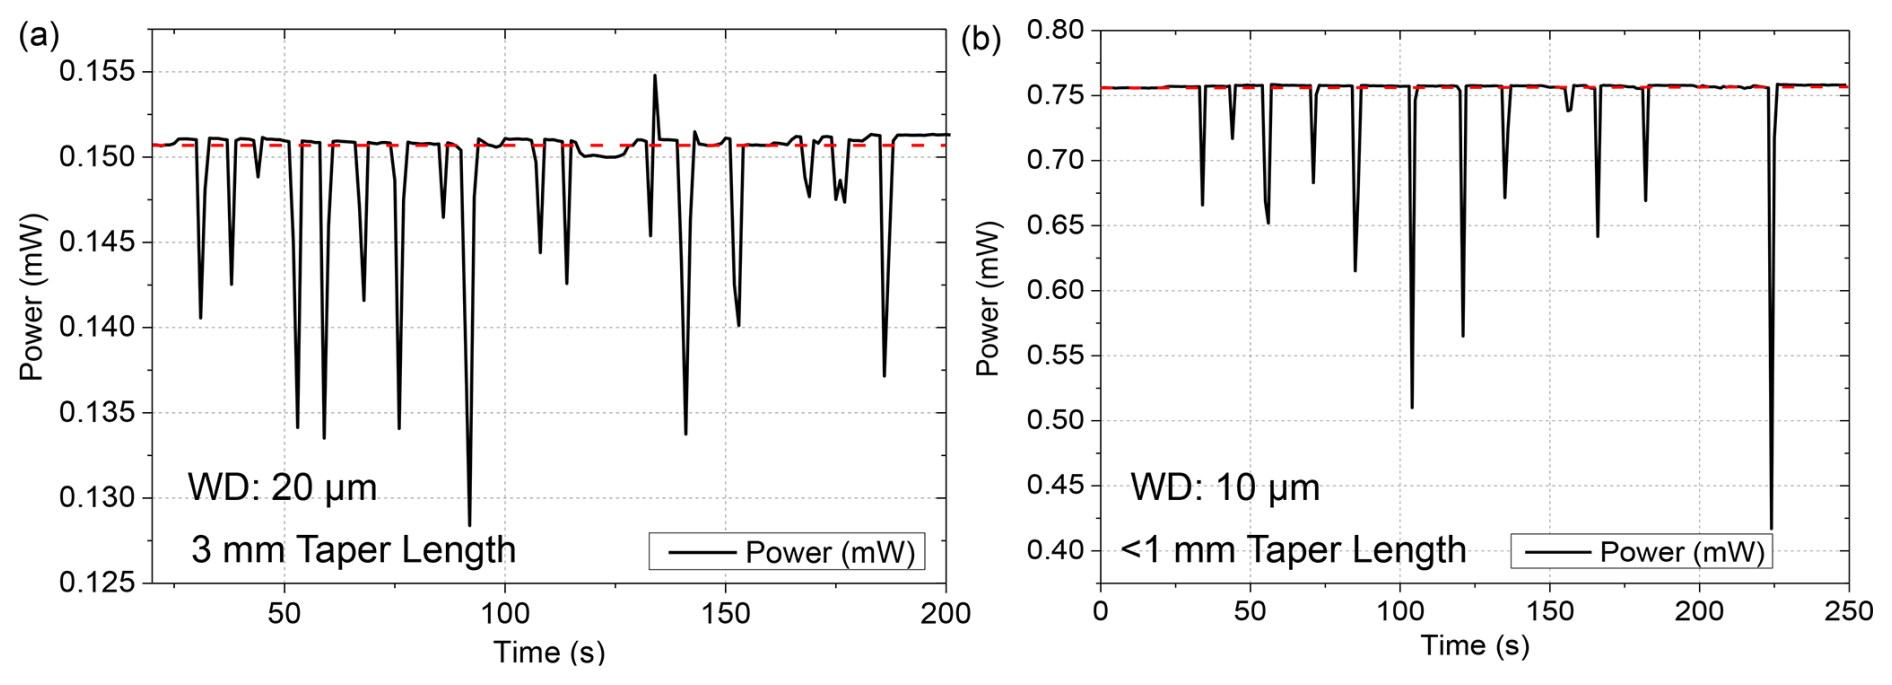
Figure 10Comparison of transmitted optical power through fibers with (a) TF3-20 and (b) TF1-10 (< 1 mm waist length, 10 µm WD), showing stepwise changes over time due to water droplets applied by a piezo vaporizer. The dashed red lines indicate the baseline power, P0.
Performance measurements under aerosol exposure revealed differences between the two geometries (Fig. 10). For TF3-20, the small absolute signal excursions occurred at a low baseline power of 0.151 mW (Table 2); its normalized response (−7.93 %) was also the smallest among the investigated tapered specimens.
Conversely, TF1-10 (< 1 mm waist length, 10 µm waist diameter) produced deeper drops despite its short interaction length. This response should not be assigned to increased field penetration alone. The smaller waist, together with the geometry and non-adiabaticity of the down- and up-taper transitions, can alter the modal distribution, excite higher-order modes, and increase mode stripping when water contacts the taper. These effects provide a plausible explanation for the pronounced observed signal response while leaving a reduced fiber cross-section that remained fragile during handling.
Overall, neither the baseline transmission nor the droplet response varies monotonically with waist length, as summarized in Table 2. The relative optical power loss is calculated from the nominal launched power and the detected baseline power. It includes processing-related and other setup-dependent losses, which were not quantified separately.
The baselines were estimated visually; the displayed decimal places provide consistent formatting and do not establish measurement precision. These descriptive response metrics are subject to uncertainty in the visually estimated baselines and to the uncontrolled droplet conditions.
With one specimen per geometry, geometry-related effects cannot be separated from specimen-to-specimen variations in the fabricated taper transitions and associated modal propagation conditions (see TF3-20 and TF1-10). Smaller waist diameters may partly compensate for the reduced interaction length by altering the modal distribution and increasing mode stripping during water contact; however, these contributions were not isolated experimentally, and the observed response also depends on droplet size and position.
This behavior should not be interpreted as improved intrinsic mechanical robustness. Mechanical robustness was assessed qualitatively during handling and capillary-insertion trials relevant to the proposed SBP integration concept; no standardized mechanical durability testing was performed. Shorter taper sections showed slightly improved practical handling, being less prone to accidental overbending during these trials. These observations do not establish completed sensor integration into the bipolar plate.
The substantially lower absolute transmitted power of TF3-20 compared with TF5-20 and TF1-10 is consistent with increased optical losses associated with the steep down- and up-taper transitions of this specimen (Fig. 9c). However, their contribution was not isolated experimentally from other specimen- and configuration-dependent loss contributions. Waist length alone does not explain the observed baseline transmission: the even shorter TF1-10, with more gradual transitions (Fig. 9d), exhibited a lower insertion loss. With one specimen per geometry, these observations do not establish a general geometry-dependent relationship. Table 2 summarizes the measured baseline powers; for TF3-20, the baseline corresponds to a loss of approximately 92.5 % relative to the nominal launched optical power.
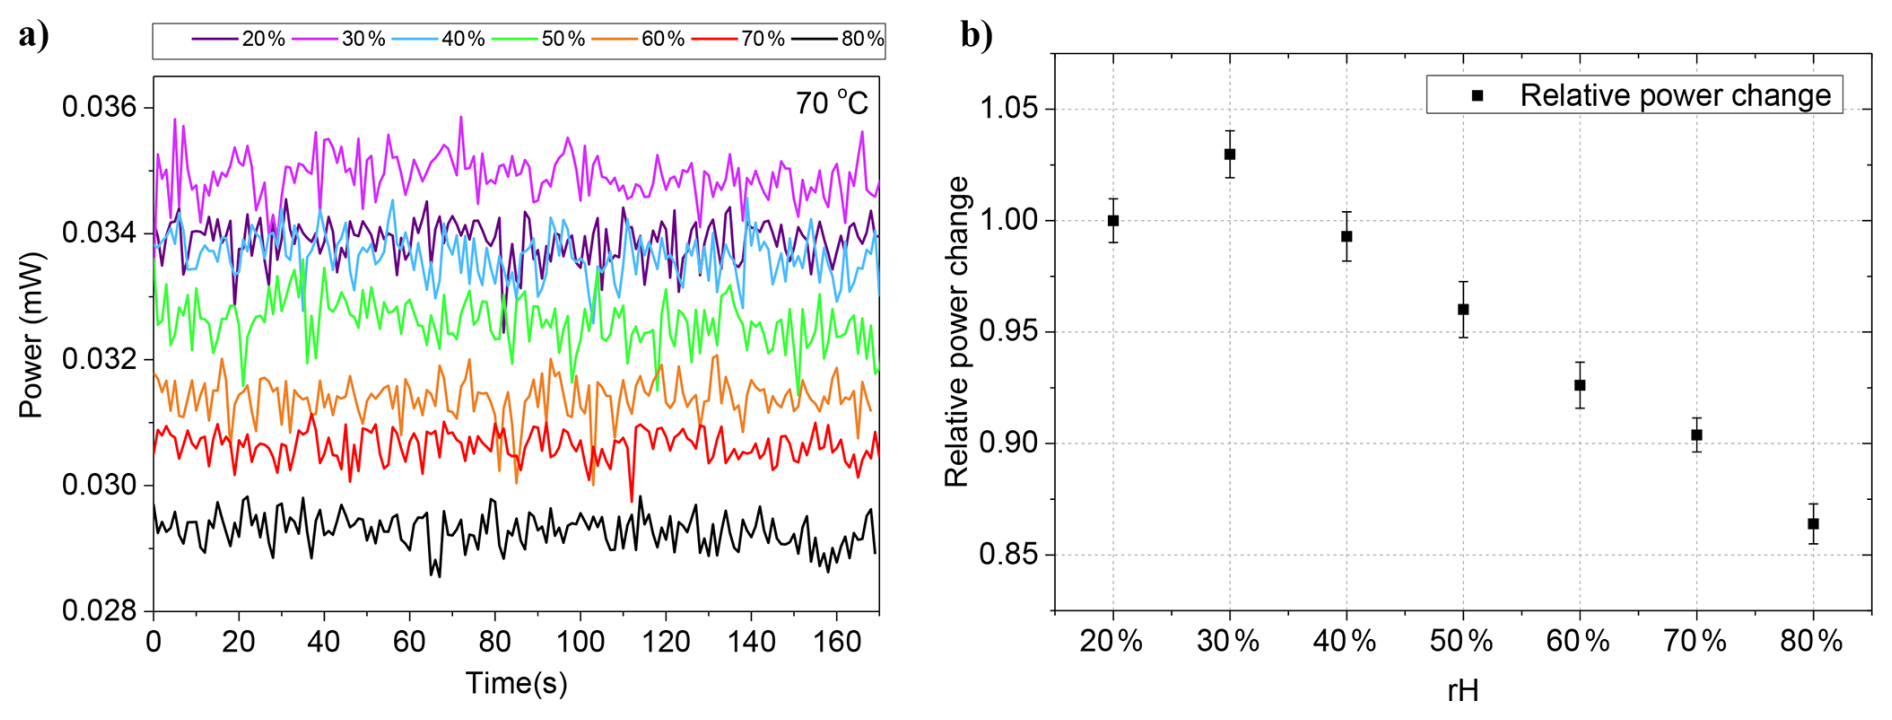
Figure 11(a) Transmitted optical power recorded at different relative humidity levels (20 %–80 % rH) in the climate chamber at 70 °C for the TF1-10 sensor (10 µm waist diameter, < 1 mm waist length). (b) Relative power change normalized to the measurement at 20 % rH, which serves as the reference value. Error bars indicate ± 1 standard deviation (±1σ) calculated from the respective 3 min measurement interval.
A tapered fiber with < 1 mm length and 10 µm waist diameter was analyzed under controlled humidity conditions in a Vötsch VC3 4018 chamber at 70 °C. Figure 11 shows transmitted power over time for relative humidity (rH) steps from 20 % to 80 %. The same physical TF1-10 specimen was used for the vaporizer and climate-chamber measurements. The absolute power level in the climate-chamber measurement (≈ 0.03 mW) is more than 1 order of magnitude lower than the droplet-test baseline of 0.7550 mW reported for TF1-10 in Table 2; the 50/50 fiber splitter (3 dB) alone cannot explain this difference. Possible contributions include configuration-dependent changes associated with mechanical vibrations, slight loosening of optical connections, fiber-feedthrough losses, or coupling changes of the mechanically sensitive ultrashort taper. No permanent fiber degradation was observed, but the available measurements do not exclude it or establish its likelihood. The individual contributions to the additional loss were not measured separately. The amplitude trend follows the relative humidity, showing the highest transmitted power at 30 % rH and a gradual decrease toward 80 % rH, consistent with moisture adsorption on the taper surface.
Short-term signal fluctuations of approximately ±0.4–0.6 µW were observed during the 3 min measurement intervals. The reported fluctuations of ±0.4–0.6 µW correspond to 1 standard deviation (±1σ) of the transmitted-power signal, calculated over the respective 3 min measurement interval. No pronounced monotonic baseline change was apparent within these individual short-duration records. However, these measurements are insufficient to assess long-term drift or stability. The higher mean transmission observed at 30 % than at 20 % rH represents a deviation from the otherwise decreasing trend. Possible contributions include sequence-dependent coupling or baseline variations, but the available measurements do not permit a definitive attribution.
Because the relative humidity was increased monotonically, a time-dependent drift of the measurement setup cannot be distinguished from the humidity-induced response based on the present data.
The short taper exhibited a measurable humidity response and showed slightly improved handling during capillary-insertion trials compared with longer tapers. However, it remained mechanically fragile and susceptible to damage under torsional or bending loads, underscoring the need for more practical alternatives such as laser-cut fibers for future integration. Overall, the response should be interpreted qualitatively. Quantitative calibration would require controlled and repeated rH sequences, characterization of temperature cross-sensitivity, and defined droplet-generation conditions.
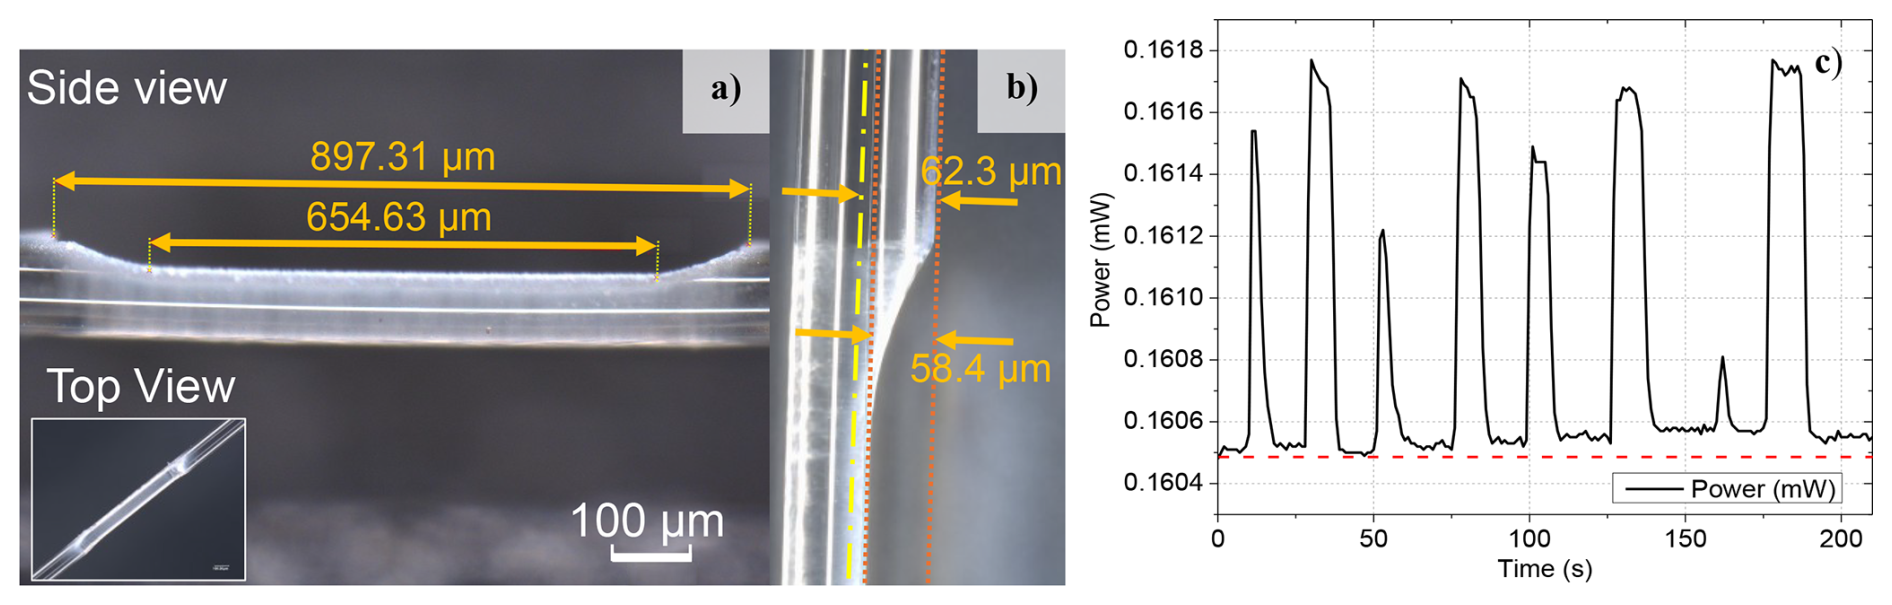
Figure 12LF06 laser-cut fiber-optic rH sensor: (a) side view with laser-cut length dimensions, (b) measured cut depth and geometric distance to the fiber center, and (c) transmitted optical power exhibiting stepwise temporal changes due to water droplets applied by a piezo vaporizer, highlighting the localized interaction region and corresponding optical response. The dashed red line indicates the baseline power, P0.
2.6 Fabrication and sensitivity analysis of laser-cut optical fibers
To improve practical handling relative to the investigated tapered fibers, a laser-cut fiber geometry was developed. Instead of sharp-edged grooves, which increase fracture risk, a D-shaped cut was introduced to provide a smooth transition and to reduce stress concentration (Fig. 12). The fabricated structure features a taper-down transition length of approximately 157 µm. The measured cut depth was approximately 58.4 µm. Relative to the nominal fiber radius of 62.5 µm, this leaves the machined surface approximately 4.1 µm from the fiber axis, corresponding approximately to the core–cladding boundary. The value of approximately 62.3 µm shown in Fig. 12b represents the geometric distance to the fiber center rather than a second measured cut depth. Considering the mode-field diameter of 10.4 ± 0.5 µm at 1550 nm, the optical mode extends to and interacts with the machined surface. This proximity provides a plausible explanation for both the high insertion loss and the measurable humidity response of LF06.
Dynamic droplet tests with the vaporizer setup revealed a stepwise response in transmitted power, with clear peaks corresponding to individual droplet events. The signal ranged from 0.1604 to 0.1618 mW, yielding a relative change of approximately 0.8 %–0.9 % for the representative peak shown in Fig. 12c (ΔP ≈ 1.2–1.4 µW). Table 2 reports a baseline power of 0.1605 mW and a mean event extremum of 0.1617 mW for LF06. The corresponding mean power change is +0.0012 mW or a normalized mean response of +0.7 %, distinct from the representative individual peak amplitude. At the nominal launched power of 2 mW, this baseline corresponds to a processing-induced insertion loss of 92.0 %. The different baseline observed for the packaged specimen in Fig. 15 is discussed in the Discussion section. The smaller power changes compared with the tapered fibers are consistent with the more localized light–water interaction region of the laser-cut geometry. In tapered fibers, water can interact with the optical field around the entire waist circumference and over an extended length. In addition, water contact can perturb or strip transition-excited higher-order modes, leading to larger transmission changes than those observed in the localized laser-cut geometry.
Distinct signal changes recurred during the investigated droplet-exposure sequence. However, the baseline variation visible in Fig. 12c prevents a quantitative assessment of repeatability or drift-free operation. Possible contributions include residual moisture, coupling variations, and changes in local droplet conditions, which cannot be separated based on the present measurements. The presence of water was associated with an increase in transmitted optical power. A possible explanation is reduced scattering at the laser-processed region or modified mode confinement caused by the local refractive-index change. However, the present experiments do not establish the underlying physical mechanism. A similar positive signal response was observed for the tapered fibers with larger waist diameters of 25–30 µm.
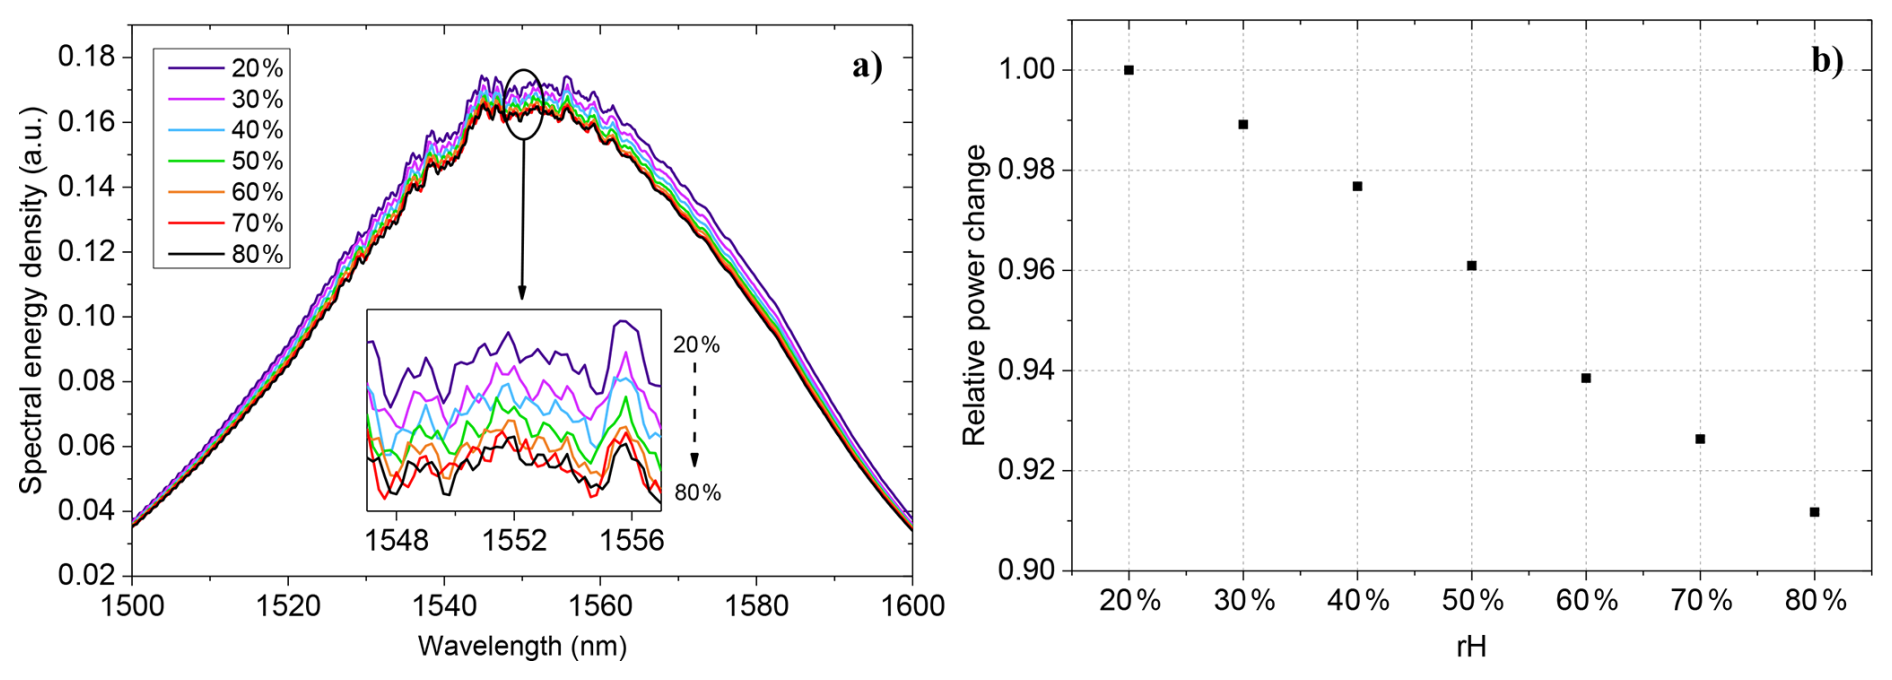
Figure 13Climate-chamber measurement of the separate laser-cut specimen LF-CC using a 50/50 fiber splitter for simultaneous acquisition. (a) Detected spectral power recorded with the optical spectrum analyzer at different rH levels (20 %–80 % rH). The spectra were not normalized to a reference spectrum. (b) Power-meter signal normalized to the value measured at 20 % rH, which serves as the reference condition. Error bars represent ±1 standard deviation (±1σ), calculated from the respective 3 min measurement interval, and are obscured by the markers because of their small magnitude.
Humidity sensitivity was further evaluated in a climate chamber (Vötsch VC3-4018) under controlled rH steps from 20 % to 80 %. The laser-cut specimen used for this climate-chamber measurement is designated LF-CC in the following. LF-CC was a separate laser-cut specimen; it was not the LF06 specimen used for the droplet measurement in Fig. 12 and Table 2. During the climate-chamber test, the sensor output was connected to a 50/50 fiber splitter to enable simultaneous acquisition with the Thorlabs power meter and the Anritsu optical spectrum analyzer. Figure 13a shows the detected output spectra recorded at rH levels of between 20 % and 80 % rH. The spectra follow the broadband emission profile of the SLD, with their maximum approximately between 1540 and 1560 nm. Because the spectra were not normalized to a reference spectrum, they should not be interpreted as absolute transmission spectra. Within the resolution of the present measurements, no pronounced wavelength-dependent features, such as absorption bands or resonance shifts, were resolved. The observed differences therefore primarily represent changes in the detected broadband optical intensity. Contributions from source-power variation, coupling changes, scattering, refractive-index effects, and modal redistribution cannot be distinguished using the present configuration.
The normalized power-meter signal of LF-CC shown in Fig. 13b decreased approximately monotonically from 1.00 at 20 % rH to approximately 0.91 at 80 % rH. This corresponds to a relative decrease of approximately 9 % over the full investigated range and a mean normalized sensitivity of approximately 0.15 % per % rH. The measurement was performed after the 50/50 splitter, whereas the baseline value of 0.1605 mW reported for LF06 in Table 2 was measured without the splitter and with a different measurement configuration. The absolute detected power levels of LF-CC and LF06 are therefore not directly comparable. In addition to the nominal splitter loss, configuration-specific effects from adapters, connectors, coupling conditions, fiber alignment or bending, and the climate-chamber feedthrough may have influenced the detected power. These individual contributions were not quantified separately. Figure 13a shows the simultaneously acquired spectral data recorded with the optical spectrum analyzer. For TF1-10, the monotonic response range begins at 30 % rH because the value at 20 % rH deviated from the otherwise decreasing trend. Between 30 % and 80 % rH, TF1-10 showed a relative signal decrease of approximately 16 %, corresponding to a mean normalized sensitivity of approximately 0.32 % per % rH relative to the 30 % rH value. Thus, the two headline values describe different humidity ranges and should not be interpreted as a same-range comparison. When both fibers are compared over the common full range from 20 % to 80 % rH, TF1-10 shows a decrease of approximately 14 % and a mean normalized sensitivity of approximately 0.23 % per % rH, whereas LF-CC shows approximately 9 % and 0.15 % per % rH. Within the applied climate-chamber measurement configuration, LF-CC produced a higher detected output power than the ultrashort tapered fiber while retaining a measurable, approximately monotonic humidity response. This trade-off reflects the design objective of retaining a usable optical signal and improved practical handling. However, systematic cyclic measurements involving repeated increases and decreases in humidity were not performed. Therefore, repeatability and hysteresis cannot yet be quantitatively assessed. Moreover, because the relative humidity was increased monotonically during the measurement, a time-dependent drift of the setup would produce a similar trend and cannot be separated from the humidity-induced response with the present data.
For a direct comparison of both fibers over the same range from 20 % to 80 % rH, the mean transmitted powers for TF1-10 were approximately 0.0339 and 0.0293 mW, respectively. Normalization to the initial value at 20 % rH yields a relative decrease of approximately 14 %, as shown in Fig. 11b, and a mean normalized sensitivity of approximately 0.23 % per % rH.
LF-CC is not the LF06 specimen reported in Fig. 12 and Table 2. Both specimens were fabricated using the same manufacturing procedure and nominal dimensions (0.6 mm modified-section length and approximately 58 µm cut depth); exact dimensional deviations between specimens were not investigated. LF06 was measured without the splitter, whereas LF-CC was measured after the 50/50 splitter. Absolute power levels should not be compared directly because the specimens and optical configurations differ.
The presented measurements constitute proof-of-concept validation rather than calibrated metrological characterization. They demonstrate sensitivity to humidity and droplet exposure but do not establish quantitative repeatability, hysteresis, long-term drift, measurement uncertainty, or calibration accuracy under fuel cell operating conditions.
2.7 Fabrication of smart bipolar plate and preparation of silica capillaries
For the LPBF process, representative parameters included a layer thickness of 50 µm, a laser power of 275 W, a scan speed of 700 mm s−1, and a hatch distance of 0.12 mm, corresponding to a volumetric energy density of ≈ 65 J mm−3. These parameters were selected to support the fabrication of dense, thin-walled SBP structures; however, quantitative density measurements were outside the scope of the present study. In addition to these parameters, additional process strategies were considered for manufacturing the sensor-integration features of the SBP. These include the use of a chessboard scanning strategy to reduce residual stresses, vertical build orientation to minimize warping, controlled build interruptions for fiber or capillary embedding, and the inclusion of machining allowances in critical regions to support precise fuel-cell-relevant dimensions and surface quality.
To support the integration of humidity-sensitive laser-cut fibers into future PEM fuel cell configurations, a dedicated packaging and integration concept based on smaller fused-silica capillaries for the humidity fiber, embedded in the metallic capillaries in the SBP structures, was developed. The polyimide-coated silica capillary (ID 250 µm, OD 360 µm) acts as a mechanical buffer, reducing handling-induced loads on the fiber and facilitating insertion into dedicated channels within the plate geometry (Fig. 14). The smart bipolar plate design incorporates predefined metallic capillary channels that are fully embedded during the LPBF process and thus compatible with the LPBF process environment. The metallic channels serve as protective guides and interfaces between the additively manufactured structure and the silica-based sensor packaging. In the present study, neither an optical fiber nor a packaged humidity-sensor assembly was inserted during the LPBF process. The packaged laser-cut fibers were prepared and characterized separately, and are intended for post-process insertion into the metallic channels. Consequently, the packaged sensor was not exposed to LPBF-related thermal loads, and its optical transmission after such exposure was not assessed. In-process integration during an interrupted and resumed LPBF build remains subject to future thermal and optical validation.
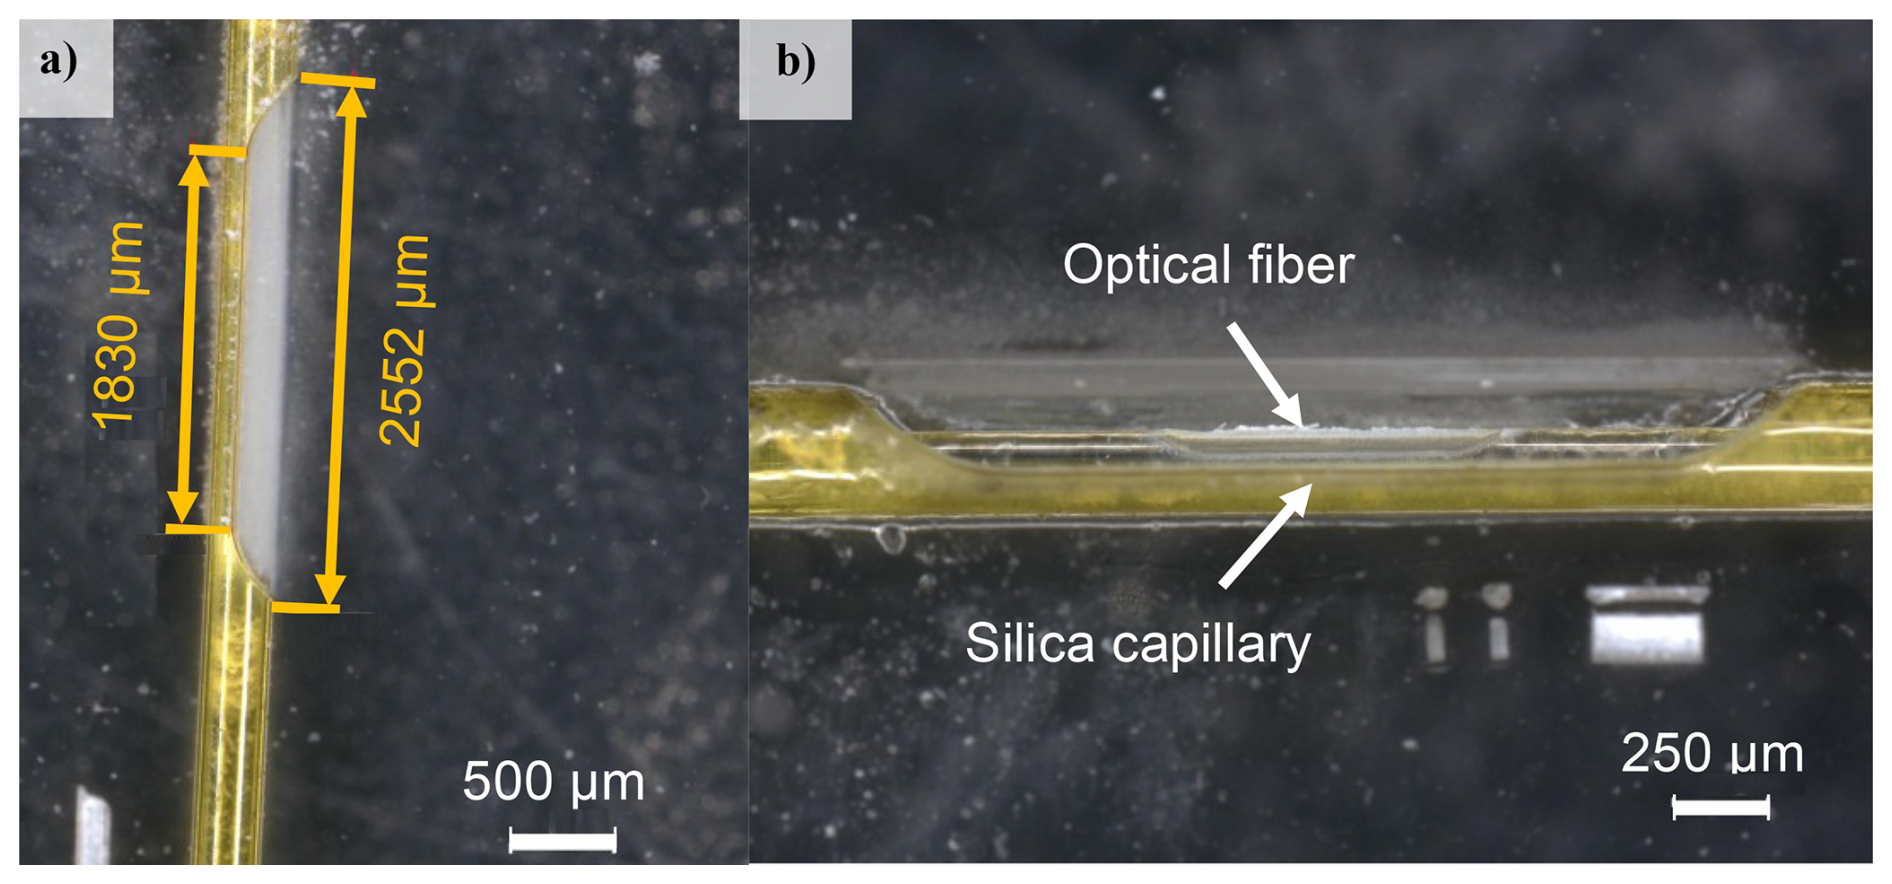
Figure 14Packaging concept showing (a) a laser-cut opening in a polyimide-coated fused-silica capillary and (b) a laser-cut fiber embedded in the capillary.
The packaging preparation process includes (i) cutting the silica capillary, (ii) inserting the fiber, (iii) fixing it with UV-curable adhesive near the sensitive region, and (iv) performing femtosecond laser cutting to create the D-shaped sensing zone. This fixation prevents fiber displacement during machining and reduces the risk of breakage. The capillary opening is designed to expose the laser-cut region to the flow field while maintaining structural integrity.
Laser-cut humidity fibers were embedded in a silica capillary to improve handling and protect the fiber during the investigated vapor-exposure tests. The capillary geometry may have influenced the optical response during the vaporization cycles shown in Fig. 15. However, water accumulation within the capillary was not directly observed or quantified, and its contribution to the measured response therefore remains speculative.
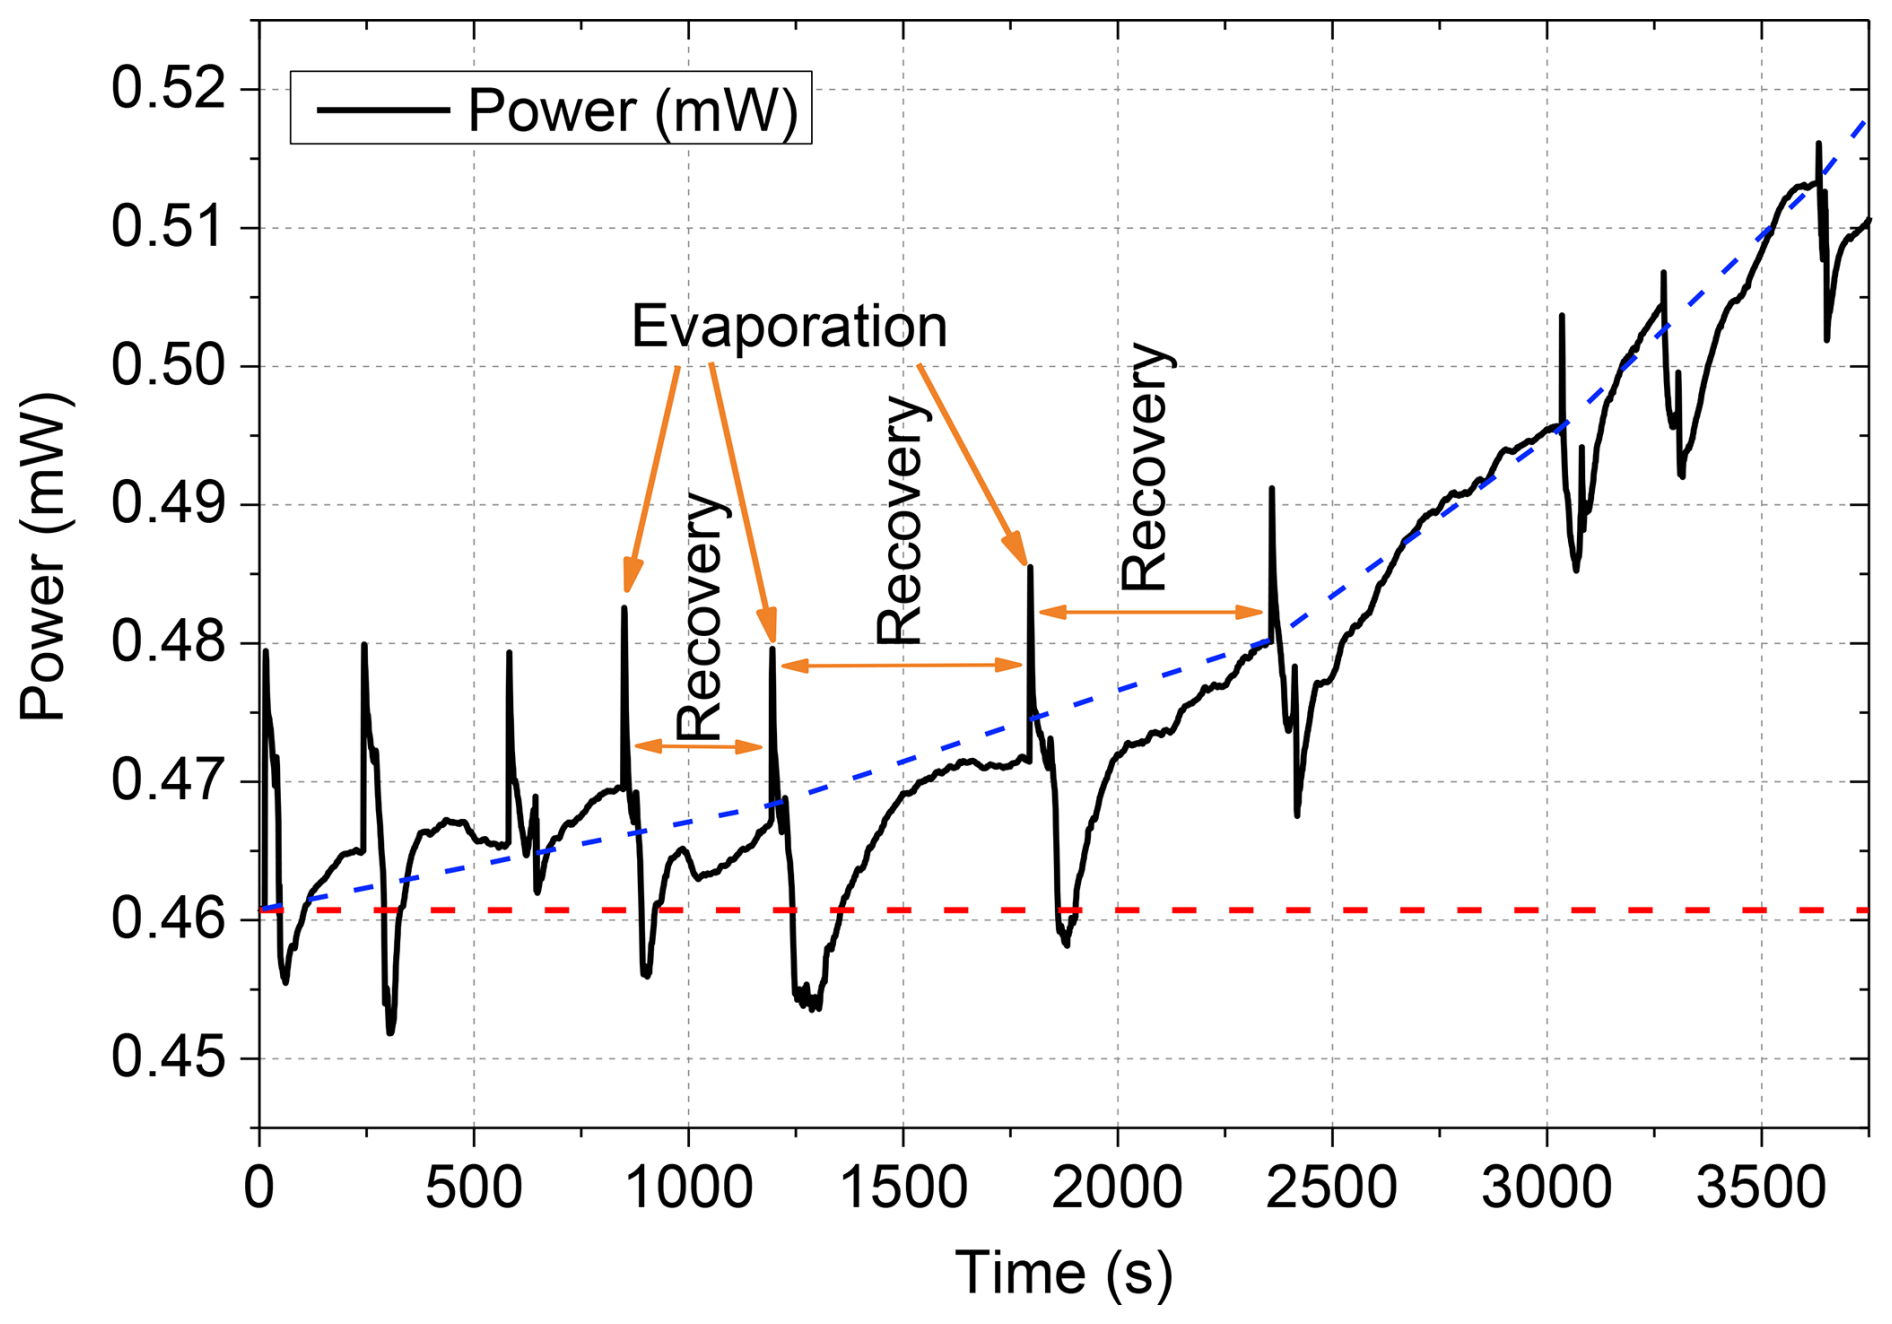
Figure 15Transmitted optical power through the packaged LF-CC specimen embedded in a silica capillary, exhibiting stepwise changes over time due to water droplets applied by a piezo vaporizer. The dashed red line indicates the baseline power, P0. The dashed blue line indicates the manually drawn baseline trend.
The baseline transmission started at approximately 0.455 mW and increased stepwise to approximately 0.515 mW over approximately 1 h, corresponding to an overall increase of approximately 13 %. This baseline increase is several times larger than the individual droplet-induced events of approximately 2 %–4 % in Fig. 15 and also exceeds the approximately 9 % humidity response of the bare laser-cut fiber between 20 % and 80 % rH. In the present packaged configuration, the observed baseline drift complicates the reliable interpretation of smaller droplet-induced signal changes, particularly over longer observation periods. A quantitative detection limit was not determined. The initial baseline power was approximately 2.8 times that reported for LF06 in Table 2 and Fig. 12, although both measurements used a nominal launched optical power of 2 mW. However, the available experimental records do not establish whether the packaged specimen in Fig. 15 was the same physical fiber as LF06. In addition, the measurements were performed in different configurations, with the Fig. 15 specimen mounted and fixed in a silica capillary. The baseline difference therefore cannot be attributed unambiguously to the packaging itself and may reflect specimen-to-specimen variation, coupling and connector conditions, fiber alignment or bending, and other configuration-specific optical losses. Consequently, the absolute baseline values in Figs. 12 and 15 should not be interpreted as a controlled before-and-after packaging comparison. The Fig. 15 record contained 11 visually identifiable peaks with apparent signal-rise durations of < 5 s and slower decay durations of approximately 10–20 s, forming a staircase-like pattern. These approximate times describe the observed droplet-associated events under the applied delivery and evaporation conditions; they were not evaluated using a defined 10 %–90 % criterion and do not establish intrinsic sensor response or recovery times. Within the investigated measurement sequence, the signal did not return to its initial baseline, indicating incomplete recovery over the observation period.
A possible explanation is the formation of residual water films within the capillary, which could reduce scattering losses or locally modify the effective refractive index. However, this interpretation remains speculative and requires further systematic investigation to conclusively identify the underlying mechanism. The observations are consistent with a possible influence of capillary packaging on the measured response during droplet exposure but do not establish such an influence because no controlled before-and-after comparison of the same physical sensor was available.
Despite their high sensitivity to humidity and water droplets, the tapered fibers were fragile during the investigated handling and capillary-insertion trials. The laser-cut fibers likewise confined the sensitive region to below 1 mm but retained the unmodified portion of the fiber cross-section. Within the investigated fabrication and handling procedures, the laser-cut fiber combined with silica-capillary packaging showed improved handling and protection against accidental breakage. The capillary geometry may have influenced water retention and the resulting optical response; however, water retention was not directly observed or quantified, and its contribution to the measured response could not be isolated. Among the configurations investigated in this proof-of-concept study, this approach provided a promising compromise between relative humidity response, usable optical signal level, and prospective integration capability. However, its long-term mechanical durability and performance under fuel cell operating conditions were not established.
As discussed in Sect. 2.5, the strong response of tapered fibers cannot be explained solely by a large evanescent fraction of the fundamental mode. For a taper drawn from SMF-28, the core diameter scales approximately with the taper ratio; for example, an initial core diameter of 8.2 µm is reduced to approximately 1 µm at a 15 µm waist. Conventional core guidance is therefore lost, and the light is instead guided by the glass–air interface of the silica waist. Because the taper transitions were not necessarily adiabatic, part of the launched fundamental core mode may have been coupled into higher-order modes of the silica waist. For a 15–20 µm silica waist at 1550 nm, the fundamental rod mode is expected to remain predominantly confined within the glass, with only a small fraction of its power outside the silica. The mean droplet-induced transmission decreases of up to 47.2 % reported in Table 2 for TF10-15 are therefore unlikely to originate solely from the evanescent fraction of the fundamental mode; individual event amplitudes may differ from this mean. Instead, they are consistent with the stripping of higher-order modes when their effective refractive indices fall below the refractive index of water, combined with the absorption by liquid water in the 1.5 µm wavelength range. When a droplet contacts the taper, the surrounding refractive index changes locally from air (n ≈ 1.0) to water (n ≈ 1.32 at 1550 nm), so susceptible higher-order modes are no longer confined in the contact region and couple to radiation modes, while the evanescent tails of the remaining modes additionally experience liquid-water absorption. These altered modal coupling conditions can produce pronounced negative transmission dips (Buchberger et al., 2020; Corres et al., 2007; Leung et al., 2006). Depending on the fiber geometry and local modal distribution, the same refractive-index change can also produce increased transmission through modified coupling and interference conditions. The modal content depends sensitively on the geometry and adiabaticity of the down- and up-taper transitions. Variations in these transitions between individual specimens therefore provide a consistent explanation for the pronounced specimen-to-specimen differences in baseline transmission and droplet response observed in Sect. 2.5. The signal events recurred during the investigated droplet sequences, but quantitative repeatability was not established. Residual water films may additionally produce persistent baseline changes.
For larger waists (25–30 µm), a smaller fraction of the guided power is expected to interact with the surrounding medium, which may reduce droplet-induced attenuation. However, reduced attenuation alone does not explain transmission above the initial baseline. TF10-25 and TF10-30 exhibited positive mean responses of +15.5 % and +5.2 %, respectively (Table 2; Fig. 7c and d). Possible contributions include changes in modal coupling, interference, or scattering conditions, but the present measurements do not establish the mechanism responsible for these positive excursions.
Overall, thin-waist fibers produced comparatively large signal changes but were fragile and exhibited high optical losses, which limited their practical handling and prospective integration capability. Thicker waists and shorter lengths provided a practical trade-off between signal response, optical throughput, and handling during preparation and capillary-insertion trials. These observations do not establish completed integration into the SBP, and mechanical durability was not quantitatively assessed. The investigated specimens exhibited different optical responses that are consistent with a possible contribution from fiber geometry; however, geometry-related effects cannot be separated from specimen-to-specimen variation.
Laser-cut fibers exhibited droplet-associated signal variations on a few-second timescale. These observed event durations include exposure and evaporation effects, and do not establish intrinsic sensor response times. Signal recovery was observed for individual events but was not systematically quantified. Over the common full comparison range from 20 % rH to 80 % rH, TF1-10 showed an approximately 14 % decrease and a mean normalized sensitivity of approximately 0.23 % per % rH, compared with approximately 9 % and 0.15 % per % rH for the laser-cut fiber. However, only the responses within the investigated step sequences were assessed, and systematic cyclic measurements involving repeated increases and decreases in humidity were not conducted. Consequently, a quantitative assessment of repeatability and hysteresis cannot yet be provided. A gradual baseline variation was observed in some measurements (e.g., Fig. 15), indicating that baseline drift effects cannot yet be excluded and require systematic investigation in future work. Therefore, the present study establishes proof-of-concept sensitivity to humidity and droplet events but does not establish long-term drift behavior, calibration stability, or metrological reproducibility under fuel cell operating conditions.
Potential hysteresis may arise from adsorption and desorption dynamics at the fiber surface and, particularly for the packaged configuration, from water retention within the silica capillary. Dedicated cyclic humidity tests under fuel-cell-relevant operating conditions are required to evaluate reversibility, hysteresis, and long-term stability. The observed positive power shift during droplet exposure may result from reduced scattering at the laser-cut region or from locally modified mode confinement caused by refractive-index matching. However, the present measurements do not allow the underlying mechanism to be conclusively identified. The absence of distinct wavelength shifts or resonance features suggests that the measured response was primarily associated with broadband intensity changes. However, contributions from modal redistribution cannot be excluded based on the present measurements.
Under the climate-chamber measurement configuration, the separate laser-cut specimen LF-CC exhibited a higher detected output power than the ultrashort tapered fiber. LF-CC was measured through a 50/50 splitter for simultaneous power-meter and optical-spectrum-analyzer acquisition and was not the LF06 specimen characterized without the splitter in Fig. 12 and Table 2. Because the measurements involved different specimens and configuration-specific losses, the absolute detected power values should not be interpreted as directly traceable processing-induced insertion losses or used for a direct comparison with LF06. In addition to the splitter loss, adapters, connectors, coupling conditions, fiber alignment or bending, the climate-chamber feedthrough may have affected the detected power, but their individual contributions were not quantified.
The droplet-exposure measurements on LF06 and the climate-chamber measurements on LF-CC represent complementary proof-of-concept tests of the same nominal laser-cut design, not a combined characterization of one physical sensor. Although the nominal dimensions and manufacturing procedure were the same, exact dimensional deviations were not investigated. Specimen-dependent optical losses therefore cannot be separated from configuration-dependent losses in explaining the different absolute detected power levels. Furthermore, the tests differed in temperature and exposure conditions: transient droplet exposure under laboratory ambient conditions versus stepped relative humidity at 70 °C. Consequently, their response amplitudes and signs cannot be interpreted as directly comparable intrinsic sensor characteristics. Normalization removes a constant multiplicative power factor but does not establish equivalence of the specimens or exposure conditions. The climate-chamber results do not constitute a calibration of LF06, and the opposite response signs do not establish discrimination between droplets and relative humidity. Comparisons with the packaged specimen in Fig. 15 likewise concern observed signal magnitudes, not a controlled comparison of one sensor before-and-after packaging. Quantitative assessment of specimen-to-specimen reproducibility would require matched measurements and the characterization of actual dimensional variations.
Practical integration requires packaging concepts that reduce the risk of fiber breakage during assembly and operation. Adhesive fixation of the optical fiber within the silica capillary supported precise positioning and reduced the risk of fiber displacement during the investigated fabrication and handling procedures. In addition, the integration of optical humidity sensors introduces specific constraints for the LPBF process. Process parameters and scanning strategies must support the precise fabrication of capillary channels and accurate sensor placement within the flow field while targeting the gas tightness required for fuel cell operation. However, quantitative density and leak-rate measurements were not performed within the scope of the present study.
From a sensing perspective, distinguishing transient droplet-induced peaks from cumulative humidity trends is critical for reliable interpretation. Although the present measurements are primarily qualitative, the observed baseline drift may be influenced by moisture accumulation, but the present measurements do not allow this contribution to be separated from other drift sources. Future work should address thermal and mechanical stresses during FC operation, validate sensor performance under dynamic load cycles, and explore advanced packaging strategies for multi-sensor integration.
The present study focuses on proof-of-concept validation rather than fully calibrated metrological characterization. During the 3 min climate-chamber measurement intervals, the short-term signal fluctuations of TF1-10 were approximately ± 0.4–0.6 µW, corresponding to 1 standard deviation (1σ). Relative to its mean sensitivity of approximately 0.11 µW % rH−1 between 30 % and 80 % rH, this corresponds to an indicative equivalent humidity resolution of approximately 3.6 %–5.5 % rH (1σ). The laser-cut climate-chamber results in Fig. 13b refer to LF-CC, not LF06. Their ± 1σ error bars describe short-term variability within the respective 3 min measurement intervals and do not establish specimen-to-specimen reproducibility. An equivalent humidity resolution is not reported for LF-CC because the available data do not support a separate quantitative resolution estimate. The TF1-10 value of 3.6 %–5.5 % rH (1σ) describes short-term signal variability converted to humidity units using the observed mean sensitivity. It is not directly comparable with the specified uncertainty of the chamber humidity reference (± 1 %–3 % rH), because a common statistical basis has not been established. It should therefore be interpreted only as an indicative equivalent humidity resolution, not as a traceable measurement uncertainty or a validated detection limit. Furthermore, the experiments do not establish long-term stability or drift-free operation. A comprehensive uncertainty analysis – including repeatability, hysteresis, temperature cross-sensitivity, calibration uncertainty, and long-term drift – remains subject to future work.
Table 3Comparison of the sensors investigated in this work with selected fiber-optic humidity sensors from the literature, including sensor structure, coating, humidity and droplet responses, response dynamics, and fuel cell integration status. Reported sensitivities and response times are not directly comparable because measurement principles, test conditions, and evaluation methods differ.
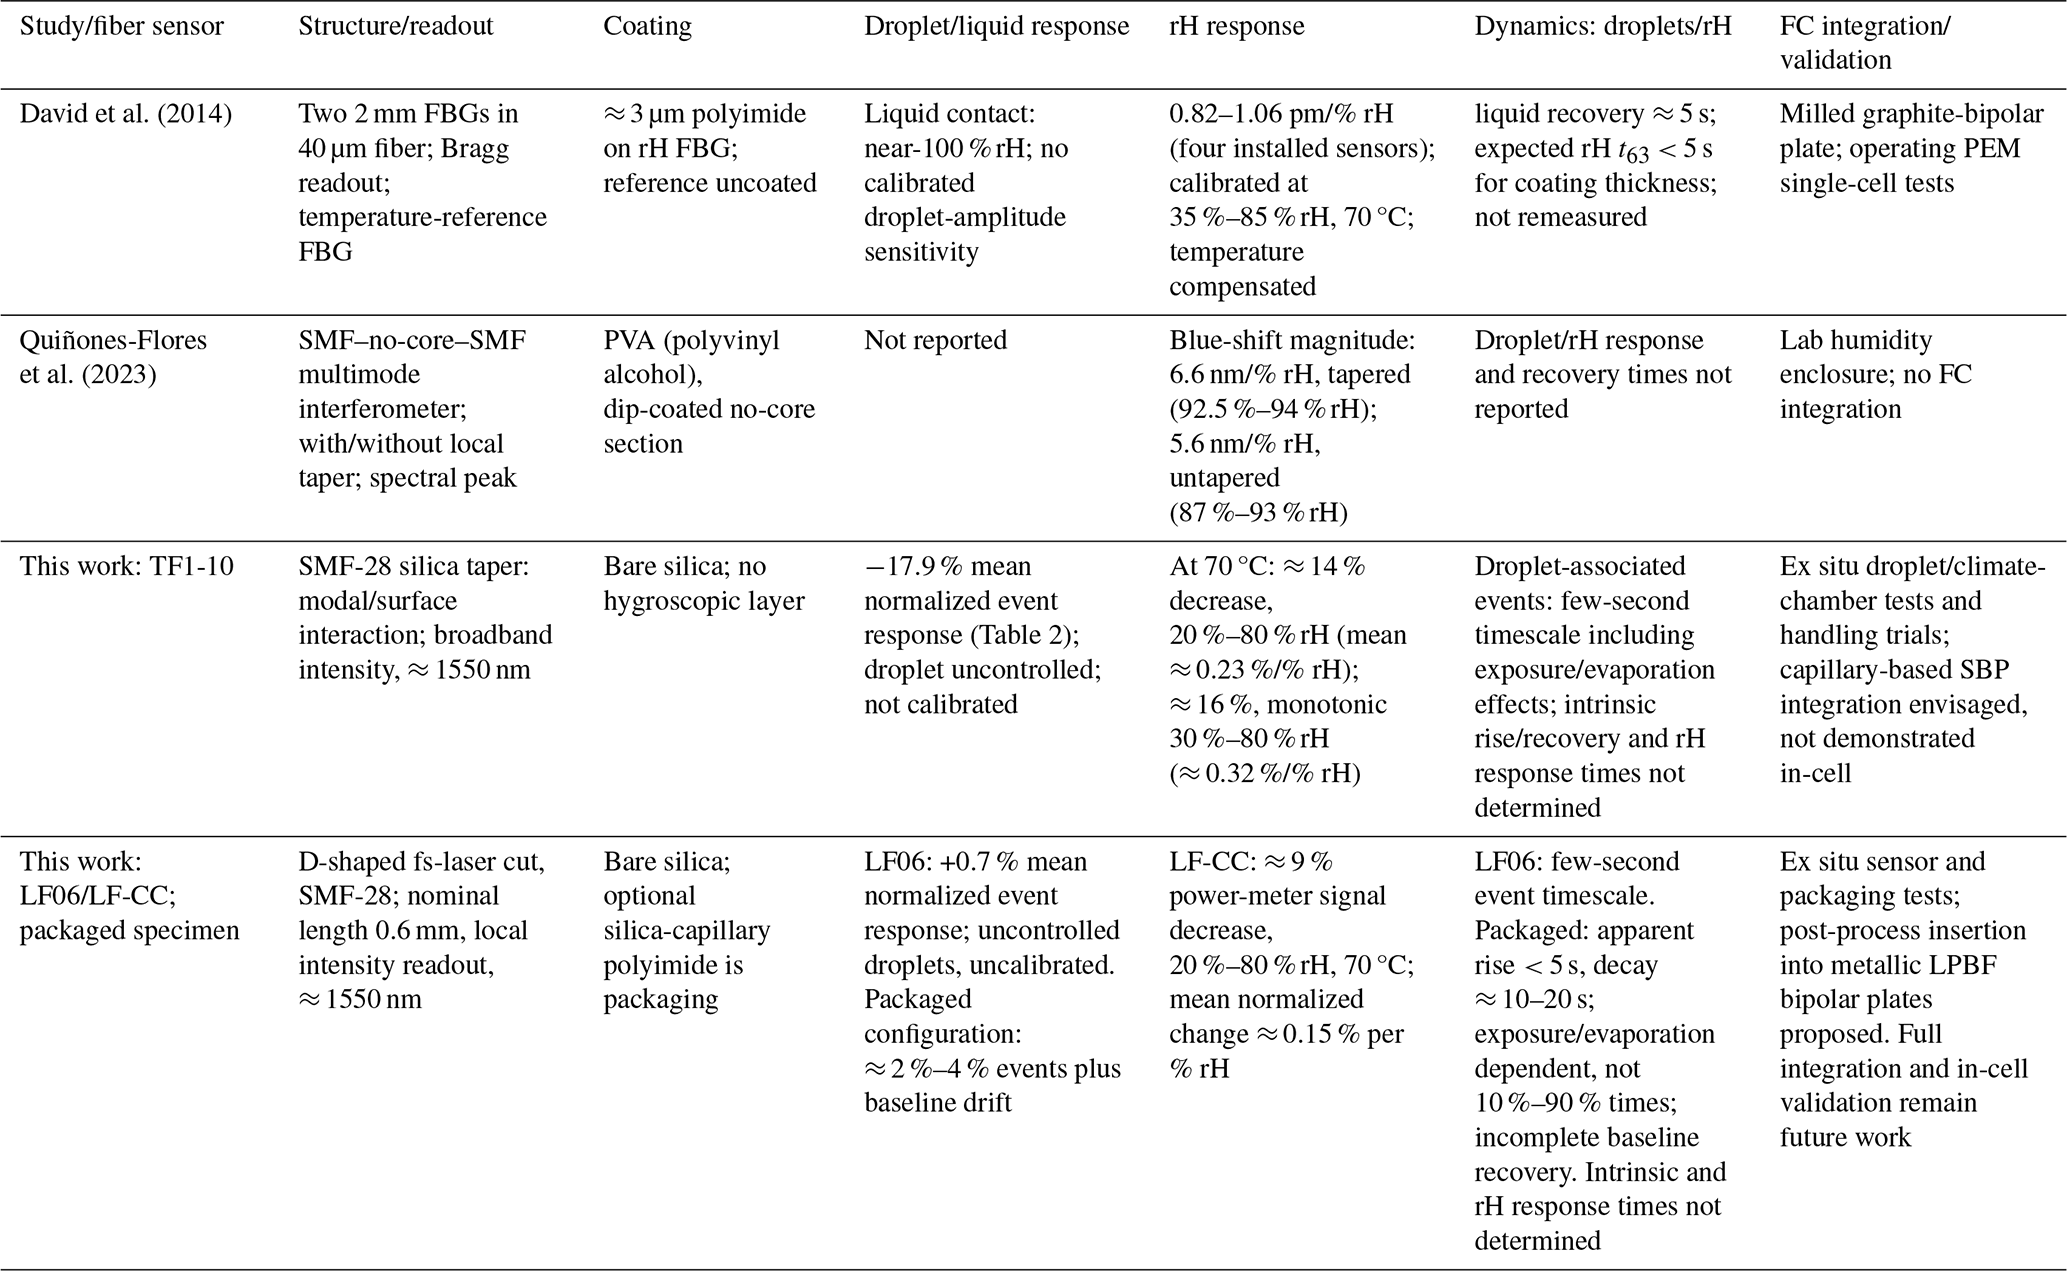
Sensitivities retain the units and measurement ranges reported in the respective studies and are not directly rankable across interrogation methods. Response-time definitions and excitation conditions differ. “Not reported” denotes the absence of a quantitative value in the cited article, not inability to measure the quantity. For this work, rH values are descriptive responses from a monotonically increasing sequence, not validated calibration coefficients; time-dependent drift could not be separated from the rH response. A comparison with selected fiber-optic humidity sensors from the literature is provided in Table 3.
The comparison highlights the fact that fiber-optic humidity sensing using coated gratings, tapered fibers, and intensity- or wavelength-based interrogation is well established. The contribution of the present work is therefore not a new sensing principle or a demonstrated improvement in humidity sensitivity. Rather, it lies in the investigation of uncoated fiber geometries, particularly a localized D-shaped laser-cut region, together with silica-capillary packaging and an integration concept for additively manufactured bipolar plates. Unlike the in-cell measurements demonstrated by David et al. (2014), the present sensor characterization and packaging tests were performed ex situ; full integration and validation under fuel cell operating conditions remain future work. Nevertheless, the observed responses of the uncoated fibers to both relative humidity and liquid-water droplets, together with the proposed capillary-based integration concept for additively manufactured smart bipolar plates, provide a promising basis for further development toward in situ PEM fuel cell diagnostics.
This work demonstrates the proof-of-concept feasibility of humidity-sensitive optical fiber concepts intended for integration into additively manufactured smart bipolar plates for PEM fuel cell applications. Two fiber concepts were investigated: tapered and laser-cut fibers. Over the common full comparison range from 20 % to 80 % rH, TF1-10 showed an approximately 14 % decrease (≈ 0.23 % per % rH), whereas the normalized power-meter signal of the laser-cut fiber exhibited a monotonic decrease of approximately 9 % (≈ 0.15 % per % rH). The tapered fiber nevertheless remained mechanically fragile during handling. Within the applied climate-chamber measurement configuration, the laser-cut fiber provided a higher usable detector signal and improved handling during the investigated fabrication and packaging procedures. The observed responses establish sensitivity to humidity and droplet exposure, but quantitative condensation detection and long-term moisture-accumulation monitoring were not established. Long-term reproducibility, hysteresis, and drift characteristics remain subjects for future investigation.
The bipolar plate was fabricated, and sensor characterization and silica-capillary packaging were investigated ex situ. Post-process insertion of the packaged humidity sensor into the metallic plate channels and full in situ validation within the bipolar plate gas-stream environment remain future work. Successful implementation would require the preservation of fiber integrity and sensing functionality after embedding, as well as verification that the additively manufactured bipolar plate meets the applicable gas-tightness requirements. Furthermore, sensor calibration under combined rH and temperature conditions is essential to minimize cross-sensitivity to thermal and mechanical effects.
Future research directions are the following:
-
Functionalization of fiber surfaces, for example, using polymer coatings to enhance rH sensitivity while evaluating the resulting effects on handling, optical loss, response dynamics, and mechanical durability (Rivero et al., 2018).
-
Multiplexing strategies, such as wavelength-division multiplexing using fiber Bragg gratings, could enable multiple sensing points along a single fiber.
-
Simulation and microscopic analysis of droplet–fiber interactions to validate optical mechanisms.
-
Long-term stability tests under dynamic FC operating conditions, including vibration and thermal cycling.
-
Ascending and descending humidity sequences at fuel-cell-relevant temperatures with an unmodified reference fiber and monitored source power, in order to quantify hysteresis, drift, and temperature cross-sensitivity and to enable ratiometric signal evaluation.
-
Assessment of the long-term compatibility of uncoated silica with the fuel cell environment, including hydrogen-induced attenuation and stress corrosion of stripped fiber sections in liquid water at an elevated temperature.
Together, these findings establish a basis for the further development of integrated fiber-optic sensing systems for in situ PEM fuel cell diagnostics.
The data underlying this study are not publicly available because they contain project-related technical information generated within a collaborative industrial research framework. The processed data required to reproduce the figures and principal findings can be made available by the corresponding author upon reasonable request, subject to approval by the project partners and applicable confidentiality obligations.
MR provided implementation ideas for the SBP, conceptualized the study, developed the methodology, collected and analyzed the data, and prepared the original draft. MR, GA, CO, and IS contributed to the experimental design, performed the experiments, and acquired and interpreted the data in the research project. AB and CS provided academic supervision, guidance on scientific interpretation, and a critical review of the paper. AK provided the concept idea of the SBP, supervised the work from the industry perspective, supported resource allocation, and contributed to project coordination. All authors reviewed and approved the final article.
At least one of the (co-)authors is a member of the editorial board of Journal of Sensors and Sensor Systems. The peer-review process was guided by an independent editor, and the authors also have no other competing interests to declare.
Publisher's note: Copernicus Publications remains neutral with regard to jurisdictional claims made in the text, published maps, institutional affiliations, or any other geographical representation in this paper. The authors bear the ultimate responsibility for providing appropriate place names. Views expressed in the text are those of the authors and do not necessarily reflect the views of the publisher.
The authors gratefully acknowledge the joint support provided by industry partners and a research and technology organization (RTO) owned by the Republic of Austria, the Styrian Business Promotion Agency (SFG), the federal state of Carinthia, Upper Austrian Research (UAR), and the Austrian Association for the Electric and Electronics Industry (FEEI).
This work was funded by the Austrian Federal Ministry of Innovation, Mobility and Infrastructure and the Austrian Federal Ministry of Economy, Energy and Tourism and implemented by Austria Wirtschaftsservice (aws) and the Austrian Research Promotion Agency (FFG) within the Important Project of Common European Interest on Microelectronics and Communication Technologies (IPCEI ME/CT). Additional support was provided through FFG (project no. 899498) and contributions from industry partners and regional funding agencies, including SFG, UAR, and FEEI.
This paper was edited by Marco Jose da Silva and reviewed by two anonymous referees.
Ahmed, F., Forhad, M. S., and Porag, M. H.: Spectral Behavior of Fiber Bragg Gratings during Embedding in 3D-Printed Metal Tensile Coupons and Cyclic Loading, Sensors, 24, 3919, https://doi.org/10.3390/s24123919, 2024.
Barbir, F.: PEM Fuel Cells: Theory and Practice, 2nd edn., Academic Press, Oxford, ISBN 978-0-12-387710-9, 2012.
Belhadj, M., Aquino, A., Heng, J., Kmiotek, S., Raël, S., Bonnet, C., and Lapicque, F.: Current density distributions in polymer electrolyte fuel cells: A tool for characterisation of gas distribution in the cell and its state of health, Chem. Eng. Sci., 185, 18–25, https://doi.org/10.1016/j.ces.2018.03.055, 2018.
Buchberger, A., Maierhofer, P., Baumgart, M., Kraft, J., and Bergmann, A.: Integrated evanescent field detector for ultrafine particles – theory and concept, Opt. Express, 28, 20177–20190, https://doi.org/10.1364/OE.394396, 2020.
Chen, N., Liu, C., Chen, L., and Yang, L.: Femtosecond laser-inscribed fiber-optic sensor for simultaneous temperature and relative humidity measurements, Opt. Laser Technol., 164, 109463, https://doi.org/10.1016/j.optlastec.2023.109463, 2023.
Corres, J. M., Arregui, F. J., and Matías, I. R.: Sensitivity optimization of tapered optical fiber humidity sensors by means of tuning the thickness of nanostructured sensitive coatings, Sens. Actuators B Chem., 122, 442–449, https://doi.org/10.1016/j.snb.2006.06.008, 2007.
David, N., Von Schilling, K., Wild, P. M., and Djilali, N.: In situ measurement of relative humidity in a PEM fuel cell using fibre Bragg grating sensors, Int. J. Hydrogen Energy, 39, 17638–17644, https://doi.org/10.1016/j.ijhydene.2014.08.010, 2014.
Fink, C., Goessling, S., Karpenko-Jereb, L., and Urthaler, P.: CFD Simulation of an Industrial PEM Fuel Cell with Local Degradation Effects, Fuel Cells, 20, 431–452, https://doi.org/10.1002/fuce.201900197, 2020.
Hartbauer, N.: Additive Manufacturing-enabled Embedding of Optical Fibers for an Advanced Automotive Fuel Cell Measurement Device, Master's thesis, Graz University of Technology, Graz, Austria, https://online.tugraz.at/tug_online/pl/ui/$ctx;design=pl;lang=en;profile=STAFF/wbAbs.showThesis?pThesisNr=79225&pOrgNr=2256 (last access: 14 November 2026), 2023.
Hussain, S., Ghaffar, A., Mehdi, M., Urf Kumail Haider, M. S., Chen, G. Y., Chen, C., Hussain, B., Niusan, K., Qureshi, K. K., and Alam, Z.: Water waves detection by utilizing optical fiber surface microchannel sensor, Opt. Laser Technol., 188, 112918, https://doi.org/10.1016/j.optlastec.2025.112918, 2025.
Irshad, H. M. and Shahgaldi, S.: Comprehensive review of bipolar plates for proton exchange membrane fuel cells with a focus on materials, processing methods and characteristics, Int. J. Hydrogen Energy, 111, 462–487, https://doi.org/10.1016/j.ijhydene.2025.02.300, 2025.
Kang, J., Zhong, T., Bai, F., Wang, B., Bao, Z., Du, Q., and Jiao, K.: Experimental study of voltage uniformity and stability of H2/O2 PEM fuel cell stack with dead-end anode and recirculation cathode, Sustain. Energy Technol. Assess., 72, 104052, https://doi.org/10.1016/j.seta.2024.104052, 2024.
Korposh, S., James, S. W., Lee, S.-W., and Tatam, R. P.: Tapered Optical Fibre Sensors: Current Trends and Future Perspectives, Sensors, 19, 2294, https://doi.org/10.3390/s19102294, 2019.
Leung, A., Rijal, K., Shankar, P. M., and Mutharasan, R.: Effects of geometry on transmission and sensing potential of tapered fiber sensors, Biosens. Bioelectron., 21, 2202–2209, https://doi.org/10.1016/j.bios.2005.11.022, 2006.
Lin, K., Qiao, J., Shi, K., Dong, W., and Gu, D.: Laser powder bed fusion of micro-channels for the application of proton exchange membrane fuel cell bipolar plates, CIRP J. Manuf. Sci. Technol., 43, 193–204, https://doi.org/10.1016/j.cirpj.2023.01.007, 2023.
Liu, X., Chen, J., Jin, L., and Liu, S.: Sensitivity analysis of current distribution to critical operating parameters for polymer electrolyte membrane fuel cells, J. Power Sources, 573, 233068, https://doi.org/10.1016/j.jpowsour.2023.233068, 2023.
Mitzel, J., Sanchez-Monreal, J., Garcia-Sanchez, D., Gazdzicki, P., Schulze, M., Häußler, F., Hunger, J., Schlumberger, G., Janicka, E., Mielniczek, M., and Gawel, L.: Fault Diagnostics in PEMFC Stacks by Evaluation of Local Performance and Cell Impedance Analysis, Fuel Cells, 20, 403–412, https://doi.org/10.1002/fuce.201900193, 2020.
Mo, S., Du, L., Huang, Z., Chen, J., Zhou, Y., Wu, P., Meng, L., Wang, N., Xing, L., Zhao, M., Yang, Y., Tang, J., Zou, Y., and Ye, S.: Recent Advances on PEM Fuel Cells: From Key Materials to Membrane Electrode Assembly, Electrochemical Energy Reviews, 6, 28, https://doi.org/10.1007/s41918-023-00190-w, 2023.
Muck, N., David, C., and Knöri, T.: Integrating Fiber Sensing for Spatially Resolved Temperature Measurement in Fuel Cells, Energies, 17, 16, https://doi.org/10.3390/en17010016, 2024.
Mühleisen, W., Consani, C., Smaliukas, P., Bainschab, M., Brunnhofer, G., and Tortschanoff, A.: Creation of a laboratory fog chamber for testing optical sensors, Eur. J. Eng. Sci. Technol., 7, 31–43, https://doi.org/10.33422/ejest.v7i2.1427, 2024.
Nabavi, S., Farshidianfar, A., and Dalir, H.: Comprehensive review: Advancements in modeling geometrical and mechanical characteristics of laser powder bed fusion process, Opt. Laser Technol., 180, 111480, https://doi.org/10.1016/j.optlastec.2024.111480, 2025.
Qasem, N. A. A.: A recent overview of proton exchange membrane fuel cells: Fundamentals, applications, and advances, Appl. Therm. Eng., 252, 123746, https://doi.org/10.1016/j.applthermaleng.2024.123746, 2024.
Quiñones-Flores, A. A., Guzman-Sepulveda, J. R., and Castillo-Guzman, A. A.: Relative Humidity Measurement Based on a Tapered, PVA-Coated Fiber Optics Multimode Interference Sensor, Optics, 4, 473–481, https://doi.org/10.3390/opt4030034, 2023.
Reiter, M.: Sensor embedding in additively manufactured metal components for innovative automotive instrumentation and test systems, Master's thesis, Graz University of Technology, Graz, Austria, https://repository.tugraz.at/publications/ae42w-gz697 (last access: 14 November 2026), 2021.
Reiter, M., Auböck, G., Bergmann, A., Sommitsch, C., Bodner, M., and Klug, A.: Measurement systems for in-situ monitoring of fuel cell systems using fiber optical sensors and colorimetric fluorescence technology, in: Proc. Sensor and Measurement Science International (SMSI 2025), AMA Service GmbH, https://doi.org/10.5162/SMSI2025/P32, 2025.
Rivero, P. J., Goicoechea, J., and Arregui, F. J.: Optical Fiber Sensors Based on Polymeric Sensitive Coatings, Polymers, 10, 280, https://doi.org/10.3390/polym10030280, 2018.
Shao, H., Qiu, D., Peng, L., Yi, P., and Lai, X.: In-situ measurement of temperature and humidity distribution in gas channels for commercial-size proton exchange membrane fuel cells, J. Power Sources, 412, 717–724, https://doi.org/10.1016/j.jpowsour.2018.12.008, 2019.
Toharias, B., Suárez, C., Iranzo, A., Salva, M., and Rosa, F.: Dataset and measurements from a current density sensor during experimental testing of dynamic load cycling for a parallel-serpentine design of a proton exchange membrane fuel cell, Data Brief, 54, 110392, https://doi.org/10.1016/j.dib.2024.110392, 2024.
Wang, H., Morando, S., Gaillard, A., and Hissel, D.: Sensor development and optimization for a proton exchange membrane fuel cell system in automotive applications, J. Power Sources, 487, 229415, https://doi.org/10.1016/j.jpowsour.2020.229415, 2021.
Wang, P., Zhao, H., Wang, X., Farrell, G., and Brambilla, G.: A Review of Multimode Interference in Tapered Optical Fibers and Related Applications, Sensors, 18, 858, https://doi.org/10.3390/s18030858, 2018.
Zhang, W., Lang, X., Liu, X., Li, G., Singh, R., Zhang, B., and Kumar, S.: Advances in Tapered Optical Fiber Sensor Structures: From Conventional to Novel and Emerging, Biosensors, 13, 644, https://doi.org/10.3390/bios13060644, 2023.