the Creative Commons Attribution 4.0 License.
the Creative Commons Attribution 4.0 License.
 | 23 Mar 2026
Active Q factor control of MEMS cantilevers by integrated piezoelectric transducers for high-speed AFM applications under vacuum
Michael Schneider
Ulrich Schmid
The first choice in science and industry to image surfaces down to the sub-nm range are scanning electron microscopy (SEM) and atomic force microscopy (AFM). Both techniques have specific disadvantages which can be compensated by the other method. Therefore, the implementation of AFM inside an SEM vacuum chamber provides the user with the best of both worlds. When operated under vacuum, AFM cantilevers have larger Q factors than in air and thus a lower scanning speed. In this work, an electrical circuit and a piezoelectrically driven micro-electromechanical system (MEMS) cantilever is developed to tune the Q factor of the cantilever using a feedback system, with the goal of replacing air damping. In doing so, it is demonstrated that AFM measurements in vacuum with scanning speeds as under ambient air pressure are feasible. The cantilever features an electrically driven integrated piezoelectric transducer, which is used to excite the oscillation while the piezoelectric current serves as a feedback signal for a closed-loop feedback approach. In vacuum, the Q factor is reduced by a factor of 4. Hence, the cantilever oscillation and step response show a damping behaviour equivalent to an operation in air.
- Article
(5916 KB) - Full-text XML
- BibTeX
- EndNote


In recent years, the demand for new material and surface analysis techniques has continuously increased. With the use of scanning electrode microscopy (SEM) or atomic force microscopy (AFM), tremendous images of surface structures well in the sub-nm range are provided (Heath et al., 2021; Hui et al., 2018; Khan et al., 2020; Tavakoli et al., 2018). SEM is used most commonly for analysis of both surface microstructure and chemical composition with imaging frame rates of approximately 10–50 fps. When an electron beam is used, however, topographic surface information has to be calculated by elaborate triangulation methods (Schubert et al., 1996). In contrast, an AFM offers highly accurate topographic information of the surface, which can be extracted by scanning a cantilever tip across the surface (Eaton and West, 2010). However, with the exception of modern high-speed AFM approaches, frame rates are in the range of <1 frame per minute and, hence, significantly lower. In addition, frame rates decrease with increasing field of view for AFM but remain constant for SEM. Overview images requesting a large field of view are therefore extremely time consuming when applying AFM compared to SEM.
In order to take advantage of both methods, AFM systems can be introduced into an SEM vacuum chamber like the AFSEM system from Quantum Design (formerly GETec) (Andany et al., 2020; Kreith et al., 2017). However, the lack of viscous fluidic damping for the oscillating AFM cantilever in vacuum results in an increased quality factor (Q) and thus a lower bandwidth (Fairbairn et al., 2011). The response time of the oscillation amplitude at surface steps is therefore prolonged, and consequently the measurement time increases (Qiu et al., 2016; Rodríguez and García, 2003; Sulchek et al., 2000). Without viscous damping, the Q factor of the cantilever is primarily determined by the geometric dimensions (i.e. anchor losses) and the material (i.e. internal losses, thermo-elastic losses) of the cantilever (Goeders et al., 2008). Therefore, straightforward measures for tailoring Q results either in the variation of cantilever dimensions or in the selection of specific cantilever materials (Hosseini et al., 2019; Naeli and Brand, 2009; Sandberg et al., 2005).
To regain the measurement speed of the AFM cantilever in vacuum known in air, the Q factor has to be reduced to lower the scan time. The time to reach steady state, which is linked to the ratio , where f0 is the resonance frequency of the cantilever beam, can be reduced by replacing conventional stiff micro-electromechanical system (MEMS) materials such as silicon or silicon nitride with softer alternatives like polymers (Adams et al., 2016). Also, the effect of an additional layer, which is deposited onto a standard cantilever, reduces the Q factor through enhanced internal losses (Fahrbach et al., 2021). The model for the change in the Q factor was developed here (Dufour et al., 2007). But, once the material combination and the cantilever dimensions are selected, an adaption of the Q factor during operation is not possible.
To overcome this issue and to provide real-time active tuning of the Q factor, an approach is reported where lock-in amplifiers and a modulation-demodulation controller are applied to manipulate an Si cantilever with an integrated aluminium nitride (AlN) actuator-sensor stack (Mahdavi et al., 2020). Through tuning the controller parameters, the Q factor of the first mode is reduced from 312 to 109. A further reduction from 276 down to 3, with a similar setup to a modulation-demodulation controller, was shown in Karvinen and Moheimani (2014). For demonstration purpose, a Brucker dimension micro-actuated silicon probe (DMASP) microcantilever with a positive position feedback controller (PPF) was used to reduce the Q factor. The same DMASP microcantilever is used in Fairbairn et al. (2011) to demonstrate experimentally the effectivity of a shunt impedance at the driving circuit of the cantilever. Through adjusting the resistor–capacitor (RC) filter and a voltage source, the Q factor is reduced from about 298 to 36, which is similar to the approach introduced before. In another study, by using a field programmable analogue array (FPAA) and a DMASP cantilever from Brugger, the Q factor is reduced from 185 to 50 (Fairbairn and Moheimani, 2012). To keep the imaging artifacts as low as possible, the Q factor is adjusted to 165 while the cantilever tip is off-sample. A setup consisting of a controller and a cantilever with three electrodes, where one serves as actuator and the other two as sensors, is reported in Coskun et al. (2019). Through the PPF controller in the feedback loop, the Q factor is reduced electronically from 177 down to 15. Another study also deals with a setup of three electrodes. It was shown that the Q factor was reduced from 390 to 30 (Mahmoodi Nasrabadi et al., 2022). A comparison of the latter studies indicates a decrease in Q factors by a factor ranging from 8 to 12 between a non-activated and activated feedback circuit for commercially available cantilevers. In contrast, for custom-made cantilevers, the Q factor reduction is only about a factor of 2.8. Damping of the oscillation by a polarization-induced current from the cantilever-integrated piezoelectric element decreases the signal-to-noise ratio but is limited by the sensitivity of the readout circuit (Miller et al., 2018, p. 20). It is crucial to manage all these factors to prevent instabilities.
In this study, the sensor and actuator approach, as shown in Ruppert and Moheimani (2013) and Kucera et al. (2013), and a feedback loop are used to evaluate the potential for manipulating the Q factor of MEMS cantilevers electronically for vacuum applications. The efficiency of Q factor reduction is demonstrated with a tailored piezoelectric transducer element integrated on a MEMS cantilever. The impact of the active damping approach on the Q factor and the frequency response of the cantilever is compared for different active feedback levels. Electrical as well as optical measurement results are evaluated with series resonant circuit models. Additionally, the impact of the feedback loop parameters on the response time of a step response is presented to demonstrate its high potential.
2.1 Cantilever design and fabrication
The geometrical configuration of the custom-made cantilever, which was fabricated in-house, is illustrated in Fig. 1a, showing the beam length (lSi), width (wSi), AlN coverage (lAlN), and AlN width (wAlN). The cross-section shown in Fig. 1b illustrates the three principal layers of the cantilever. The base layer consists of the doped silicon substrate, which simultaneously serves as the mechanical support and as the bottom electrode, respectively. Above, the active AlN layer provides the piezoelectric actuation responsible for cantilever excitation. The upper metallization, composed of Cr and Ag, serves as top electrode. The selection of the cantilever dimensions was guided by the limitation of the bandwidth of the amplifier and the limitations set by the fabrication. An analytical estimate based on the Euler–Bernoulli formulation for a rectangular cantilever, targeting a resonance frequency on the order of 50 kHz and using the approach employed in Mahdavi et al. (2020), results in the dimensional choice of lSi=750 µm, wSi=80 µm, and lAlN=500 µm. These values are indicated at the left edge of the die as 750/80/500 in Fig. 1c. The length of lAlN was selected to minimize parasitic effects of the piezoelectric layer and to reduce its influence on the mechanical properties of the cantilever. In addition to the released cantilever, an additional AlN/Cr/Au stack with the identical dimensions as the cantilever is realized on the silicon frame. With this non-released stack, any parasitic influences on the conductance spectrum can be determined in situ on the chip, thus allowing for baseline compensation Fig. 1c.
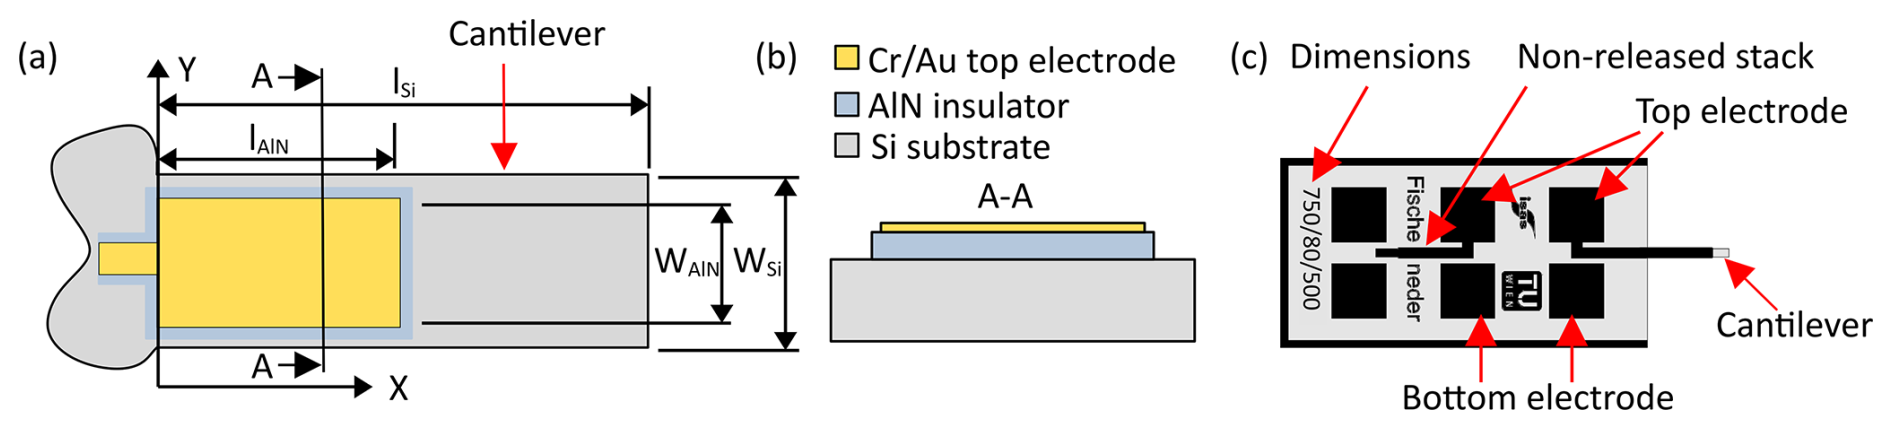
Figure 1The geometrical dimensions of the cantilever (a), its cross-section (b), and the top view (c) are shown. The illustrations at (c) include the free-moving cantilever, the compensation structure, and the contact pads.
The fabrication process is schematically shown in Fig. 2. The process starts (Fig. 2a) with a silicon-on-insulator (SOI) wafer with a highly doped silicon device layer serving as a bottom electrode (buried oxide layer (BOX) of 2 µm thickness). Thermal evaporation is used to deposit 100 nm Ti and 200 nm Au. Contact pads are patterned using lift-off lithography, and a subsequent annealing step is performed to realize an ohmic contact between Ti/Au and Si (Fig. 2a). Next, the beam is coated with piezoelectric AlN, which is synthesized by DC reactive magnetron sputtering. Subsequently, Cr/Au is e-beam evaporated as the top electrode layer, with AlN serving as insulation between the top and bottom electrode. Both AlN and the top electrode are patterned with the same lift-off lithography step (Fig. 2b). Finally, the cantilever geometry is defined by a topside deep reactive ion-etching (DRIE) process (Fig. 2c). After backside DRIE, the cantilever is released in hydrogen fluoride (HF, Fig. 2d).
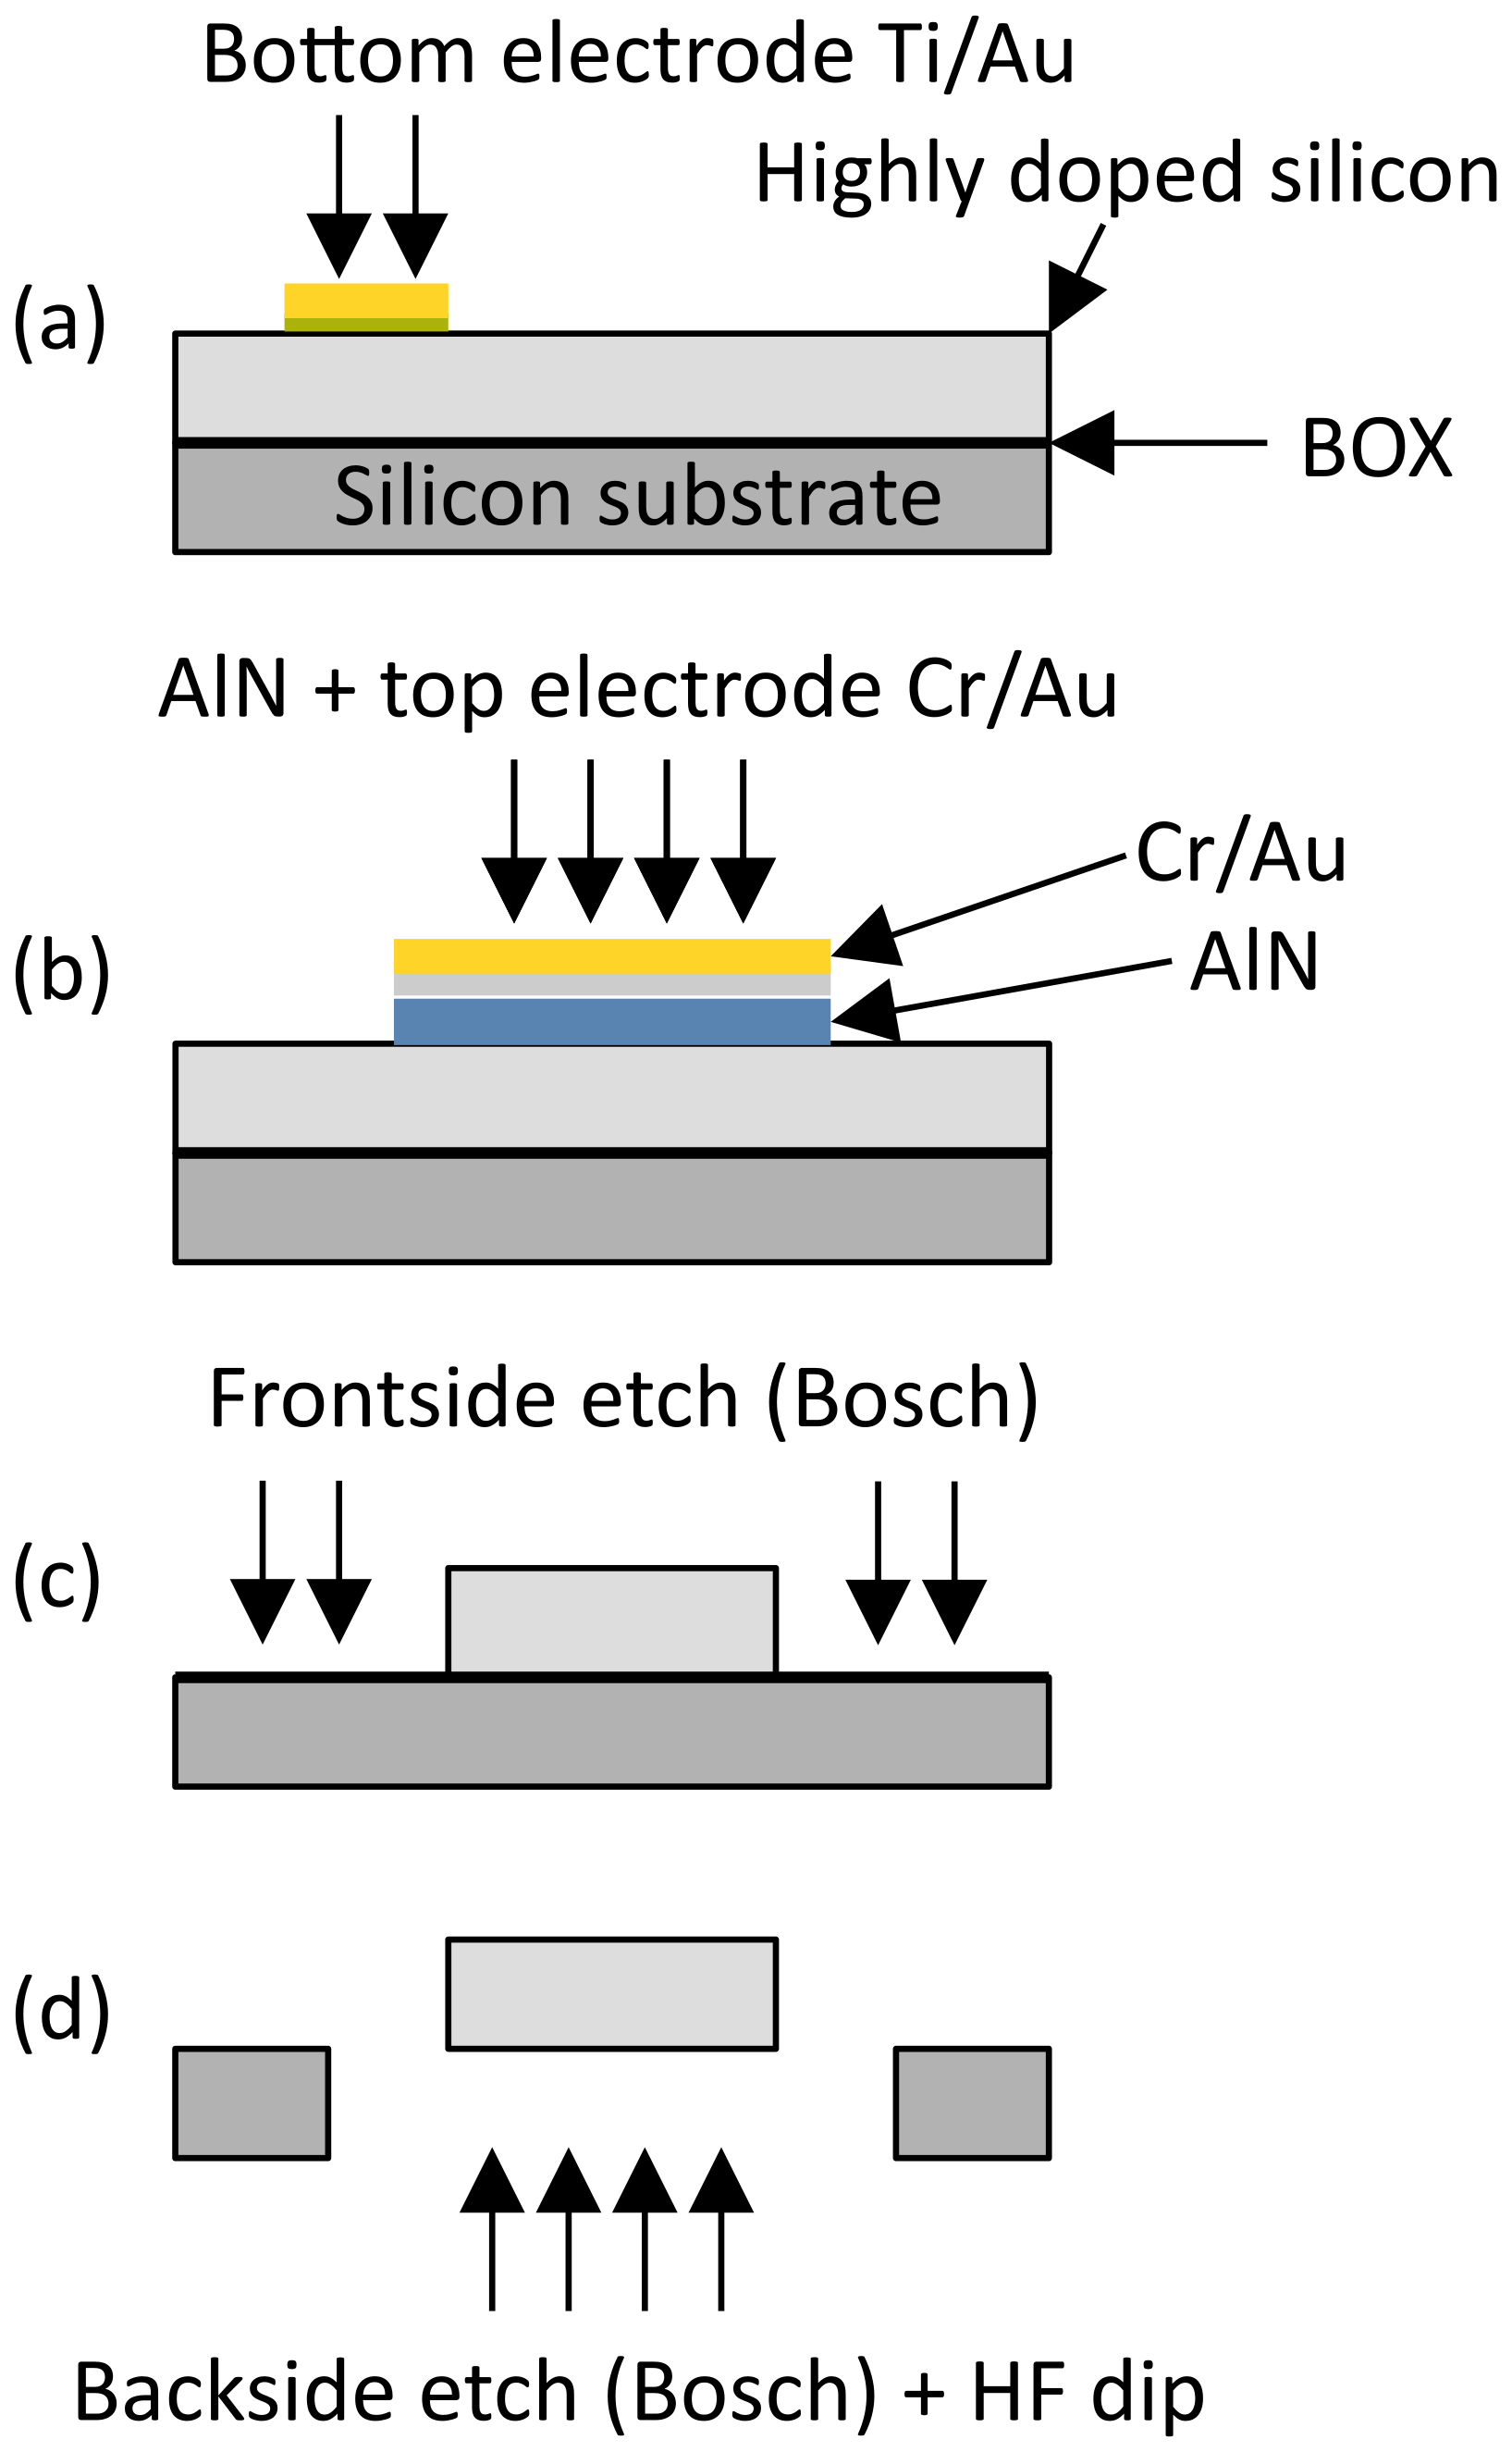
Figure 2The resulting structure of the cantilever fabrication is presented. The schematic shows (a) Ti/Au layer for ohmic contact formation on silicon, (b) device layer with AlN and Cr/Au top electrode layer, (c) front side DRIE etch, and (d) back side DRIE etch and HF cantilever release.
2.2 Measurement setup
The Q factor of a resonantly operated system is determined by the ratio of f0 and amplitude bandwidth (B, 3 dB bandwidth). When B is reduced due to decreased damping, Q gets larger, which increases the response times of the system (Kucera et al., 2013) and thus prolongs the measurement duration, and vice versa. To manipulate B, a measurement scheme with a piezoelectric cantilever probe, as is shown in Fig. 3a, is used. The cantilever velocity is measured with a laser Doppler vibrometer (LDV) from Polytec (MSA-400). Cantilever oscillation is excited by the AlN driven through the excitation voltage (U0). A moveable silicon reference sample surface is placed below the cantilever which is driven by a rectangular voltage of 0.25 V from the frequency generator. This is amplified by 100 with a PICA Piezo Controller from Physik Instrumente (PI) SE & Co. KG (a company based in Germany) to a voltage of 25 V, with a maximum frequency of 2 kHz. Through that, the distance between cantilever and sample surface (dCS) can be varied by approx. 1.56 µm using a Piezomechanik PSt 150/5x5/7 piezoelectric actuator. To measure Q in vacuum under free-moving conditions, dCS is sufficiently large (approx. 2 µm) to suppress any influence of the sample surface on cantilever vibration (approx. 500 nm deflection amplitude). For response time measurements, the sample surface is periodically approached to simulate a step-like surface topography. This setup is comparable to a pulsed force mode AFM, where the probe is moved along the z axis in a sinusoidal motion (Butt et al., 2005; Eaton and West, 2010; Rosa-Zeiser et al., 1997). In this paper, a square wave-shaped stimulation is used.
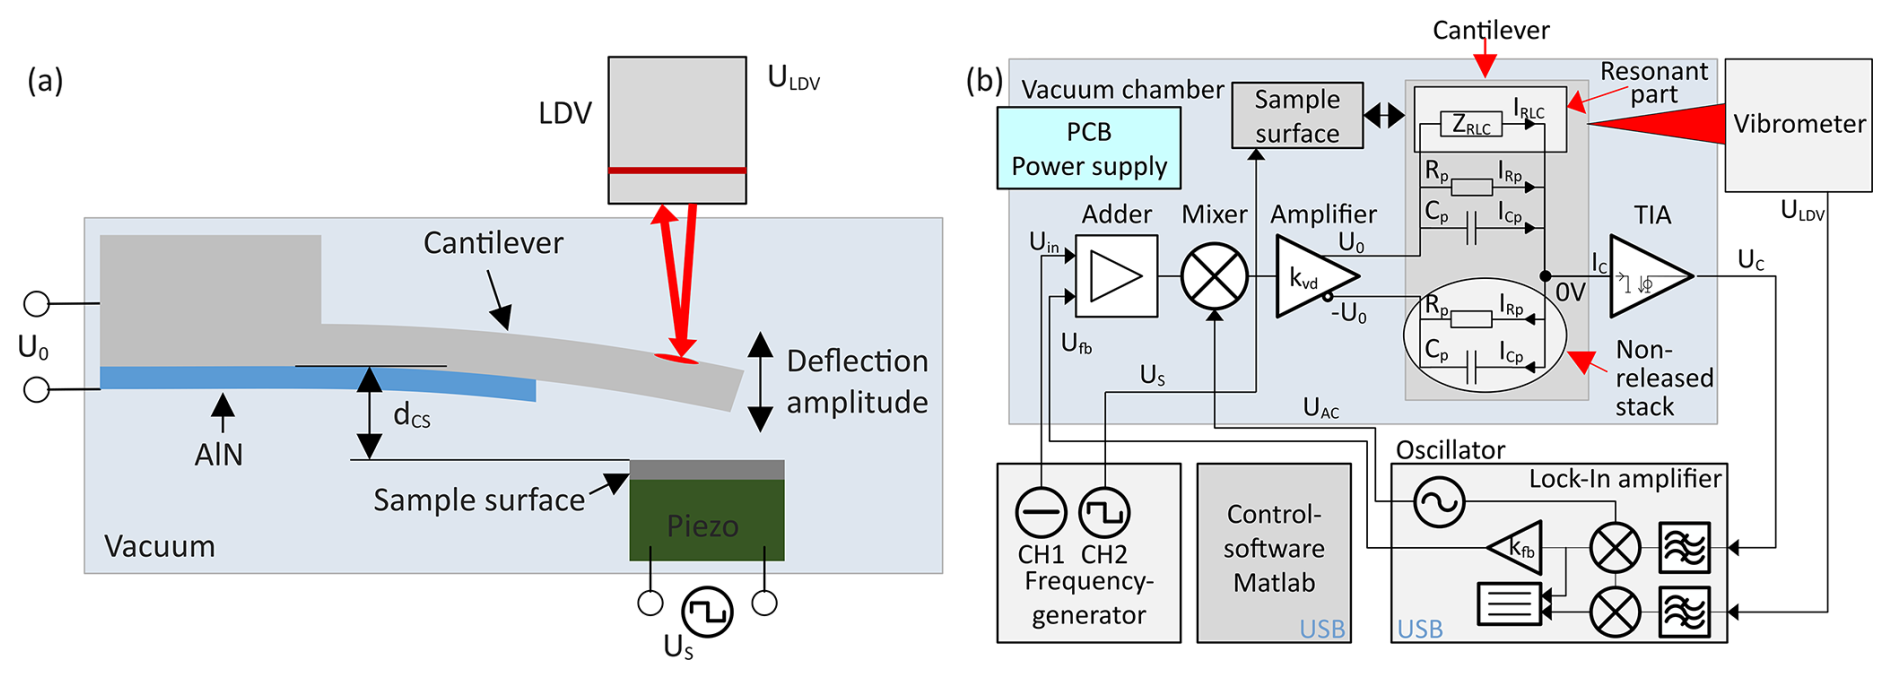
Figure 3(a) Layout of piezoelectric-driven cantilever in vacuum with electrical readout, optical readout, and sample surface movement. (b) The measurement circuit is separated into signal generation at frequency generator and lock-in amplifier, signal preparation in the vacuum chamber, and signal capturing at lock-in amplifier and laser Doppler vibrometer.

Figure 4(a) Optical photographs of the PCB and the cantilever placed inside the vacuum chamber, and (b) a detailed view of the cantilever itself.
The measurement circuit is shown in Fig. 3b. The equipment is controlled by MATLAB and is separated into signal generation, equipment in the vacuum chamber, and data logging. The oscillation voltage for the integrated piezo transducer on the cantilever and the compensation structure is supplied by the lock-in amplifier (Zurich HF2LI) via the operational amplifier, which is set to unity gain. The compensation structure is used to eliminate the current from the parallel resistance (RP) and parallel capacity (CP) of the integrated piezo transducer. The I/U converter or transimpedance amplifier (TIA) converts the compensated current (IC) into a proportional compensated voltage (). The transimpedance defines the conversion gain. The resulting voltage is then fed into the lock-in amplifier. The extracted real part (UC_R) of UC is internally scaled by the lock-in feedback factor (kfb) and fed back into the adder stage (Ufb=kfbUC_R), which in turn reduces U0. The strength of kfb is varied between 0 and 20. U0 is generated through the addition of feedback voltage (Ufb) and a DC voltage (Uin) generated by channel 1 (CH1) of the frequency generator (FG) and subsequent multiplicative mixing of Ufb+Uin with the lock-in sinusoidal reference signal (UAC), resulting in . CH2 of FG is used to generate the square wave signal (US) which is applied via piezo amplifier to the sample surface piezo actuator, thus changing dCS. The cantilever velocity (v) is measured using an LDV through an optical port located at the top of the vacuum chamber. The LDV provides a complex voltage signal (), which is proportional to the cantilever velocity ULDV∝v and is acquired by the lock-in amplifier.
Figure 4a shows the top view of the vacuum chamber, operating at a base pressure of 10−5 mbar. The printed circuit board (PCB) with the mounted cantilever die is placed inside the chamber and is visible through the optical access port in the chamber lid. In addition to the cantilever, the PCB includes a moveable sample surface, which is used for step-response measurements and is described in detail later in this paper. Figure 4b shows a detailed view of the cantilever as mounted on the PCB, including the bonding wires used for electrical interconnection. The silicon frame surrounding the cantilever was removed to enable the step-response measurements.
2.3 Equivalent circuit model of the cantilever
In order to determine the Q factor from the frequency spectra, the optically measured cantilever amplitude spectrum is evaluated by a fitted procedure (Kucera et al., 2014). In Eq. (1), the output voltage spectrum of the LDV (ULDV(f)) depends on the frequency (f). The physical meaning of the voltage far from the resonance peak (UBL, base line) is given by the relation , where QLDV is the Q factor and ULDVpeak is the maximum oscillation amplitude at resonance.
The frequency dependent electrical signal from the cantilever UC(f) is recorded simultaneously with the optical measurement ULDV(f). The corresponding cantilever impedance spectrum (ZRLC(ω)) is fitted using a serial RLC equivalence circuit with series resistance (R), series inductance (L), and series capacitance (C). This is given in Eq. (2), where only the impedance magnitude is used, as this work relies exclusively on magnitude-based lock-in processing. The parallel capacitance (Cp) and the parallel resistance (Rp) of the AlN in Eq. (3) represent the electrical equivalent model of the AlN integrated on the cantilever. These parasitic components are compensated by applying an inverse excitation voltage U0 through the unreleased (mechanically inactive) part of the cantilever. This compensation is indicated in Eq. (4) by the opposite signs of the corresponding terms. After compensation, only the resonant part of the cantilever remains and is amplified by the TIA, as shown in Eq. (4). The resulting Q factor is calculated directly from the series resonance circuit elements R, L, and C according to Eq. (5) (Manzaneque et al., 2011).
Figure 5a shows the cantilever velocity magnitude spectrum in air (ULDVair) for increasing kfb from 0 to 20. The maximum voltage amplitude is decreased by −6.4 dBV at maximum feedback of kfb=20. Figure 5b shows the excellent agreement between measurement data and the fit of Eq. (1) for selected values of kfb, which correspond to a decrease in Q from 1014 to 627. The colours correspond to those used in Fig. 5a: the dashed grey lines represent the fits, and the same colour and line-style convention is used consistently in the subsequent figures. Figure 5c shows a representative fit for a feedback factor of kfb=5.0. The measured data are shown in red, while the fitted model is marked by the solid grey line. The 95 % confidence interval of the fit is indicated by the dashed lines. The close agreement confirms that the chosen model is suitable for determining the quality factor Q. Figure 5d presents the residuals of all shown fits. The residuals are centred around zero without systematic trends, and the maximum deviation remains below 0.3 dBV for all feedback values, confirming the good agreement between measurement and model across the entire parameter range.
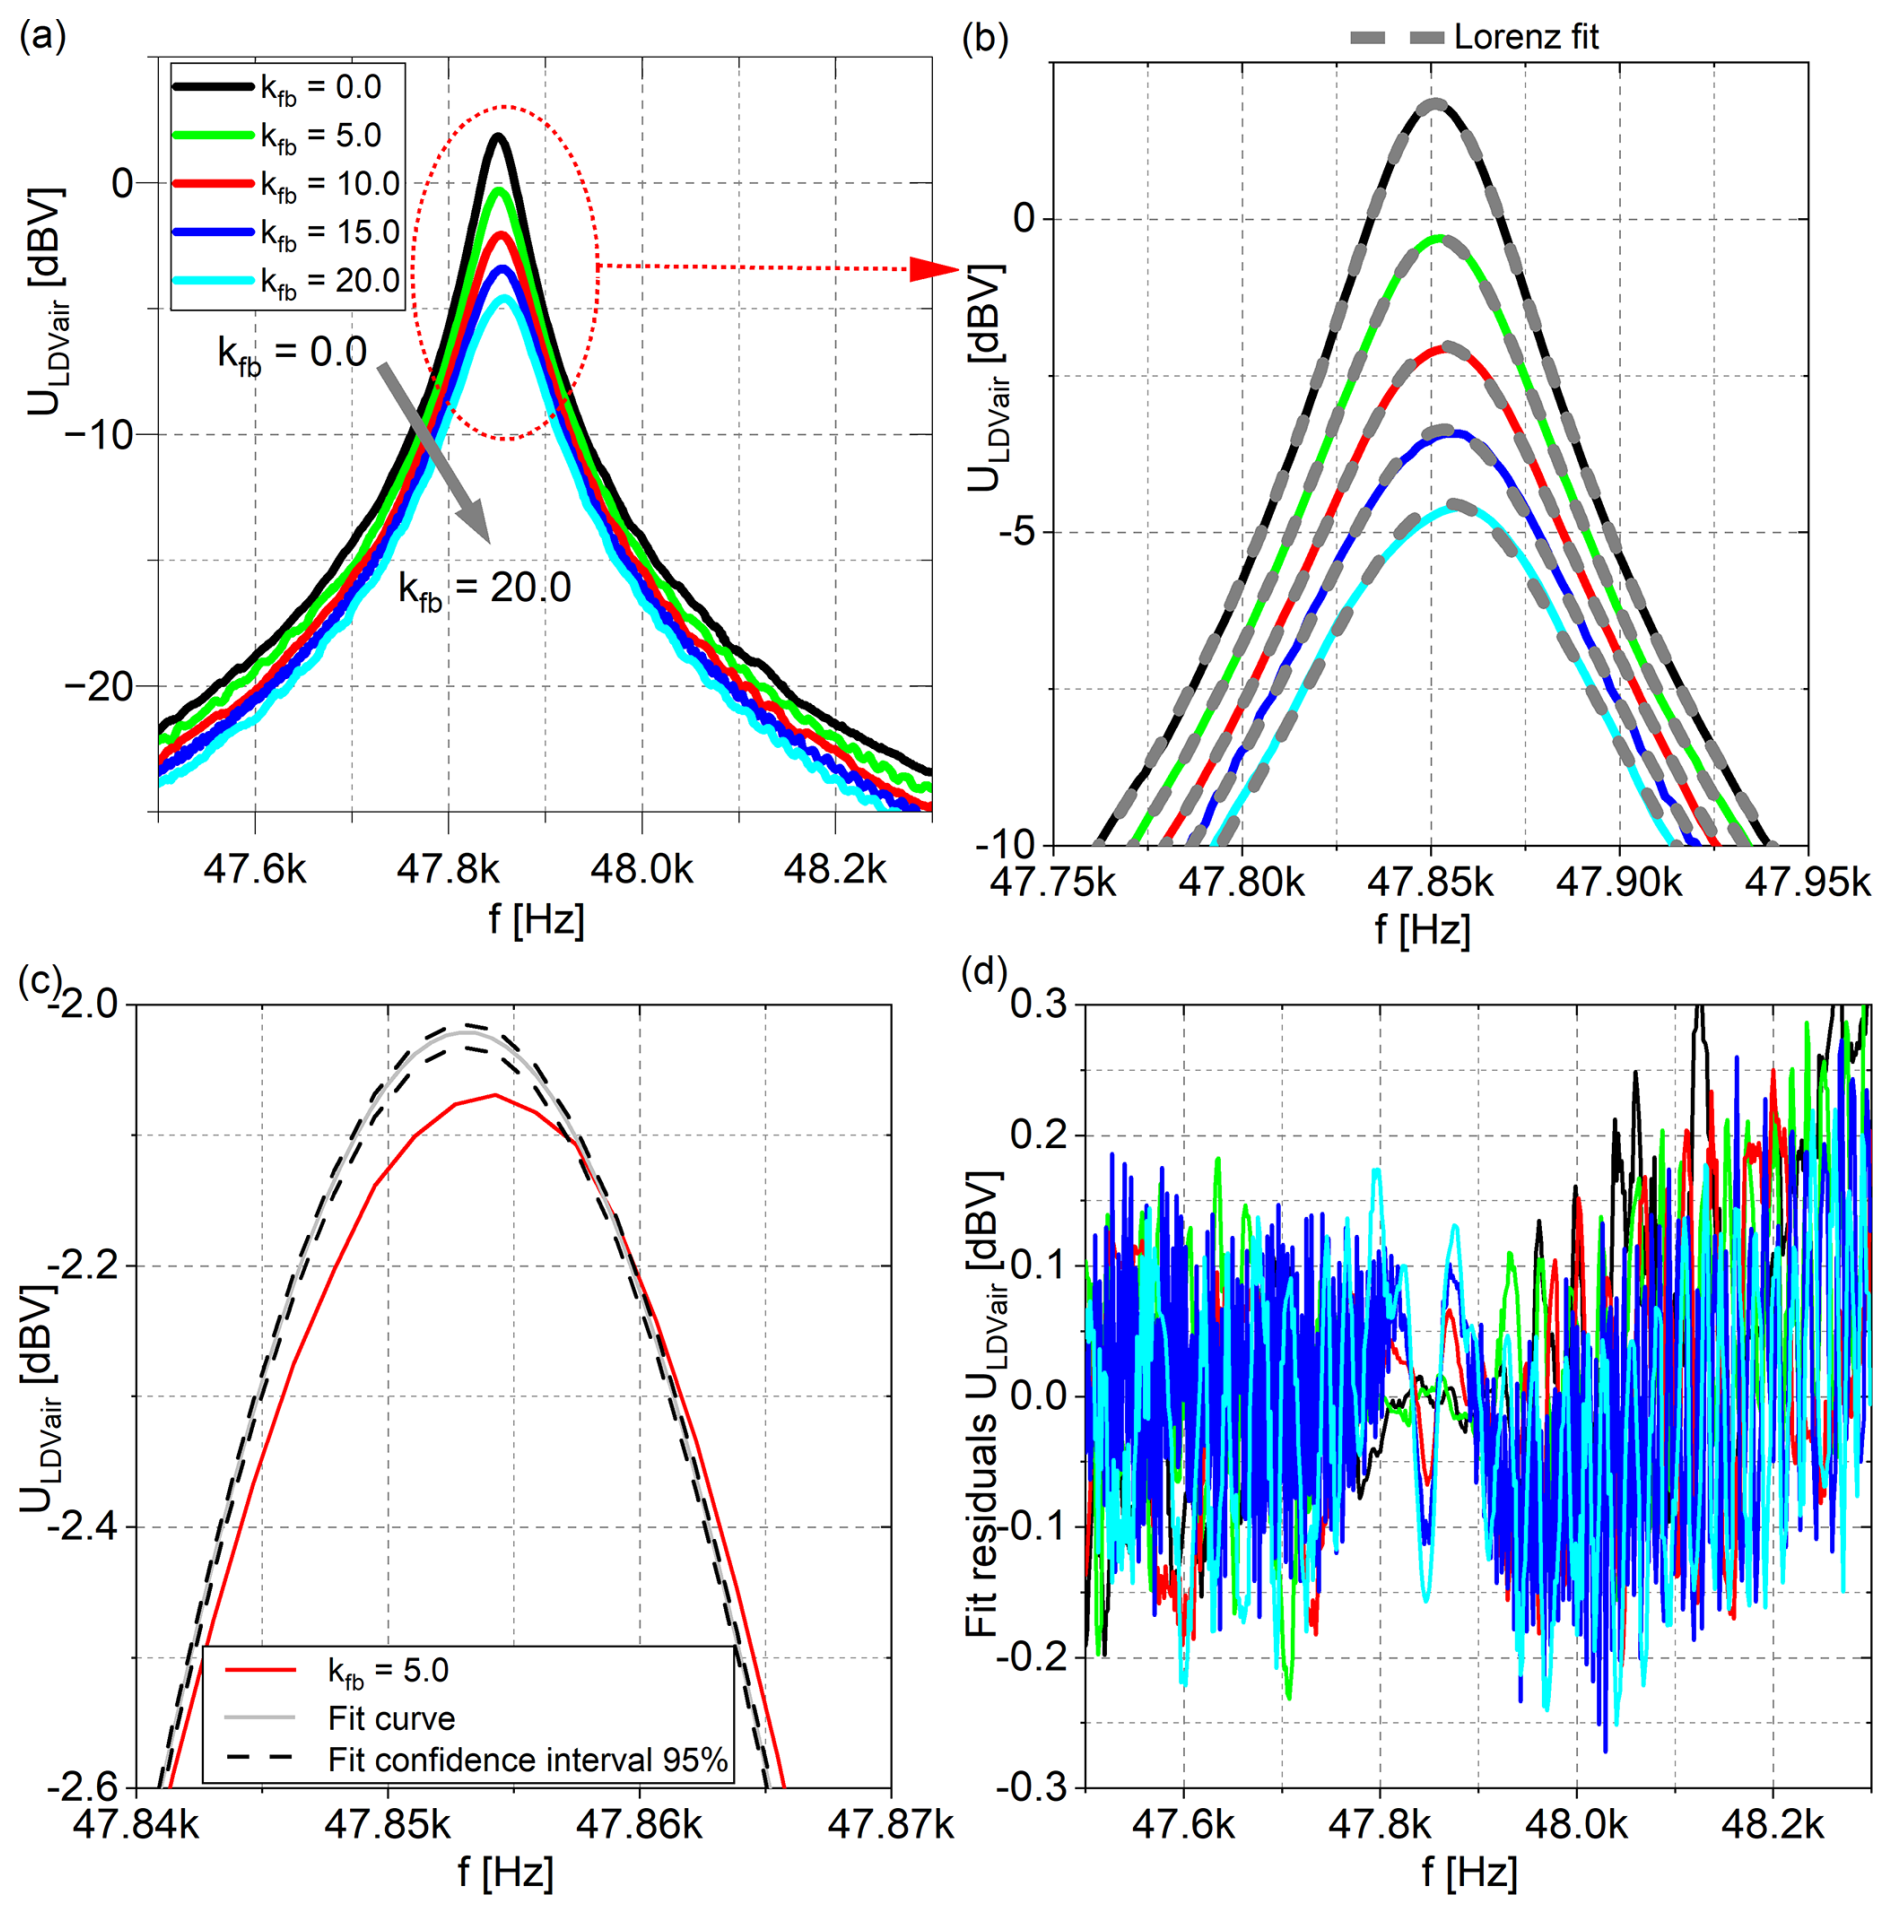
Figure 5Cantilever oscillation velocity recorded with the LDV in air for different feedback kfb, shown as (a) amplitude, (b) Q factor fitting, (c) exemplary confidence interval plot, and (d) fit residuals plot.
Figure 6a shows the amplitude of the conductance magnitude spectrum in air (UCair), where the maximum amplitude is reduced by −6.1 dBV at kfb=20.0. Figure 6b illustrates the excellent fit of Eq. (4) to the measurement data, enabling Q factor determination in the same way as above, which corresponds to a decrease in Q from 1036 to 611. Figure 6c illustrates a representative fit obtained for a feedback factor of kfb=5.0. The measured data (red) are in close agreement with the fitted model (solid grey line), while the associated 95 % confidence interval is indicated by the dashed lines. Figure 6d shows the residuals of all fitted curves. The residuals are centred around zero and exhibit no systematic trends, while the maximum deviation remains below 0.15 dBV for all feedback values, confirming the consistent agreement between measurement and model across the entire parameter range.
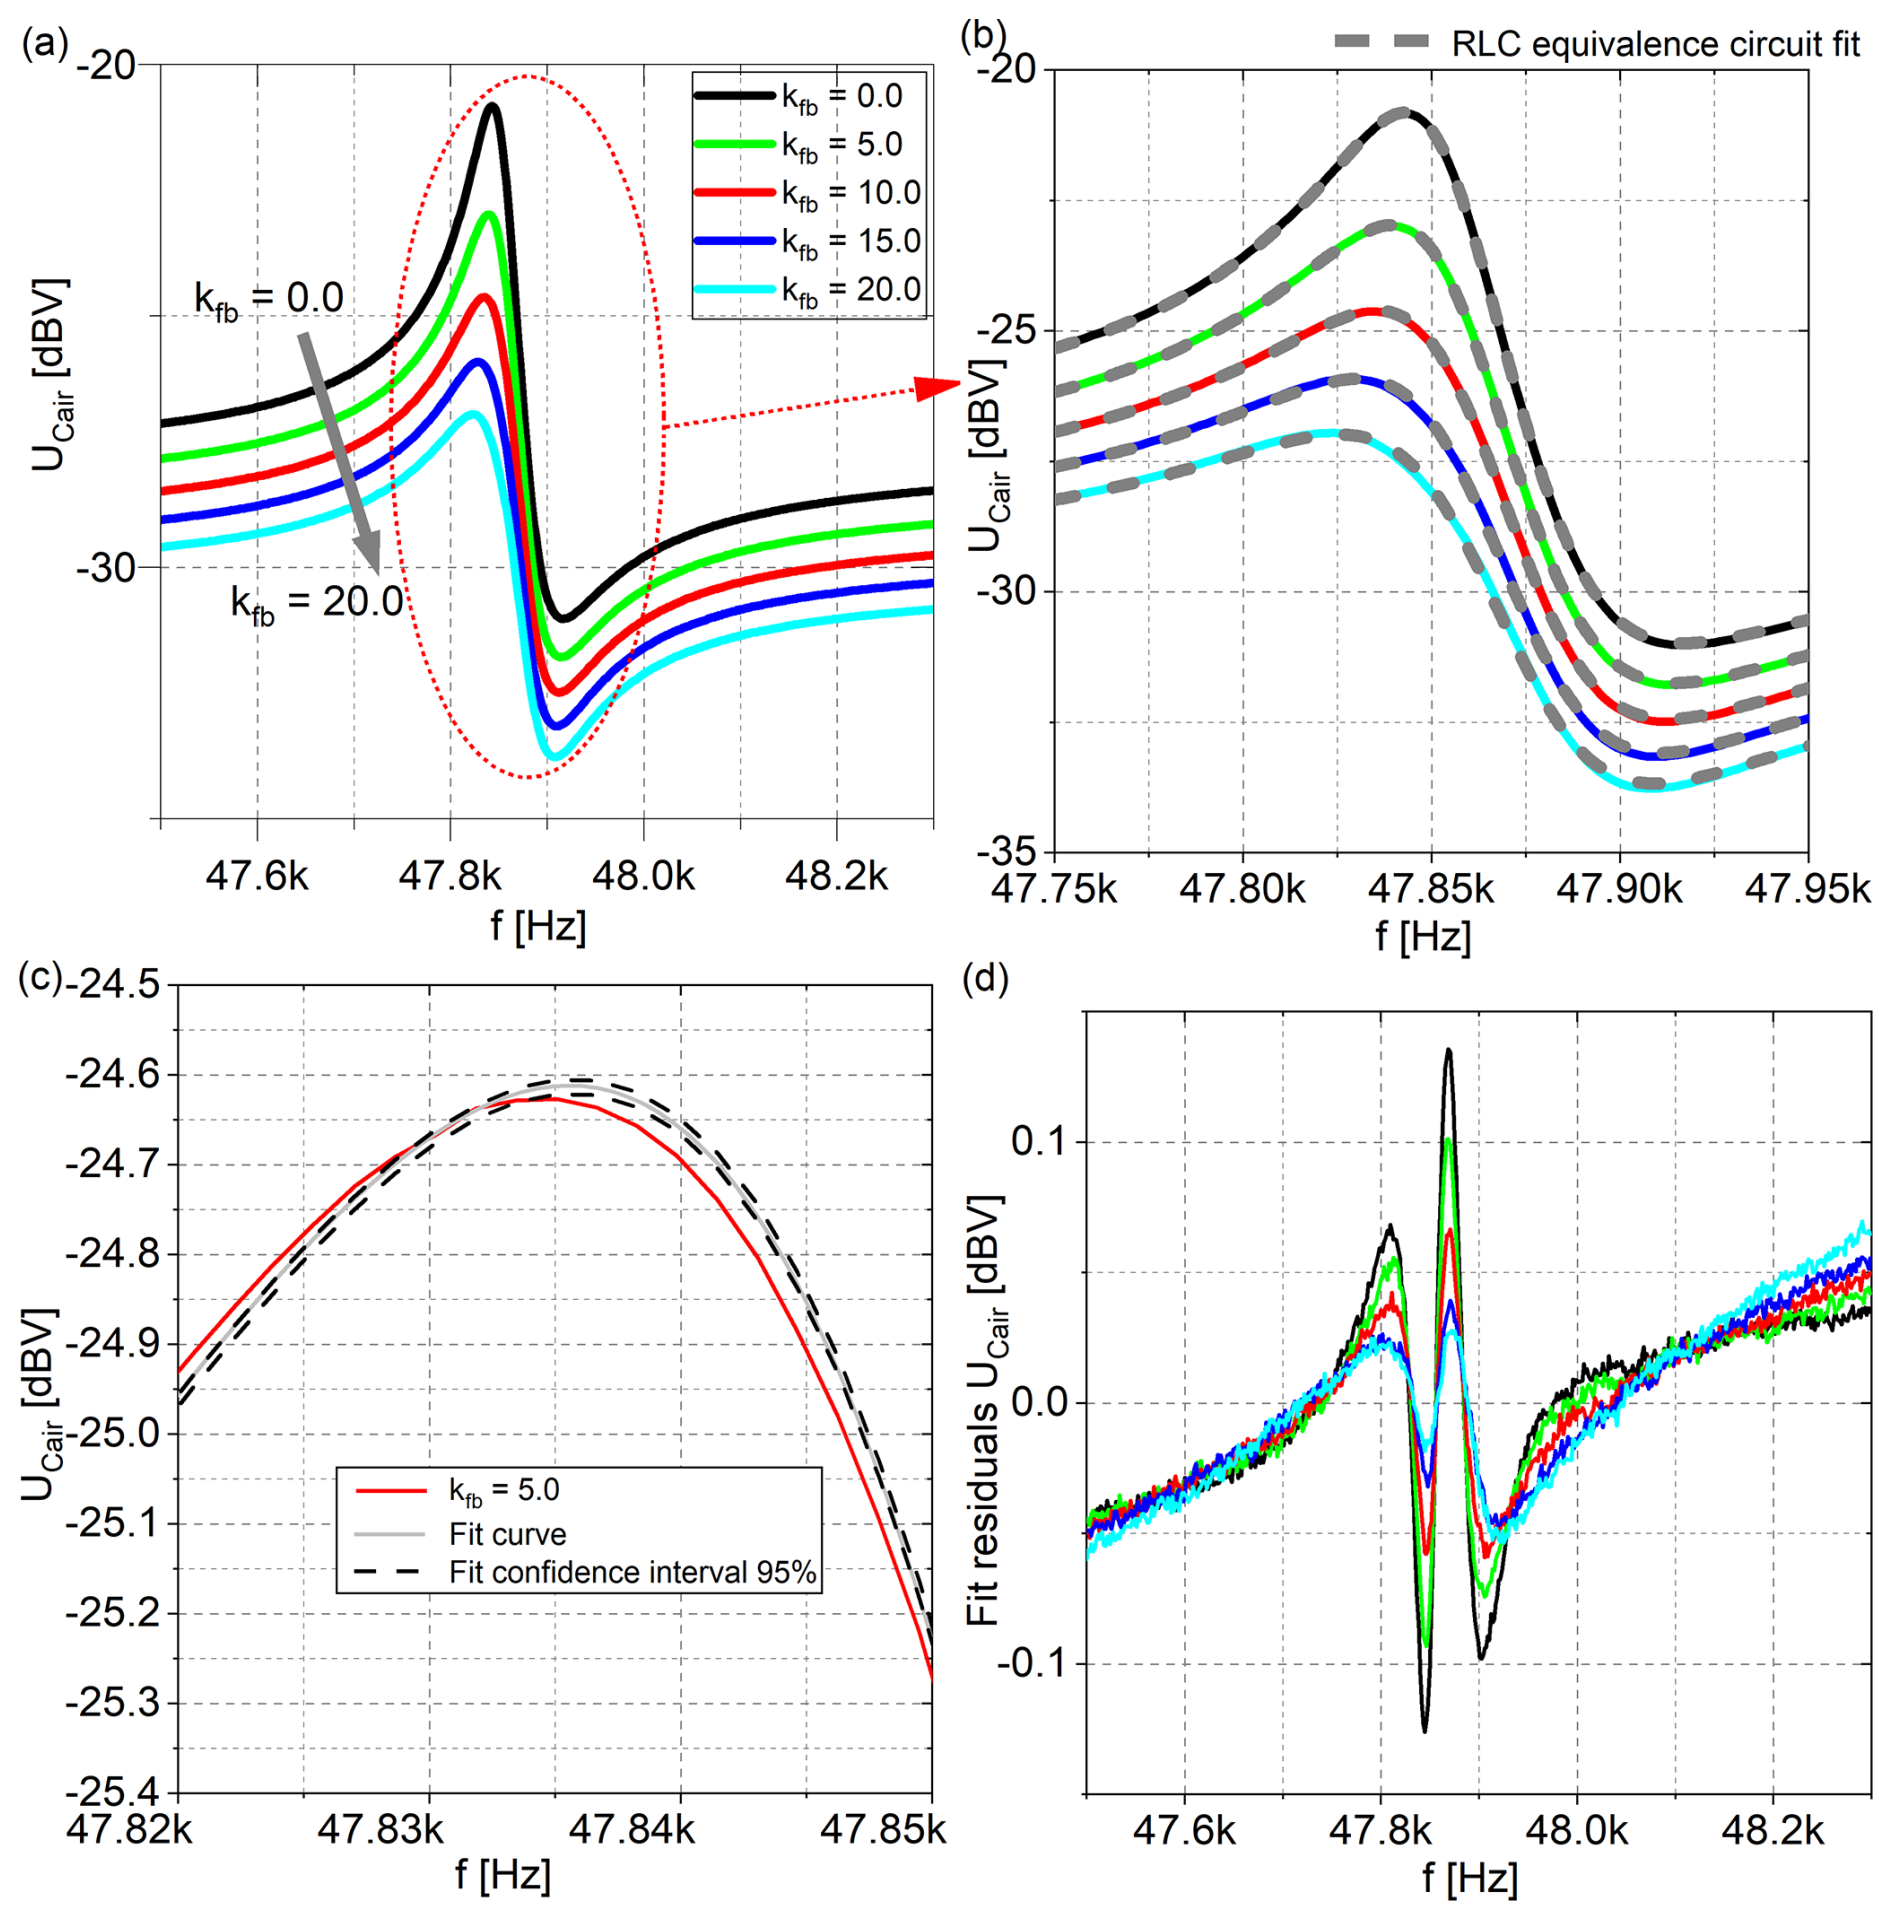
Figure 6Piezoelectric cantilever output voltage in air with increased feedback kfb, shown as (a) amplitude, (b) Q factor fitting, (c) exemplary confidence interval plot, and (d) fit residuals plot.
The results for cantilever operation in vacuum are presented in Fig. 7a. The frequency magnitude spectrum at resonance is narrower compared to operation in air and the Q factor increases from 1014 in air to 5236 in vacuum. While increasing kfb from 0 to 20, the cantilever velocity magnitude spectrum in vacuum (ULDVvac) is decreased by about −11.8 dBV, while the related Q factor obtained by fitting Eq. (1) to the measured data shown in Fig. 7b is reduced to 1476. Figure 7c illustrates a representative fit obtained for a feedback factor of kfb=5.0, using the same colour coding and confidence interval representation as introduced previously. Figure 7d presents the residuals of all fitted curves. The residuals are centred around zero without systematic trends, with a maximum deviation below 3 dBV for all feedback values. An exception is observed for measurements performed under vacuum conditions, where an increased deviation occurs near the resonance frequency. This behaviour is discussed in detail in a later section.
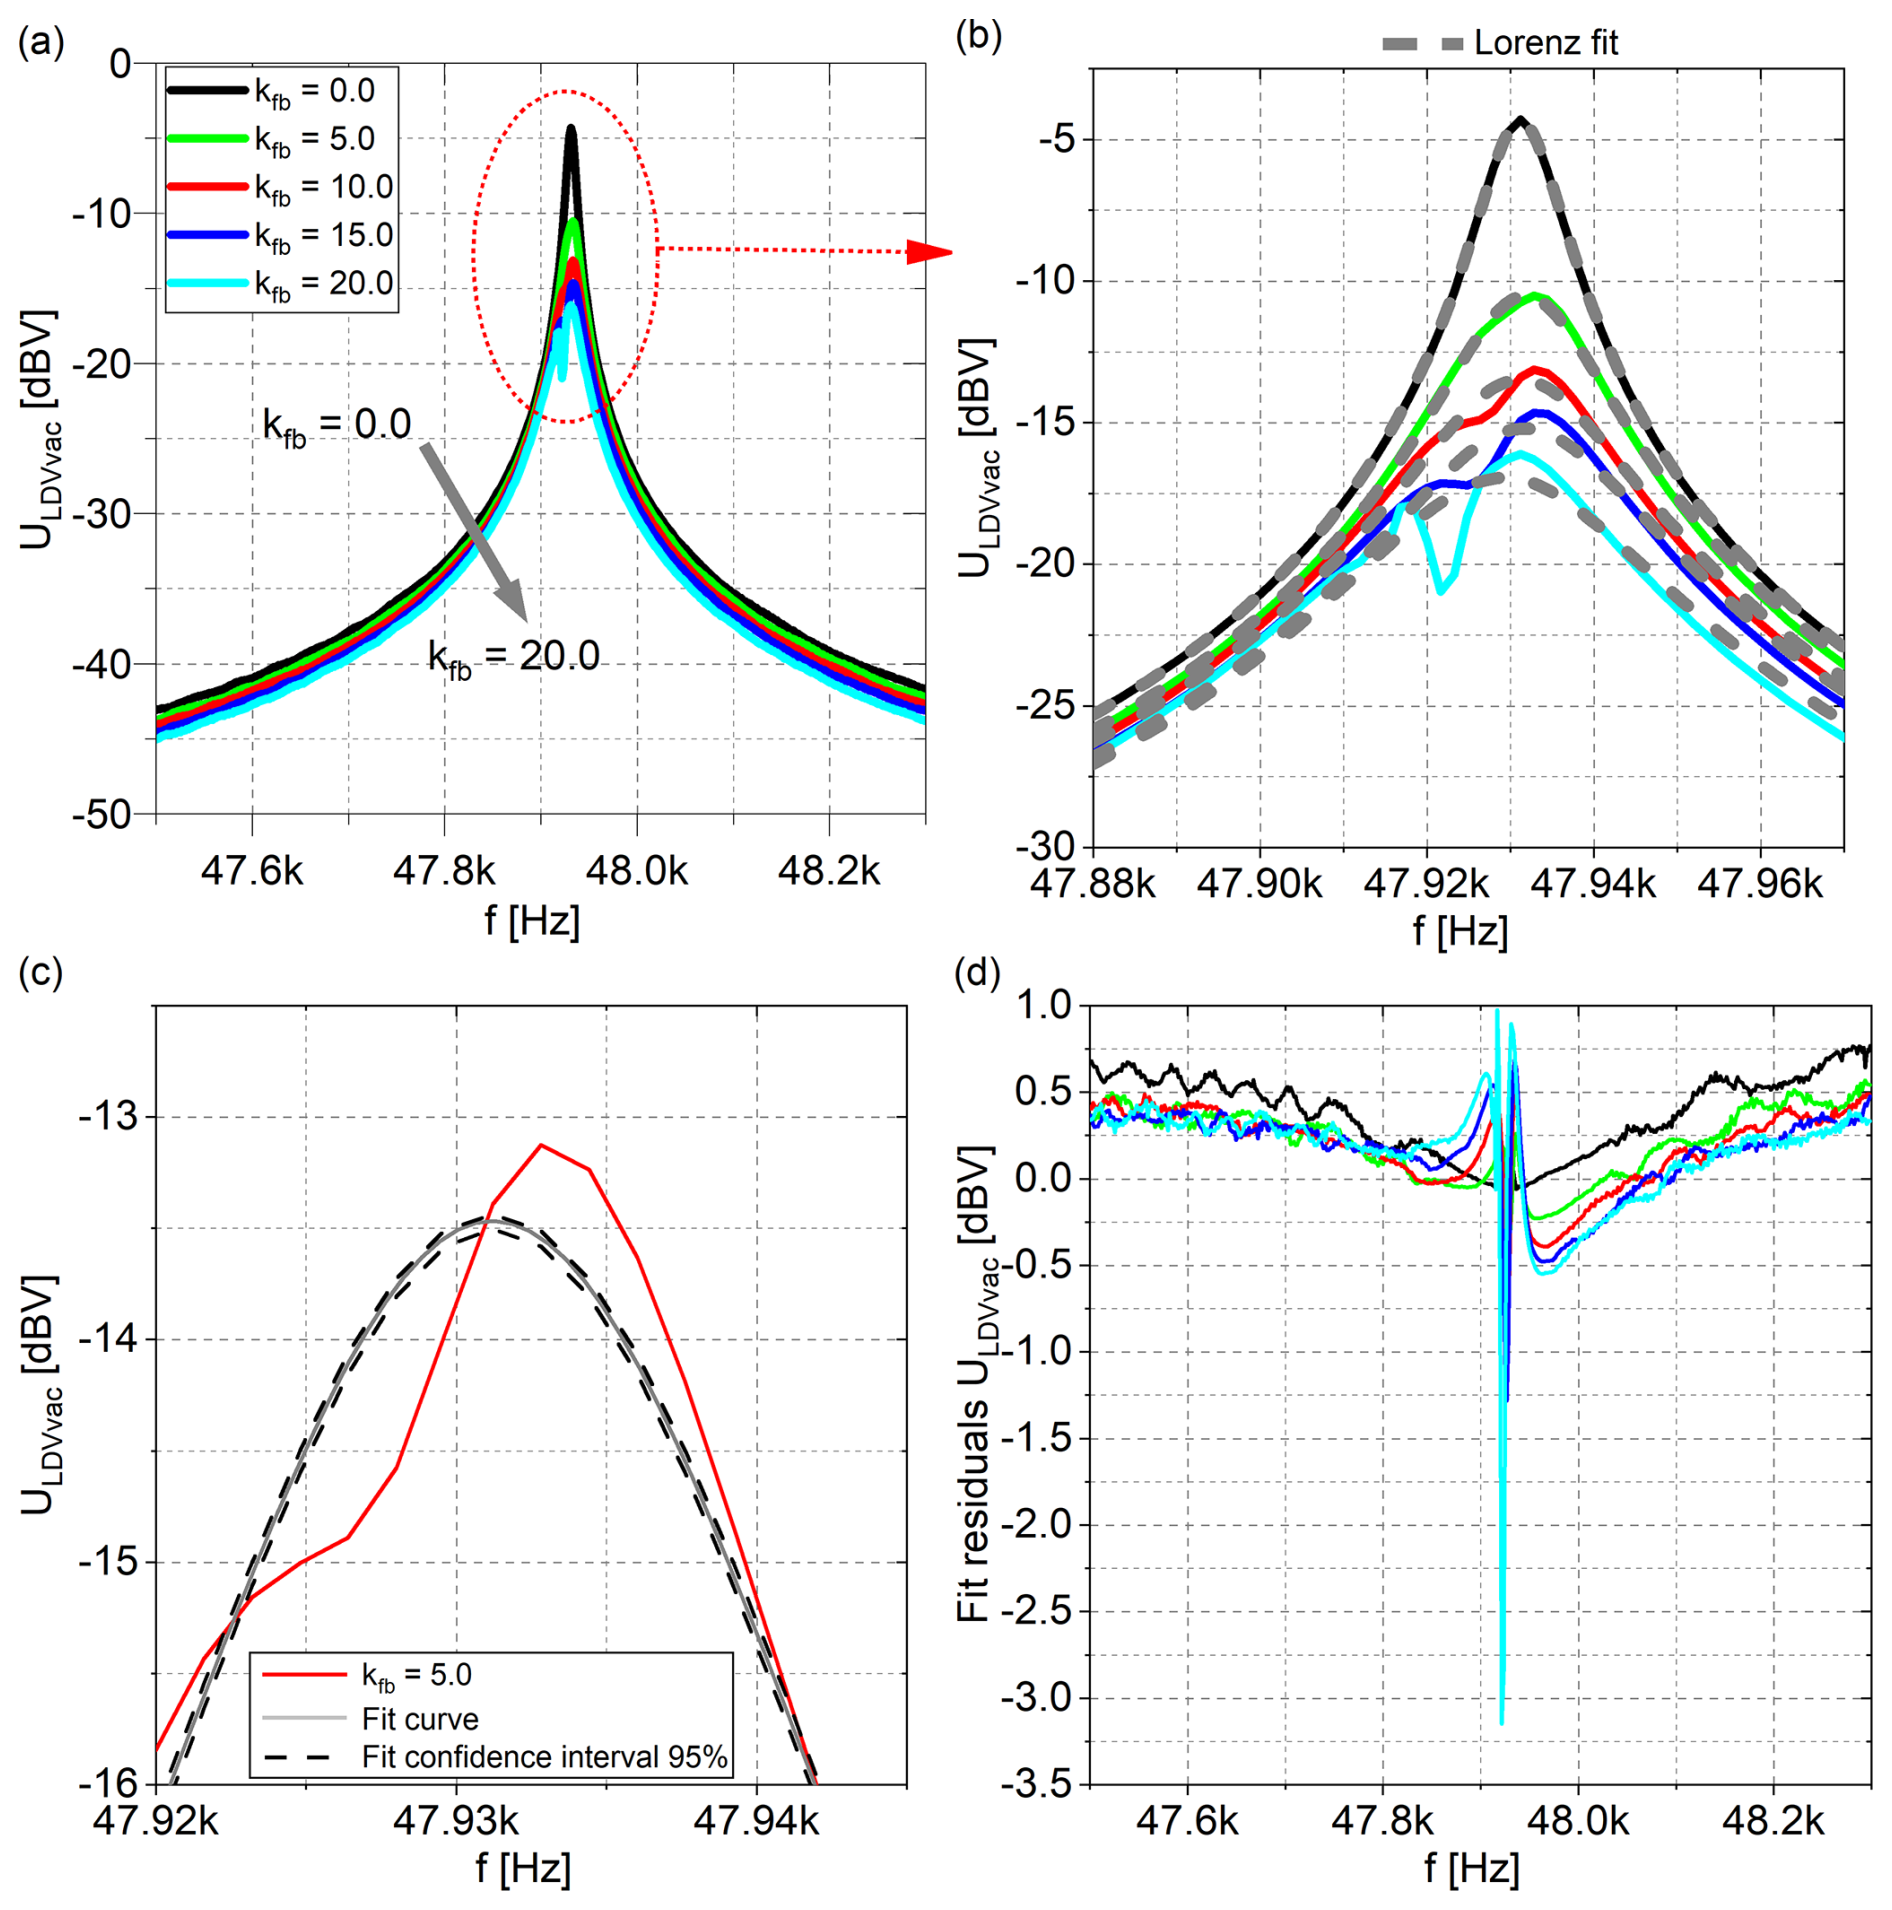
Figure 7Cantilever oscillation velocity recorded with the LDV under vacuum with increased feedback kfb shown as (a) amplitude, (b) Q factor fitting, (c) exemplary confidence interval plot and (d) fit residuals plot.
The amplitude of the conductance magnitude spectrum in vacuum (UCvac) showing a reduction of −12.7 dBV with an increased kfb from 0 to 20, is presented in Fig. 8a. Compared to the resonance spectrum in air, the Q factor increases from 1014 to 5320. Figure 8b shows the fitting of Eq. (4) resulting in a Q factor reduction from 5320 down to 1354. Figure 8c illustrates a representative fit obtained for a feedback factor of kfb=5.0, using the previously introduced colour convention. Figure 8d presents the residuals of all fitted curves. The residuals are centred around zero without systematic trends, with a maximum deviation of about 3 dBV for all feedback values. For measurements performed under vacuum conditions, increased deviations are observed near the resonance frequency; a similar effect is also present in the electrical measurement path. This behaviour is discussed in detail in a later section.
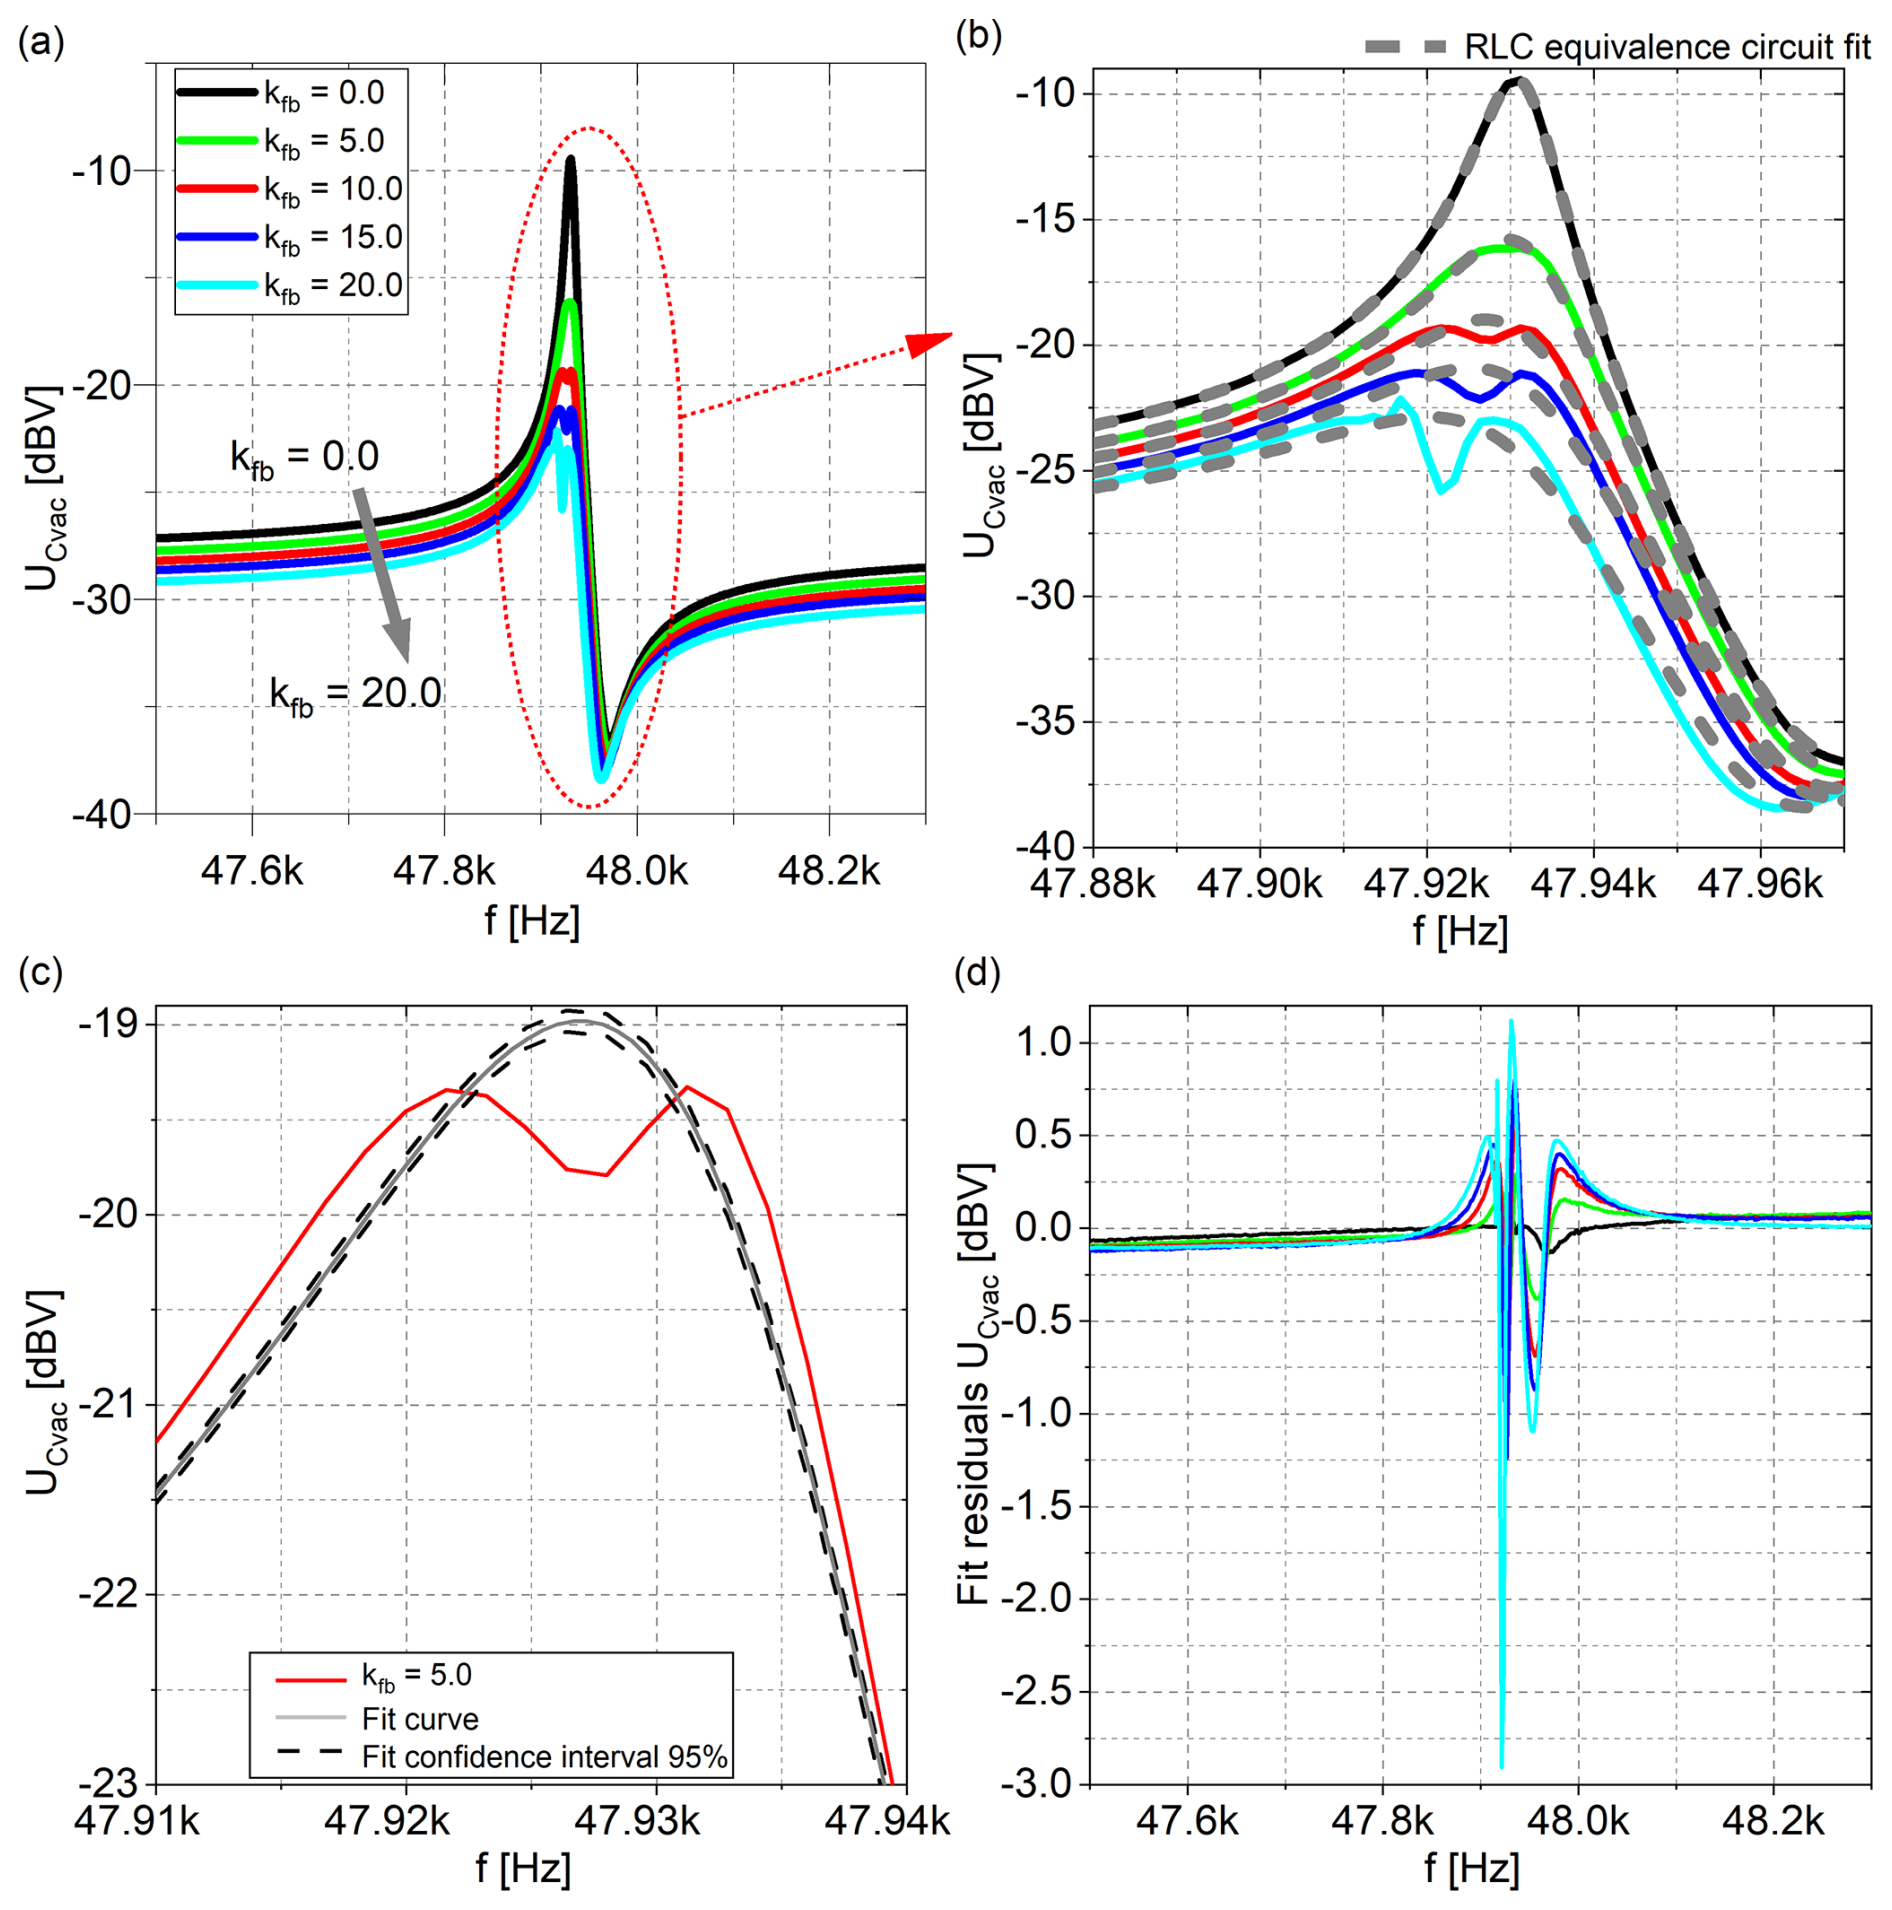
Figure 8Piezoelectric cantilever output voltage under vacuum with increased feedback kfb, shown as (a) amplitude, (b) Q factor fitting, (c) exemplary confidence interval plot, and (d) fit residuals plot.
To demonstrate the potential of this electronic Q factor tuning for AFM applications, the system performance is characterized by the step-response time (tsrt). From a given initial state, tsrt is defined as the time between the amplitude values 0.9 and 0.1. For this purpose, the silicon sample surface is placed next to the free end of the cantilever (see Fig. 3a). Precisely actuated with a macroscopic piezoelectric element, the distance between the cantilever and the surface is altered by 1 Hz, which simulates an AFM cantilever scanning a surface topography with a periodic arrangement of steps. In Fig. 9, the envelope of the oscillation for the normalized value of ULDVair_s (Fig. 9a) and UCair_s (Fig. 9b) in air, and ULDVvac_s (Fig. 9c) and UCvac_s (Fig. 9d) under vacuum between t=0 s and t=0.15 s demonstrate the effect of enlarging kfb. Here, the subscript “s” indicates that the signals correspond to the step-response measurement. In air, tsrt can be reduced from 42 to 25 ms (Fig. 9a) when measured with LDV and from 41 to 9.7 ms (Fig. 9b) when the piezoelectrically induced current of the cantilever is measured. The same measurement setup is used under vacuum, where tsrt is reduced from 69 to 18 ms (Fig. 9c) and from 76 to 7.5 ms (Fig. 9d).

Figure 9Response of ULDVair_s (a) and UCair_s (b) in air, and of ULDVvac_s (c) and UCvac_s (d) under vacuum to a surface step as a function of different kfb values.
The potential of the Q factor manipulation in air is shown in the frequency spectrum acquired by LDV at Fig. 5 and by the amplified cantilever current at Fig. 6. In Figs. 5b and 6b, the mechanical oscillation, the electrical signal of the cantilever, and the reduction of the Q factor follow the modelling of the mechanical oscillation and the electrical equivalent circuit. The largest Q factor is obtained with feedback of kfb=0, where the stimulus is not manipulated through the feedback circuit. Through increasing kfb, which amplifies the cantilever current and intensifies the manipulation of the excitation amplitude, depending on the amplified cantilever current, the resonance curve in Fig. 5a widens, while the peak height decreases, thus reducing the Q factor. A similar effect can be seen for the cantilever voltage at Fig. 6a, where the feedback kfb reduces the maximum amplitude. The discrepancy between electrical and optical measurement originates from the optical and electrical measurement position. The optical measurement is taken close to the free end of the cantilever in contrast to the electrical measurement, which is predominantly performed close to the anchor region of the cantilever. This due to the fact that the largest change in piezoelectric-induced current is expected in the piezoelectric layer from regions where the largest mechanical stress occurs.
In Fig. 7a, an unexpected dip close to the resonance frequency can be seen. The origin becomes clear when analysing again the feedback circuit with the help of Fig. 8a. There, the amplified and transformed cantilever current shows the dip close to the resonance at the larger deflection as well. To prevent any unsteadiness in the feedback circuit, the real UC_R is amplified and used for the cantilever stimulation manipulation. No impact was recorded in air, under vacuum conditions; however, the feedback circuit is affected and should be avoided in future considerations.
The reduction of the Q factor allows a reduction of tsrt when the kfb is increased (see Fig. 9). As stated above, a significant reduction in tsrt through the increase in the feedback in air (Fig. 9a) and under vacuum (Fig. 9c) is observed. But through proportional feedback, the control loop has the tendency to oscillate, which is prevented in air (Fig. 9a) due to the damping of the cantilever oscillation but occurs under vacuum (Fig. 9c). For future adaption, a feedback loop with an integral section will help to maintain the stable control loop. However, the deviation of the diagrams in air between Fig. 9a and c, and under vacuum between Fig. 9b and d, results also from the different measurement principles. The LDV records the mechanical deflection, while the electrical method records the stimulation signal and the mechanical stress dependent signal. An electronic compensation for this parasitic influence arising from the stimulation signal is requested in future circuit considerations.
In Fig. 10a, the black and red lines represent the manipulation of the Q factor under vacuum, and the grey lines indicate when kfb is increased in air. The corresponding response times are presented in Fig. 10b, where blue lines indicate vacuum and grey lines air environment.
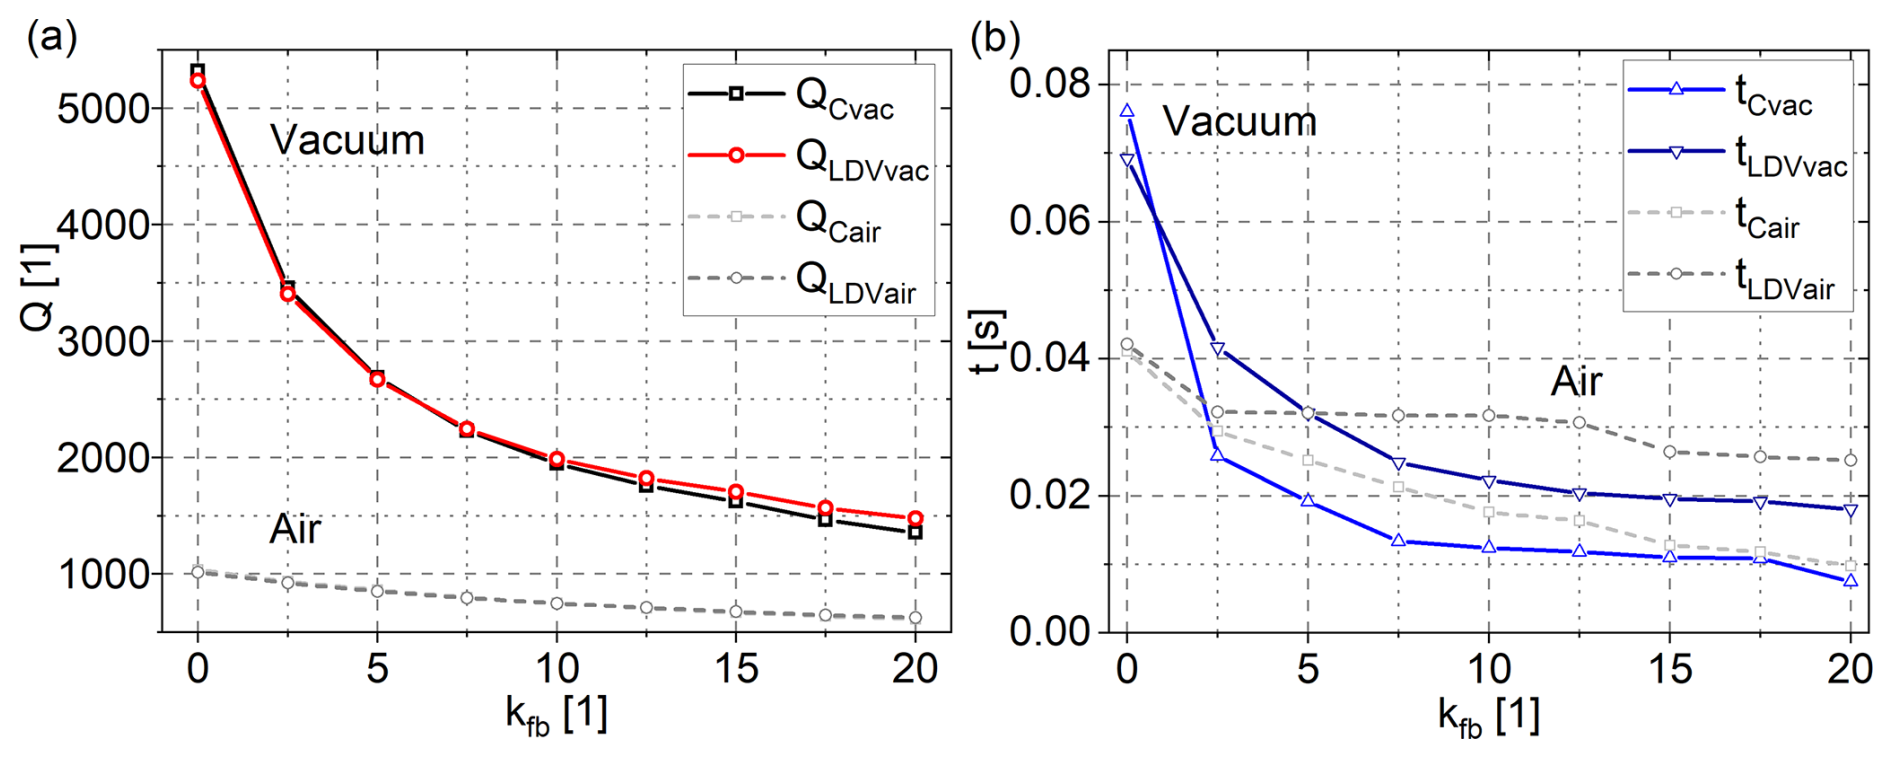
Figure 10Vacuum as well as air environment (a) Q factor and (b) response time reduction by a feedback-controlled cantilever oscillation.
In air, the mechanical/electrical determined Q factor is reduced by a factor of 1.62/1.69 from 1014/1036 to 627/611, and the response time is shortened by a factor of 1.68/4.22 from 42 ms/41 ms to 25 ms/9.7 ms. In vacuum, the negligible air attenuation results in a Q factor increase by a factor of 5.16/5.13 from 1014/1035 to 5235/5319. The feedback loop reduces the Q factor by a factor of 3.55/3.94 from 5235/5319 to 1476/1351 and lowers response time by a factor of 3.83/10.13 from 69 ms/76 ms to 18 ms/7.5 ms. When an exponential change of the envelope of the oscillation is presumed, the time constant from the amplitude spectra (τas) (Adams et al., 2016) with f0=47.85 kHz and Q=1014 from Fig. 5a can be calculated to 21.2 ms for the measurements with the LDV. The response time tsrt can be reshaped from to , which results in 19.1 ms which is in good agreement with the LDV measurement and is stated as exemplary for all measurements in air. When the cantilever is measured under vacuum, there is a major deviation of τas=109 ms and τsrt=31.4 ms, which can be traced back to the lack of air damping.
The Q factors and the corresponding reduction factors between the undamped case and maximum feedback are presented and compared in Table 1. The reduction factors range from moderate values of around 2–4 up to values exceeding 10. Large reduction factors, such as 12 (reported by Karvinen and Moheimani, 2014) and 11.8 (reported by Coskun et al., 2019), are obtained for cantilevers with relatively low initial quality factors (i.e. 276 and 177). In these cases, high-gain positive position feedback can strongly increase the effective damping. Measurements on a calibration grating sample (TGZ3) by Karvinen and Moheimani (2014) show a reduction in the Q factor from 221 to 56, which corresponds to a reduction factor of 3.95. Fairbairn et al. (2011) achieve a reduction factor of 8.38, starting from an initial Q of 297.6 to 36 through the shunt impedance approach.
Table 1Presentation and comparison of Q factors and the corresponding reduction factors between the undamped case and maximum feedback.

More moderate reduction factors include 2.86 reported by Mahdavi et al. (2020), achieved with an integrated AlN actuator-sensor stack; and 3.7 by Fairbairn and Moheimani (2012), achieved with an FPAA and a DMASP microcantilever.
The lower reduction factor observed in air, with values of 1.69 for QCair and 1.62 for QLVDair, reflects the dominance of viscous damping, which inherently limits the achievable relative Q reduction. The clear increase in effective damping under vacuum conditions, with values of 3.94 for QCvac and 3.55 for QLDVvac, confirms that the proposed feedback introduces an electrically tuneable damping mechanism for a controlled Q factor setting in high-Q resonant systems.
The present approach differs fundamentally from the referenced methods by employing a lock-in-based electrical feedback loop using an AlN-integrated cantilever, where only the real part of the impedance-related signal is fed back after compensating parasitic electrical contributions.
The use of two independent measurement principles – the electrical current through the AlN layer of the cantilever and the cantilever vibration recorded with the LDV – ensure a robust assessment of measurement errors and repeatability. The quality factors agree within less than 8.5 %, confirming that both methods consistently support the results. Representative fits and residuals show that the model accurately describes the data, with residuals centred around zero and no systematic trends.
The LDV, operated with a measurement range of 125 mm s−1 V−1, is capable of resolving displacements down to 2 nm, even without digital demodulation techniques. During the measurements, a minimum deflection of approximately 2.35 nm was observed in vacuum.
However, the feedback works well up to kfb≈10–2.5, as shown in Fig. 9; beyond this range, it tends to oscillate. Justified by the over-modulation of the excitation voltage, the amplitude spectrum shows a dip at the resonance frequency and the full dynamic range of the analogue auxiliary output of the lock-in amplifier cannot be utilized anymore. A deviation between the fitted functions of the electrical equivalent circuit and the optically captured frequency spectrum points at the limits of the current real-part feedback.
Regarding the effect of Q factor reduction on the signal-to-noise ratio (SNR), a decrease in Q inherently leads to a reduced oscillation amplitude and thus to a lower SNR. When the cantilever is operated in vacuum, the Q factor increases, resulting in an enhanced SNR. Applying feedback to actively reduce the Q factor correspondingly lowers the SNR, effectively restoring it to a level comparable to operation in air, with an additional contribution from the electronic noise of the feedback circuitry. For the development of a practical measurement system, both the SNR and the noise spectral density constitute critical parameters and must be taken into account. However, the primary focus of this work is the demonstration of the principle, and a detailed analysis of these aspects is deferred to future studies.
Regarding the influence of the Q factor on the scanning speed, the results reported by Karvinen and Moheimani (2014) serve as a reference. They demonstrated that reducing the Q factor from 221 to 56 doubled the scanning speed from 39.1 to 78.2 µm s−1. In the present work, Q factor reduction is expected to increase the achievable scanning speed accordingly. In our implementation, the oscillation shown in Fig. 9 reflects the absence of an advanced controller, and the dip near the resonance frequency in Fig. 7 is expected to generate artifacts in the scan image. These two issues limit the overall performance of the presented approach.
In this study, a frequency dependent proportional electrical feedback loop is presented to manipulate the excitation voltage for piezoelectric actuated resonantly operated MEMS cantilevers. In vacuum, the fundamental oscillation mode of a cantilever increases due to the absence of air damping. This results in an increased Q factor and a prolonged step response. To manipulate the Q factor, a feedback loop with a variable feedback factor is designed to reduce the step response in vacuum. The approach features a lock-in amplifier, which extracts the real part of the piezoelectrically induced current. The analogue auxiliary output of the latter quantity is used to reduce the excitation voltage via an analogue circuit. A reduction in the Q factor by a factor of 3.94 from initially 5235 (no feedback) to 1476 (maximum feedback) is realized and verified in vacuum with both LDV and electrical readout of the cantilever voltage. Simultaneously, the response time at a surface step decreases from 69 to 18 ms, which is similar in air. Despite this remarkable Q factor reduction in vacuum, the feedback is calculated from the real part of the cantilever voltage, while the frequency of the maximum mechanical vibration amplitude does not overlap with the frequency of the maximum amplitude. By careful evaluation of the real and imaginary part of the cantilever voltage, a precise control circuit could result in an even greater reduction in the Q factor. However, by simultaneously actuating the cantilever and measuring its oscillation amplitude, the cantilever's mechanical oscillation behavior can be tuned, resulting in a reduced response time for high-speed surface topography characterization. All in all, it is believed that these results will stimulate further efforts in this field, thus paving the way for vacuum applications, like AFM in SEM, with equivalent scanning duration as in air.
The data that support the findings of this study are available from the corresponding author upon reasonable request.
MF: conceptualization, data curation, formal analysis, validation, visualization, and writing (original draft, review, and editing). MS: supervision, validation, and writing (review and editing). US: funding acquisition, supervision, validation, and writing (review and editing).
At least one of the (co-)authors is a member of the editorial board of Journal of Sensors and Sensor Systems. The peer-review process was guided by an independent editor, and the authors also have no other competing interests to declare.
Publisher's note: Copernicus Publications remains neutral with regard to jurisdictional claims made in the text, published maps, institutional affiliations, or any other geographical representation in this paper. The authors bear the ultimate responsibility for providing appropriate place names. Views expressed in the text are those of the authors and do not necessarily reflect the views of the publisher.
This research has been supported by the Technology Agency of the City of Vienna (“Call from Science to Products 2013”, grant no. 1044801). The authors acknowledge TU Wien Bibliothek for financial support through its Open Access Funding Programme.
This paper was edited by Anita Lloyd Spetz and reviewed by two anonymous referees.
Adams, J. D., Erickson, B. W., Grossenbacher, J., Brugger, J., Nievergelt, A., and Fantner, G. E.: Harnessing the damping properties of materials for high-speed atomic force microscopy, Nat. Nanotechnol., 11, 147–151, https://doi.org/10.1038/nnano.2015.254, 2016.
Andany, S. H., Hlawacek, G., Hummel, S., Brillard, C., Kangül, M., and Fantner, G. E.: An atomic force microscope integrated with a helium ion microscope for correlative nanoscale characterization, Beilstein J. Nanotechnol., 11, 1272–1279, https://doi.org/10.3762/bjnano.11.111, 2020.
Butt, H.-J., Cappella, B., and Kappl, M.: Force measurements with the atomic force microscope: Technique, interpretation and applications, Surf. Sci. Rep., 59, 1–152, https://doi.org/10.1016/j.surfrep.2005.08.003, 2005.
Coskun, M. B., Alemansour, H., Fowler, A. G., Maroufi, M., and Moheimani, S. O. R.: Q Control of an Active AFM Cantilever With Differential Sensing Configuration, IEEE T. Control Syst. Technol., 27, 2271–2278, https://doi.org/10.1109/TCST.2018.2850338, 2019.
Dufour, I., Lochon, F., Heinrich, S., Josse, F., and Rebiere, D.: Effect of Coating Viscoelasticity on Quality Factor and Limit of Detection of Microcantilever Chemical Sensors, Sensors J. IEEE, 7, 230–236, https://doi.org/10.1109/JSEN.2006.888600, 2007.
Eaton, P. and West, P.: Atomic Force Microscopy, Oxford University Press, https://doi.org/10.1093/acprof:oso/9780199570454.001.0001, 2010.
Fahrbach, M., Ombati Nyang'au, W., Domanov, O., Schwalb, C. H., Xu, M., Li, Z., Kuhlmann, C., Brand, U., and Peiner, E.: Damped silicon microprobes for high-speed roughness measurements, in: MikroSystemTechnik Congress 2021, 1–4, ISBN 978-3-8007-5656-8, 2021.
Fairbairn, M. W. and Moheimani, S. O. R.: A Switched Gain Resonant Controller to Minimize Image Artifacts in Intermittent Contact Mode Atomic Force Microscopy, IEEE T. Nanotechnol., 11, 1126–1134, https://doi.org/10.1109/TNANO.2012.2216288, 2012.
Fairbairn, M. W., Moheimani, S. O. R., and Fleming, A. J.: Q Control of an Atomic Force Microscope Microcantilever: A Sensorless Approach, J. Microelectromech. Syst., 20, 1372–1381, https://doi.org/10.1109/JMEMS.2011.2168809, 2011.
Goeders, K. M., Colton, J. S., and Bottomley, L. A.: Microcantilevers: Sensing Chemical Interactions via Mechanical Motion, Chem. Rev., 108, 522–542, https://doi.org/10.1021/cr0681041, 2008.
Heath, G. R., Kots, E., Robertson, J. L., Lansky, S., Khelashvili, G., Weinstein, H., and Scheuring, S.: Localization atomic force microscopy, Nature, 594, 385–390, https://doi.org/10.1038/s41586-021-03551-x, 2021.
Hosseini, N., Neuenschwander, M., Peric, O., Andany, S. H., Adams, J. D., and Fantner, G. E.: Integration of sharp silicon nitride tips into high-speed SU8 cantilevers in a batch fabrication process, Beilstein J. Nanotechnol., 10, 2357–2363, https://doi.org/10.3762/bjnano.10.226, 2019.
Hui, L., Xue, Y., Huang, B., Yu, H., Zhang, C., Zhang, D., Jia, D., Zhao, Y., Li, Y., Liu, H., and Li, Y.: Overall water splitting by graphdiyne-exfoliated and -sandwiched layered double-hydroxide nanosheet arrays, Nat. Commun., 9, 5309, https://doi.org/10.1038/s41467-018-07790-x, 2018.
Karvinen, K. S. and Moheimani, S. O. R.: Modulated–demodulated control: Q control of an AFM microcantilever, Mechatronics, 24, 661–671, https://doi.org/10.1016/j.mechatronics.2013.11.011, 2014.
Khan, H., Samanta, S., Seth, M., and Jana, S.: Fabrication and photoelectrochemical activity of hierarchically Porous TiO2–ZnO heterojunction film, J. Mater. Sci., 55, 11907–11918, https://doi.org/10.1007/s10853-020-04858-2, 2020.
Kreith, J., Strunz, T., Fantner, E. J., Fantner, G. E., and Cordill, M. J.: A versatile atomic force microscope integrated with a scanning electron microscope, Rev. Sci. Instrum., 88, 053704, https://doi.org/10.1063/1.4983317, 2017.
Kucera, M., Manzaneque, T., Sánchez-Rojas, J. L., Bittner, A., and Schmid, U.: Q-factor enhancement for self-actuated self-sensing piezoelectric MEMS resonators applying a lock-in driven feedback loop, J. Micromech. Microeng., 23, 085009, https://doi.org/10.1088/0960-1317/23/8/085009, 2013.
Kucera, M., Wistrela, E., Pfusterschmied, G., Ruiz-Díez, V., Manzaneque, T., Hernando-García, J., Sánchez-Rojas, J. L., Jachimowicz, A., Schalko, J., Bittner, A., and Schmid, U.: Design-dependent performance of self-actuated and self-sensing piezoelectric-AlN cantilevers in liquid media oscillating in the fundamental in-plane bending mode, Sensors Actuat. B, 200, 235–244, https://doi.org/10.1016/j.snb.2014.04.048, 2014.
Mahdavi, M., Nikooienejad, N., and Moheimani, S. O. R.: AFM Microcantilever With a Collocated AlN Sensor-Actuator Pair: Enabling Efficient Q-Control for Dynamic Imaging, J. Microelectromech. Syst., 29, 661–668, https://doi.org/10.1109/JMEMS.2020.3011826, 2020.
Mahmoodi Nasrabadi, H., Mahdavi, M., and Moheimani, S. O. R.: Q Control of an AFM Microcantilever With Double-Stack AlN Sensors and Actuators, IEEE Sensors J., 22, 3957–3964, https://doi.org/10.1109/JSEN.2022.3141431, 2022.
Manzaneque, T., Hernando-García, J., Ababneh, A., Schwarz, P., Seidel, H., Schmid, U., and Sánchez-Rojas, J. L.: Quality-factor amplification in piezoelectric MEMS resonators applying an all-electrical feedback loop, J. Micromech. Microeng., 21, 025007, https://doi.org/10.1088/0960-1317/21/2/025007, 2011.
Miller, J. M. L., Ansari, A., Heinz, D. B., Chen, Y., Flader, I. B., Shin, D. D., Villanueva, L. G., and Kenny, T. W.: Effective quality factor tuning mechanisms in micromechanical resonators, Appl. Phys. Rev., 5, 041307, https://doi.org/10.1063/1.5027850, 2018.
Naeli, K. and Brand, O.: Dimensional considerations in achieving large quality factors for resonant silicon cantilevers in air, J. Appl. Phys., 105, 014908, https://doi.org/10.1063/1.3062204, 2009.
Qiu, H., Xiao, D., Feili, D., Wu, X., and Seidel, H.: Hydrodynamic analysis of piezoelectric microcantilevers vibrating in viscous compressible gases, Sensors Actuat. A, 238, 299–306, https://doi.org/10.1016/j.sna.2015.12.024, 2016.
Rodríguez, T. R. and García, R.: Theory of Q control in atomic force microscopy, Appl. Phys. Lett., 82, 4821–4823, https://doi.org/10.1063/1.1584790, 2003.
Rosa-Zeiser, A., Weilandt, E., Hild, S., and Marti, O.: The simultaneous measurement of elastic, electrostatic and adhesive properties by scanning force microscopy: pulsed-force mode operation, Meas. Sci. Technol., 8, 1333, https://doi.org/10.1088/0957-0233/8/11/020, 1997.
Ruppert, M. G. and Moheimani, S. O. R.: A novel self-sensing technique for tapping-mode atomic force microscopy, Rev. Sci. Instrum., 84, https://doi.org/10.1063/1.4841855, 2013.
Sandberg, R., Mølhave, K., Boisen, A., and Svendsen, W.: Effect of gold coating on the Q-factor of a resonant cantilever, J. Micromech. Microeng., 15, 2249, https://doi.org/10.1088/0960-1317/15/12/006, 2005.
Schubert, M., Gleichmann, A., Hemmleb, M., Albertz, J., and Köhler, J. M.: Determination of the height of a microstructure sample by a SEM with a conventional and a digital photogrammetric method, Ultramicroscopy, 63, 57–64, https://doi.org/10.1016/0304-3991(96)00028-9, 1996.
Sulchek, T., Hsieh, R., Adams, J. D., Yaralioglu, G. G., Minne, S. C., Quate, C. F., Cleveland, J. P., Atalar, A., and Adderton, D. M.: High-speed tapping mode imaging with active Q control for atomic force microscopy, Appl. Phys. Lett., 76, 1473–1475, https://doi.org/10.1063/1.126071, 2000.
Tavakoli, A., Lulla, K., Crozes, T., Mingo, N., Collin, E., and Bourgeois, O.: Heat conduction measurements in ballistic 1D phonon waveguides indicate breakdown of the thermal conductance quantization, Nat. Commun., 9, 4287, https://doi.org/10.1038/s41467-018-06791-0, 2018.