the Creative Commons Attribution 4.0 License.
the Creative Commons Attribution 4.0 License.
 | 09 May 2018
Field evaluation of a low-cost indoor air quality monitor to quantify exposure to pollutants in residential environments
Alejandro Moreno-Rangel
Tim Sharpe
Filbert Musau
Gráinne McGill
Measurements of temporal and spatial changes to indoor contaminant concentrations are vital to understanding pollution characteristics. Whilst scientific instruments provide high temporal resolution of indoor pollutants, their cost and complexity make them unfeasible for large-scale projects. Low-cost monitors offer an opportunity to collect high-density temporal and spatial data in a broader range of households.
This paper presents a user study to assess the precision, accuracy, and usability of a low-cost indoor air quality monitor in a residential environment to collect data about the indoor pollution. Temperature, relative humidity, total volatile organic compounds (tVOC), carbon dioxide (CO2) equivalents, and fine particulate matter (PM2.5) data were measured with five low-cost (“Foobot”) monitors and were compared with data from other monitors reported to be scientifically validated.
The study found a significant agreement between the instruments with regard to temperature, relative humidity, total volatile organic compounds, and fine particulate matter data. Foobot CO2 equivalent was found to provide misleading CO2 levels as indicators of ventilation. Calibration equations were derived for tVOC, CO2, and PM2.5 to improve sensors' accuracy. The data were analysed based on the percentage of time pollutant levels that exceeded WHO thresholds.
The performance of low-cost monitors to measure total volatile organic compounds and particulate matter 2.5 µm has not been properly addressed. The findings suggest that Foobot is sufficiently accurate for identifying high pollutant exposures with potential health risks and for providing data at high granularity and good potential for user or scientific applications due to remote data retrieval. It may also be well suited to remote and larger-scale studies in quantifying exposure to pollutants.
- Article
(2523 KB) - Full-text XML
- BibTeX
- EndNote


Increasingly strict energy efficiency requirements have severe implications for buildings and indoor air quality (IAQ) (Yu and Kim, 2012). IAQ is crucial for peoples' health as we spend between 80 and 90 % of our time inside buildings (Jones, 1999; Boyd, 2010) depending on the external weather conditions. Indoor air pollutants include carbon monoxide (CO), carbon dioxide (CO2), volatile organic compounds (VOCs), particulate matter (PM2.5 and PM10), and ozone (O3) among others (Berry et al., 1996; Crump et al., 2002). Exposure to these can exacerbate existing conditions such as sensory irritation and other respiratory problems (WHO, 2000, 2010) and even increase the risk of developing cancer (Carrer et al., 2008). Residents are usually unaware of indoor pollution as many pollutants are imperceptible to humans. For instance, 85 % of tobacco smoke is invisible to the human eye (Gee et al., 2013). It is necessary to monitor the quality of the indoor air to detect these pollutants and thus avoid the development of adverse health effects from inhaling pollutants. Accepted methods for measurements of indoor pollutants are based on filter-based gravimetric sensors or similar methods for particulate matter monitoring (Air Quality Expert Group, 2005), and infrared and photoionisation gas sensors (Chou, 2000). While accurate and precise, such technologies are expensive, time-consuming, and often provide little temporal information. Methods for personal dust, VOC and CO2 scientific monitors often provide high temporal resolution but are expensive (> GBP 3500.00) and therefore result in limited spatial information (White, 2009). Although analytical instruments often provide high temporal resolution, they are intended for laboratory use and their requirement for skilled operators, high purchase and maintenance costs, slow response time, and large size (Chou, 2000) make them impractical for IAQ studies (Kularatna and Sudantha, 2008). Moreover, the accuracy of these instruments may be considered excessive for large-scale IAQ monitoring, where a principal objective is to investigate the relative concentration of pollutants and their trends. As the performance of low-cost sensors improves, gas sensors that are compact, robust, and low-cost, with versatile applications, could be used as alternatives (Lee, 2001) for certain monitoring projects and could be used to collect larger datasets.
Technologies such as metal oxide (MOx) semiconductor sensors (Herberger et al., 2010; Kadosaki et al., 2010; Liu et al., 2012), light scattering (Tong et al., 2015) and tin oxide sensors (Watson, 1984; Postolache et al., 2009), open platforms (Ferdoush and Li, 2014; Ali et al., 2016), and wireless networks (Yu et al., 2013) have been adapted into low-cost monitors, and even allow remote monitoring (Kahkonen et al., 1997). New low-cost (< GBP 200) monitoring technologies may also help building occupants understand the quality of air indoors. Low-cost IAQ monitors often implement real-time monitoring and visualisation for smartphones and tablets to help inform the users (Hasenfratz et al., 2012). There is, however, limited information regarding the performance of low-cost monitors in practice. Nevertheless, many low-cost IAQ monitors such as Speck, Dylos DC1700 Pro (Manikonda et al., 2016) and Dylos DC1100Pro (Semple et al., 2013b) have been tested in laboratory conditions, and the results show a significant agreement with scientific instruments.
Table 1Manufacturer specifications and characteristics for the low-cost consumer monitors.
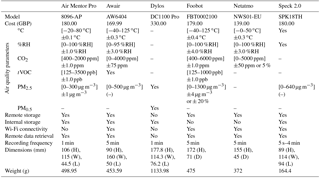
Low-cost IAQ monitor manufacturers often include sensors for temperature, relative humidity, carbon dioxide, particulate matter, and total volatile organic compounds (tVOC), as evidenced by the Foobot, Speck, Awair, and Air Mentor Pro devices (see Table 1 for manufacturer specifications). These low-cost IAQ monitors use microprocessors to collect sensor output, convert the data, and store or transmit data wirelessly to a remote server. Many of these devices may use the same or very similar sensors. However, manufacturers use a variety of algorithms to convert the sensor output to a concentration of each pollutant. This calibration protocol can have a marked impact on sensor precision, accuracy, and bias. For instance, the SHARP GPY1010AU0F, a PM2.5 sensor, was tested in laboratory conditions. It was found to be accurate; however, the study recommended that an improvement of the algorithm could enhance its performance (Wang et al., 2015). Another study evaluated the same sensor on a monitoring device using a different algorithm; the results showed better precision and linear response (Sousan et al., 2017).
The Dylos DC1700 showed a high agreement (R2= 0.90) with SidePak AM510 in controlled chamber experiments (Semple et al., 2013a). It was also tested to quantify second-hand smoke concentrations in residential settings, where a good agreement (R2= 0.86) to SidePak AM510 was observed (Semple et al., 2013b). Therefore, Dylos DC1700 particulate matter (PM) measurements have exhibited some agreement between fieldwork and laboratory results. Some limitations of this device include limited data storage (10 000 data points), lack of remote access capabilities, and lack of multisensory measurements, such as temperature or relative humidity. PM2.5 measurements from Speck SPK18TH, however, showed discrepancies between the environmental chamber and field measurements. The device demonstrated high agreement for determination of cigarette smoke (R2= 0.92) and Arizona test dust (R2= 0.96) under laboratory settings (Manikonda et al., 2016). However, the performance of Speck SPK18TH was found to be inadequate when tested at low concentrations against a scientific instrument in the field, both indoors (R2= 0.3) and outdoors (R2= 0.1–0.2), showing an overestimation of 200 % for indoor PM2.5, and 500 % for outdoor compared to the Grimm 1.109 (Zikova et al., 2017). The accuracy of PM2.5 measurements from the Foobot (FBT0002100) device has only been evaluated in laboratory measurements, which showed a strong correlation (r= 0.99 with a variation range of 5 to 8 %) with scientific instruments. Yet site-specific calibration may help to improve the accuracy of such sensors (Sousan et al., 2017).
The objective of this study is to evaluate the performance of the Foobot sensors, especially PM2.5 and tVOC, in typical residential settings. The linear relationship and bias for temperature, relative humidity, CO2, tVOC, and PM2.5 concentrations in a residential environment were assessed and compared to scientifically validated instruments (GrayWolf TG-502 TVOC, IQ-410, and PC-3016A). To the best of our knowledge, no study has yet evaluated the Foobot FBT0002100 sensors in field conditions. This paper compares the specifications of several low-cost IAQ monitors and explores in detail the components of the Foobot FBT0002100. Following this, indoor residential measurements from five Foobot FBT0002100 devices are compared to the GrayWolf instruments, and inter-device variances among the five Foobot devices are also analysed. Finally, field calibration equations are proposed to improve the accuracy of the Foobot FBT0002100 relative to the GrayWolf instruments.
A web-based search for low-cost, consumer, air pollutant monitors (available in the US and European markets) was performed in early 2016. The most popular low-cost IAQ monitors are presented in Table 1. The Foobot FBT0002100 device was selected for detailed evaluation based on criteria as suggested by Chou (2000):
-
availability (in the UK),
-
capable of being installed in residential locations,
-
remote connectivity and storage,
-
dustproof and water-resistant,
-
easy and minimal maintenance,
-
easy to operate (no skilled person required),
-
flexibility in data download,
-
good responsiveness and quality of technical support,
-
use of multisensory systems,
-
long-lasting,
-
low cost (< UK GBP 200, including equipment and software),
-
operationally stable,
-
remote access to data, and
-
rugged and corrosion resistant.
The Foobot was developed by AirBoxLab (Luxembourg) and measures five different air quality parameters with reference to maximum recommended values as defined by Foobot: PM2.5 (25 µg m−3), tVOC (300 ppb), CO2 (1300 ppm), temperature (40 ∘C), and relative humidity (RH, 60 %). The device mechanism is simple; a microprocessor collects the electrical outputs from the sensors and converts them into data, which are then transmitted wirelessly to a remote server, where an algorithm is applied to derive the measured concentrations. Data may be lost if the wireless signal is interrupted, as the Foobot does not have internal data storage. The manufacturer hosts a website where the data uploaded can be visualised and downloaded (https://partner.foobot.io/, last access: 14 January 2018), though a monthly subscription is required for this service. Accessing the data for free is possible. Nevertheless, the user needs to develop his or her software with an application programming interface (API) provided by AirBoxLab, which allows up to 250 daily data requests to the server. AirBoxLab has developed a calibration algorithm for its sensors, details of which are not available to the public (personal communication, Inouk Bourgon, 2016). Figure 1 shows the Foobot and the sensors inside of the device.
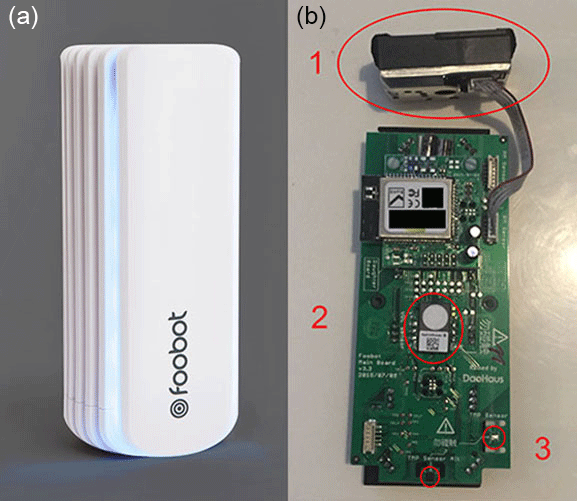
Figure 1Foobot FBT0002100 monitor (a) and Foobot Main Board 3.3 (b) showing the SHARP GP2Y1010AU0F (1), the iAQ-CORE-C (2), and SHT20 (3). (a) from https://foobot.io (last access: 22 November 2017).
Foobot uses the SHARP GP2Y1010AU0F sensor (Sharp Corporation, Japan) to measure PM2.5 which relies on natural convection to passively move air to the sensor, measuring particles with an aerodynamic diameter between 0.3 and 2.5 µm. The SHARP GP2Y1010AU0F was laboratory-tested with two similar low-cost sensors, and showed the highest agreement with the SidePak-measured concentration (R2= 0.9831 to 0.9838 in three different tests) and a higher sensitivity to smaller particles. The researchers suggested that the SHARP GP2Y1010AU0F could be enhanced by modifying the flow system and amending the algorithm for particle concentrations (Wang et al., 2015).
The Foobot tVOC sensor AMS iAQ-CORE-C (ams AG, Austria) measures a wide range of VOCs to predict tVOC (ppb). It lacks a CO2 sensor; however, an algorithm converts tVOC concentration as a CO2 equivalent (ppm). It has an Inter-Integrated Circuit (I2C) interface allowing the communication with the main chip. This sensor uses a micro-electro-mechanical system allowing the metal oxide sensor to measure VOC concentrations continuously at 1 s intervals (AMS, 2015). Equations convert the signal output from the sensor to values of tVOC and CO2 equivalents (equations described at the AMS iAQ-CORE-C manual (AMS, 2015, pp. 10–11). The AMS iAQ-CORE-C does not report absolute values for any particular gas, but instead indicates the relative change in levels of reducing gases such as CO and a wide range of VOCs (Brown, 2017). This sensor has been used to control environmental monitoring systems (Kim et al., 2017) and smart health applications (Chan et al., 2017).
The Foobot temperature and relative humidity sensor is the SENSIRION SHT20 (Sensirion, Switzerland) with an I2C interface (see SENSIRION, 2014 for more information). This sensor has been on the market since May 2009 and has been widely accepted as a low-cost sensor for temperature and humidity. Since then, it has been used for smart home applications (Hernandez et al., 2014), for weather condition observation systems (An and Kang, 2014), and to control mechanical ventilation with heat recovery systems (Matsuoka and Fisher, 2017).
Table 2Manufacturer specifications and characteristics for the GrayWolf instruments.
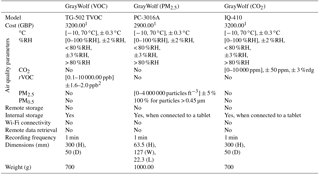
1 Require additional software (∼ GBP 1200.00) and a tablet (> GBP 500.00). 2 Isobutylene equivalent.
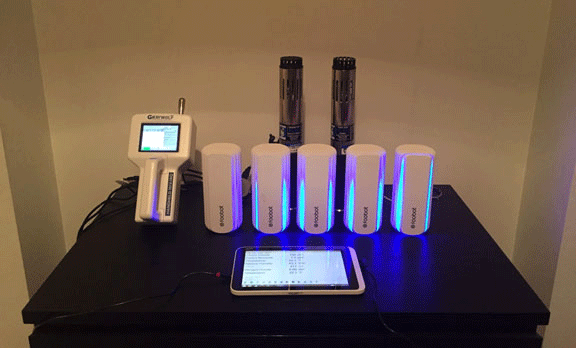
The study was undertaken following the guidelines of the ASTM D72974-14 Standard Practice for Evaluating Residential Indoor Air Quality (ASTM, 2014). The monitors were located at an approximate height of 0.90 m over the top of a drawer. Care was taken to ensure the monitors were placed away from direct pollutant sources, heat sources (such as cookers or radiators), and ventilation ducts or openings. Given the nature of the measurements and the desire to ensure that “typical” conditions were achieved, it was not possible to position the monitors in the centre of the room (see Fig. 2).
This study tests the accuracy of Foobot FBT0002100 temperature, relative humidity, particulate matter, and tVOC measurements by comparing the measurements of five Foobot FBT0002100 devices to measurements from the GrayWolf TG-502 TVOC, IQ-410, and PC-3016A. Table 2 shows the specification for the GrayWolf instruments. The monitors were set to measure simultaneously at 5 min intervals for 81 h 25 min (from 28 August 23:50 LT to 1 September 2017 11:25 LT) in an occupied bedroom (floor area 10.5 m2) of a modern flat in Glasgow, UK. The occupancy levels and activities were recorded by the occupants in a diary and this was used to contextualise the data, to ensure that typical conditions were represented, but this information was not used in the statistical analysis.
Statistical analysis
Data from each monitor were exported into Microsoft Excel for initial data inspection and to IBM SPSS Statistics for statistical analysis. The 5 min data pairs (n= 4895 for each measure) across the study were assigned to either a calibration dataset (n= 2448 for each measure) or a validation dataset (n= 2449 for each measure). The Kolmogorov–Smirnov test rejected the hypothesis of normal distribution. Data were measured at intervals and were found to have a monotonic relationship. Therefore, Spearman's rank-order correlation (rs) was applied to determine the correlation between the variables from each of the paired devices. This indicates the association from one device to another. The closer rs is to unity, the more positive and direct is the association between devices. Correlations from 0.3 to 0.5 are considered as low positive (weak) correlation, 0.5 to 0.7 are considerate as a moderate (acceptable) positive correlation, from 0.7 to 0.9 as a high positive (strong) correlation and 0.9 to 1.00 as a very high positive association (very strong) (Mukaka, 2012).
The uniformity of data from different Foobot FBT0002100 was also determined by a Spearman's rank-order correlation. Additionally, to compare the differences between each of the measurements among the five different Foobot FBT0002100 monitors, the Kruskal–Wallis test, a nonparametric test, was applied to determine if there were statistically significant differences between them.
A regression analysis was performed to improve the accuracy of the Foobot FBT0002100 data relative to the GrayWolf data. Field calibration equations were then produced from the calibration dataset using the results from the GrayWolf instruments as dependent variables and the Foobot FBT0002100 as independent variables and tested on the validation dataset. An analysis in SPSS of the linear, quadratic, and cubic models was performed individually for each parameter to find the most accurate equation. A Bland–Altman analysis was then performed on the validation dataset to examine the correlation and agreement between data generated by the calibration equation and data obtained by the GrayWolf instruments. The Bland–Altman method calculates the mean difference between two methods of measurement (the “bias”), and 95 % limits of agreement from the mean difference (1.96 SD) (Myles and Cui, 2007). From this process, a Bland–Altman plot (or difference plot) can be generated as a graphical method of comparing two measurements of the same variable.
Measurement of the extent to which data collectors (raters) assign the same score to the same variable is called interrater reliability. The interrater reliability of the agreement between the data generated by the calibration equation and the data from the GrayWolf instruments was tested using the Cohen's κ test to account for the possibility of agreement happening by chance; the closer that κ is to 1.00 the better agreement it has.
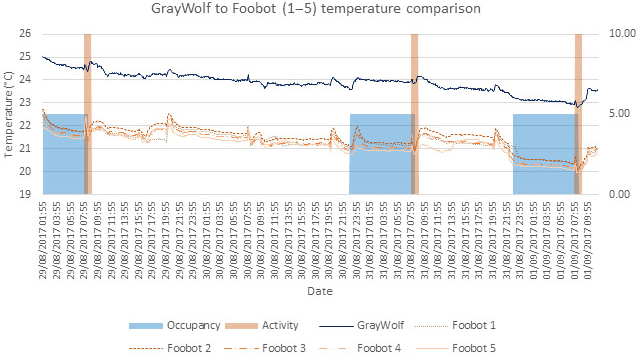
Figure 3Temperature levels from 29 August to 1 September 2017 form the Foobot and GrayWolf instruments. (Activity describes the morning routine: showering, grooming, and changing.)
4.1 Inter-sensor analysis of low-cost and scientific IAQ monitors
The measurements from the five Foobot FBT0002100 monitors were compared to those from the GrayWolf IQ-410, TG-502 TVOC, and PC-3016A. The results showed that the temperature measurements were very strongly related (rs= 0.833 to 0.926, p < .001). Despite this, analysis of the temperature data showed that the Foobot FBT0002100 underestimated temperature (mean (M)= 2.59 ∘C, 95 % confidence interval from 2.40 to 2.73 ∘C; Fig. 3). Knowledge of inter-sensor variability is important for the reliability of sensors in practice. Analysis of the temperature data from the five Foobot FBT0002100 monitors identified a very significant uniformity (rs= 0.833 to 0.926, p < .001) and low variability (M= 0.16 ∘C, from 0.16 to 0.33 ∘C) between the different temperature sensors.
Table 3Summary statistics for tVOC calibration dataset divided by instruments.
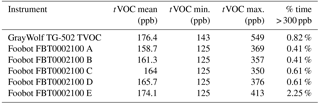

Figure 4Relative humidity levels from 29 August to 1 September 2017 form the Foobot and GrayWolf instruments. (Activity describes the morning routine: showering, grooming, and changing.)
A very strong relationship (rs= 0.935 to 0.948, p < .001) was observed for relative humidity measurements from the five Fooboot FBT0002100 and the GrayWolf monitors. Very low variability was observed between Foobot and GrayWolf monitors, given that the Foobot FBT0002100 underestimated the relative humidity levels by 0.01 %RH (from −0.78 to 1.08 %RH, Fig. 4). Inter-sensor analysis between the five Foobot monitors showed a very strong uniformity (rs= 0.985 to 0.991, p < .001) and low variability (M= 0.52 %RH, from −1.86 to 0.75 %RH) of the relative humidity sensor.
Analysis of the tVOC measurements from the five Foboot monitors and the GrayWolf TG-502 TVOC showed a significant relationship (rs= 0.827 to 0.869, p < .001). A very low variability between the five Foobot monitors was observed, but the Foobot underestimated the tVOC levels by 22.12 ppb (from 12.79 to 28.20 ppb, Table 3, Fig. 5). Inter-sensor analysis between the five Foobot monitors showed a very strong uniformity (rs= 0.892 to 0.974, p < .001) and low variability (M= −7.05 ppb, from −15.43 to −1.67 ppb) between the different tVOC sensors.
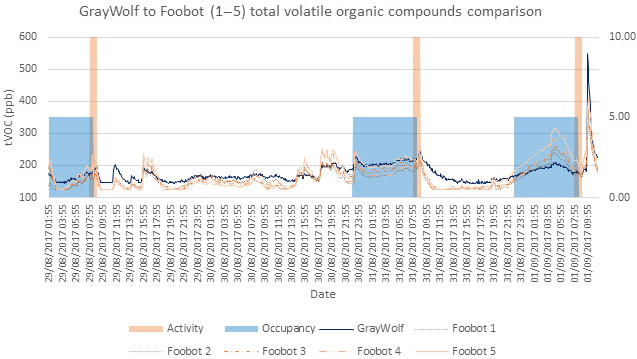
Figure 5Total volatile organic compound levels from 29 August to 1 September 2017 form the Foobot and GrayWolf instruments. (Activity describes the morning routine: showering, grooming, and changing.)
Table 4Summary statistics for CO2 calibration dataset divided by instruments.
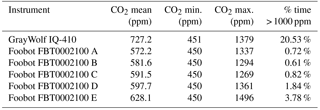
Analysis of the CO2 (equivalent from tVOC) data from the Foobot monitors and the GrayWolf IQ-410 showed that the Foobot CO2 levels differed from those measured by the GrayWolf instrument. A weak but significant correlation (rs= 0.397 to 0.525, p < .001) was observed. The Foobot monitors underestimated the CO2 concentrations (M= 147.08 ppm, from 99.08 to 155.00 ppm, Fig. 6), a factor which could lead to problems in assessing ventilation based on CO2 levels. The percentage of time CO2 > 1000 ppm was considerably different between the GrayWolf IQ-410 and the five Foobot monitors (Table 4). Inter-sensor analysis of the five Foobot monitors showed a very strong uniformity (rs= 0.892 to 0.973, p < .001) and a low variance (M= 25.54 ppm, from 5.99 to 55.92 ppm) between the different CO2 measurements.
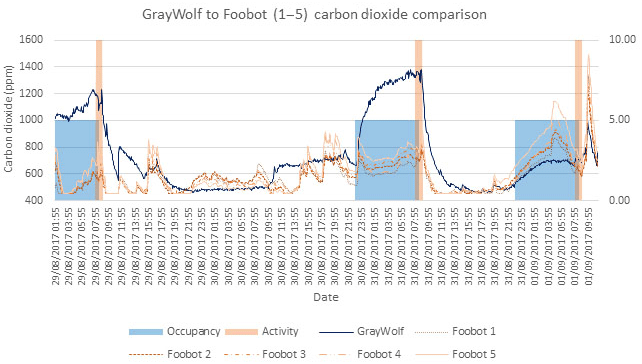
Figure 6Carbon dioxide levels from 29 August to 1 September 2017 form the Foobot and GrayWolf instruments. (Activity describes the morning routine: showering, grooming, and changing.)
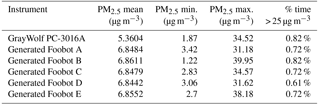
Table 5Summary statistics for PM2.5 calibration dataset divided by instruments.
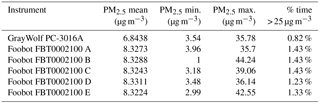
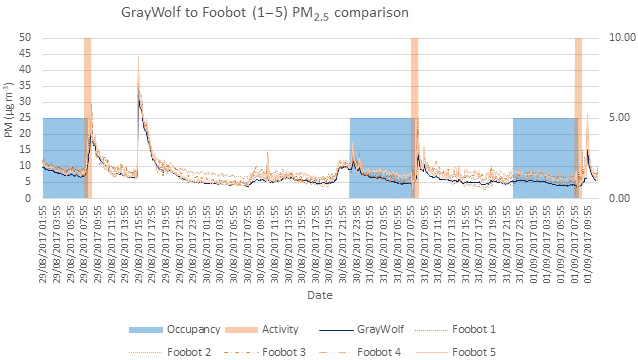
Figure 7PM2.5 levels from 29 August to 1 September 2017 form the Foobot and GrayWolf instruments. (Activity describes the morning routine: showering, grooming, and changing.)
PM2.5 measurements from the five Foobot monitors and the GrayWolf PC-3016A were significantly related (rs= 0.787 to 0.866, p < .001) to each other. Despite this, analysis of the data showed that the Foobot overestimated PM2.5 concentrations (M= −1.4826 µg m−3, from −1.4783 to −1.4870 µg m−3, Table 5, Fig. 7). A higher degree of agreement between the types of devices is addressed in the following section. Inter-sensor analysis of the five Foobot monitors showed that there was an acceptable uniformity (rs= 0.576–0.843 p < .001) and a low variance (M= −1.4826 µg m−3 from −0.0068 to 0.0084 µg m−3) between the different PM2.5 sensors.
4.2 Relationship between the GrayWolf and Foobot monitors
4.2.1 Total volatile organic compounds (tVOC)
The results from the tVOC measurements showed that Foobot FBT0002100 underestimated tVOC concentrations. Figure 8 shows the relationship between the GrayWolf TG-502 TVOC and Foobot FBT0002100 tVOC concentrations from the calibration dataset used to generate a regression equation. The best fit produces an R2 value of 0.697 and the equation generated by regression is
where tVOC is the concentration (ppb). Figure 9 shows the Bland–Altman plot comparing the GrayWolf tVOC measurements with that estimated from the Eq. (1) for the dataset from the five Foobot validations. It shows the mean between the GrayWolf and the Foobot tVOC generated measurements (−0.0148 ppb with limits of agreement of −36.7935 to 36.7639 ppb at a 95 % confidence interval). A total of 80 (3.26 %) of the data points were outside of the limit of agreement (51 above the upper limit and 29 below the lower limit). This range is significantly lower than 300 ppb (the World Health Organization, WHO, threshold for tVOC; Koistinen et al., 2008). The plot shows that Foobot FBT0002100 underestimated the concentrations at high concentrations (> 300 ppb). A comparison between the tVOC concentrations from the GrayWolf TG-503 TVOC and the Foobot tVOC generated showed indoor air quality information that has a very good agreement. The number of data points on which the tVOC concentration values exceeded the 300 ppb is within ±0.71 % as observed in Table 6. The agreement of the data points from the calibration and validation datasets were also corroborated. Both showed a very good agreement on the concentrations above 300 ppb: on the calibration dataset, a κ of 0.75, and on the validation dataset, a κ of 0.85.
Table 6Summary statistics for the generated tVOC from the validation dataset divided by instruments.
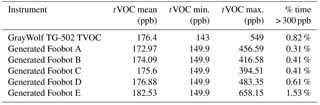
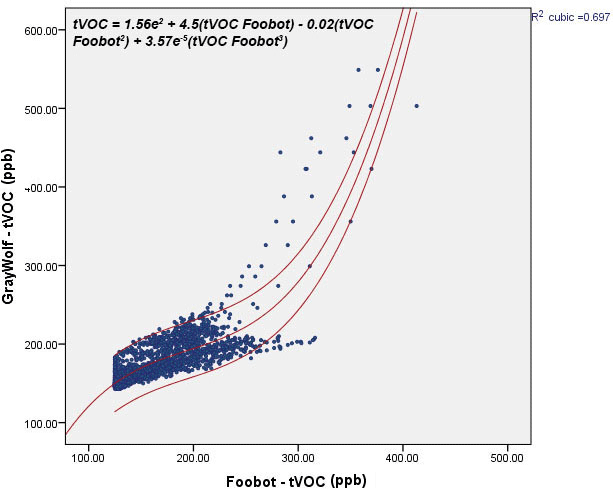
Figure 8Scatter plot of the 5 min tVOC concentration measured using the Foobot FBT0002100 and the GrayWolf TG-502 TVOC from the calibration dataset.
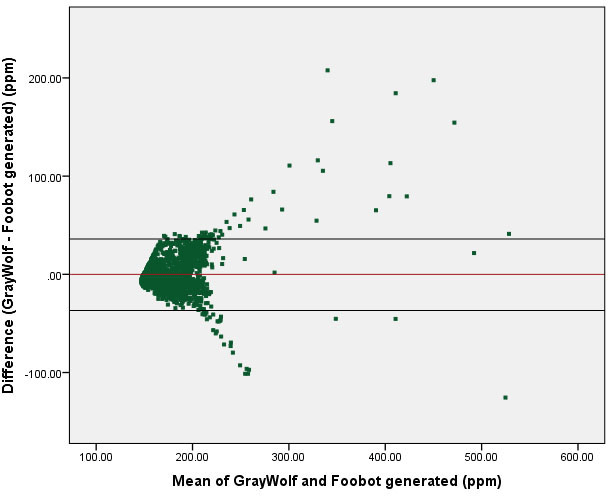
Figure 9Bland–Altman plot of the agreement between the GrayWolf TG-502 TVOC and the Foobot-generated tVOC concentrations.
4.2.2 Carbon dioxide (CO2)
The results from the CO2 measurements showed a weak correlation as the CO2 concentrations were underestimated. Figure 10 shows the relationship between the GrayWolf IQ-410 and Foobot FBT0002100 CO2 concentrations from the calibration dataset used to generate the regression equation. The best fit produces an R2 value of 0.180 and the equation generated by regression is
where CO2 is the concentration in ppb. Figure 11 shows the Bland–Altman plot comparing the GrayWolf CO2 measurements with those estimated from the Eq. (2) to the five Foobot validation datasets. It shows the mean difference between the GrayWolf and the Foobot CO2 generated measurements (4.1149 with limits of agreement of −457.453 to 465.683 ppm at a 95 % confidence interval). A total of 152 (6.21 %) of the data points were outside of the limits of agreement (152 above the upper limit). This range is almost equal to the 1000 ppm (the ASHRAE threshold for CO2 ASHRAE, 2007). A comparison between the CO2 concentrations and the Foobot CO2 generated to produce information about the ventilation rates showed that there was a poor agreement between them. The number of data points on which the CO2 concentration values exceed the 1000 ppm was significantly different from the GrayWolf instruments to those generated by the Eq. (2) as shown in Table 7. The agreement of the data points from the calibration and validation datasets was also corroborated. Both showed a complete disagreement on the concentrations above 1000 ppm: on the calibration dataset, a κ of 0, and on the validation dataset, a κ of 0.
Table 7Summary statistics for the generated CO2 from the validation dataset divided by instruments.
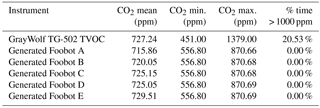
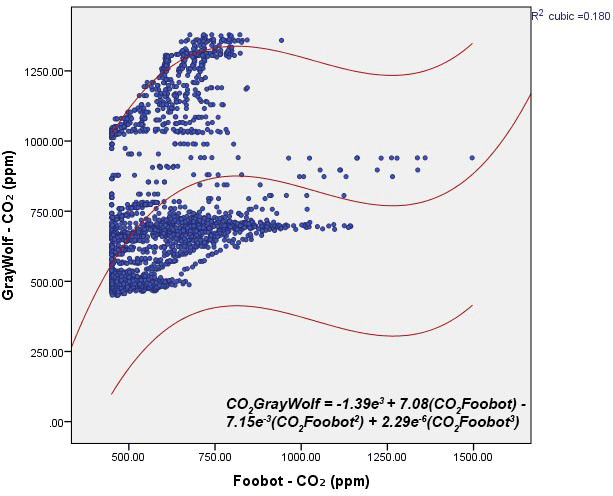
Figure 10Scatter plot of the 5 min CO2 concentration measured using the Foobot FBT0002100 and the GrayWolf IQ-410 from the calibration dataset.

Figure 11Bland–Altman plot of the agreement between the GrayWolf IQ-410 and the Foobot-generated CO2 concentrations.
Table 8Summary statistics for the generated PM2.5 from the validation dataset divided by instruments.
4.2.3 Particulate matter 2.5 µm (PM2.5)
The results from the PM2.5 measurements showed that Foobot was overestimating particle matter concentrations. Figure 12 shows the relationship between the GrayWolf PC-3016A and Foobot FBT0002100 PM2.5 concentrations from the calibration dataset used to generate the regression equation. The best fit produces an R2 value of 0.887 and the equation generated by regression is
where PM2.5 is the mass concentration (µg m−3). Figure 13 shows the Bland–Altman plot comparing the GrayWolf PM2.5 measurements with those estimated from Eq. (3) to the five Foobot validation dataset. It shows the mean difference between the GrayWolf and the Foobot tVOC generated measurements (−0.0137 with limits of agreement of −2.32 to 2.29 µg m−3 at a 95 % confidence interval). A total of 100 (4.08 %) of the data points were outside of the limit of agreement (58 above the upper limit and 42 below the lower limit). This range is significantly lower than 25 µg m−3 (the WHO threshold for PM2.5; WHO, 2000). A comparison between the PM2.5 concentrations and the Foobot PM2.5 generated to produce indoor air quality information showed that there was a very good agreement between them. The number of data points on which the PM2.5 concentration values exceeded the 25 µg m−3 was within ±0.21 % as observed in Table 8. The agreement of the data points from the calibration and validation datasets was also corroborated. Both showed a very good agreement on the concentrations above 25 µg m−3: on the calibration dataset, a κ of 0.9, and on the validation dataset, a κ of 0.85.
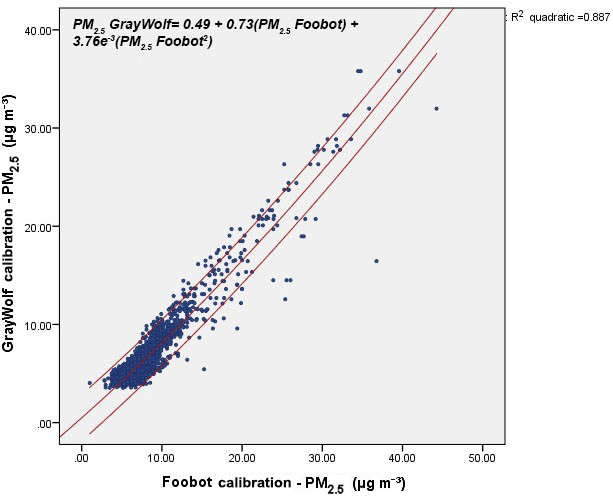
Figure 12Scatter plot of the 5 min PM2.5 concentration measured using the Foobot FBT0002100 and the GrayWolf PC-3016A from the calibration dataset.
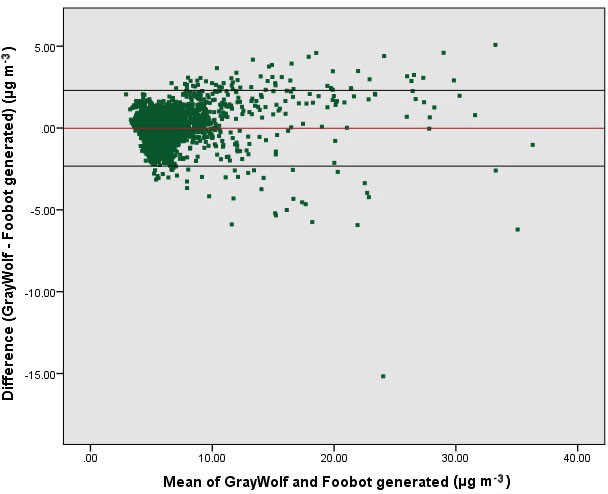
Figure 13Bland–Altman plot of the agreement between the GrayWolf PC-3016A and the Foobot-generated PM2.5 concentrations.
Measurements of temporal and spatial changes of indoor contaminant concentrations are vital to gain an in-depth understanding of pollutant characteristics, particularly in dynamic, spatially variable environments such as the home. While scientific instruments can provide high temporal resolution of indoor pollutants such as PM2.5, PM10, and tVOCs, the cost and complexity of these instruments renders monitoring of spatial and temporal changes on a large-scale prohibitively difficult.
This work tries to find a more affordable and suitable instrument to provide indoor air quality information, which may also enable simultaneous monitoring of different rooms within the same home. However, it might also facilitate more extensive indoor air quality monitoring projects looking to characterise pollution and identify potential health risks in indoor building environments with much larger and more statistically significant datasets. A previous experiment in a controlled chamber showed that the monitor could be used to provide mass concentrations of PM2.5 (Sousan et al., 2017), but this is the first study to evaluate the accuracy of all measurements (temperature, relative humidity, tVOC, CO2, and PM2.5) of the Foobot FBT0002100 in real-life residential settings, producing more than 4800 data points.
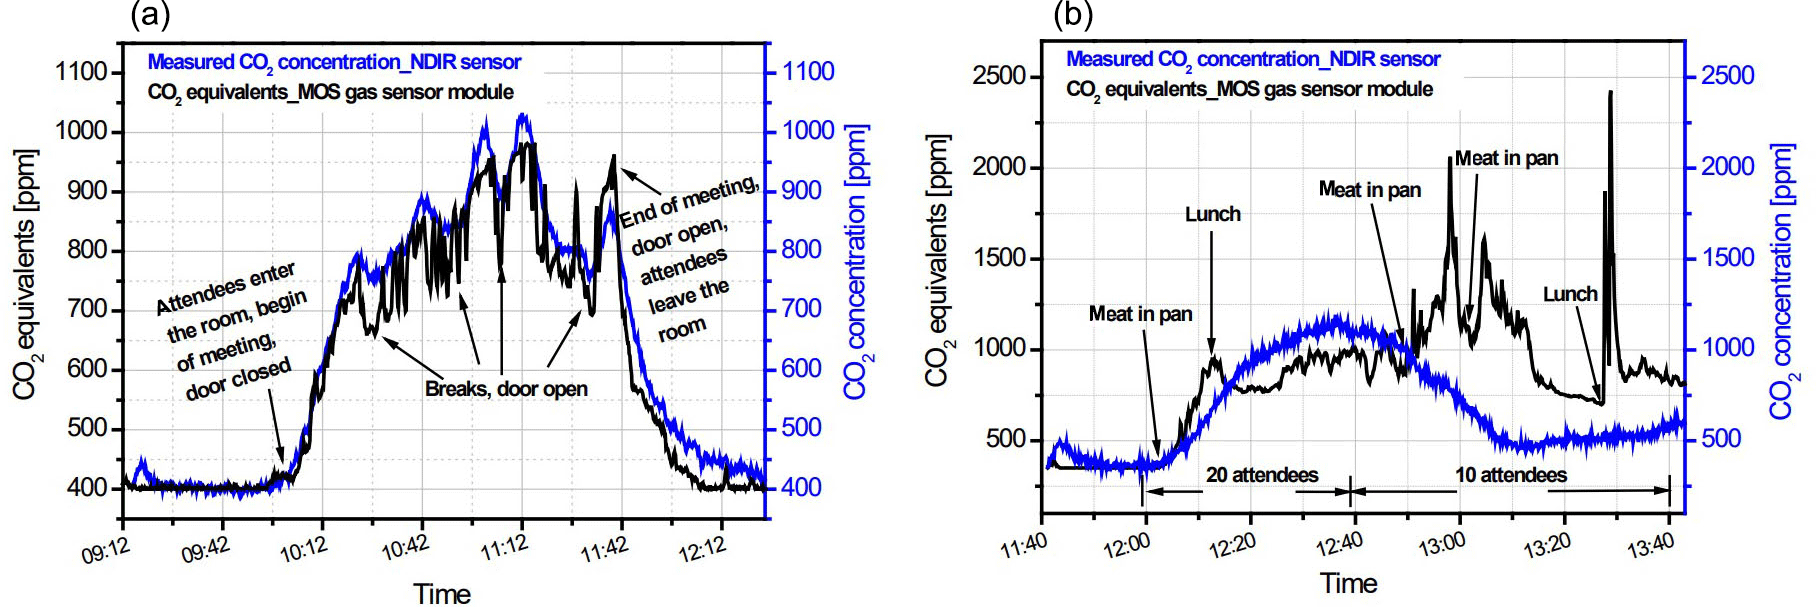
Figure 14The graphics compares the real CO2 measurements vs. CO2 equivalents from tVOC of a previous study. Real CO2 (in blue) and CO2 equivalent from tVOC (in black) in a meeting room (a) and kitchen (b). Source: Ulmer and Herberger (2012).
Calibration equations for the site were calculated as suggested by Sousan et al. (2017). The equations generated may be influenced by domestic pollution (i.e. pollutants from paint, cleaning, and personal care products; household dust, outdoor air, and cooking fumes). The density and features of such contaminants will be different depending on the household. Hence, the response of the instruments like GrayWolf PC-3016A, TG-502 TVOC, IQ-410, and Foobot FBT0002100 may vary in real-life homes, depending on this and other factors such as monitor location, temperature, and humidity. Therefore, to provide the most accurate measurements, an individual calibration equation could be provided for each Foobot FBT0002100. This, however, may not be possible in large-scale and remotely deployable projects. A better alternative for large-scale projects may be to produce a calibration equation for a large set of monitors for each setting (i.e. bedroom, kitchen, and living room). Then, in order to reduce the bias of inter-Foobot differences, use three monitors within the same space and use the mean from the monitors in each room to provide a more robust measurement. This alternative provides not only higher accuracy than the application of a calibration equation, but the redundancy of the acquired data from several monitors also provides higher confidence and robustness to the dataset.
The validation results showed that there was a very good agreement between the GrayWolf PC-3016A/TG-502 TVOC/IQ-410 and the Foobot FBT0002100 with regard to temperature and humidity, and to tVOC and PM2.5 when the regression equations were applied. The CO2 concentration levels were not accurate as the Foobot FBT0002100 instrument does not possess a real CO2 sensor, but instead provides a CO2 equivalent from the tVOC levels as an indication. Differences between CO2 levels from the GrayWolf IQ-410 and the Foobot are clear in Fig. 6. While the GrayWolf IQ-410 uses non-dispersive infrared spectroscopy technology to determine CO2 concentrations, the Foobot uses an algorithm to convert tVOC to CO2 equivalents, providing misleading measurements. The differences in the measurements were expected since CO2 and tVOC are different chemicals and have different sources and compositions. CO2 concentrations in indoor environments have long been used as an indicator of ventilation (ASHRAE, 2007). Levels of CO2 correlate to human activities and occupancy (Porteous, 2011) but are not related to sources of pollution such as off-gassing from building materials or furniture (Brown et al., 1994) as it is the case for tVOC. The implementation of the algorithm to predict CO2 is relatively new, and the theory behind it debates that tVOC can be correlated proportionally to CO2 production providing CO2- and tVOC-related events at the same time (Herberger et al., 2010). In other words, the algorithm attempts to relate tVOC to CO2 concentrations in indoor spaces where no human activity takes place (Ulmer and Herberger, 2012). Most of the studies to correlate CO2 equivalents to tVOC have been carried out in schools, offices, meeting rooms, and home environments. For example, Fig. 14 (Ulmer and Herberger, 2012) compares the CO2 equivalents calculated from tVOC to CO2; the left graphic shows a strong correlation in a meeting room, whereas the right graphic show signals that can be attributed to tVOC but differ from CO2. Implications of this approach may include misleading CO2 readings that may confuse many new to the IAQ industry; however, it provides the possibility to add the sensor output to ventilation standards (Herberger et al., 2010) and implement it for ventilation systems reducing the energy consumption compared to time-scheduled ventilation (Ulmer and Herberger, 2012). However, this approach has only recently been developed and additional development of IAQ modules is needed (Ulmer and Herberger, 2012), especially in residential environments. AirBoxLab opted for the iAQ-CORE-C sensor to provide tVOC concentrations and an idea of CO2 instead of real CO2 measurements for two main reasons. First, they believed that tVOC measurements are more important to evaluate IAQ as the health impacts of higher levels of tVOC are usually more severe than those from CO2; second, the additional cost for the CO2 sensor may increase the price for the Foobot (personal communication, Jacques Touillon, 2016).
About 3.2 % of the tVOC measurements and 4.1 % of PM2.5 were outside of the limits of agreement when an upper and lower bound of 1.96 standard deviation (SD) of the difference was applied. There is, however, a concern as to whether or not the 1.96 SD limits are appropriate to assess the impact of pollution on human health (Bland and Altman, 2010). For this reason, the 1.96 SD was transformed into pollution concentrations to ensure these bounds were either the same as or lower in range than those thresholds set by the WHO, which resulted in tighter ranges. The 1.96 SD for PM2.5 resulted in a range from −2.3245 to 2.2971 µg m−3 (±2.2932 µg m−3 from the mean) and from −36.7935 to 35.9668 ppb for tVOC (±36.5920 ppb from the mean). The examination of the instruments to produce indoor air quality information reinforced this conclusion, as the quantitative information provided by the different instruments demonstrated high agreement. Variability between the percentage of time above threshold values determined using data from the Foobot and the GrayWolf monitors was generally small and was considered to be unlikely to produce major changes in indoor air quality assessments.
The findings show that the Foobot FBT0002100 provided sufficiently accurate results for an evaluation of the IAQ in occupied dwellings and that the information provided could identify trends and exposures above thresholds within a small margin of error. As the Foobot does not make any noise or emit light, it could be used to perform simultaneous measurements of the indoor environment inside homes, including sensitive spaces such as bedrooms. This should minimise changes in participants' behaviour in response to their awareness of being observed, minimising the Hawthorne effect (Landsberger and Ithaca, 1958) and the risk of occupants disconnecting the monitors. Moreover, the cost, size, mobility, and easy deployment of the Foobot FBT0002100 combined with its accuracy make it a useful tool to evaluate occupant pollutant exposure in research and large-scale monitoring campaigns which could collect high-density temporal and spatial data on indoor pollutant concentrations in a wide range of households at local, regional, and national levels. This information could be used to acquire more comprehensive information on indoor pollutant concentrations to better understand temporal and spatial changes and pollutant-activity relationships in the home.
This study suffers from some identifiable limitations. Firstly, there was no comparison or control group in an environmental chamber. Environmental chamber experiments would include the use of calibration gases and aerosols, allowing comparison with a wider range of highly accurate instruments. However, the purpose of this study was to evaluate the intended purpose of low-cost consumer monitors in field conditions, as an experiment in a controlled environment has been published already. Secondly, it was assumed that GrayWolf PC-3016A/TG-502 TVOC/IQ-410 provided accurate temperature, humidity, CO2, CO, VOCs, and PM2.5 concentrations. While the devices were tested and calibrated by the manufacturer a month before this study, this still represents a potential error. Thirdly, we assumed that the monitors were left in place throughout sampling. We asked the participants not to handle the devices, but the light and noise produced by the GrayWolf instruments might cause occupants to relocate it; however, there was no evidence that the monitors were relocated.
Further work will examine the variability of Foobot devices and explore the influence of temperature and humidity on their response to air pollutants, especially to PM2.5. Other research may study the use of low-cost monitoring devices as IAQ educational tools for home users, looking at the behavioural changes towards IAQ.
Recently there has been an increase in interest in understanding the effects of indoor air pollution on human health. Traditional analytical instruments are impractical, costly, and often their accuracy is much higher than needed to assess indoor pollution levels. Several low-cost consumer monitors provide information about the quality of indoor air. Therefore, it is considered useful to assess their accuracy in environmental chamber and field experiments to evaluate their utility and accuracy. The Foobot FBT0002100 offers a relatively low-cost and straightforward solution to deliver households' air quality information that may be used to gather large-scale household IAQ data and also to motivate occupants to reduce the potential harm of indoor pollution. It also has the potential to examine the impact of increased occupant awareness of IAQ on ventilation and pollution-related behaviours.
The Foobot FBT0002100 was found to have a significant agreement with the GrayWolf instruments, for temperature (rs= 0.832–0.871), relative humidity (rs= 0.935–0.948), tVOC (rs= 0.827–0.869), and PM2.5 (rs= 0.787–0.866) data. The temperature was found to be underestimated by 2.59 ∘C. The calibration equations produced for tVOC (R2= 0.697) and PM2.5 (R2= 0.887) reduced variability between the monitors and improved their accuracy when compared to the GrayWolf instruments. Foobot's lack of a specific CO2 sensor estimated misleading concentrations. However, results showed that this does not impact the accuracy of the other sensors. Therefore, Foobot can be used for studies where ventilation is not an indispensable metric for the research, but it can be complemented by another CO2 sensor.
The findings suggest that low-cost monitors, such as the Foobot FBT0002100, have the potential to identify high pollutant exposures and to provide high-density, reliable, temporal data at high granularity. Its characteristics, such as remote data retrieval as well as its accuracy, make Foobot a useful tool to evaluate occupant pollutant exposure at a large-scale and longer timescales in occupied dwellings, compared to current approaches. However, as discussed, the use of several units within the same space and with a calibration equation may improve the overall performance of the monitor.
This study is part of a PhD investigation. Access to the data may be possible upon written request to the main author.
The manufacturer of the air quality monitor tested in 2016/17 (Foobot) subsequently offered discounted devices to enable further research. This offered was accepted only after the review of the device was concluded in order to maintain authorial independence.
We would like to thank all those who took part in this study, especially
Janice Foster and Anna Poston for providing technical support for the use of
the monitoring devices. Thanks are given to Adam Hotson and Ian Faller, who offered useful
editing and proofreading of an earlier version of this paper.
CONACyT partially funded this study as part of a PhD scholarship to the main
author.
Edited by: Rosario Morello
Reviewed by: three anonymous referees
Air Quality Expert Group: Methods for monitoring particulate concentrations, in: Particulate Matter in the United Kingdom, 1st Edn., London, Defra, 125–154, 2005.
Ali, A. S., Zanzinger, Z., Debose, D., and Stephens, B.: Open Source Building Science Sensors (OSBSS): A low-cost Arduino-based platform for long-term indoor environmental data collection, Build. Environ., 100, 114–126, https://doi.org/10.1016/j.buildenv.2016.02.010, 2016.
AMS: iQA-CORE datasheet, AMS, available at: http://ams.com/eng/Products/Environmental-Sensors/Air-Quality-Sensors/iAQ-core-C (last access: 29 August 2017), 2015.
An, M. S. and Kang, D.: Development of Weather Condition Observation System for Wind Turbine Based on Integrated Sensor Module Gateway, in: Advanced Science and Technology Letters, 51, 238–241, 2014.
ASHRAE: ASHRAE standard 62.1-2007 Ventilation for Acceptable Indoor Air Quality, Atlanta, GA, 2007.
ASTM: ASTM Volume 11.07 Air Quality – D7297-14, Standard Practice for Evaluating Residential Indoor Air Quality, 2014.
Berry, R., Crump, D., Brown, V., and Coward, S. K. D.: Indoor air quality in homes, part 1, 1st Edn., Watford, BRE press, 1996.
Bland, J. M. and Altman, D. G.: Statistical methods for assessing agreement between two methods of clinical measurement, Int. J. Nurs. Stud. 47, 931–936, https://doi.org/10.1016/j.ijnurstu.2009.10.001, 2010.
Boyd, D. R.: Dodging the Toxic Bullet, how to Protect Yourself from Everyday Environmental Health Hazards, 1st Edn., Vancouver, Greystone Books, 2010.
Brown, N.: Technical article – New small, low-power MOX VOC sensors: how might they be used for indoor air quality monitoring?, AMS, avaliable at: http://ams.com/eng/Support/Technical-Papers/VOCs-and-IAQ, last access: 29 August 2017.
Brown, S. K., Sim, M. R., Abramson, M. J., and Gray, C. N.: Concentrations of volatile organic compounds in indoor air–a review, Indoor Air, 4, 123–134, 1994.
Carrer, P., Fanetti, A. C., Forastiere, F., Holcatova, I., Molhave, L., Sundell, J., Viegi, G., and Simoni, M.: WP1 Technical Report, Health Effects, Final report, EnVIE Co-ordination Action on Indoor Air Quality and Health Effects, 2008.
Chan, C. S., Ostertag, M. H., Akyürek, A. S., and Šimunić Rosing, T.: Context-aware system design, in: Micro- and Nanotechnology Sensors, Systems, and Applications IX, edited by: George, T., Achyut, K., Dutta, M., and Sailf, I., Anaheim, US, 9–13 April 2017, paper no. 101940B, 1–17, Washington, SPIE, https://doi.org/10.1117/12.2263232, 2017.
Chou, J.: Chapter 1 – Introduction, in: Hazardous gas monitors: A Practical Guide to Selection, Operation and Applications, 1st Edn., New York, McGraw-Hill Professional, 1–24, 2000.
Crump, D., Raw, G. J., Upton, S., Scivyer, C., Hunter, C., and Hartless, R.: A protocol for the assessment of indoor air quality in homes and office buildings, 1st Edn., London:, BRE bookshop, 2002.
Ferdoush, S. and Li, X.: Wireless sensor network system design using Raspberry Pi and Arduino for environmental monitoring applications, Procedia Comput. Sci., 34, 103–110, https://doi.org/10.1016/j.procs.2014.07.059, 2014.
Gee, I. L., Semple, S., Watson, A., and Crossfield, A.: Nearly 85 % of tobacco smoke is invisible – a confirmation of previous claims, Tob. Control, 22, 429–429, https://doi.org/10.1136/tobaccocontrol-2012-050475, 2013.
Hasenfratz, D., Saukh, O., Sturzenegger, S., and Thiele, L.: Participatory Air Pollution Monitoring Using Smartphones, 2nd International Workshop on Mobile Sensing, 1–5, 2012.
Herberger, S., Herold, M., Ulmer, H., Burdack-Freitag, A., and Mayer, F.: Detection of human effluents by a MOS gas sensor in correlation to VOC quantification by GC/MS, Build Environ., 45, 2430–2439, https://doi.org/10.1016/j.buildenv.2010.05.005, 2010.
Hernandez, G., Arias, O., Buentello, D., and Jin, Y.: Smart Nest Thermostat?, A Smart Spy in Your Home, Black Hat USA, 1–8, 2014.
Jones, A. P.: Indoor air quality and health, Atmos. Environ., 33, 4535–4564, https://doi.org/10.1016/S1352-2310(99)00272-1, 1999.
Kadosaki, M., Sakai, Y., Tamura, I., Matsubara, I., and Itoh, T.: Development of an oxide semiconductor thick film gas sensor for the detection of total volatile organic compounds, Electr. Commun. Jpn., 93, 34–41, https://doi.org/10.1002/ecj.10190, 2010.
Kahkonen, E., Zitting, A., Airo, E., Valkonen, J., and Leikas, M.: Internet Questionnaire and Real-Time Indoor Air Quality Monitoring, Indoor Built Environ., 6, 331–336, 1997.
Kim, D. S., Jin Ching, B., and Son, S.-Y.: Implementation of a Low-Cost Energy and Environment Monitoring System Based on a Hybrid Wireless Sensor Network, J. Sensors, 2017, 461–462, https://doi.org/10.1155/2017/5957082, 2017.
Koistinen, K., Kotzias, D., Kephalopoulos, S., Schlitt, C., Carrer, P., Jantunen, M., Kirchner, S., McLaughlin, J., Molhave, L., Fernandes, E. O., and Seifert, B.: The INDEX project: Executive summary of a European Union project on indoor air pollutants, Allergy: European Journal of Allergy and Clinical Immunology, 63, 810–819, https://doi.org/10.1111/j.1398-9995.2008.01740.x, 2008.
Kularatna, N. and Sudantha, B. H.: An Environmental Air Pollution Monitoring System Based on the IEEE 1451 Standard for Low-Cost Requirements, IEEE Sens. J., 8, 415–422, https://doi.org/10.1109/JSEN.2008.917477, 2008.
Landsberger, H. A. and Ithaca, N. Y.: Hawthorne revisited: Managment and the worker, its Critics and Developments in Human Relations in Industry, Cornell Studies in industrial and Labor Relations, 9, 132 pp., 1958.
Lee, D. D.: Environmental gas sensors, IEEE Sens. J. 1, 214–224, https://doi.org/10.1109/JSEN.2001.954834, 2001.
Liu, X., Cheng, S., Liu, H., Hu, S., Zhang, D., and Ning, H.: A Survey on Gas Sensing Technology, Sensors, 12, 9635–9665, https://doi.org/10.3390/s120709635, 2012.
Manikonda, A., Zikova, N., Hopke, P. K., and Ferro, A.: Laboratory assessment of low-cost PM monitors, J. Aerosol Sci., 102, 29–40, https://doi.org/10.1016/j.jaerosci.2016.08.010, 2016.
Matsuoka, Y. and Fisher, E. J.: Context adaptive cool-to-dry feature for HVAC controller, Patent US9696735 B2, US, 2017.
Mukaka, M. M.: A guide to appropriate use of Correlation coefficient in medical research, Malawi Med. J., 24, 69–71, https://doi.org/10.1016/j.cmpb.2016.01.020, 2012.
Myles, P. S. and Cui, J.: Using the Bland-Altman method to measure agreement with repeated measures, Brit. J. Anaesth., 99, 309–311, https://doi.org/10.1093/bja/aem214, 2007.
Porteous, C. D.: Sensing a Historic Low-CO2 Future, edited by: Mazzeo, D. N., Chemistry, Emission Control, Radioactive Pollution and Indoor Air Quality, InTech, 213–246, 2011.
Postolache, O. A., Pereira, J. M. D., and Girao, P. M. B. S.: Smart Sensors Network for Air Quality Monitoring Applications, IEEE T. Instrum. Meas., 58, 3253–3262, https://doi.org/10.1109/TIM.2009.2022372, 2009.
Semple, S., Apsley, A., and MacCalman, L.: An inexpensive particle monitor for smoker behaviour modification in homes, Tob. Control, 22, 295–298, https://doi.org/10.1136/tobaccocontrol-2011-050401, 2013a.
Semple, S., Ibrahim, A. E., Apsley, A., Steiner, M., and Turner, S.: Using a new, low-cost air quality sensor to quantify second-hand smoke (SHS) levels in homes, Tob. Control, 24, 153–158, https://doi.org/10.1136/tobaccocontrol-2013-051188, 2013b.
SENSIRION: Datasheet SHT20P Humidity and Temperature Sensor IC, available at: https://www.mouser.com/ds/2/682/Sensirion_Humidity_Sensors_SHT20_Datasheet-1274196.pdf (last access: 4 May 2018), 2014.
Sousan, S., Koehler, K., Hallett, L., and Peters, T.: Evaluation of consumer monitors to measure particulate matter, J. Aerosol Sci., 107, 123–133, https://doi.org/10.1016/j.jaerosci.2017.02.013, 2017.
Tong, Z., Xiong, X., and Patra, P.: Miniaturized PM2.5 Particulate Sensor Based on Optical Sensing, in: 2015 ASEE-NE Conference, Boston, US, 30 April–2 May 2015, 6604 pp., Boston: ASEE, 2015.
Ulmer, H. and Herberger, S.: New Developments in VOC Sensing for DCV, in: 33rd AIVC and 2nd TightVent Conference – Optimising Ventilative Cooling and Airtightness for [Nearly] Zero-Energy Buildings, IAQ and Comfort, Copenhagen, Denmark: AIVC, 10–11 October 2012.
Wang, Y., Li J., Jing, H., Zhang, Q., Jiang, J., and Biswas, P.: Laboratory Evaluation and Calibration of Three Low-Cost Particle Sensors for Particulate Matter Measurement, Aerosol Sci. Tech., 49, 1063–1077, https://doi.org/10.1080/02786826.2015.1100710, 2015.
Watson, J.: The tin oxide gas sensor and its applications, Sens. Actuat., 5, 29–42, https://doi.org/10.1016/0250-6874(84)87004-3, 1984.
White, W. H.: Considerations in the use of ozone and PM2.5 data for exposure assessment, Air Qual. Atmos. Hlth., 2, 223–230, https://doi.org/10.1007/s11869-009-0056-9, 2009.
WHO: Air quality guidelines for Europe, WHO Regional Publications, European Series, No. 91., 2nd Edn., edited by: Theakston, F., Copenhagen: WHO Regional Publications, 2000.
WHO: WHO guidelines for indoor air quality: selected pollutants, 1st Edn., edited by: Theakston, F., Copenhagen: World Health Organization Regional Office for Europe, https://doi.org/10.1186/2041-1480-2-S2-I1, 2010.
Yu, C. W. F. and Kim, J. T.: Low-carbon housings and indoor air quality, Indoor Built Environ., 21, 5–15, https://doi.org/10.1177/1420326X11431907, 2012.
Yu, T.-C., Lin, C.-C., Chen, C.-C., Lee, W.-L., Lee, R.-G., Tseng, C.-H., and Liu, S.-P.:, Wireless sensor networks for indoor air quality monitoring, Med. Eng. Phys., 35, 231–235, https://doi.org/10.1016/j.medengphy.2011.10.011, 2013.
Zikova, N., Hopke, P. K., and Ferro, A. R.: Evaluation of new low-cost particle monitors for PM2.5 concentrations measurements, J. Aerosol Sci., 105, 24–34, https://doi.org/10.1016/j.jaerosci.2016.11.010, 2017.