the Creative Commons Attribution 4.0 License.
the Creative Commons Attribution 4.0 License.
 | 20 Sep 2018
Trace determination of cadmium content in Malaysian herbs using graphene–ionic liquid-modified screen-printed carbon electrodes
Muhammad Syafiq Nordin
Yusairie Mohd
Noor Fitrah Abu Bakar
Zainiharyati Mohd Zain
A simple and effective method of square-wave anodic stripping voltammetry (SWASV) with screen-printed carbon electrodes (SPCEs) was used to determine the cadmium concentration in Malaysian herb samples. The optimization process involved the selection of an optimized pH, an acetate buffer as a supporting electrolyte, the deposition potential, deposition time and the surface modification process on an SPCE surface. The optimum conditions were a pH of 4.5, a deposition potential of −1.4 V and a deposition time of 120 s. The SPCE surface was modified with the fabrication of the graphene–ionic liquid composite as the sensing layer. Four herb samples were tested, where herbs A, D, M and C contained 0.0035, 0.0237, 0.0267 and 0.0251 ppm of cadmium, respectively. The sensitivity of the proposed sensor was compared with an inductively coupled plasma–optical emission spectroscopy (ICP–OES). The relative standard deviation (RSD) between the sensor and the ICP–OES indicated that the sensor was sensitive, as RSD was below 20 % with range of 7.93 % to 18.28 %.
- Article
(5700 KB) - Full-text XML
- BibTeX
- EndNote


Cadmium is known for its carcinogenic effects. In the human body, cadmium can be found abundantly in the excretion system, which consists of the kidneys and the liver. It possesses the ability to alter the production of inflammatory cytokines, regulate the protective function of nitric oxide formations (Navas-Acien et al., 2005) and change the gene expression and transduction of signals in Deoxyribonucleic Acid (DNA) in the human body (Waisberg et al., 2003). Cadmium contamination originates from the mining process, usage of phosphate fertilizers, improper sewage-sludge discharges, and industrial management of cadmium waste and usage. Therefore, the World Health Organization (WHO) developed a manual that can be used to determine the quality of the herbal plants with regards to contaminants and residues (WHO, 2007). In addition, numerous studies indicated that many medicinal plants and herbs tend to be contaminated by heavy metals when the main water, soil and air sources have been contaminated (Annan et al., 2010; Caldasa and Machado, 2004; Hina et al., 2011).
There are several detection methods that have been used to detect and quantify the concentration of heavy metals in herb products, including atomic absorption spectroscopy (AAS) (Silva and dos Santos Roldan, 2009) and inductively coupled plasma–optical emission spectroscopy (ICP–OES) (Lo Turco et al., 2013). Although these detection methods are very sensitive, operating these instruments requires intensive training. In addition, operating and maintenance costs are very high. Electrochemical detection offers advantages in terms of faster analysis times and cheaper analysis costs than operating high-end analytical instruments.
Electrochemical detection method comprises of three electrode systems, namely working, counter and reference electrodes. There are five types of common electrodes that have been studied extensively by researchers around the world which include platinum (Pt) (Lee et.al, 2016), gold (Au) (Korolczuk et al., 2015), carbon (C) (Abu Shawish et al., 2016; Niu et al., 2011) and mercury (Hg) (Veccerkova et al., 2014). Carbon electrodes were used for this study because platinum and gold electrodes were very expensive, while mercury electrodes are very hazardous towards humans and the environment.
A screen-printed carbon electrode (SPCE) surface requires a modified process, as the sensitivity of an SPCE is low. There have been many surface modification processes conducted by other researchers in improving the sensitivity of the sensor. Recently, graphene received much attention, as many researchers utilized graphene in surface modification (Chen et al., 2013; Liu et al., 2011; Mani et al., 2013). Graphene has high mechanical strength and electrical conductivity (Chaiyo et al., 2016). Apart from graphene, ionic liquid has also been introduced into the sensing-layer mixture. Ionic liquid consists of positively and negatively charged ions mixed in the liquid phase without the presence of any molecular solvent. The presence of charged ions will enhance the electron transfer mechanism during reduction and oxidation reactions in detecting cadmium, thus increasing the ionic conductivity of the sensor (Wei and Ivaska, 2008). Apart from that, the ionic liquid can provide a potentially wider window, which will allow the sensor to be more selective in detecting cadmium in mixtures of ions (Armand et al., 2009).
In this study, a graphene–ionic liquid (G–IL), namely a 1-ethyl-3-methyl imidazolium bis (trifluoro methyl sulfonyl) imide composite, was fabricated on the SPCE surface through a dry-casting technique. The modified electrode was analyzed for optimizing the pH effect of the supporting electrolytes and depositing the potential and time. After optimization, the modified SPCE was used to determine the concentration of trace cadmium in herb-sample solutions. The obtained results were compared with standard detection method using ICP–OES.
2.1 Apparatus
The apparatus used consists of the autolab electrochemical system, embedded with a potentiostat (the Netherlands)and the NOVA 10.1 software and screen-printed carbon electrodes (SPCEs). An SPCE consisted of carbon ink print, which represented the working and counter electrodes, and silver ink print, which represented the referenced electrode. Both were purchased from Metrohm Malaysia Sdn. Bhd. The inductively coupled plasma–optical emission spectroscopy (ICP–OES) (Perkin Elmer Model OPTIMA 210DV) was purchased from the Advance Altimas Sdn. Bhd.
2.2 Reagents
The reagents used were the graphene and ionic liquid 1-ethyl-3-methyl imidazolium bis (trifluoro methyl sulfonyl) imide, which were purchased from Sigma-Aldrich (Malaysia). The other reagents used were N, N- dimethylformamide, sodium acetate (CH3COONa), 1000 mg L−1 stock solutions of cadmium (Cd ll), hydrochloric acid (HCl), nitric acid (HNO3) and hydrogen peroxide (H2O2). All of them were purchased from Merck Sdn. Bhd (Malaysia). Lastly, deionized water was also used as one of the reagents.
2.3 Preparation of sensing-layer composite
A graphene–ionic liquid (G–IL) composite was prepared by weighing 10 mg of the graphene from Sigma-Aldrich (Malaysia) using the microbalance. 10 mL of dimethylformamide was added into a clean 25 mL beaker using the micropipette. The weighed graphene was transferred into the beaker containing 10 mL dimethylformamide. Then, the solution was sonicated using ultrasonic waves for 2 h. 0.5 % (m∕v) ionic liquid was added later to the beaker using the micropipette. The mixture was sonicated again using ultrasonic waves for 30 min.
2.4 Preparation of active layer on screen-printed carbon electrodes
2 µL of the prepared G–IL composite was dropped onto the working electrode of SPCE using the micropipette. The electrode was then dried for 10 minutes at room temperature.
2.5 Sample pre-treatment
1 g of the herb sample was weighed using the microbalance. The weighed herb sample was transferred into a clean 100 mL beaker. 50 mL of hydrochloric acid and nitric acid with 1:1 ratio was measured and transferred using the pipette into the herb-sample beaker. The beaker was then transferred to a hot plate for the heating process, which took place in 90 ∘C for 2 h inside a fume hood. The mixture was cooled for 30 min inside the fume hood. 10 mL of hydrogen peroxide was added to the mixture using the pipette and heated back to 120 ∘C for 30 min. Later, the herb-sample solution was cooled down for 30 min inside the fume hood. The mixture was filtered using the filter funnel and fitted with filter paper to remove remaining suspension.
2.6 Analysis of sample solutions using optimized electrochemical sensor
The square-wave anodic stripping voltammetry (SWASV) method was used for the electrochemical analysis. The analysis was carried out by dropping 100 µL of the tested solution on the surface of the graphene–ionic liquid modified of screen-printed carbon electrode (SPCE). For the determination of Cd (ll), the sample and the standard solutions were analyzed in the optimized conditions of a 0.1 M acetate buffer with a pH of 4.5 and a deposition potential and time of −1.4 V and 120 s, respectively.
2.7 Analysis of sample solutions using ICP–OES
An inductively coupled plasma–optical emission spectroscopy (ICP–OES) was used as standard method for heavy metal detection. The standard cadmium and sample solutions were analyzed with ICP–OES by measuring the emitted light wavelength at 228.80 nm.
3.1 Optimization of electrochemical sensor
3.1.1 The pH effect of the buffer
The SWASV method was used to investigate the effect of the pH of the acetate buffer as a supporting electrolyte. The pH range tested was between 2.5 and 6.5. 0.1 M and the buffer was made up of sodium acetate (CH3COONa) and acetic acid (CH3COOH) and mixed with sodium hydroxide (NaOH), with hydrochloric acid (HCl) as the pH adjuster. The acetate buffer was then used to enhance the conductivity of the solution and maintain the pH of the solution as the electrochemical sensor applied electrical potential to the solution.
Figure 1 shows how the current increased in its pH value until it reached pH 4.5 and decreased as the pH value of the acetate buffer increased until pH 6.5. At high acidity, the amount of the H+ ion was very high at the electrode surface, allowing H+ ions to reduce to H2 molecules (Zhao et al., 2016). The saturation of H+ ions blocked the Cd2+ ions from reducing to Cd, affecting the current produced for cadmium detection. The SPCE started to dissolve and disperse in the neutral solution, as the current started to decrease after the pH value reached 4.5. This caused an alteration of the sensing layer of the surface, which led to a lower current measurement.
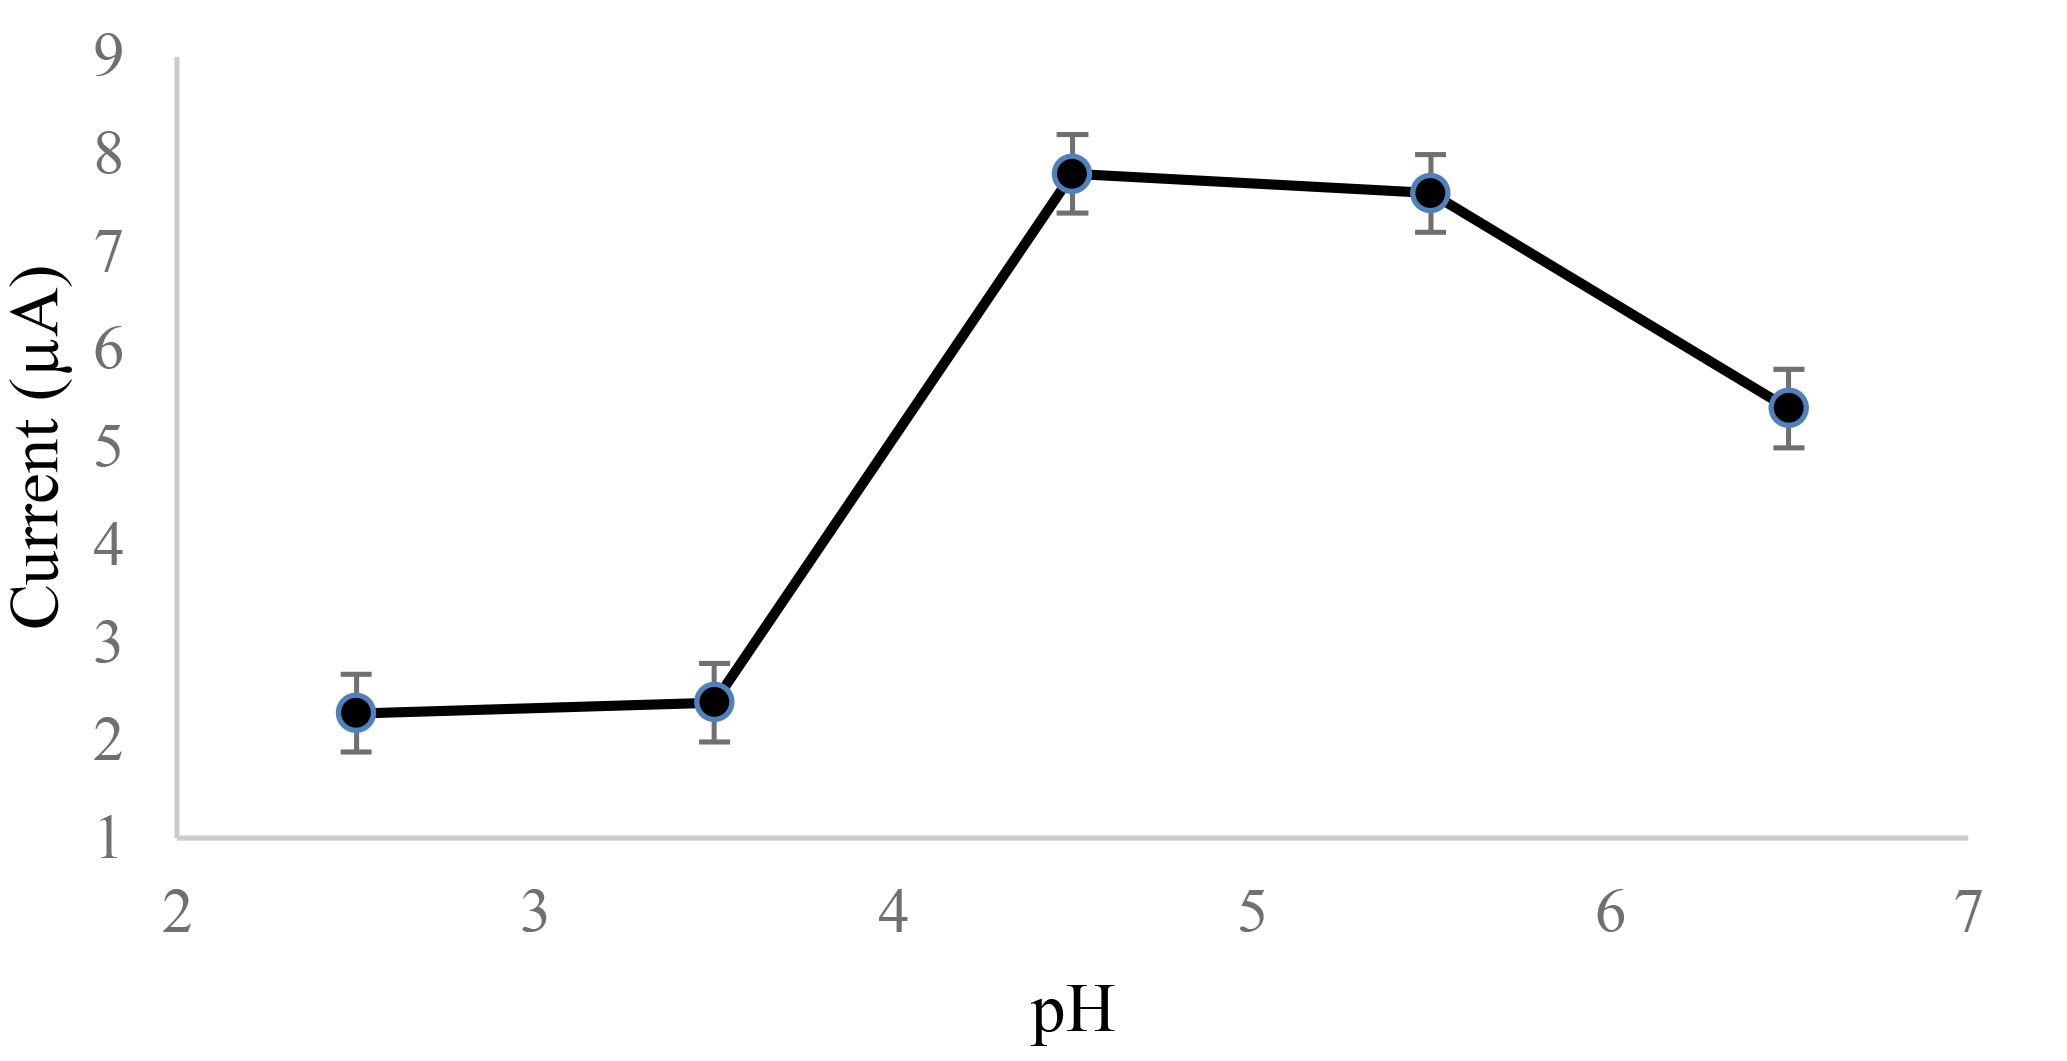
Figure 1Effect of pH on a 1.0 ppm standard cadmium solution in an acetate buffer with different pH values.
3.1.2 Effect of deposition potential
The experiment was carried out by testing 1.0 ppm of standard cadmium in 0.1 M of the acetate buffer with a pH of 4.5. The optimized deposition potential for cadmium detection was set at −1.4 V, as shown in Fig. 2. This was due to the highest amount of cadmium deposited on the surface of the sensor, which led to a high current output during the stripping process of cadmium from the surface of the electrochemical sensor.
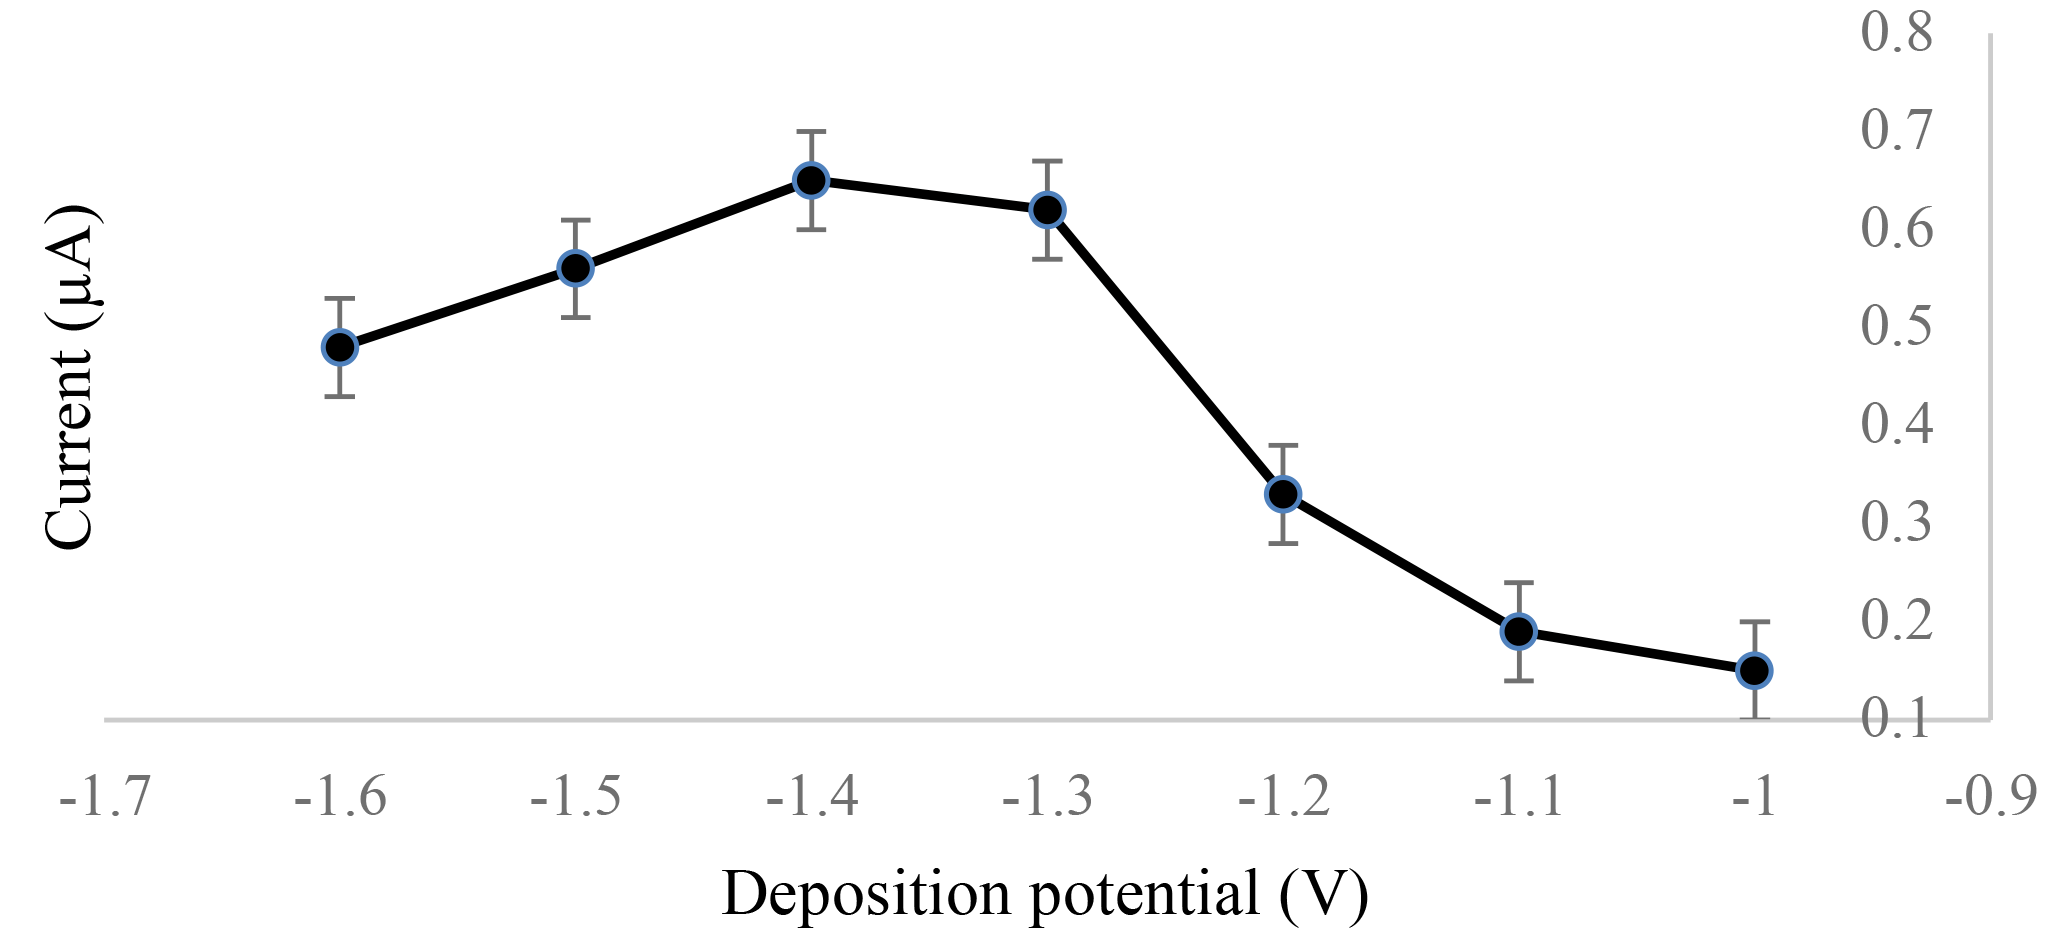
Figure 2Effect of different deposition potentials applied to a 1.0 ppm standard cadmium solution in an acetate buffer with pH 4.5.
3.1.3 Effect of deposition time
The deposition time was the time given to the chemical species to electrochemically deposit and accumulate on the working electrode during the preconcentration step of the electrochemical analysis. The result in Fig. 3 indicates that as longer deposition time was applied to the sensor, a higher current could be produced during the measurement process. The current increased in an almost linear form from 0 to 120 s. The current slightly dropped at 120 s before climbing back at 180 s and continued to increase until 210 s. A longer deposition time gives all the cadmium metal in the solution enough time to move towards the working electrode. The cadmium metal is reduced and deposited on the electrode during the preconcentration step. The higher current produced showed that a higher number of reduced cadmium metal was oxidized. Therefore, for this study, 120 s was selected as the optimized deposition time in the next experiment, provided that the time was enough for the sensor to detect the cadmium metal in the samples.
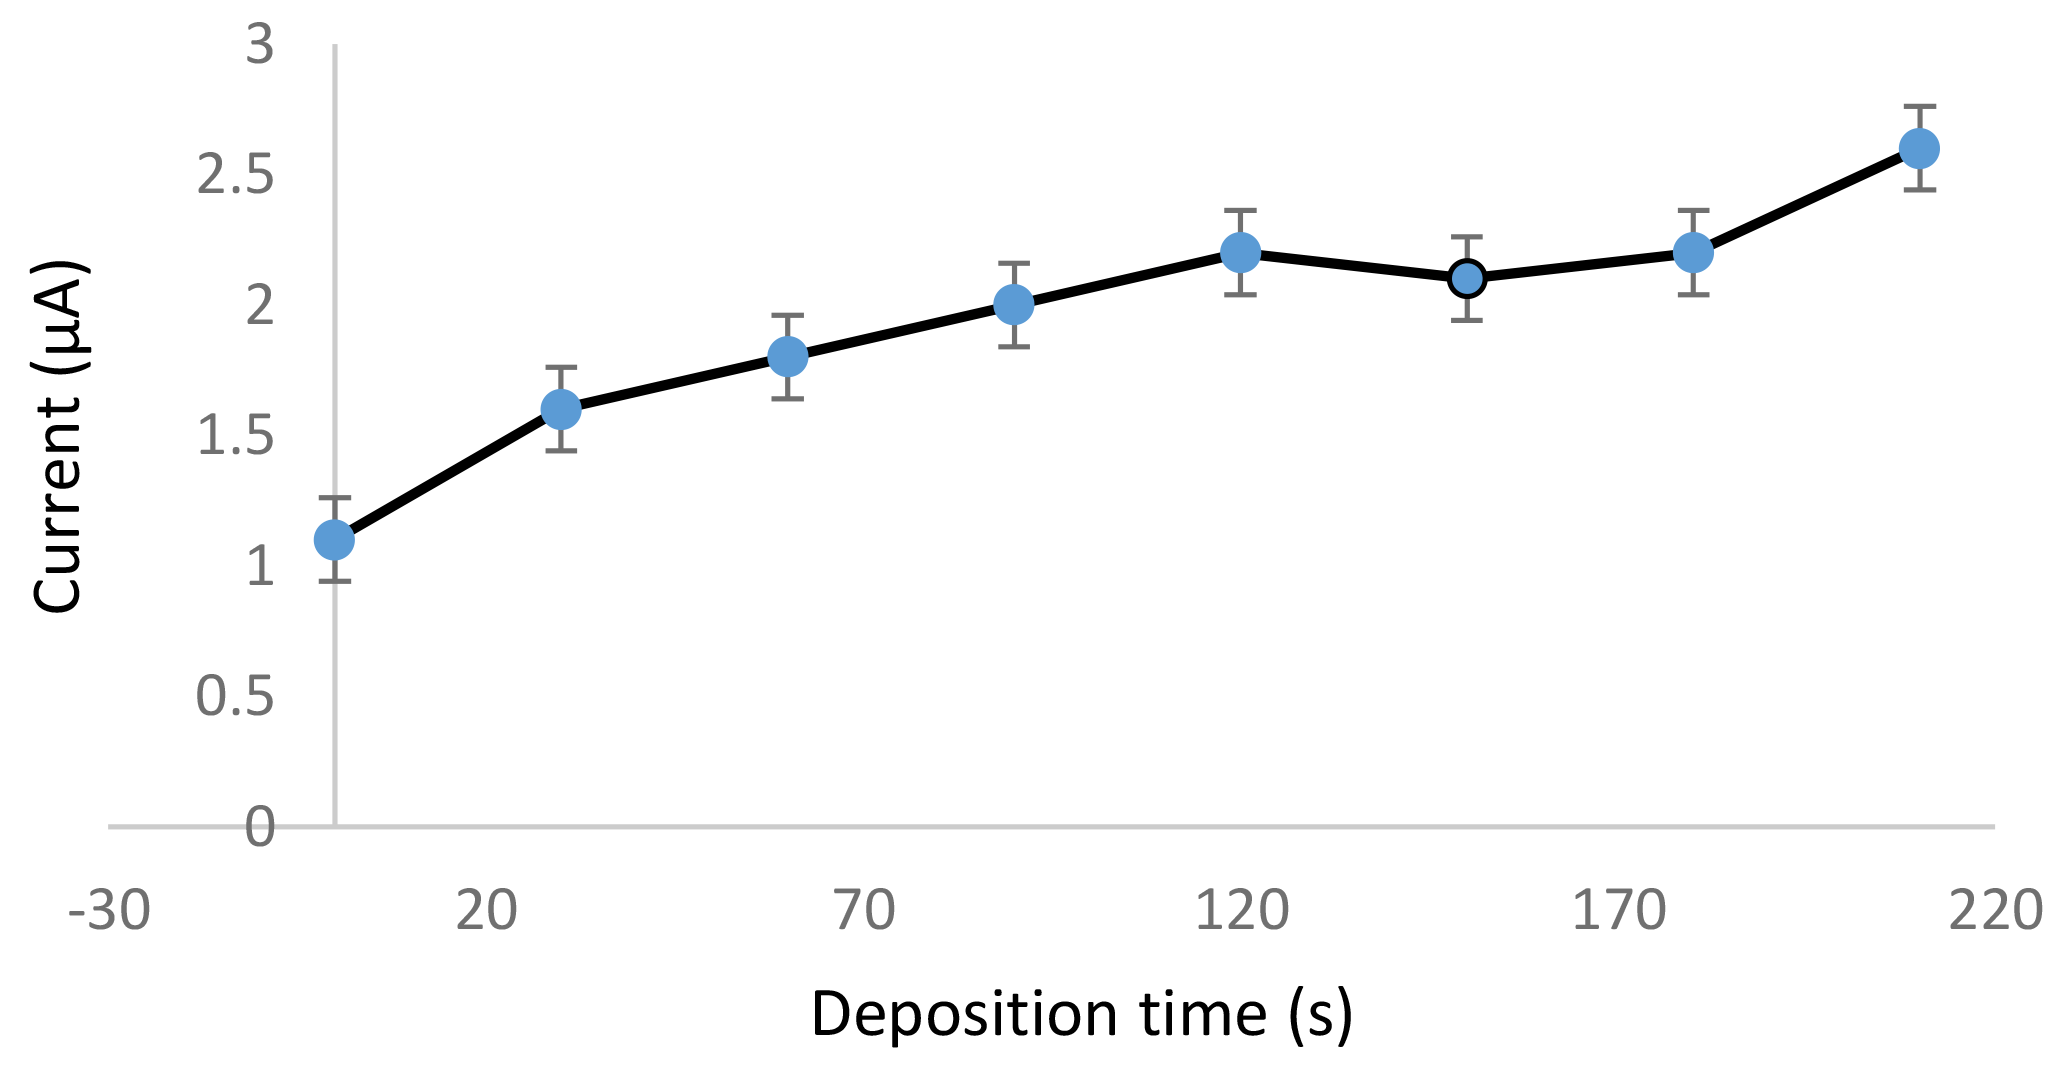
Figure 3Effect of different deposition times applied to a 1.0 ppm standard cadmium solution in an acetate buffer with a pH of 4.5.

Figure 4(a) Voltammogram for the series of standard cadmium solutions in an 0.01 M acetate buffer with a pH of 4.5, a −1.4 V deposition potential and a 120 s deposition time tested on bare the SPCE of the electrochemical sensor. (b) Standard calibration graph obtained from the series of standard cadmium solutions in the 0.01 M acetate buffer with a pH of 4.5, a −1.4 V deposition potential and a 120 s deposition time tested on the bare SPCE of the electrochemical sensor.
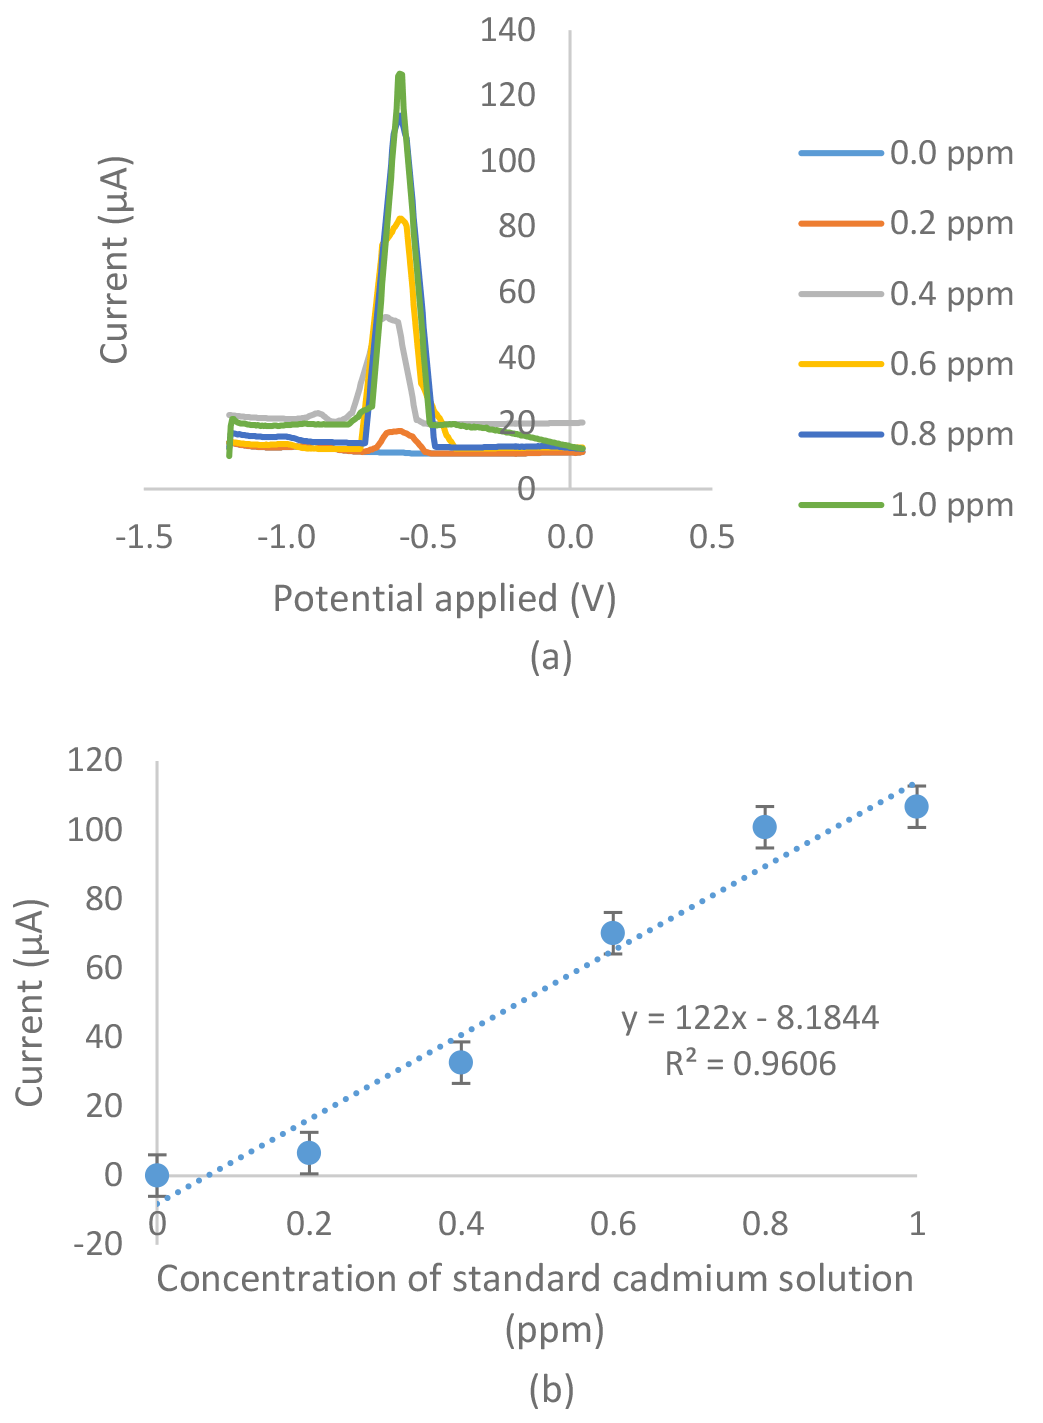
Figure 5(a) Voltammogram for the series of standard cadmium solutions in an 0.01 M acetate buffer with a pH of 4.5, a −1.4 V deposition potential and a 120 s deposition time tested on the modified SPCE with the G–IL composite of the electrochemical sensor. (b) Standard calibration graph obtained from the series of standard cadmium solutions in an 0.01 M acetate buffer with a pH of 4.5, a −1.4 V deposition potential and a 120 s deposition time tested on a modified SPCE with the G–IL composite of the electrochemical sensor.
3.1.4 Effect of graphene–ionic liquid composite as a sensing layer on SPCE
Figures 4a and 5a show voltammograms for analysis using bare and modified SPCE respectively. The two calibration curves of the bare SPCE (Fig. 4b) and the modified SPCE (Fig. 5b) were constructed based on the current produced in voltammograms in Figs. 4 and 5. Based on Figs. 4b and 5b, there were differences in the results of calibration curve graphs of the bare sensor and the G–IL modified SPCE. Firstly, the current produced was higher when using SPCE modified with the G–IL composite in comparison to the bare SPCE, thus indicating that the modified SPCE had better conductivity. For example, at the point where the 1.0 ppm standard cadmium solution was tested using both sensors, the modified SPCE produced a higher current of 106.78 µA, compared to the bare SPCE with a value of 4.13 µA. The current produced during the analysis indicated that the modified SPCE can detect more than 25 times the current produced compared to bare SPCE. Secondly, the gradient of the calibration curves for both showed that the G–IL modified SPCE had a higher gradient value of 122 µA ppm−1, compared to the bare SPCE with a value of 3.25 µA ppm−1. Higher gradient values indicated that when there was a change in low cadmium concentrations, the sensor could distinguish effectively. This was enough to show that the sensitivity of the modified SPCE with the G–IL composite was higher than the bare SPCE. Lastly, the G–IL modified SPCE had better correlation coefficient, R2, compared to the bare SPCE. The correlation coefficient, or R2, is a measure of the accuracy of data by comparing each datum to their mean or average. Based on Figs. 4 and 6, the G–IL modified SPCE had a better R2 of 0.9606 compared to the bare SPCE, which was only 0.8096. This concluded that the G–IL modified SPCE had data that better fit the mean of the calibration curve, as compared to the bare SPCE.
3.2 Sample analysis using ICP–OES
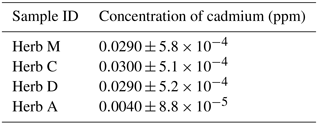
Table 1 shows the mean concentration of cadmium in the measured samples. Herb C indicated the highest concentration of cadmium with 0.030 ppm, followed by herbs M and D with 0.029 ppm and Herb A with 0.004 ppm. The concentration of cadmium in all herb samples was below the maximum concentration limit proposed by the WHO and Malaysian government via the Food Act of 1983 and the Food Regulation Act of 1985, which were set as 0.05 and 1.00 ppm, respectively (Karim, 2007). The ICP–OES results for all herb samples would be the reference values for cadmium testing using an optimized electrochemical sensor with the G–IL modified SPCE.
Table 1Determination of concentration of cadmium in herb samples by using ICP–OES.
3.3 Sample analysis using optimized electrochemical sensor
Table 2 shows the amount of cadmium detected using the optimized G–IL modified SPCE for all herb samples. Herb M shows the highest concentration of cadmium with 0.0267 ppm, followed by herbs C, D, and A with 0.0251 ppm, 0.0237 ppm and 0.0035, respectively. The concentration of cadmium in all herb samples was below the maximum concentration limit set by the WHO and Malaysian government via the Food Act of 1983 and the Food Regulation Act of 1985 (Karim, 2007).
Table 2Determination of concentration of cadmium in herb samples under optimized conditions using an optimized electrochemical sensor with a G–IL modified SPCE.
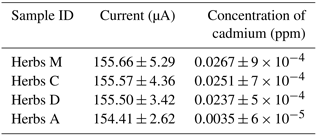
Table 3Determination of mean concentration of cadmium in herb samples using both the ICP–OES and optimized electrochemical sensor with a G–IL modified SPCE. There were no significant differences in the variation of cadmium concentration detected by each detection technique, while the results from the two detection methods differed from each other to some extent.
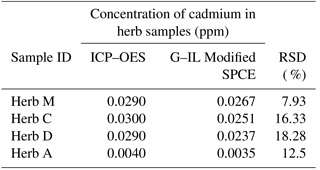
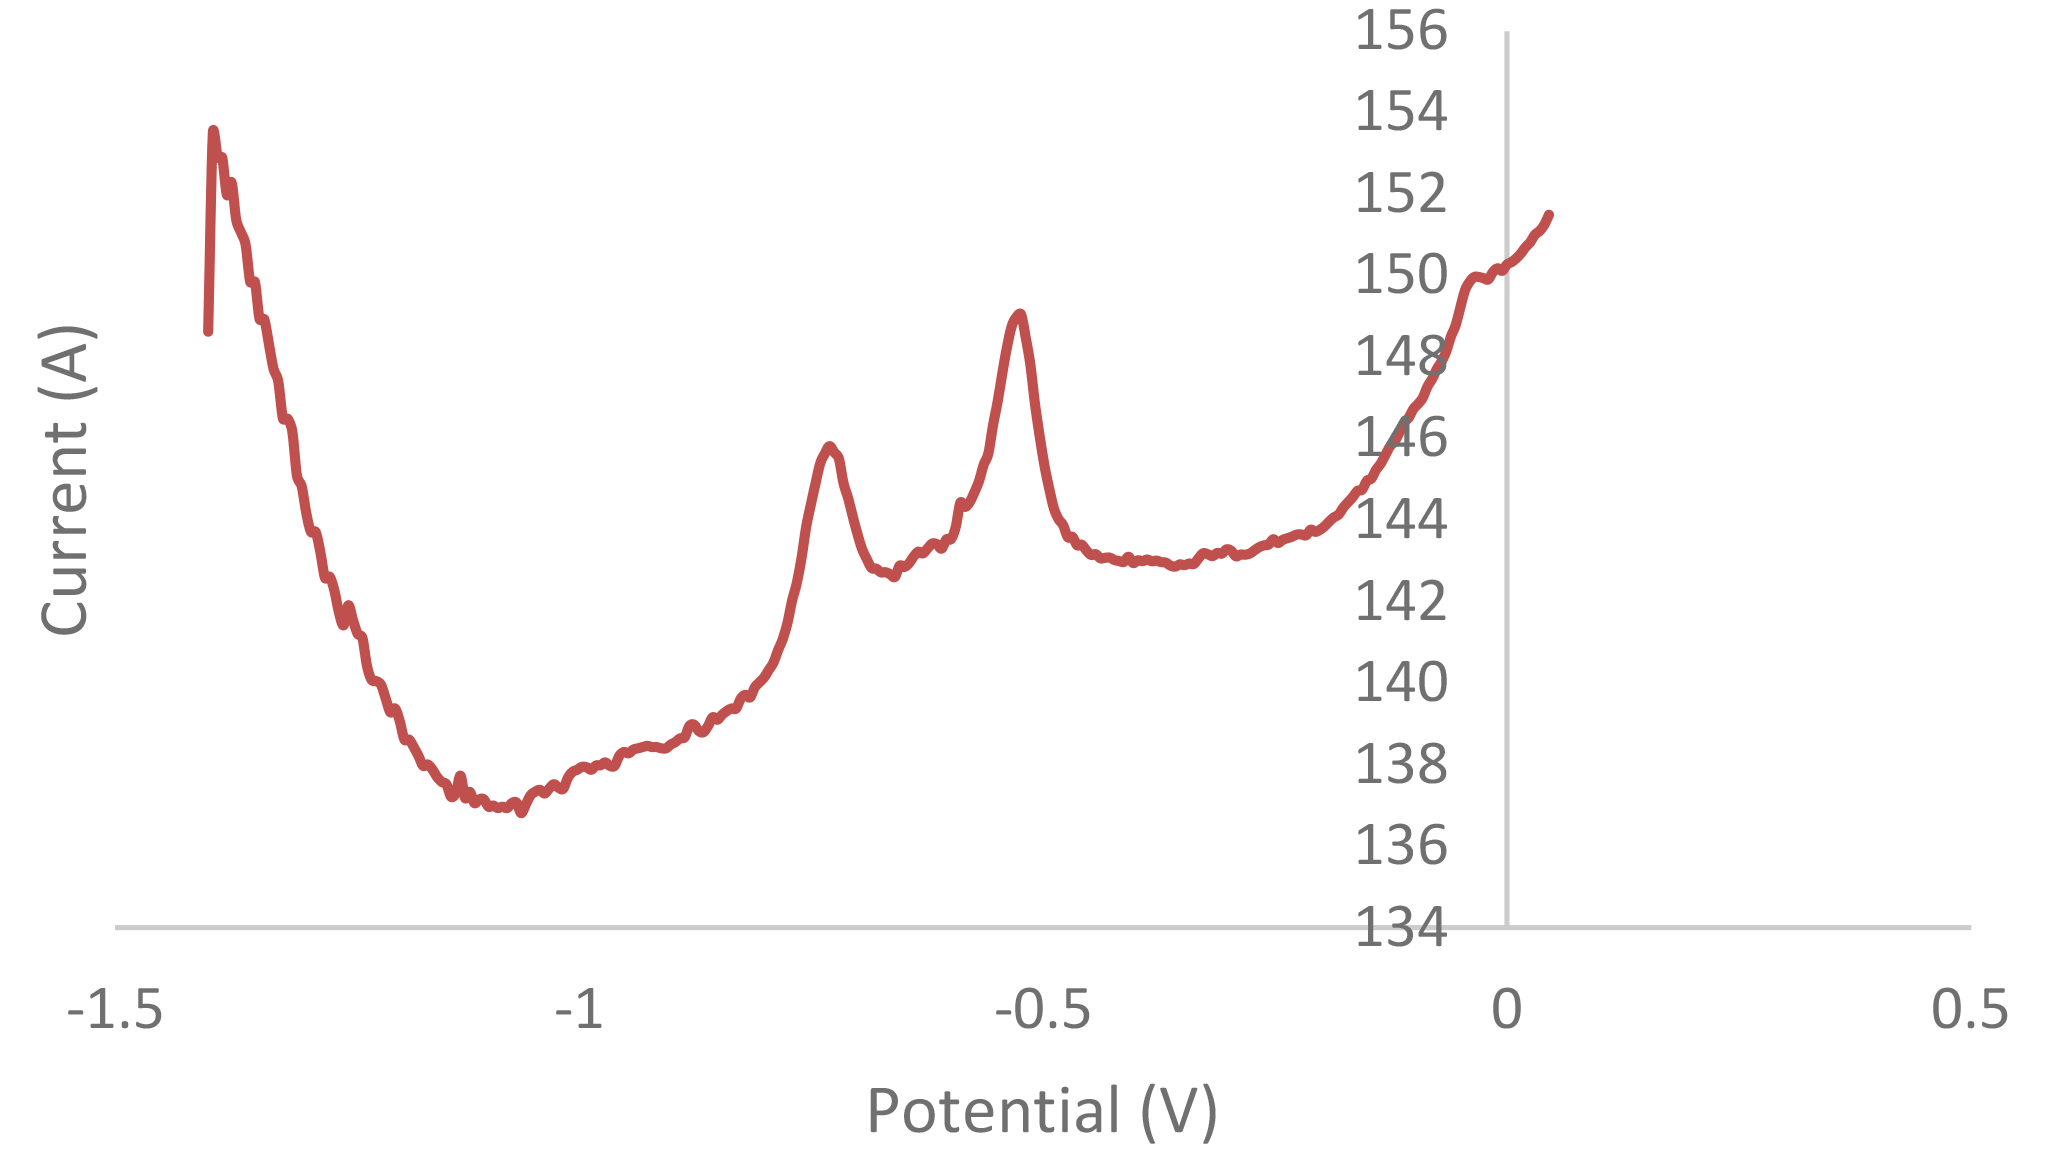
Figure 6Voltammogram of interference study conducted from a standard composite mixture of Pb, Cd, Zn, As and Mn.
3.4 Detection difference in sample between electrochemical sensor and ICP–OES
Table 3 shows the relative standard deviation (RSD) variation from the mean values analyzed using ICP–OES and the G–IL modified SPCE. The mean values from the ICP–OES analysis were selected, as this technique affected a smaller amount of interferences such as organic and passive compounds. Most of it was overcome by the utilization of high temperatures up to 1000 K. Therefore, the data from the measurement could be more accurate than that of the modified SPCE. This variation in results could be due to the presence of other organic materials in the herb samples, as this could affect the conductivity of the SPCE. Other formations of passive compounds on the surface of the SPCE could also contribute to the variations in the sensor's readings. The relative standard deviation (RSD) shows that the maximum value was 18.28 % in Herb D while the lowest RSD was Herb A with 7.93 %. This suggested that the sensor with the G–IL modified SPCE was able to produce accurate and reliable results compared to ICP–OES, as all RSDs for the herb samples were below than 20.00 %. This concluded that the optimized and modified electrochemical sensor can be an alternative method for detecting cadmium in Malaysian herbs.
3.5 Interference study
An interference study was carried out by mixing individual standard solutions of (1 ppm) of lead (Pb), cadmium (Cd), arsenic (As), zinc (Zn) and manganese (Mn). The sample solution was tested using a modified G–IL sensor with an optimized 120 s deposition time, a −1.4 V deposition potential and a 4.5 pH acetate buffer with a scan range between −1.40 V and 0.05 V. The peaks of Pb, Cd, Zn, As and Mn would be expected to be found at the potentials of −0.6, −0.8, −1.2 (Chaiyo et al., 2016), −0.1 (Yang et al., 2016) and 0.6 V (Roushani et al., 2017), respectively. Based on Fig. 6, there were two peaks that could be observed. After comparing the peaks to the standard potentials, the left and right peaks were identified as Cd and Pb, respectively. The Mn peak was not observed, as the peak only can be found at the 0.6 V potential that was out of scan range. The Zn and As peaks were expected to occur within the range of the scan. However, there were no peaks that could be observed at the expected potentials of −1.2 and −0.1 V. Therefore, the designed sensor is selective towards cadmium detection through its use of anodic stripping voltammetry (ASV).
The concentration of cadmium within Malaysian herbs can be detected using the optimized electrochemical sensor with the G–IL modified SPCE via the SWASV method. This method is considered as rapid, highly sensitive and cost effective compared to other trace analysis methods. The results show that all Malaysian herb samples contained cadmium below the maximum concentration limit set by the WHO of 0.05 ppm and the Malaysian government of 1.00 ppm via the Food Act of 1983 and Food Regulations Act of 1985. Herb A contains 0.004 ppm cadmium, herbs D and M contain 0.029 ppm and Herb C contains 0.030 ppm.
The optimized condition of the G–IL modified SPCE was achieved by using acetate buffer with a pH of 4.5 and a deposition time and potential of 120 s and −1.4 V, respectively. The results show that the surface modification process with the G–IL composite enhanced the detection of cadmium by using the electrochemical sensor in Malaysian herb samples.
Based on the experiment conducted, the fabricated electrochemical sensor has high sensitivity, as the relative standard deviation (RSD) ranged from 7.93 % to 18.28 %, which was below the maximum RSD of 20.00 %.
All relevant data are presented in the article and can be obtained from the cited literature. Explanations regarding any inquiries can be obtained by contacting the authors.
MSN fabricated, performed optimization and evaluated the sensor performance. YM, NFAB, ZMZ advised, reviewed and recommended the corrections of the articles.
The authors declare that they have no conflict of interest.
This study was supported by Geran Penyelidikan Bestari UiTM (600-IRMI/MyRA
5/3/Bestari 021/2017) with the supervision of Zainiharyati Mohd Zain &
Yusairie Mohd of the Faculty of Applied Sciences and Noor Fitrah Abu Bakar of
the
Faculty of Chemical Engineering UiTM in Shah Alam, Selangor, Malaysia.
Edited by: Anita Lloyd Spetz
Reviewed by: two anonymous referees
Abu Shawish, H. M., Abed Almonem, K. I., Saadeh, S. M., and Al-Lham, W. S.: Determination of haloperidol drug in ampoules and in urine samples using a potentiometric modified carbon paste electrode, Measurement, 78, 180–186, https://doi.org/10.1016/j.snb.2016.05.058, 2016.
Annan, K., Kojo, A. I., Cindy, A., Samuel, A., and Tunkumgnen, B. M.: Profile of heavy metals in some medicinal plants from Ghana commonly used as components of herbal formulations, Pharmacogn. Res., 2, 41–44, https://doi.org/10.4103/0974-8490.60579, 2010.
Armand, M., Endres, F., MacFarlane, D. R., Ohno, H., and Scrosati, B.: Ionic-liquid materials for the electrochemical challenges of the future, Nat. Mater., 8, 621–629, https://doi.org/10.1038/nmat2448, 2009.
Caldasa, E. D. and Machado, L. L.: Cadmium, mercury and lead in medicinal herbs in Brazil, Food Chem. Toxicol., 42, 599–603, https://doi.org/10.1016/j.fct.2003.11.004, 2004.
Chaiyo, S., Mehmeti, E., Žagar, K., Siangproh, W., Chailapakul, O., and Kalcher, K.: Electrochemical sensors for the simultaneous determination of zinc, cadmium and lead using a Nafion/ionic liquid/graphene composite modified screen-printed carbon electrode, Anal. Chim. Acta, 918, 26–34, https://doi.org/10.1016/j.aca.2016.03.026, 2016.
Chen, M., Meng, Y., Zhang, W., Zhou, J., Xie, J., and Diao, G.: β-Cyclodextrin polymer functionalized reduced-graphene oxide: Application for electrochemical determination imidacloprid, Electrochim. Acta, 108, 1–9, https://doi.org/10.1016/j.electacta.2013.06.050, 2013.
Hina, B., Rizwani, G. H., and Naseem, S.: Determination of toxic metals in some herbal drugs through atomic absorption spectroscopy, Pak. J. Pharm. Sci., 24, 353–358, 2011.
Karim, S.: Penspesiesan logam berat dalam air sisa campuran industri di system perparitan tertutup, zon perindustrian Prai 1 dan 2, Pulau Pinang, M.S., Universiti Sains Malaysia, Malaysia, 45 pp., 2007.
Korolczuk, M., Ochab, M., and Rutyna, I.: Determination of As(III) by anodic stripping voltammetry following double deposition and stripping steps at two gold working electrodes, Talanta, 144, 517–521, https://doi.org/10.1016/j.talanta.2015.06.084, 2015.
Lee, J., Arrigan, D. W. M., and Silvester, D. S.: Mechanical polishing as an improved surface treatment for platinum screen-printed electrodes, Sensing and Bio-sensing Research, 9, 38–44, https://doi.org/10.1016/j.sbsr.2016.05.006, 2016.
Liu, T., Su, H., Qu, X., Ju, P., Cui, L., and Ai, S.: Acetylcholinesterase biosensor based on 3-carboxyphenylboronic acid/reduced graphene oxide-gold nanocomposites modified electrode for amperometric detection of organophosphorus and carbamate pesticides, Sensor. Actuat. B, 160, 1255–1261, https://doi.org/10.1016/j.snb.2011.09.059, 2011.
Lo Turco, V., Di Bella, G., Furci, P., Cicero, N., Pollicino, G., and Dugo, G.: Heavy metals content by ICP-OES in Sarda sarda, Sardinella aurita and Lepidopus caudatus from the Strait of Messina (Sicily, Italy), Nat. Prod. Res., 27, 518–523, https://doi.org/10.1080/14786419.2012.673611, 2013.
Mani, V., Devadas, B., and Chen, S. M.: Direct electrochemistry of glucose oxidase at electrochemically reduced graphene oxide-multiwalled carbon nanotubes hybrid material modified electrode for glucose biosensor, Biosens. Bioelectron., 41, 309–315, https://doi.org/10.1016/j.bios.2012.08.045, 2013.
Navas-Acien, A., Silbergeld, E. K., Sharrett, A. R., Calderon- Aranda, E., Selvin, E., and Guallar, E.: Metals in urine and peripheral arterial disease, Environ. Health Persp., 113, 164–169, https://doi.org/10.1289/ehp.7329, 2005.
Niu, X., Zhao, H., and Lan, M.: Disposable screen-printed antimony film electrode modified with carbon nanotubes/ionic liquid for electrochemical stripping measurement, Electrochim. Acta, 56, 9921–9925, https://doi.org/10.1016/j.electacta.2011.08.057, 2011.
Roushani, M., Saedi, Z., Hamdi, F., and Dizajdizi, B. Z.: Preparation an electrochemical sensor for detection of manganese (II) ions using glassy carbon electrode modified with multi walled carbon nanotube-chitosan-ionic liquid nanocomposite decorated with ion imprinted polymer, J. Electroanal. Chem., 804, 1–6, https://doi.org/10.1016/j.jelechem.2017.09.038, 2017.
Silva, E. L. and dos Santos Roldan, P.: Simultaneous flow injection preconcentration of lead and cadmium using cloud point extraction and determination by atomic absorption spectrometry, J. Hazard Mater., 161, 142–147, https://doi.org/10.1016/j.jhazmat.2008.03.100, 2009.
Veccerkova, R., Hernychova, L., Dobes, P., Vrba, J., Josypcuk, B., Bartosik, M., and Vacek, J.: Investigation of protein FTT1103 electroactivity using carbon and mercury electrodes. Surface-inhibition approach for disulfide oxidoreductases using silver amalgam powder, Anal. Chim. Acta, 830, 22–31, https://doi.org/10.1016/j.aca.2014.04.056, 2014.
Waisberg, M., Joseph, P., Hale, B., and Beyersmann, D.: Molecular and cellular mechanisms of cadmium carcinogenesis, Toxicology, 192, 95–117, https://doi.org/10.1016/S0300-483X(03)00305-6, 2003.
Wei, D. and Ivaska, A.: Applications of ionic liquids in electrochemical sensors, Anal. Chim. Acta, 607, 126–135, https://doi.org/10.1016/j.aca.2007.12.011, 2008.
WHO: WHO Guidelines for Assessing Quality of Herbal Medicines with Reference to Contaminants and Residues, World Health Organization, Spain, 118 pp., 2007.
Yang, M., Guo, Z., Li, L., Huang, Y., Liu, J., Zhou, Q., Chen, X., and Huang, X.: Electrochemical determination of arsenic (III) with ultra-high anti-interference performance using Au–Cu bimetallic nanoparticles, Sensor. Actuat. B, 231, 70–78, https://doi.org/10.1016/j.snb.2016.03.009, 2016.
Zhao, G., Wang, H., Liu, G., and Wang, Z.: Box–Behnken response surface design for the optimization of electrochemical detection of cadmium by Square Wave Anodic Stripping Voltammetry on bismuth film/glassy carbon electrode, Sensor. Actuat. B, 235, 67–73, https://doi.org/10.1016/j.snb.2016.05.051, 2016.