the Creative Commons Attribution 4.0 License.
the Creative Commons Attribution 4.0 License.
 | 17 May 2019
Double entry method for the verification of data a chromatography data system receives
David Thomas Marehn
Detlef Wilhelm
Heike Pospisil
Roberto Pizzoferrato
The importance of software validation increases since the need for high usability and suitability of software applications grows. In order to reduce costs and manage risk factors, more and more recommendations and rules have been established. In the field of pharmacy the vendors of so-called chromatography data systems (CDSs) had to implement the guidelines of the Code of Federal Regulations Title 21 (CFR 21) during the last few years in order to fulfill the increasing requirements. The CFR 21 part 11 deals with electronic records and signatures. This part is binding for each company in the regulated environment that wishes to create, edit and sign electronic information instead of printing them on paper. Subsection CFR 21 part 11.10(h) explains how to perform an input check for manual user entries as well as for data that will be collected from an external device. In this article we present an approach performing the double entry method on data provided by the hardware instrument in order to investigate possible influences on the raw data by the handling CDS.
A software tool has been written which allows us to communicate with a high-performance liquid chromatography (HPLC) detector and acquire data from it. The communication is completely independent of a CDS which is started separately and connected to the same system. Using this configuration we made a parallel data acquisition of two instances at the same time possible. Two CDSs have been tested and for at least one of them it has been shown that a comparison of the acquired data can be done as with the double entry method for the data verification. For the second CDS we checked whether it would be applicable after a few modifications. The given approach could be either used for a live data verification of produced raw data or as a single test during a software operational qualification to verify the data acquisition functionality of the software.
- Article
(1566 KB) - Full-text XML
-
Supplement
(311 KB) - BibTeX
- EndNote


High usability and suitability, risk management and data integrity are terms more and more users of software applications have to consider when they integrate them into their standard operating procedures. Especially in the fields of medicine, pharmacy and the food industry any occurrence of risk to patients and customers leads to the usage of software applications whose developers established the principles of software validation in their software development life cycle. Following these guidelines helps to reduce long-term costs, failure rates and recalls (Center for Biologics Evaluation and Research Center for Devices and Radiological Health, 2002).
Manufacturers and vendors of analytical instruments like high-performance liquid chromatography (HPLC) or gas chromatography (GC) systems are requested to implement several parts of the Code of Federal Regulations Title 21 (CRF 21) if they would like to create a validated chromatography data system (CDS) software package for their product. The CFR 21 deals with the environment of food and drugs (Office of the Federal Register and National Archives and Records Administration, 2017) HPLC and GC instruments are mainly used for.
CFR 21 part 11.10(h)
The Code of Federal Regulations Title 21 (CFR 21) is divided into many parts, where part 11 deals with electronic records and signatures. The rules within this part are mandatory for each company that wishes to create, edit and sign any digital records instead of printing them on paper. Any company that works with HPLC/GC systems and establishes CFR 21 part 11 requires developers of CDSs to guarantee the defined guidelines within their software product, especially subparts 11.10 and 11.30. These ones explain how to control electronic records in closed and open systems using procedures like input checks, encryption, signatures and audit trails.
For this article we focused on point (h) of subpart 11.10: Use of device (e.g., terminal) checks to determine, as appropriate, the validity of the source of data input or operational instruction (Office of the Federal Register and National Archives and Records Administration, 2017). That means manually entered as well as automatically incoming data given to the software application (e.g., CDS) have to be validated and verified. The validation of data ensures sensible and reasonable inputs. Manual entries of data or automatically received data can be validated by checks for length, format and range (Bitesize, 2014a). The data verification on the other hand ensures that the incoming data match the original one. For manual entries there are two methods for the data verification (Bitesize, 2014b). The data could either be entered twice by two separate persons and compared afterwards using the double entry method or the entered data could be proofread using the original data as a reference. Both methods are time-consuming, especially when data are collected manually. The comparison of received data with a reference could be handled relatively quickly using an algorithm executed by a computer. But what about data provided by an analytical instrument like a HPLC system? Usually there are no reference data inside the instrument available for proofreading and the data will be acquired once by the connected controller, the CDS software package installed on the computer. To fulfill CFR 21 part 11.10(h) for data collected from an external instrument, an interpretation of this part says that a suitable connection between the hardware system and the controller and an identity verification of the source data is required (Ofni Systems, 2017). One suitable connection type is based on the TCP/IP protocol which uses handshakes and checksums in order to guarantee reliable transport of the data. But for the user themselves it is not apparent whether there happen to be any faults when preparing the data for the transport within the device or whether the acquiring software processes the raw data before making them available for export. We show how to perform the double entry method for the provided data of a HPLC system manufactured by Agilent Technologies based on parallel data acquisition using two instances that communicate with the instrument at the same time.
Usually one HPLC system will be controlled by one CDS. After an established connection a commercial CDS usually locks the instrument for a second one in order to avoid any manipulations to the experiment settings during a sequence run. But without a second CDS it is not possible to acquire signal data of a HPLC detector simultaneously within the same run because a second instance is required to acquire data from one source twice.
Dealing with this problem, new software written in C# has been developed called Second Controller Instance which is able to connect to a HPLC system manufactured by Agilent Technologies. In contrast to a fully functional CDS, our tool searches for a detector module in the HPLC cluster and uses as little access as possible in order to acquire its signal data only. The necessary communication is based on the freely available LICOP library provided by Agilent Technologies (Agilent Technologies, 2016). This library establishes a TCP/IP connection to the HPLC detector and provides several channels dealing with the module like sending instructions, monitoring, or acquiring raw data. After a successful connection the tool uses the two instructions
RAWD:SIGSTOR:SET "SourceNumber"
RAWD:SIG:SET "SourceNumber"
without quotation marks and send them via an instruction channel in order to subscribe to the raw data from the given source number. The source number depends on the given type of HPLC detector and the desired signal. Additionally these commands involve a module firmware “B.x” and higher (Agilent Technologies, 2014). All experiments in this article are done with a diode array detector and the desired signal is absorbance signal no. 1 of the detector. Therefore source number 0 has been chosen here. After the subscription to the data the so-called RAWD channel defined in the LICOP library will handle incoming data and provide it for the tool. This way it is possible to connect to the HPLC instrument even after the lock of the parallel-running CDS. A LAN connection to the HPLC system which allows two instances is necessary only. This can be handled by one LAN card that allows two instances or by two LAN cards in two different HPLC modules.
2.1 Analytical instruments
The setup shown in Fig. 1 using the Second Controller Instance has been executed on two different HPLC systems manufactured by Agilent Technologies. In the further course of this article they will be called systems A and B. System A consists of a G4225A degasser, G1312B binary pump, G1367E wellplate autosampler, G1330B autosampler thermostat, G1316C column compartment and G4212B diode array detector. The modules of system B are a G1322A degasser, G1311A quaternary pump, G1329A standard autosampler, G1316A column compartment and G1315D diode array detector.
All experiment sequences shown in Fig. 2 using a network protocol analyzer have been done with HPLC system B.
2.2 Chemicals
All experiments with the Second Controller Instance have been done using an isocratic test sample containing the four substances dimethyl phthalate, diethyl phthalate, biphenyl and o-terphenyl. These components were solved in methanol. The mobile phase consisted of a mix of 35 % vol HPLC-grade water and 65 % vol Acetonitrile and the stationary phase was an installed Zorbax xDB-C8 column supplied by Agilent Technologies according to a reverse-phase chromatography configuration. The column had a length of 50 mm, a diameter of 4.6 mm and a pore size of 1.8 µm.
For the network tracking experiments a simpler configuration was used. The sample was 50 µg mL−1 caffeine solved in HPLC-grade water. The mobile phase was HPLC-grade water. Due to one single substance in the sample no separation was needed, and so a restriction capillary was installed instead of a separation column.
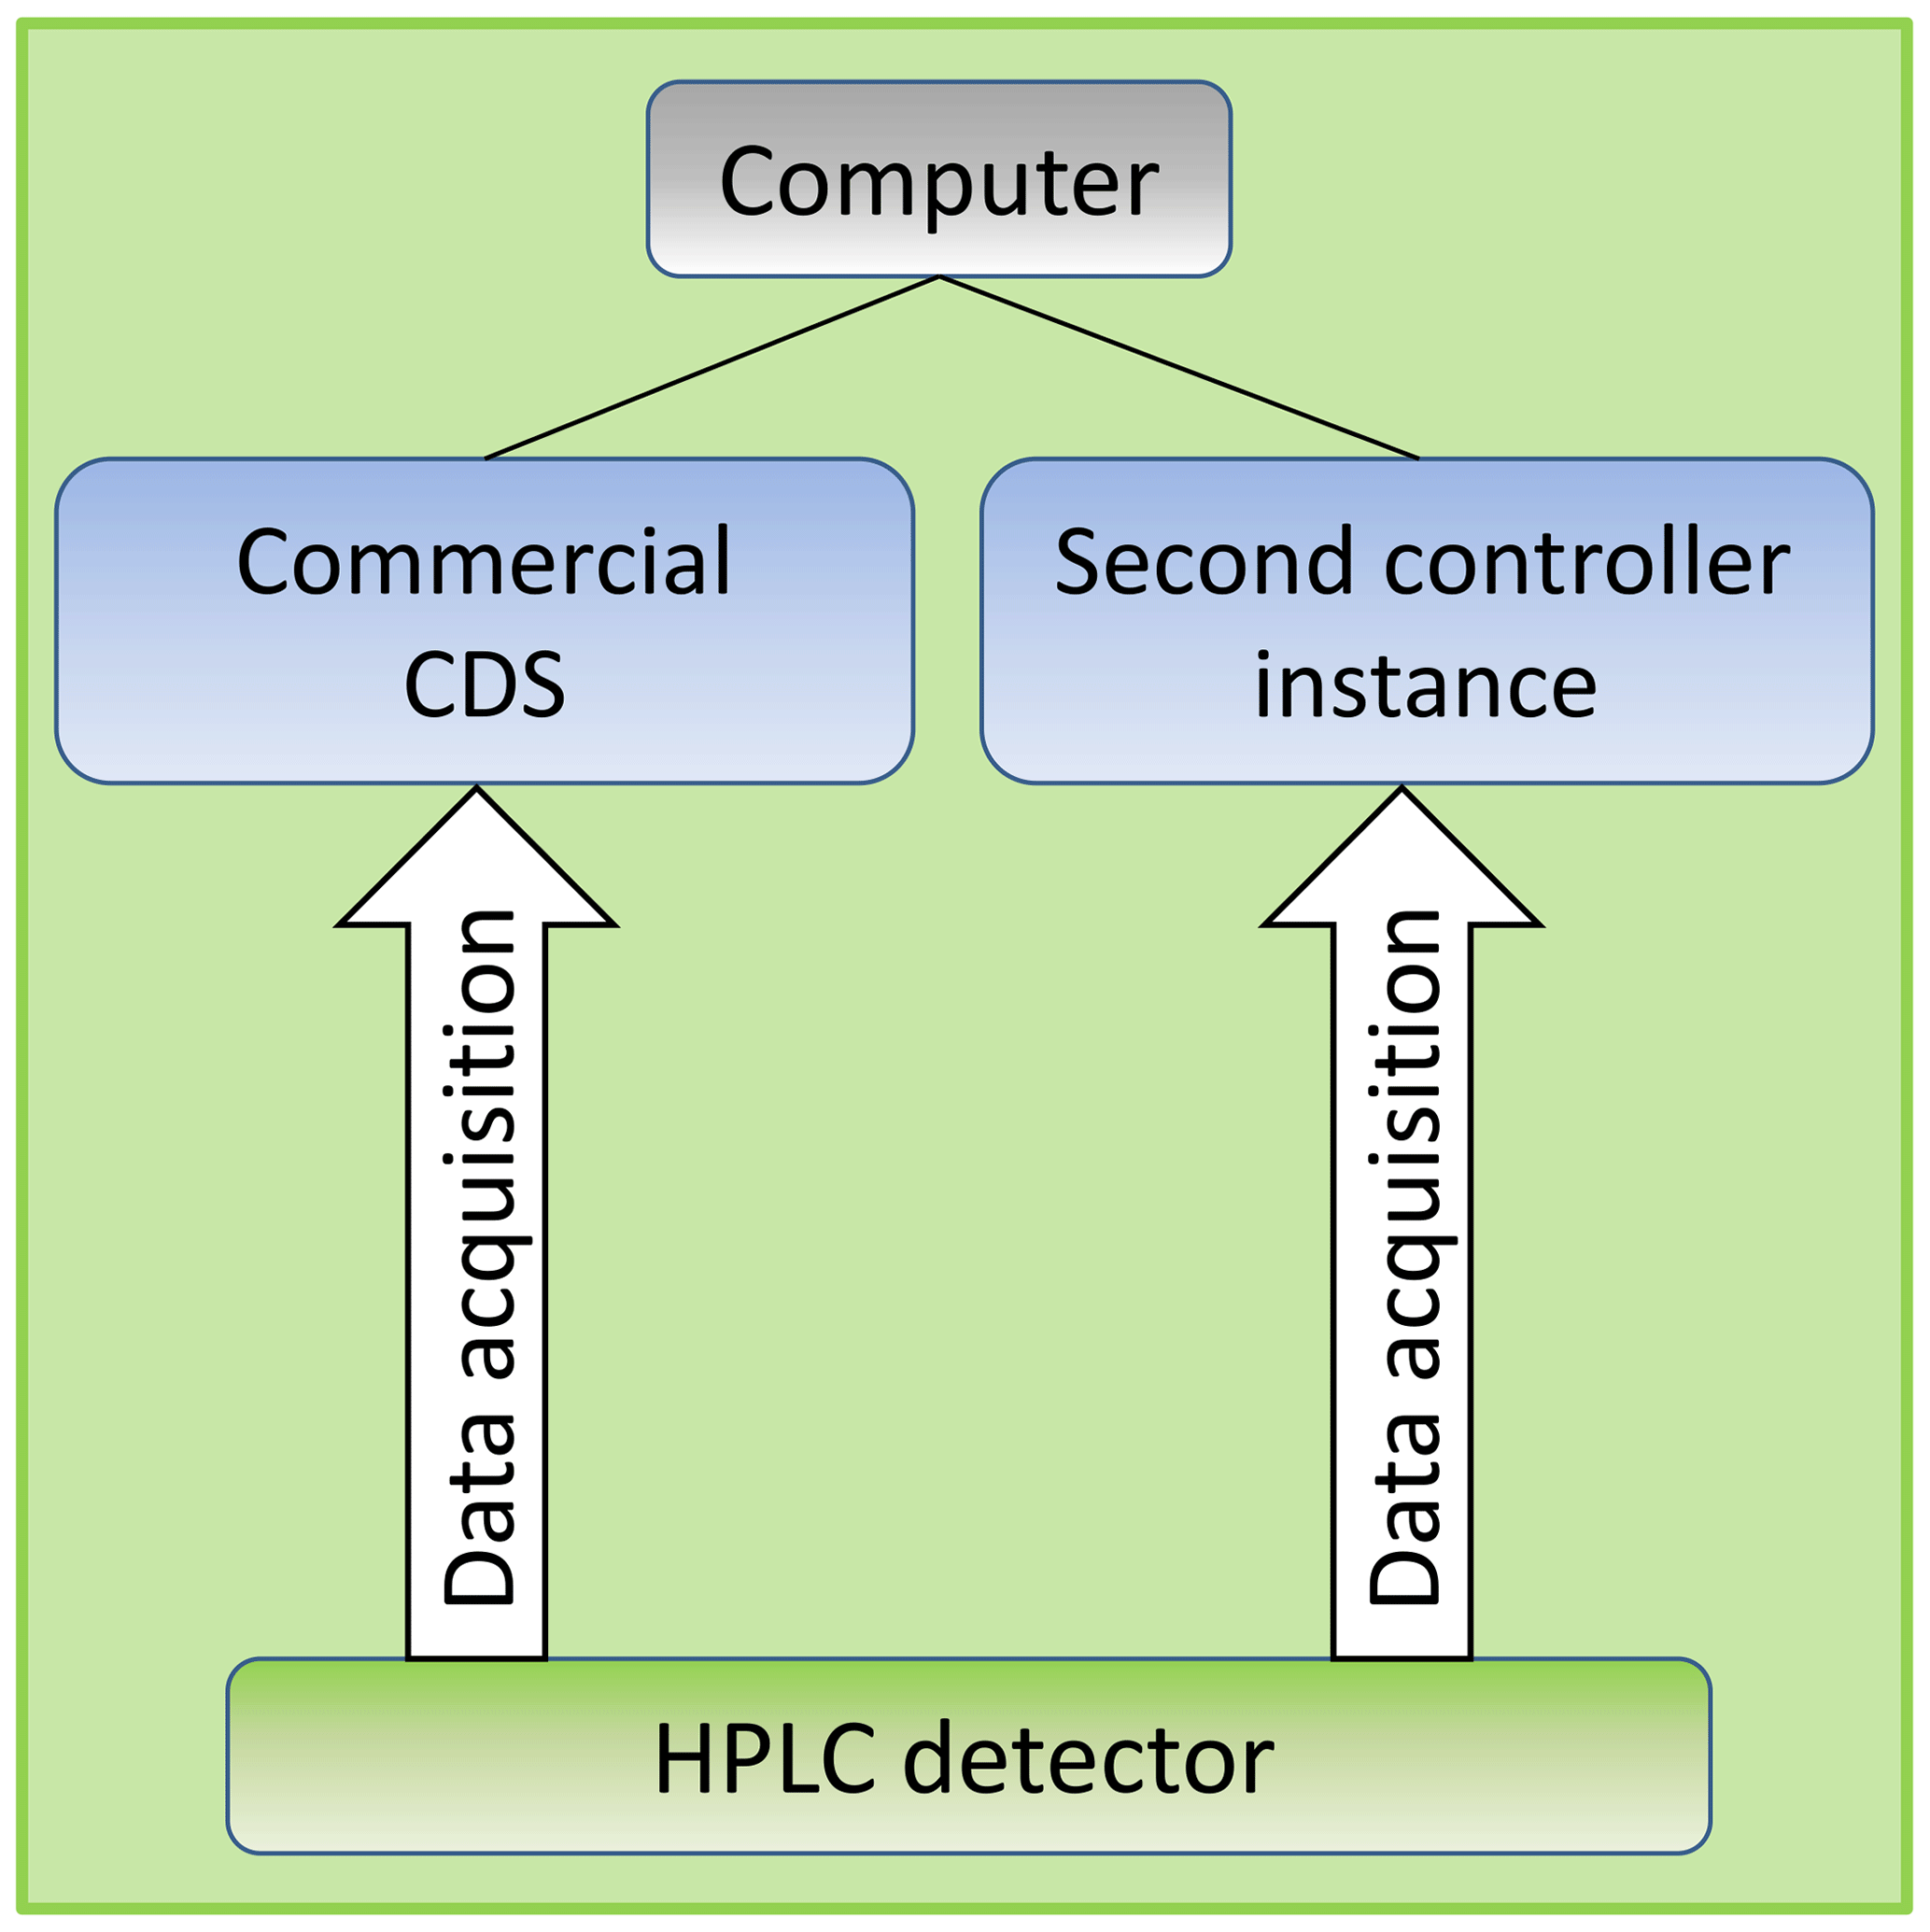
Figure 1The whole configuration using the Second Controller Instance for a parallel data acquisition. It runs concurrently with the commercial chromatography data system (CDS) which parameterizes the HPLC system and starts/stops all experiment sequences.
2.3 Experiment setup
Two setups have been created. The first one was used to evaluate the reliability of a second instance acquiring data in parallel for the double entry method. The second setup included a network tracking to examine possible processing of the raw data provided by the device during the storage procedure.
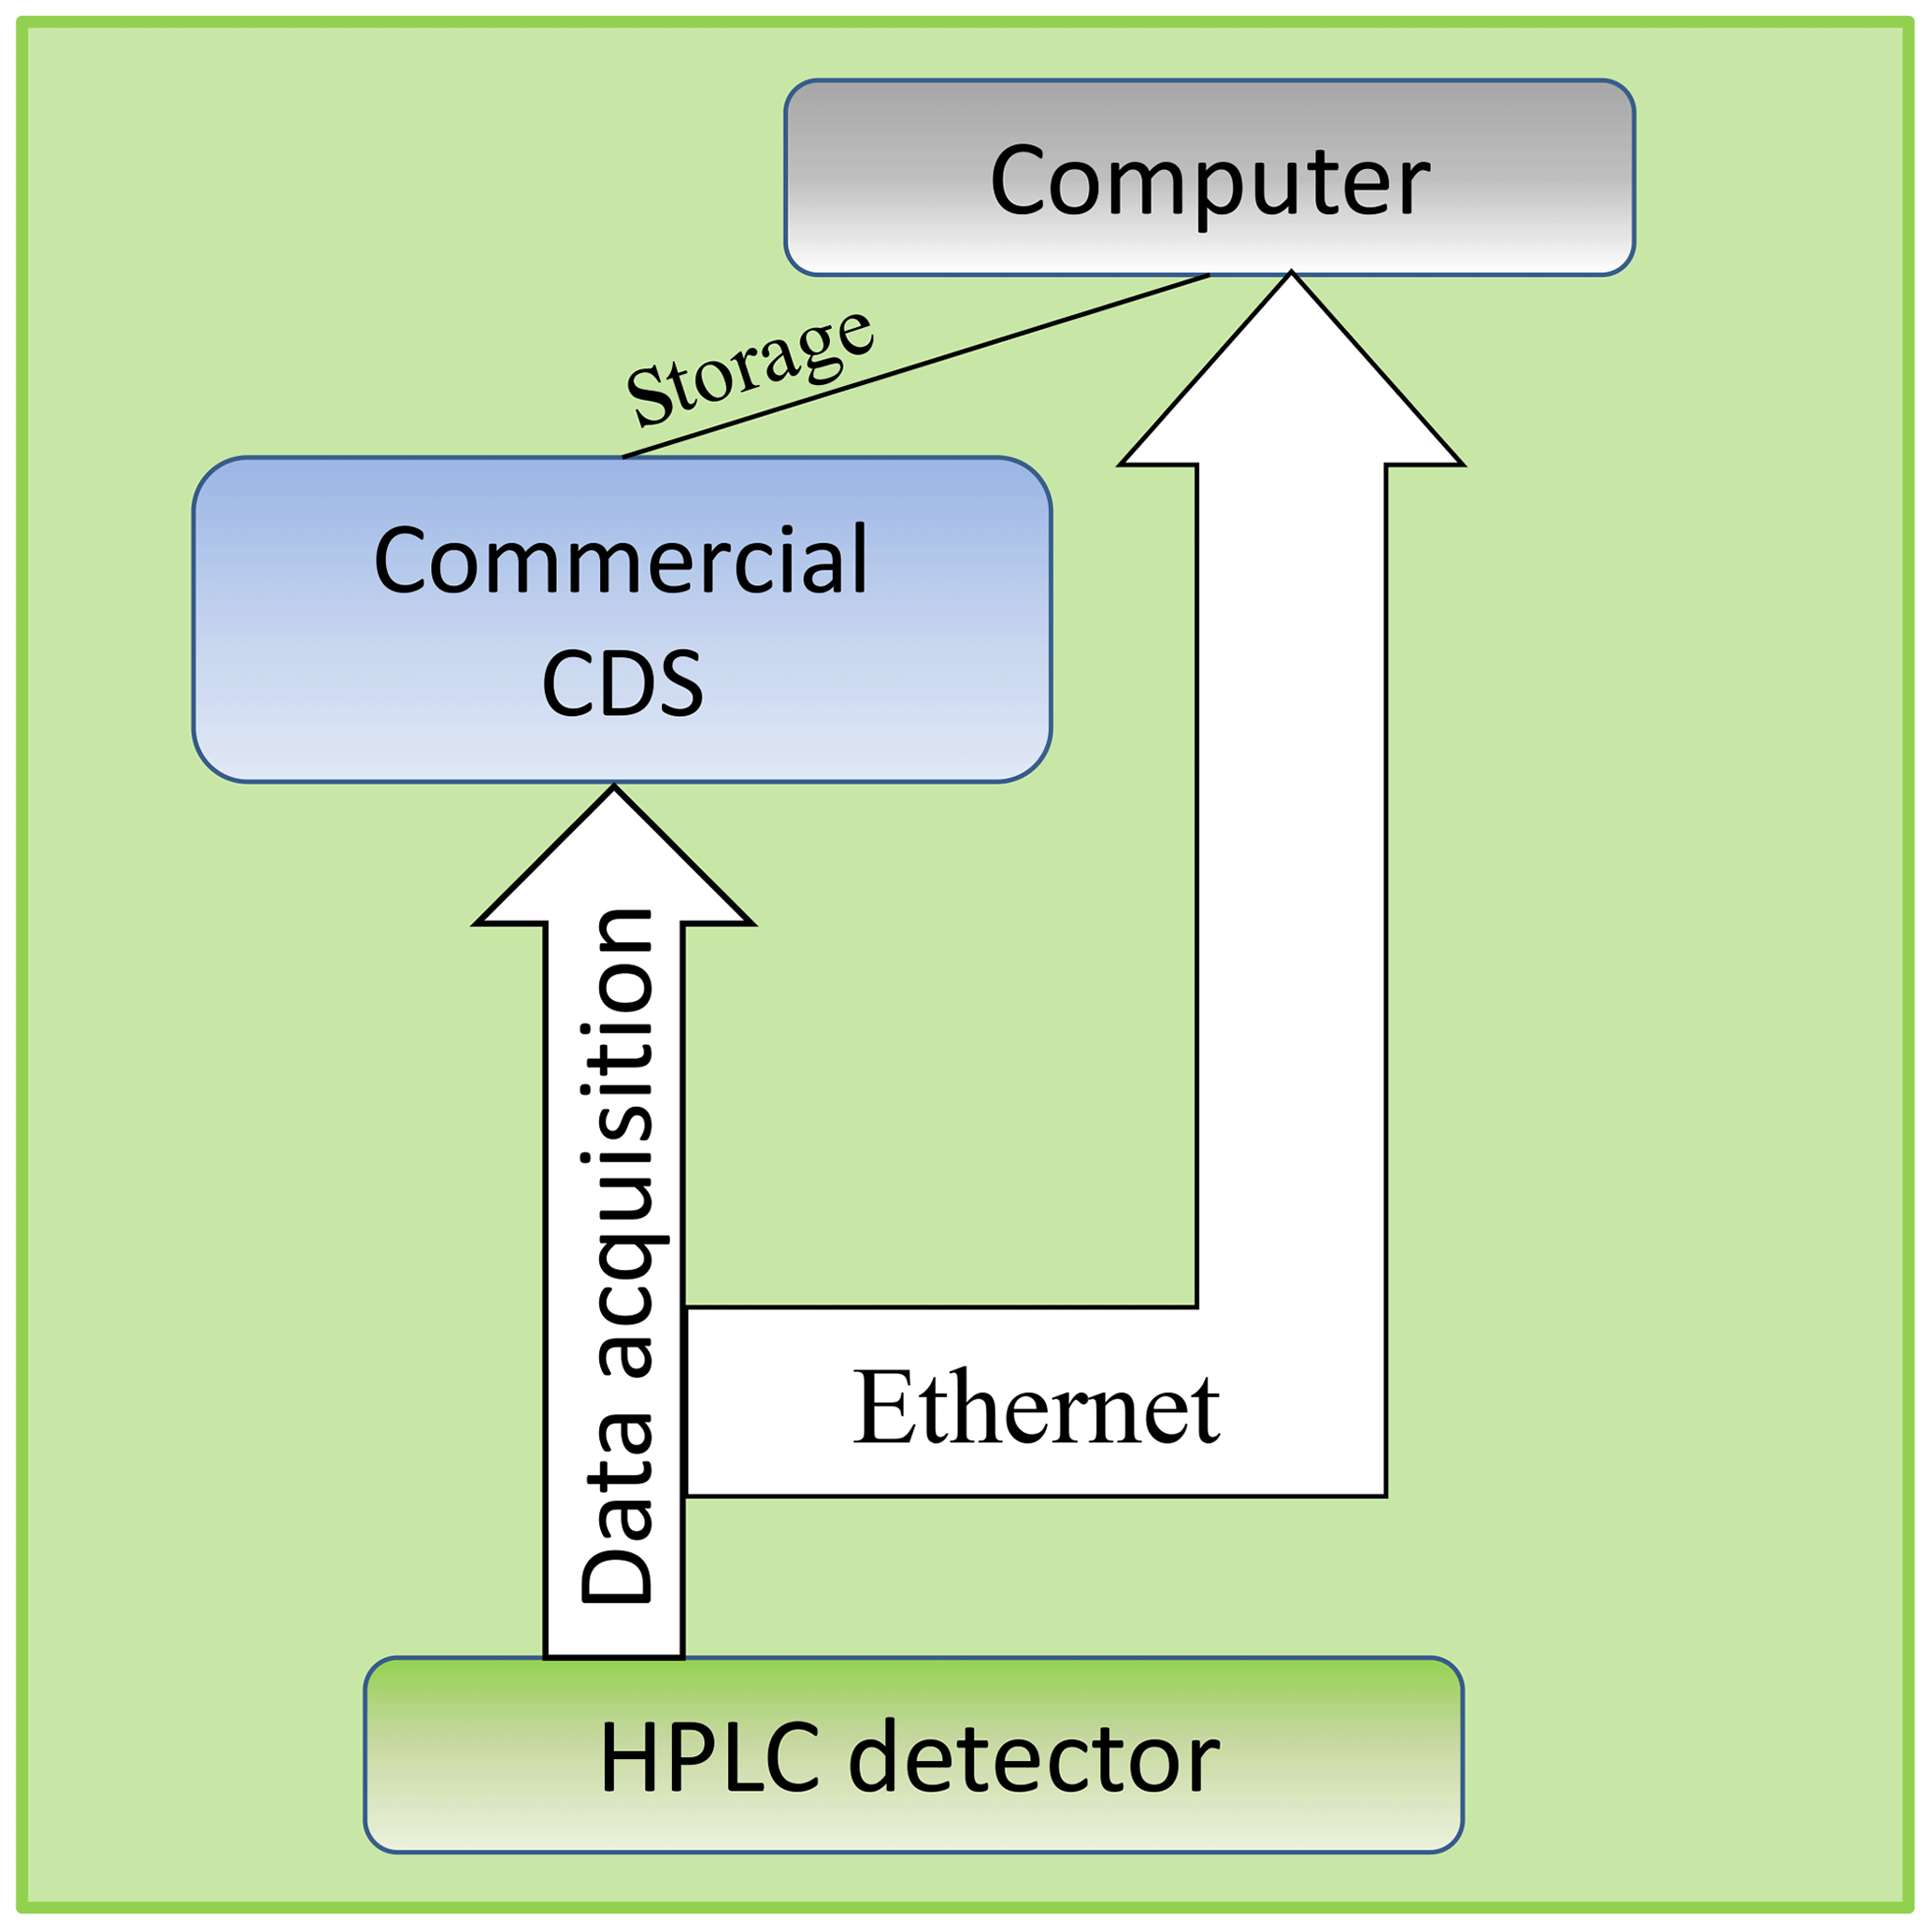
Figure 2The network tracking of the data transmitted using TCP over the ethernet bypasses the not well-known storage procedure of the acquired raw data of the commercial CDS.
2.3.1 Second Controller Instance
The complete HPLC systems A and B were parameterized and controlled by commercial CDS OpenLab ChemStation® (Rev. C.01.07 Build 27) developed and published by Agilent Technologies or by Chromeleon® (Rev. 6.80 SR15 Build 4656) developed and published by Thermo Fischer without any influence of the Second Controller Instance. But during the run all generated data were received in parallel by both the CDS and the Second Controller Instance as shown in Fig. 1.
Both CDSs were used to set up the following specifications for the experiments: 1 mL min−1 flow, 1 µL injection volume, 40 ∘C column temperature and 254 nm detection wavelength for absorbance signal no. 1. These parameters were fixed for each experiment, but several available detector sampling rates were used by changing the “expected narrowest peak width at half height” parameter of the HPLC detector. For HPLC detectors manufactured by Agilent Technologies this parameter implies a specific combination of sampling rate and signal filtration. For example, a configured “expected narrowest peak width at half height” of 0.0125 min (0.75 s) using a G4212B DAD detector leads to a sampling rate of 20 Hz and a response time of 0.2 s as the filtration value.
Every experiment condition has been repeated 10 times. After the setup of the HPLC cluster by the CDS, the Second Controller Instance has been executed and connected to the same system. Then the Second Controller Instance was requested to subscribe to the detector signal data. The incoming data handled by the raw data channel (RAWD) of the LICOP library were interpreted by the Second Controller Instance tool relating to the data specification (Agilent Technologies, 2014). That way the Second Controller Instance created separate text files for each run containing a header and the raw data.
2.3.2 Raw data check by network tracking
For the tracking of the data transmitted over the ethernet using TCP the Wireshark network protocol analyzer tool (v.2.0.5) developed by Wireshark-Community was used. This tool allows us to catch data packages between the HPLC device and computer that will be sent and received via TCP and UDP. As shown in Fig. 2 this constellation bypasses the unknown storage process of the CDS or LICOP library used by our Second Controller Instance.
Using this setup a simple run was performed injecting 10 µL of the caffeine solution. The flow of the pump was set to 1 mL min−1 and the detector wavelength to 273 nm for absorbance signal no. 1. The temperature control of the column compartment was turned off here. The provided data were acquired then either by our Second Controller Instance or CDS Chromeleon® and caught by Wireshark at the same moment.
All experiments using the commercial CDS and Second Controller Instance resulted in chromatograms as shown in Fig. 3 or similar ones. The four substances of the isocratic test sample have been separated and correspond to the four peaks. The shown chromatograms in Fig. 3 were acquired by OpenLab ChemStation® and generated by HPLC system A using a sampling rate of 20∕2.5 Hz and a response time of 0.5∕2 s as a signal filtration parameter. This is the usual result of a CDS before the data processing is executed including peak detection and peak integration in order to evaluate the chromatogram.
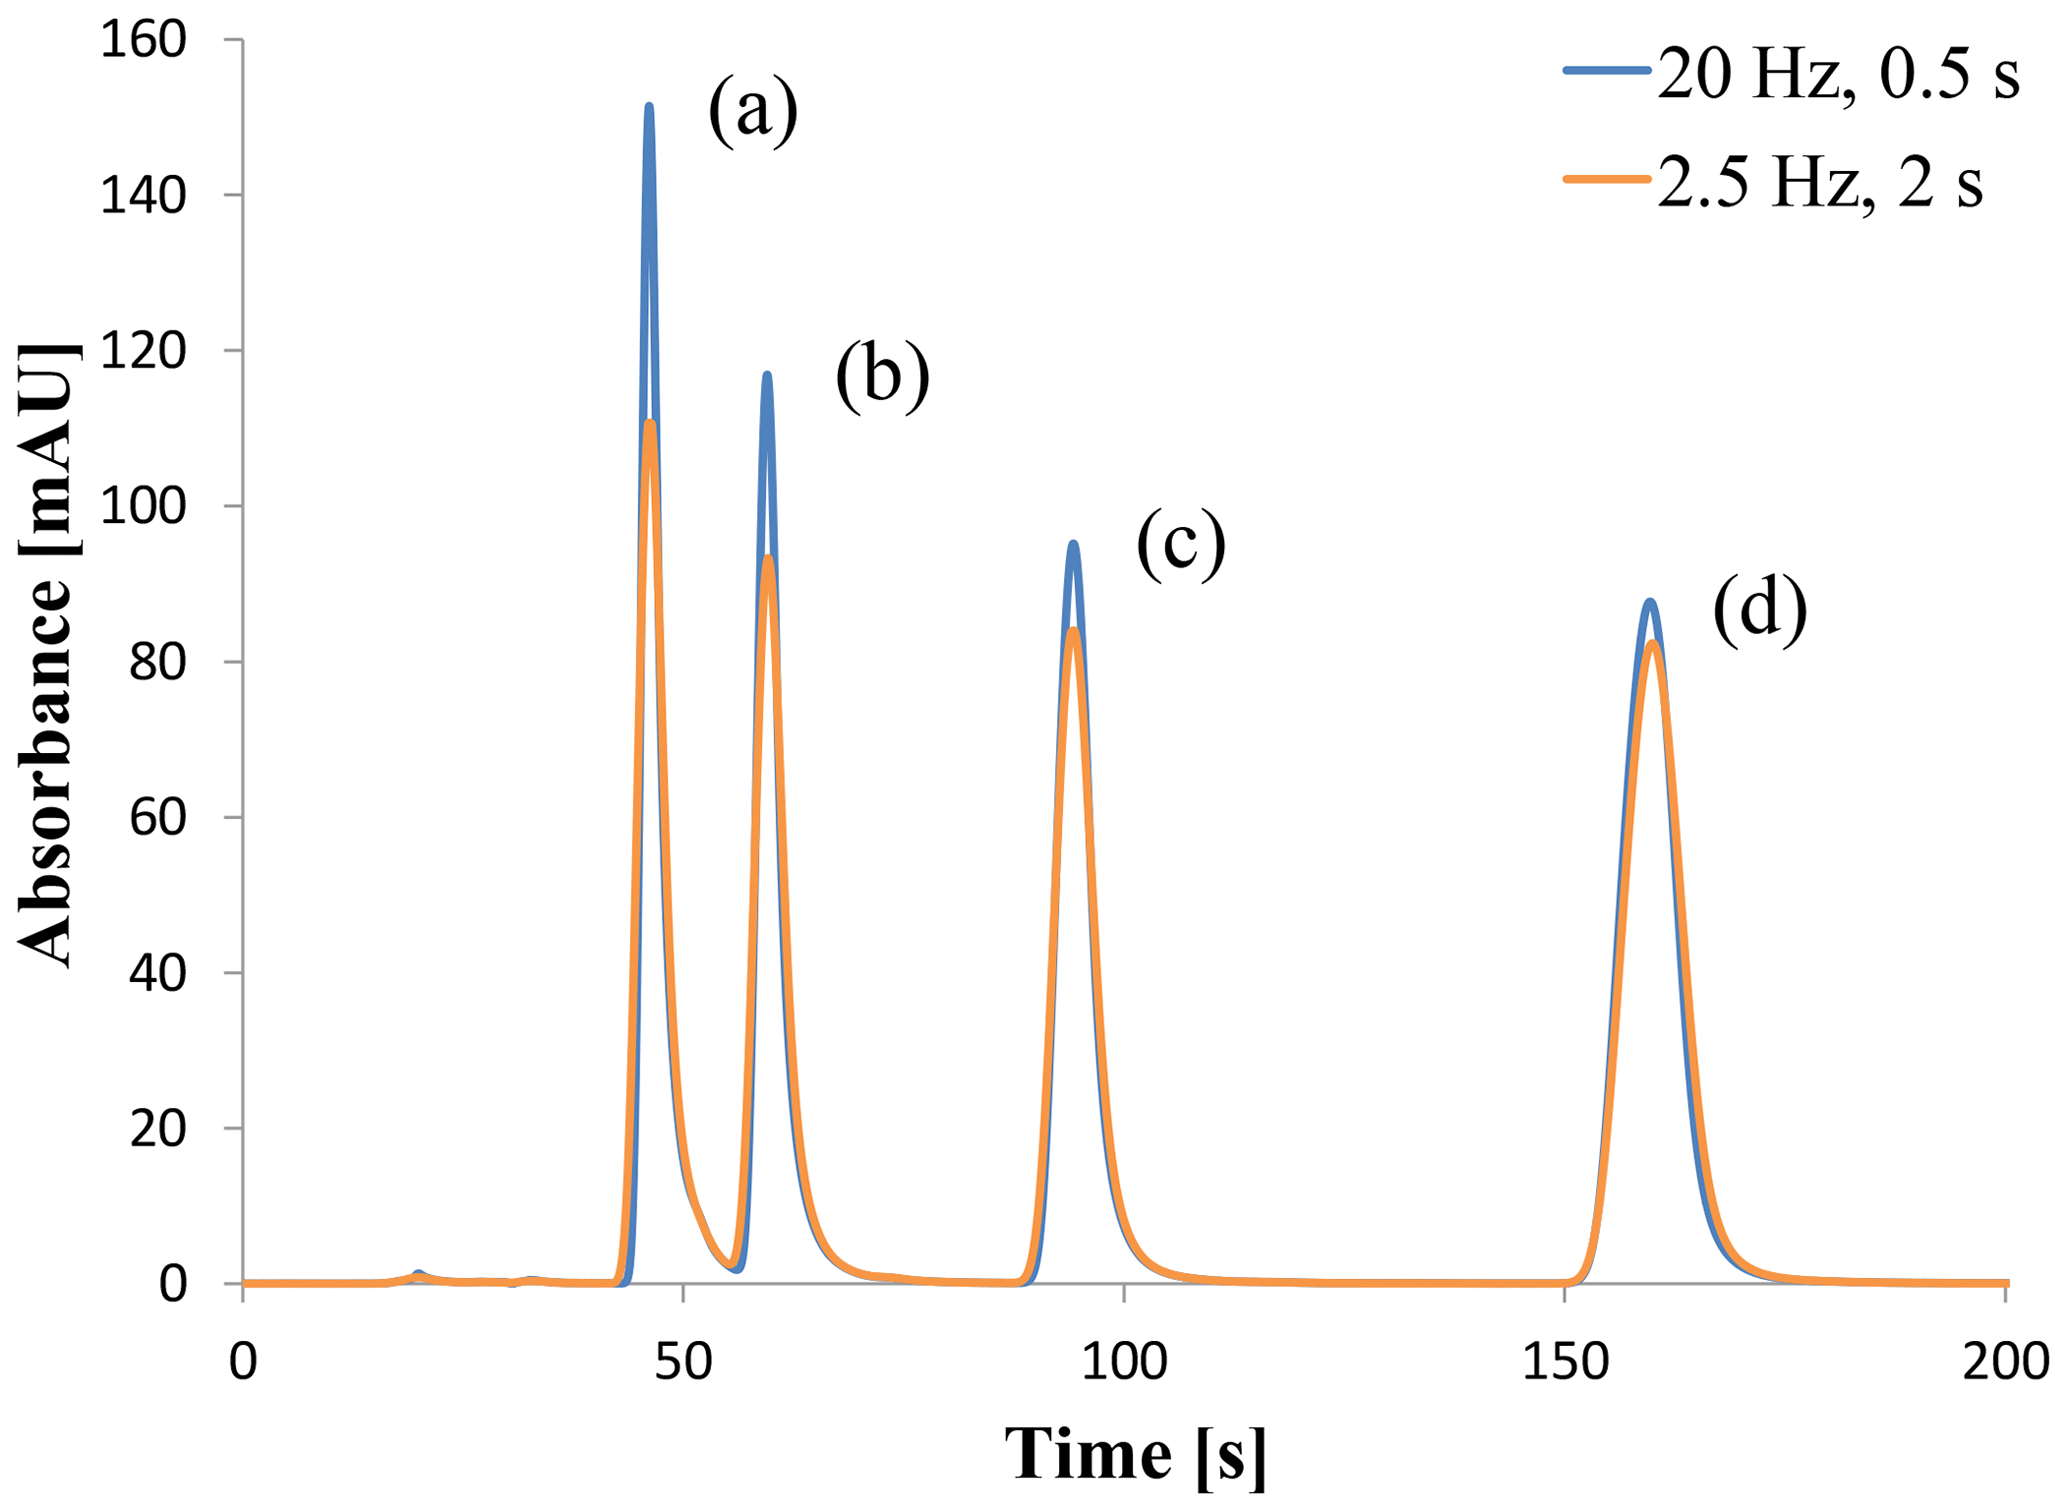
Figure 3Chromatogram of dimethyl phthalate (a), diethyl phthalate (b), biphenyl (c) and o-terphenyl (d) using a sampling rate of 20 Hz and a response time (signal filtration) of 0.5 s or 2.5 Hz and a response time of 2 s.
3.1 Double entry method
For the data verification of the chromatogram a complete comparison of all data points between the two instances that acquired the absorbance signal is necessary as for the double entry method. Such a comparison is shown in Fig. 4. The deviation of the signal given as the difference between the signal value of CDS OpenLab ChemStation® and the Second Controller Instance is plotted against time like in the default chromatogram (Fig. 3). Two experiments are shown using two different sampling rates and response times. Both plots present an increasing deviation at the time range of the peaks. Only for the first peak does the deviation exceed a value of 10−5 or mAU. This also applies to the second peak using a 20 Hz sampling rate and 0.5 s response time.
A closer examination of the data points shows that the deviation completely depends on the data accuracy given as the available number of decimal places. The exported data from OpenLab ChemStation® have a single precision which represents up to 7 digits where the acquired data of the Second Controller Instance have a double precision with 15 digits. So all the deviations are caused by rounding. Rounding the Second Controller Instance data like for example 150.307349860668 mAU at time point 46 s to single precision 150.3073 mAU leads to totally equal data points. This behavior applies for all experiments done with systems A and B and every used sampling rate/response time.
The phenomenon that the deviation of the second peak in Fig. 4 got a greater maximum is based on the sampling rate. A lower sampling rate can lead to a lower peak height (Wahab et al., 2016; Felinger et al., 2015) that is visible in Fig. 3. That is why the signal value of the second peak exceeds a value of 100 mAU (single precision with a maximum of four decimal places now), leading to a deviation greater than 10−5 mAU for a 20 Hz sampling rate but not for a 2.5 Hz sampling rate.
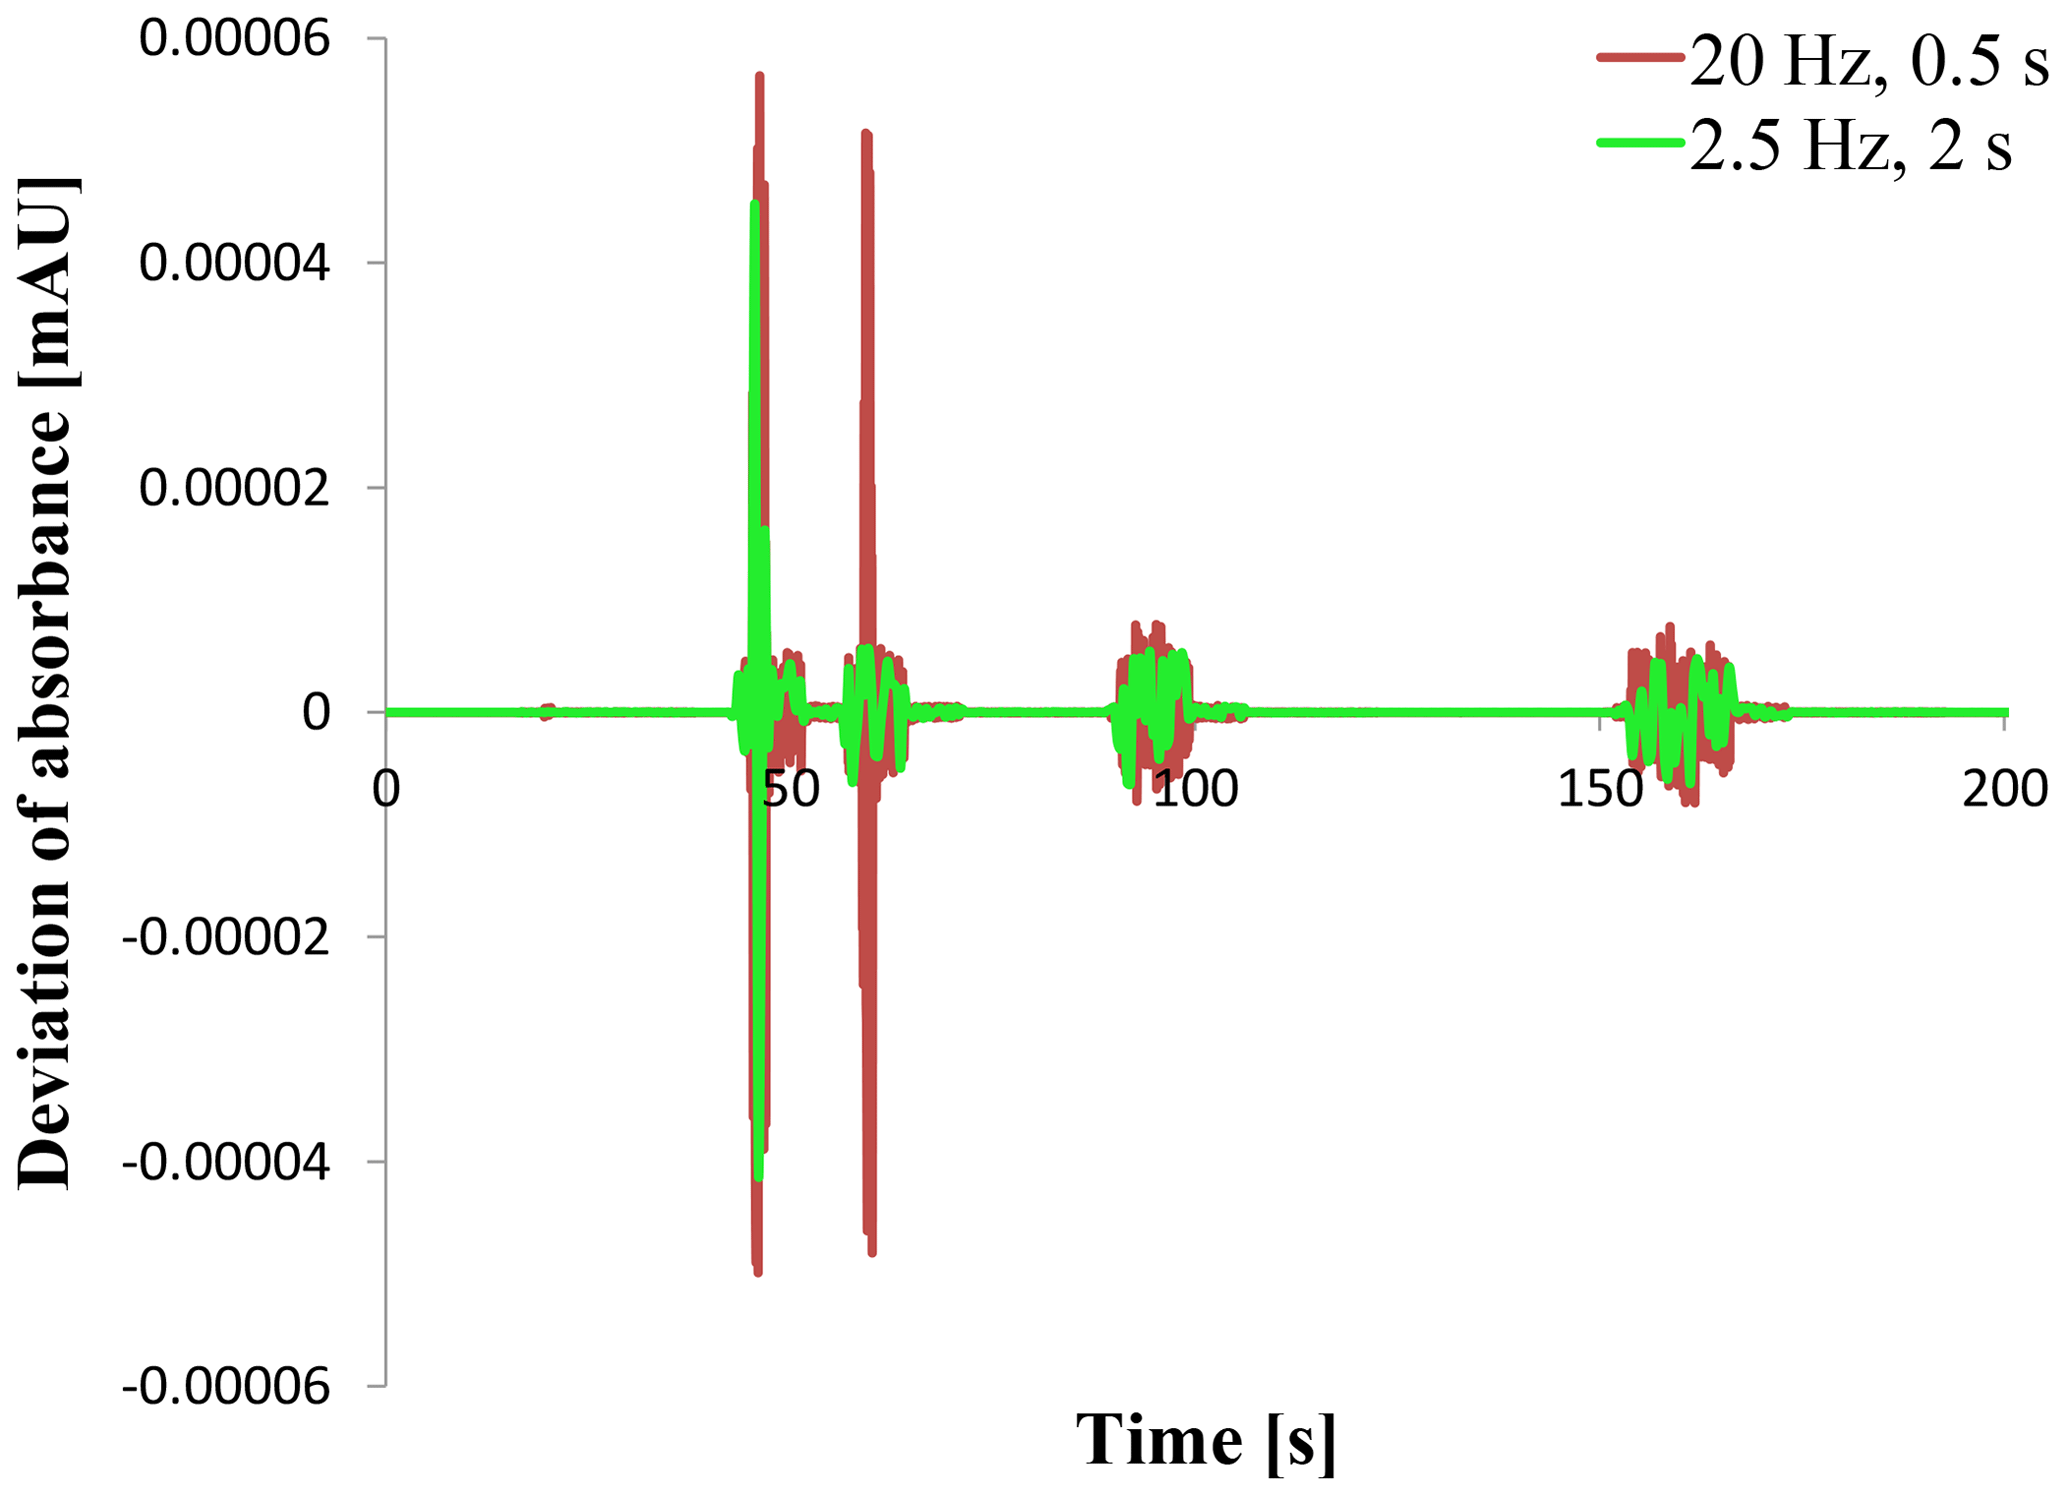
Figure 4Signal deviation as the difference between OpenLab ChemStation® and Second Controller Instance when using sampling rates of 20 Hz (0.5 s response time) and 2.5 Hz (2 s response time).
A comparison of the raw data acquired by Chromeleon® and Second Controller Instance from HPLC system A resulted in Fig. 5. In contrast to Fig. 4 the deviation is much higher and depends on the configured sampling rate/response time. Additionally there are two peaks (one negative and one positive) describing one peak in the default chromatogram. These peaks visualize that the biggest deviation occurs during the rising and falling areas of the peaks in the chromatogram. That means the negative deviation increases to a local minimum and decreases afterwards until the apex of the peak when crossing the abscissa in the deviation plot. Then the deviation increases once more in a positive way when the peak is falling. The minimum and maximum seem to be the inflection points caused by the greatest slope at these points.
This information indicates that there is a time delay between the signal acquired by Chromeleon® and Second Controller Instance because this explains why a low change in the signal leads to a marginal deviation where a great signal slope (e.g., at the inflection points) induces a high deviation between two data points. As is visible in Fig. 5, a higher sampling rate reduces the maximal deviation due to a smaller time delay between two data points. In this case the global maximum decreases 5.7-fold when using 20 Hz instead of 2.5 Hz. The dependency on the sampling rate also applies to HPLC system B.
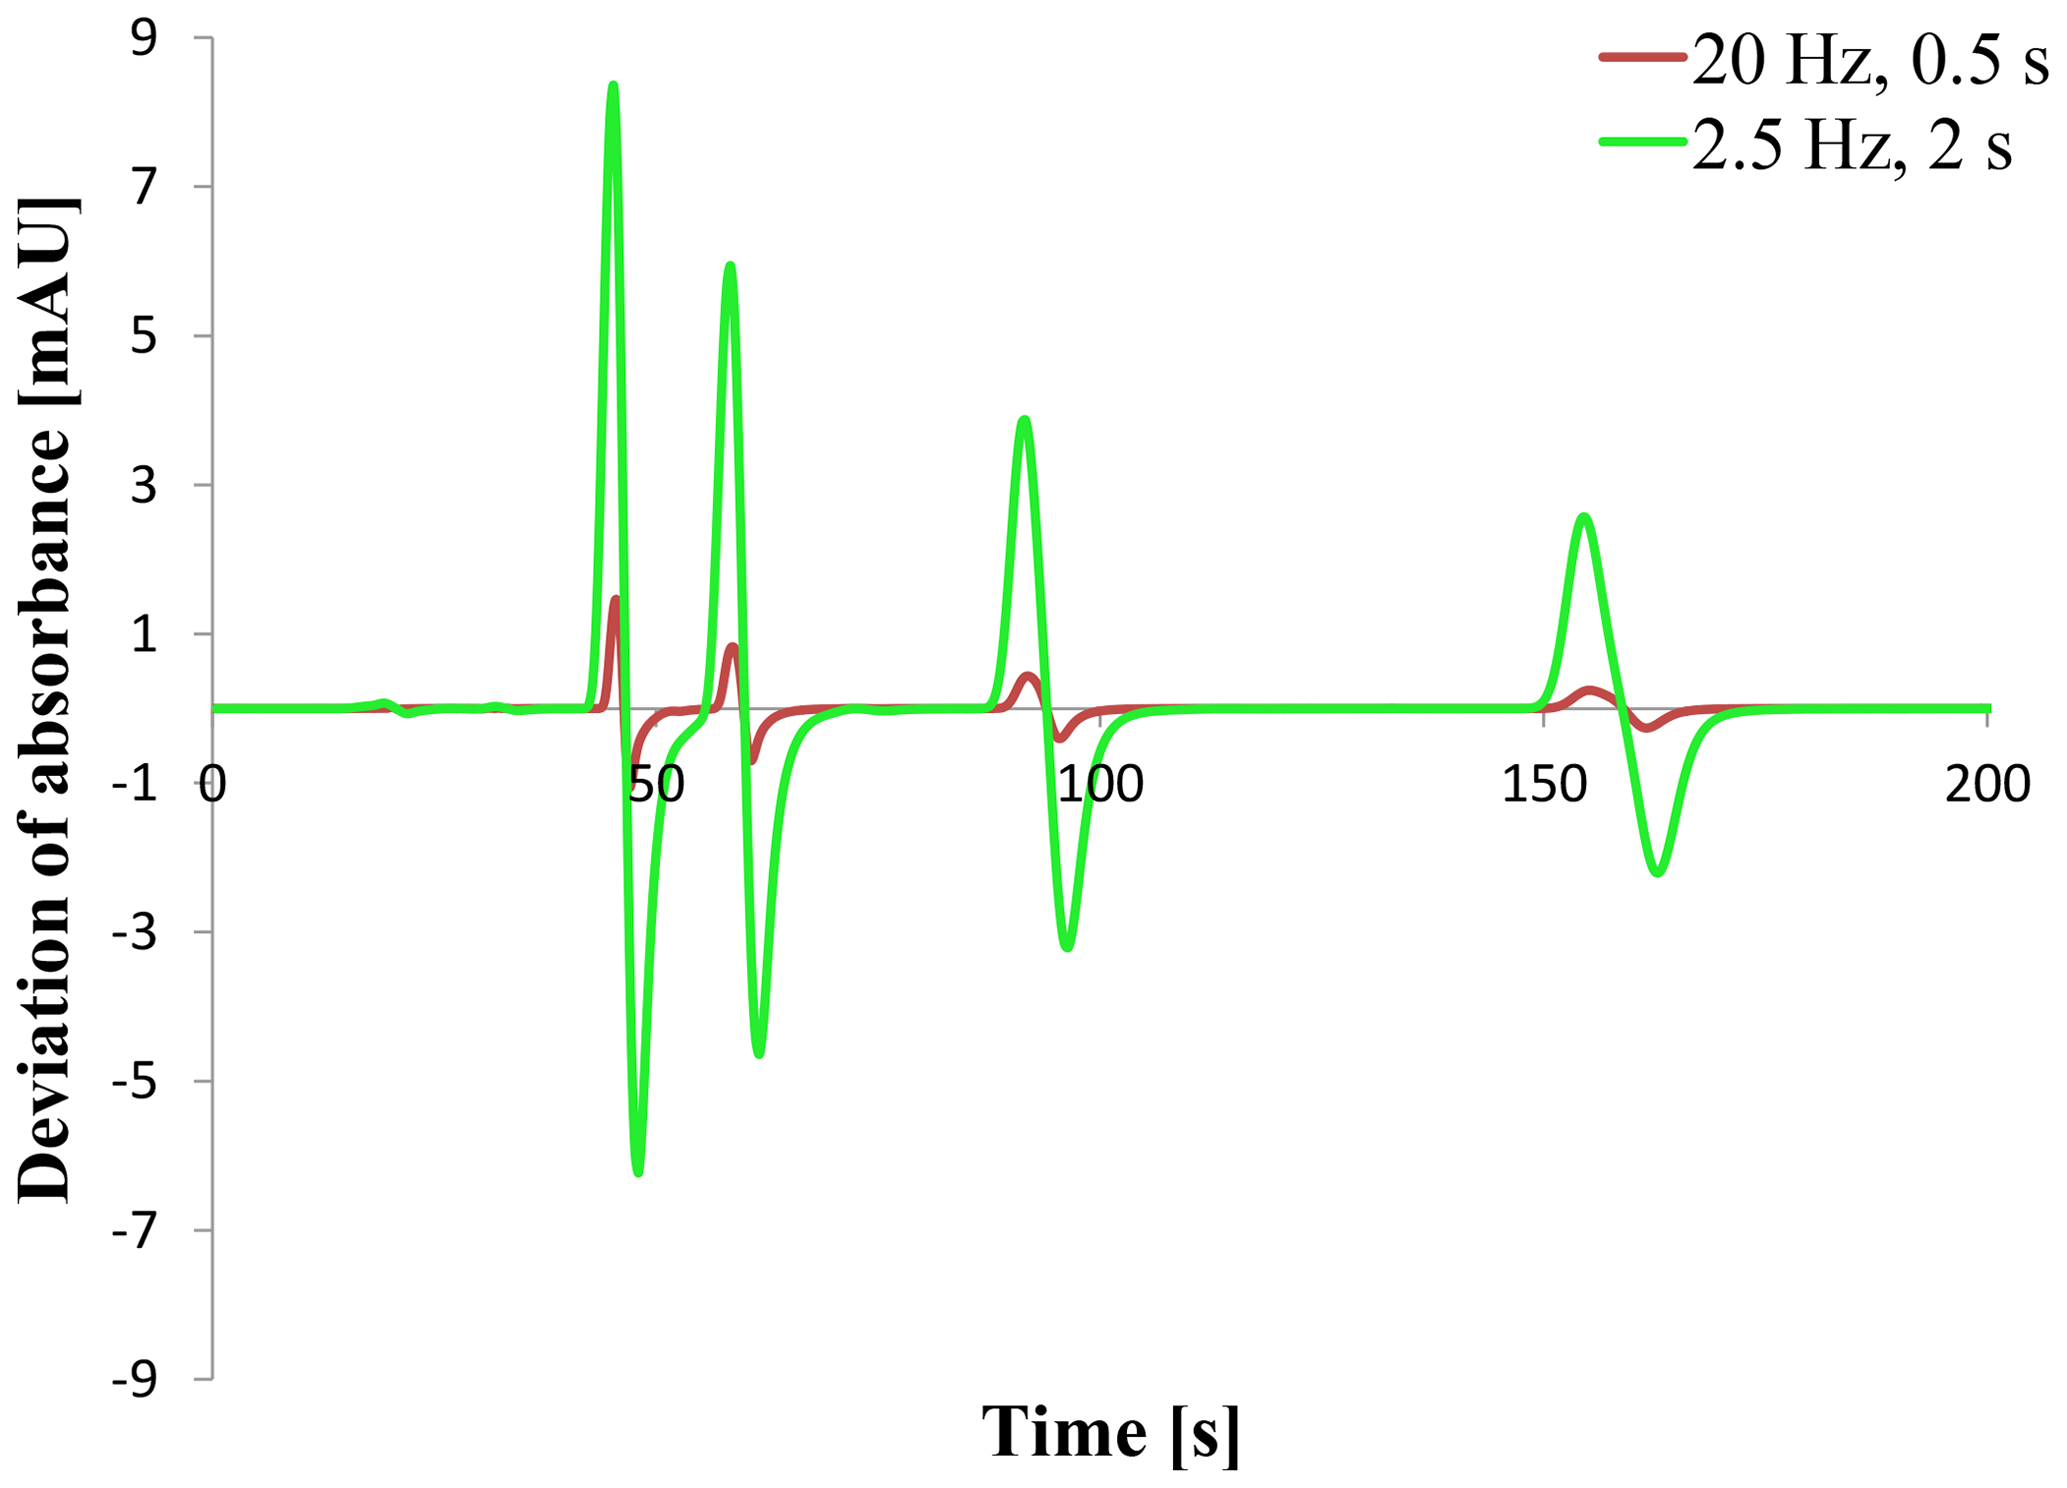
Figure 5Signal deviation as the difference between Chromeleon® and Second Controller Instance when using a sampling rate of 20 Hz (0.5 s response time) and 2.5 Hz (2 s response time).
3.2 Data handling of the LICOP library
The relative large deviations between the stored and exported data of CDS Chromeleon® and our Second Controller Instance brought us to a more detailed comparison of the raw data that will be provided by the HPLC device and stored by the corresponding software package. First of all we wanted to find out whether the two tested CDSs are using different drivers communicating with the device. But by means of the Wireshark network protocol analyzer it has been determined that both CDSs OpenLab ChemStation® and Chromeleon® are based on the LICOP library, too. On the one hand the library file exists in the installation location of both CDSs and on the other hand the commands that have been sent to the device and caught in the network are equal or similar to the Second Controller Instance, which is definitely based on the library.
On the basis of the fact that the LICOP is the only external library used by the Second Controller Instance whose source code is unknown, the influence of that library on the incoming data was checked. Therefore, a single injection of a caffeine solution was performed, resulting in a chromatogram containing one peak. The data were acquired and stored by the Second Controller Instance and caught in parallel by the network analyzer. The provided data of the HPLC device within the TCP packages are given as hexadecimal values. For the interpretation of the data format a description file was used (Agilent Technologies, 2014). That way the data which belong to the run of the experiment have been extracted and converted from hexadecimal to decimal format. These values have the unit count. In order to compare the raw data, the counts have been converted to mAU using a factor of 2 097 152 counts per AU, which could be requested from the HPLC detector. So the conversion from counts to mAU can be done using Eq. (1).
Example:
A value-by-value comparison of the stored and caught raw data showed that both of them are totally equal. The conversion and comparison of all data points around the peak are presented in the Supplement. That means the underlying LICOP library does not modify the incoming raw data just before they are available for the Second Controller Instance.
3.3 Processing of the raw data during the storage procedure within CDS Chromeleon®
As with the LICOP library an experiment using the network analyzer has been performed in order to bypass the data storage procedure of the CDS (Fig. 2). The experiment conditions are similar. The caffeine solution has been injected, generating a chromatogram with one peak, and Chromeleon® acquired the data. Meanwhile, the network was tracked simultaneously.
For the purpose of avoiding incorrect settings several options available from Chromeleon® have been tried out in order to get the totally equal raw data that the device provides. In addition to the usual setup of the device the CDS allows us to configure the handling of the incoming data. Two parameters called step and average are available for this. The step parameter can be set to “auto” or to a fixed value meaning the step width between two data points in seconds. The “auto” option induces an algorithm which calculates a dynamic sampling rate and stores the data using it. In order to get equidistant data as provided by the device we used a fixed step value. The average parameter defines which kind of reducing method will be performed if the slice width of the provided data by the device is lower than the given step value. If the average parameter is set to off, only every nth data point will be stored. If it is set to on, the data will be bunched by computing the average of several data points to form a new one. That means if the given slice width for example is 0.01 s (100 Hz sampling rate) and the entered step value is 0.2 s (20 Hz sampling rate), either every fifth data point will be stored only (average = off) or five data points will be averaged to form one data point (average = on).
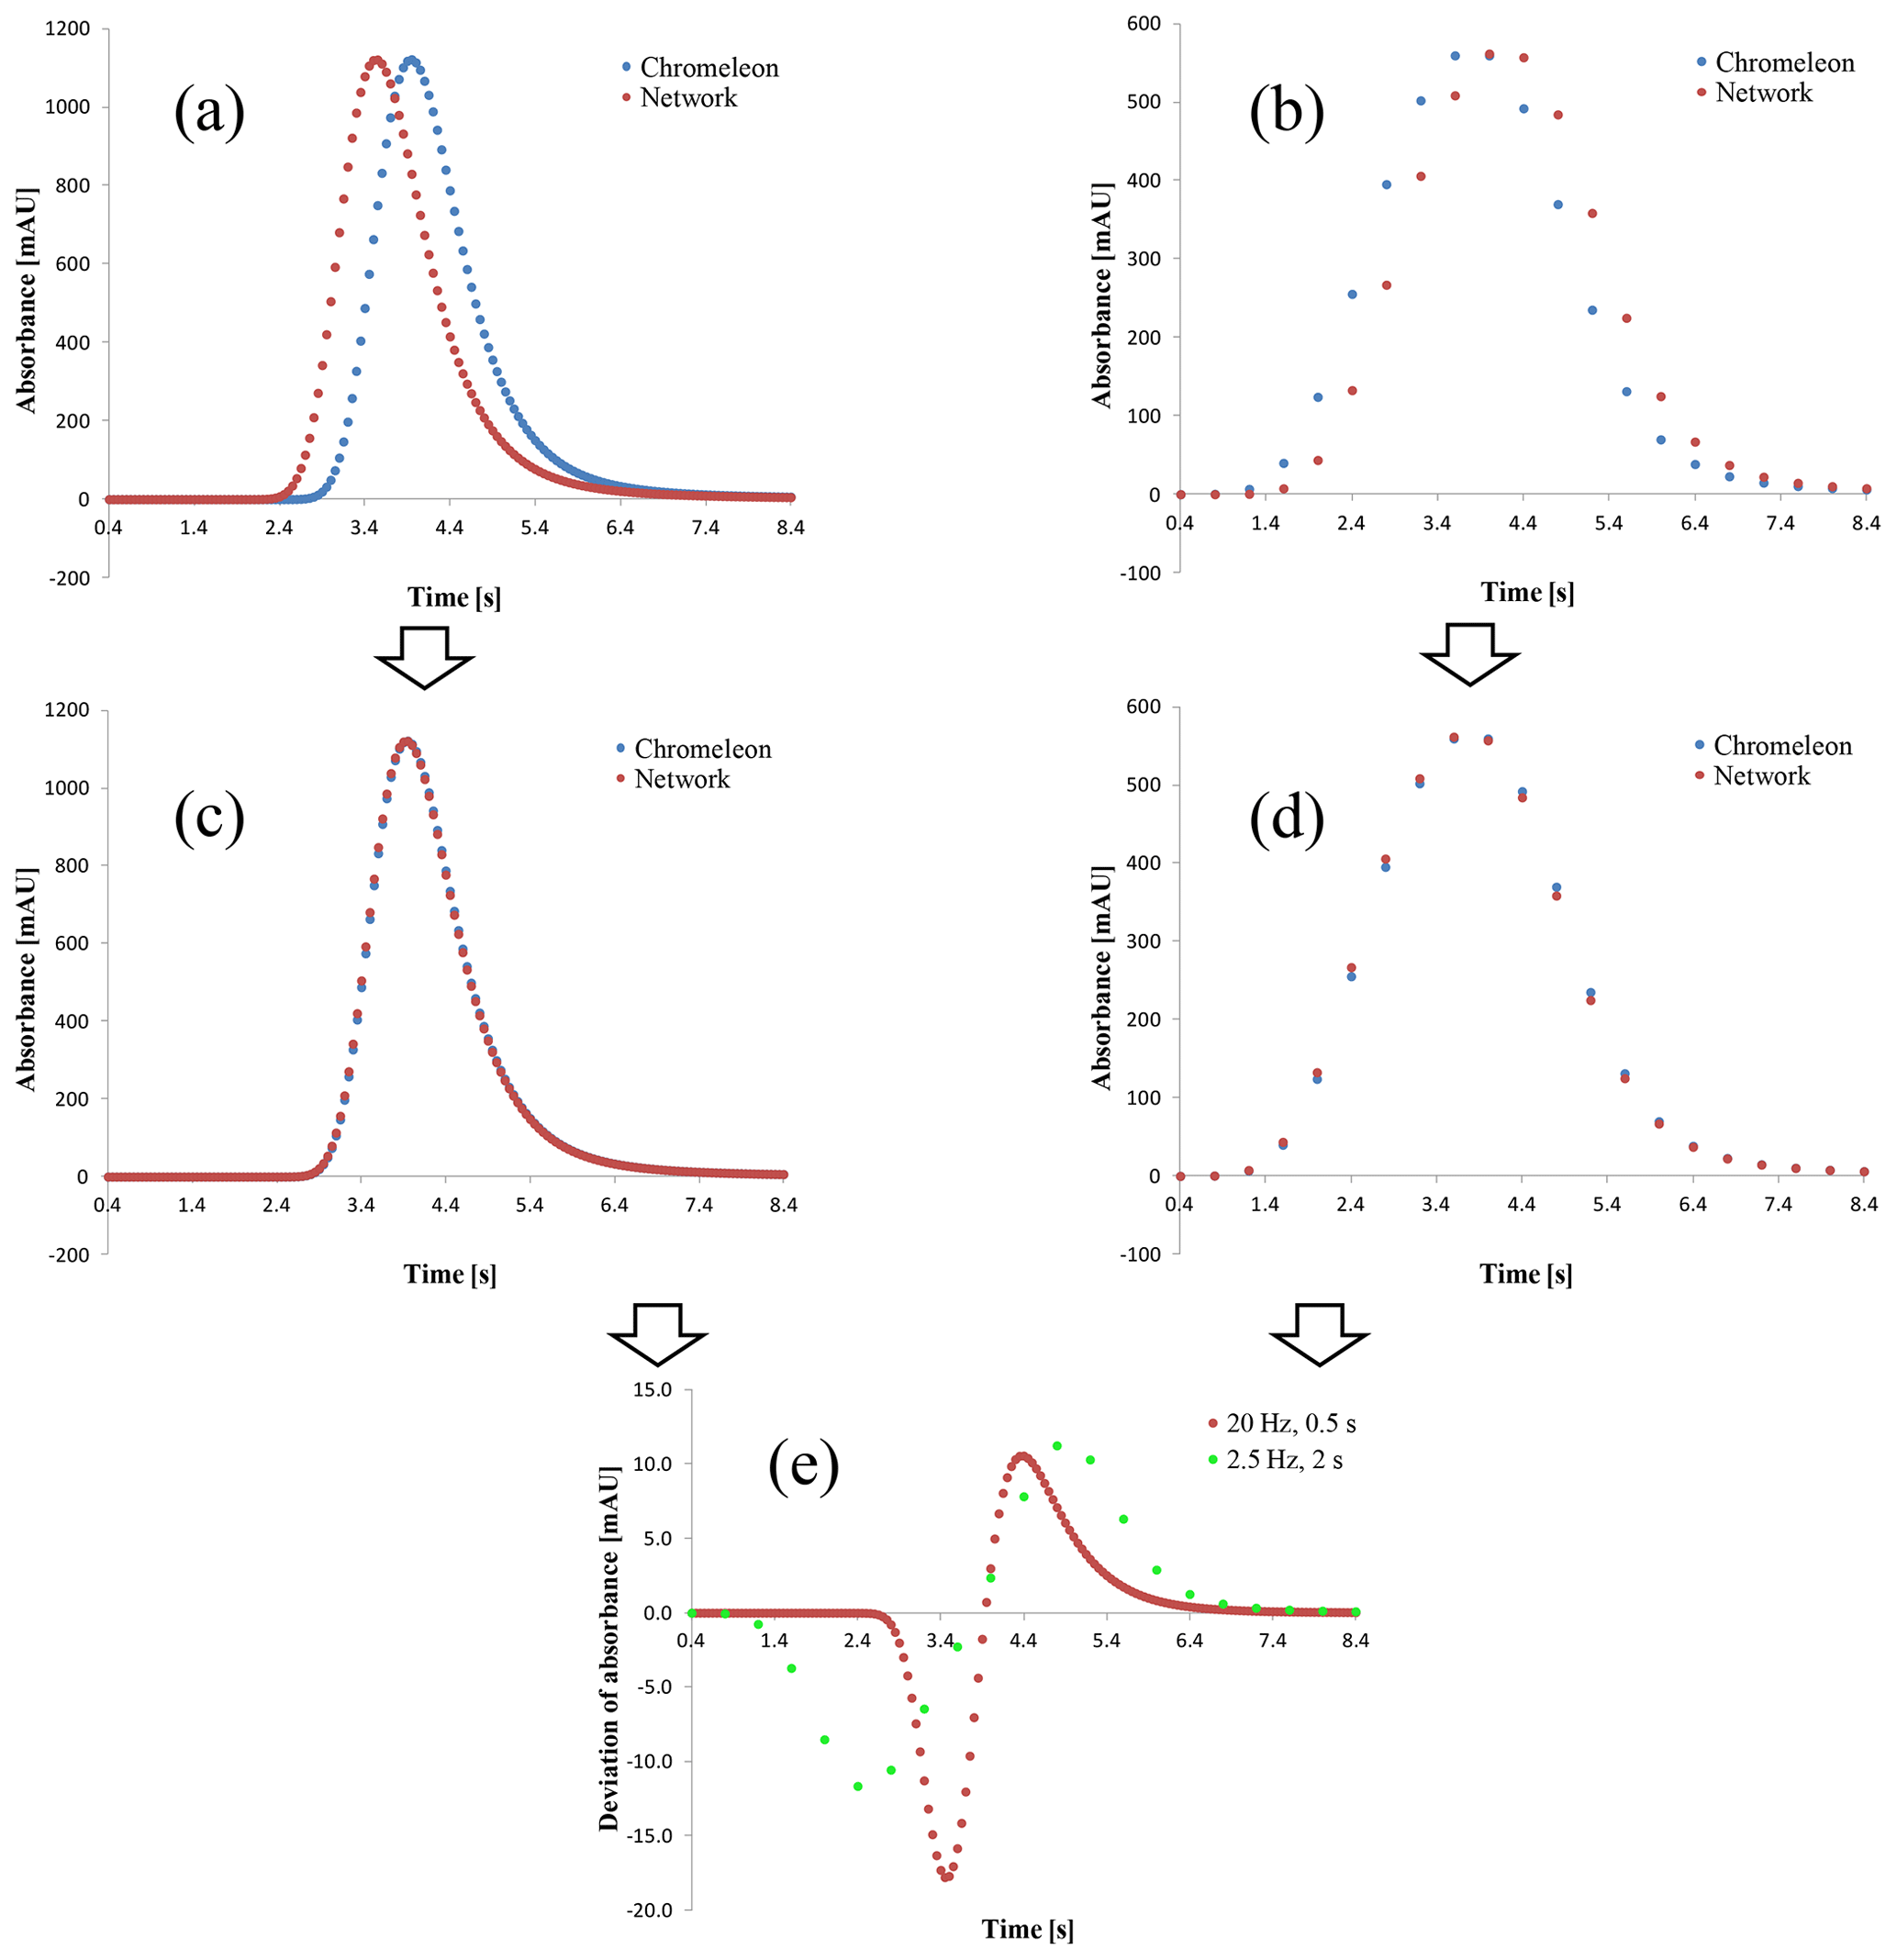
Figure 6Comparison plots between Chromeleon® and the caught data packages of the network generated by HPLC system B. (a) Raw data of 20 Hz without data averaging, (b) raw data of 2.5 Hz without data averaging, (c, d) time shift of the network data to align the peak apexes, and (d) deviation as the difference between the chromatograms in (c, d) computing Chromeleon® data−network data.
Based on the given HPLC detector of system B, we configured a peak width of > 0.1 min. That way the detector used an internal sampling rate of 2.5 Hz to digitize the signal. The step parameter in Chromeleon® was set to 0.4 s, which corresponds to the 2.5 Hz sampling rate of the incoming data. For a second data rate of 20 Hz a peak width of > 0.01 min and a step of 0.05 s were configured. The experiments have been repeated for an activated and deactivated average parameter.
The results for 20 and 2.5 Hz sampling rates and deactivated averaging are visible in Fig. 6a and b. They show the exported chromatograms of Chromeleon® and chromatograms formed by the caught data from the network. Both plots have an apparent time shift between the signals. The exact time shift between the peak apexes in both chromatograms is 0.4 s. But, in contrast to Fig. 6a, in Fig. 6b the network data have a delay related to the data of Chromeleon®. Additionally counting the number of data shows that the network analyzer caught more data points than the CDS stored.
In order to check whether the time shift is the only difference between the signals, the network data have been shifted by +0.4 s in Fig. 6a and −0.4 s in Fig. 6b to align the retention times. That forms the chromatograms shown in Fig. 6c and d. After the normalizing of the shift there are still apparent deviations in the rising and falling areas of the peaks. That is why a deviation plot has been formed in Fig. 6e, as with the results of the Second Controller Instance. It is obvious that there is still a deviation after the time shift, but unlike before it does not depend on the set sampling rate as much as for the experiment in Fig. 5. The wider range of the deviation plot when using 2.5 Hz is due to a peak broadening when using a more intense signal filtration (Lytle and Julian, 2016). The 2.5 Hz setup uses 2 s as its response time compared to 0.5 s for the 20 Hz setup. The response time itself is defined by the American Society for Testing and Materials (ASTM) as the time required for the signal to rise from 10 % to 90 % in response to an upward step function (ASTM E13 Committee, 2011). The filter algorithm used in the Agilent Technologies detector seems to be based on a moving average filter that includes a Gaussian weighting function (Wahab et al., 2016).
The resulting chromatograms using an activated average option are shown in the Supplement. Even if the provided sampling rate of the device of 20 or 2.5 Hz and the acquiring one defined by the step parameter of 0.05 and 0.4 s, respectively, were intentionally set to the same value to avoid reducing the number of data points by the CDS, the maximal occurred deviation has increased here from nearly 17 mAU (Fig. 6e) to 44 mAU.
The network tracking shows that any deviations between Chromeleon® and the Second Controller Instance determined during the double entry experiments are completely based on unknown, internal processing of Chromeleon® on the incoming data before storing them. Even if the provided sampling rate and the desired one defined in the step option are equal, the data will be modified and reduced and the pure raw data transmitted over the ethernet are not available anymore. That means there is an algorithm like an interpolation applied to the raw data that can not be deactivated. Even if the user has a look into the detailed manual of the detector in order to determine the sampling rate of the device that belongs to the configured “narrowest peak width at half height” parameter and no reduction of data points is needed here, the data will be modified, and for an activated average option the deviations are significant here. Furthermore, it is possible to enter a step value corresponding to a sampling rate that is higher than the provided one. So non-sampled but estimated data will be stored as raw data.
Using the new written Second Controller Instance has shown that it is possible to acquire data generated by an HPLC detector manufactured by Agilent Technologies twice during one and the same run. We found out that the chromatography data systems (CDSs) OpenLab ChemStation® and Chromeleon® are based on the LICOP library for the instrument communication, as with our Second Controller Instance. The parallel data acquisitions have shown that the data received by OpenLab ChemStation® are totally equal, except for the rounding process when it exports its data. That way it was possible to prove that when two different controllers (OpenLab ChemStation® and Second Controller Instance) subscribe to the same source, we get the same results. So not only the transport itself via TCP could be ensured, but also the identification of the source data that will be loaded from the internal device storage and packaged for the transport.
In practice the second instance could be used here to perform the double entry approach for the data verification as part of the input check defined in CFR 21 part 11.10(h). So it should be possible to verify incoming data of every run in a whole experiment sequence by comparing both data sets before processing them. Alternatively, the data verification by the double entry method could be performed once within a software operational qualification as a test of the receiving data functionality right after the installation of the software application. Additionally, it is conceivable to use the double entry generally to compare a new software package with already existing and validated ones, as done here for the Second Controller Instance.
Regarding CDS Chromeleon®, the signal deviations which occurred even if the CDS is also based on the LICOP library are caused by internal data processing during the storage routine. So it has been shown that the original provided data of the HPLC device are not accessible when using this software package. Additionally, without these internal computations the data between the CDSs and the Second Controller Instance would be totally equal. This fact shows that a complete comparison of raw data generated by one given HPLC system under identical conditions always results into two different data sets if the two tested CDSs are used. So the main problem is that Chromeleon® only stores the processed data and not the pure raw data which are gone that way.
In addition it is to highlight how important the setting of the step parameter in Chromeleon® is because we focused on setting the corresponding step values to fit the incoming data. But by the ability to compute more data points than generated by the device it is possible to store a chromatogram that is influenced by a low sampling rate (e.g., lower peak height Wahab et al., 2016) but that looks like a high-rate sampled one. Doing so the integration of the resulting peaks can lead to significant differences between for example a chromatogram sampled with 80 Hz acquired by OpenLab ChemStation® and a chromatogram sampled with 20 Hz acquired by Chromeleon® and stored with 80 Hz.
For the double entry method the advantages of a Second Controller Instance can not be used for Chromeleon® directly here, but the approach could be applied if the CDS would compare the data straight before the storage. This problem and further ones have to be solved when implementing a second instance for another HPLC manufacturer or even for GC instruments. For now the only known prerequisite is a second instance allowed on the LAN connection.
The underlying measurement data are not publicly available and can be requested from the authors if required.
The supplement related to this article is available online at: https://doi.org/10.5194/jsss-8-207-2019-supplement.
DTM and DW prepared and performed the data acquisition experiments. DTM implemented the Seconds Controller Instance and evaluated results. DW, HP and RP advised, reviewed and recommended the corrections of the article.
The authors declare that they have no conflict of interest.
This article is part of the special issue “Sensors and Measurement Systems 2018”. It is a result of the “Sensoren und Messsysteme 2018, 19. ITG-/GMA-Fachtagung”, Nürnberg, Germany, from 26 June 2018 to 27 June 2018.
We thank AnaTox GmbH and Co. KG for supporting this research by providing all software packages, required materials, chemicals and HPLC systems.
This paper was edited by Andreas Schütze and reviewed by two anonymous referees.
Agilent Technologies: Nucleus Board Raw Data, Personal document, 2014. a, b, c
Agilent Technologies: LICOP components for software development, available at: https://www.agilent.com/en-us/firmwareDownload?whid=56791 (last access: 12 October 2017), 2016. a
ASTM E13 Committee: Method E 1657 – Practice for Testing Variable-Wavelength Photometric Detectors Used in Liquid Chromatography, Tech. rep., ASTM International, https://doi.org/10.1520/E1657-98R11, 2011. a
Bitesize: BBC – GCSE Bitesize: Validation, available at: https://www.bbc.co.uk/schools/gcsebitesize/ict/databases/3datavalidationrev1.shtml (last access: 23 March 2018), 2014a. a
Bitesize: BBC – GCSE Bitesize: Verification, available at: https://www.bbc.co.uk/schools/gcsebitesize/ict/databases/3datavalidationrev2.shtml (last access: 23 March 2018), 2014b. a
Center for Biologics Evaluation and Research Center for Devices and Radiological Health: General Principles of Software Validation; Final Guidance for Industry and FDA Staff – Version 2.0, available at: https://www.fda.gov/regulatory-information/search-fda-guidance-documents/general-principles-software-validation (last access: 18 November 2017), 2002. a
Felinger, A., Kilár, A., and Boros, B.: The myth of data acquisition rate, Anal. Chim. Acta, 854, 178–182, https://doi.org/10.1016/j.aca.2014.11.014, 2015. a
Lytle, F. E. and Julian, R. K.: Automatic Processing of Chromatograms in a High-Throughput Environment, Clin. Chem., 62, 144–153, https://doi.org/10.1373/clinchem.2015.238816, 2016. a
Office of the Federal Register and National Archives and Records Administration: Code of Federal Regulations Title 21: Food and Drugs – Parts 1 to 99, available at: https://www.gpo.gov/fdsys/pkg/CFR-2017-title21-vol1/pdf/CFR-2017-title21-vol1.pdf (last access: 8 March 2018), 2017. a, b
Ofni Systems: 21 CFR 11.10(h): Input Checks, available at: http://www.ofnisystems.com/21-cfr-11-10h-input-checks/ (last access: 18 November 2017), 2017. a
Wahab, M. F., Dasgupta, P. K., Kadjo, A. F., and Armstrong, D. W.: Sampling frequency, response times and embedded signal filtration in fast, high efficiency liquid chromatography: A tutorial, Anal. Chim. Acta, 907, 31–44, https://doi.org/10.1016/j.aca.2015.11.043, 2016. a, b, c