the Creative Commons Attribution 4.0 License.
the Creative Commons Attribution 4.0 License.
 | 15 May 2020
Measurement of the Beruforge 152DL thin-film lubricant using a developed thin-film thickness standard
Sebastian Metzner
Tamara Reuter
Tino Hausotte
Systematic deviations due to remaining lubricant on the workpiece have a significant influence on the measurement of sheet-bulk metal formed parts. The expected layer thickness for the workpieces after the forming process is less than 35 µm. For the determination of the refractive index of the lubricant and thus the effects of the lubricant on optical measurement techniques, a lubricant thin-film thickness standard was developed which represents a continuous measuring range from 6 to 100 µm. To determine the refractive index, the thin-film thickness standard was measured with a coaxial interferometric measurement system in various thickness ranges. Due to the knowledge of the optical and the geometrical path length, the refractive index can then be determined approximately. In addition, an XY stage was used to scan the entire thin-film area of the standard. The measurement setup in a temperature box allows for determining the effects of temperature changes on the optical properties of the lubricant.
- Article
(4377 KB) - Full-text XML
- BibTeX
- EndNote


The process of sheet-bulk metal forming (SBMF) combines the processes of sheet metal and solid forming and thus extends beyond the existing limits of both manufacturing processes. Newly formed elements such as teeth systems and carriers can be realized. More detailed information was presented by Merklein et al. (2012). However, this manufacturing process poses difficulties for optical measuring systems which was shown by Metzner et al. (2018). Factors such as the remaining lubricant on the workpiece after the forming process influence the measurement result. The remaining lubricant layer causes systematic measurement errors of the optical geometry measuring systems like fringe projection and a changed reflection behaviour. The lubricant that is typically used in sheet-bulk metal forming is Beruforge 152DL. Since effects, such as the layer thickness, of the lubricant usually require knowledge of the refractive index, its determination is necessary for investigations of lubricant influences with optical measurement systems.
Until now, mainly measuring systems based on ellipsometry or reflectometry have been used for the determination of the refractive index. Basic measurement systems are described by McCrackin et al. (1963) and Hlubina et al. (2008). Tremmel et al. (2015) describe possibilities of laterally moved thin layer structures. An extension of this system is described by Tremmel et al. (2017) with the use of neuronal nets. Gonçalves and Irene (2002) show that the ellipsometry can not only be used to determine the thickness of substrates but also for other applications such as optical properties and roughness. Due to the long measuring time of ellipsometry or reflectometry measurements, interferometric measuring systems are increasingly used. Some detailed investigations are described by Ghim and Kim (2007). With interferometric thin-film thickness measurements, there are initially differences between single-layer and multi-layer systems. In multi-layer systems, the signals of the individual layers are usually separated by a fast Fourier transformation (FFT). Quinten (2014) described the limits of FFT for layer thickness measurements by aliasing and leakage effects. These influences can be reduced but not completely avoided. Ghim and Kim (2006) showed an improved version of the dispersive white-light interferometry, which makes it possible to measure the refractive index without knowing the geometric thickness. The layer thickness is obtained from the spectrally resolved interference signals. Cardin and Leduc (2008) used prism–film coupler spectroscopy to determine the refractive index, which is based on the use of transfer matrices and at the same time allows for the determination of the refractive index, the layer thickness and the optical losses of the measured layer. Investigations of the refractive index of the lubricant and the measuring setup have been published by Metzner et al. (2019b). Metzner et al. (2019a) presented results of thin-film thickness measurements on fringe projection systems. The results show significant deviations using fringe projection measurement technology with layers larger than 30 µm. In this thickness range, the fringes are reflected partially within the layer or absorbed so that no reconstruction of the surface is possible anymore. This paper presents a thin-film thickness standard where layer thicknesses of less than 100 µm can be measured. This standard makes it possible to determine the refractive index. The final investigations in a temperature box should show the differences in temperature on the measuring surface and the changes in the lubricant at different temperatures.
The principle of coaxial interferometric layer thickness measurement was used for the thin-film measurement. The sensor used is the CHRocodile 2S by Precitec with an MF 13 µm sensor head with a numerical aperture of 0.2; it reaches a vertical resolution of 10 nm with a measuring spot diameter of 13 µm. The measuring range allows for measurements from 3 to 180 µm of optical thickness. With this measuring principle, the rays hit the optical transparent layer vertically, are partly reflected on the thin-film surface and are partly reflected by the underlying surface. Due to the polychromatic light, the phase shift between the partial beams varies with the wavelength, resulting in constructive and destructive interference. If the intensity is plotted over the wavenumber, a harmonic function can be observed. The frequency of this function is proportional to the optical path length of the layer. By measuring a multi-layer system, for example a two-layer system as used in this paper, three harmonic functions occur. With an FFT, it is possible to separate these functions and determine the frequencies. Consequently, in the resulting performance spectrum for completely transparent layers, three peaks will occur. The first two stand for the individual layers, and the last one indicates the whole layer thickness. The prerequisite for measuring a layer by using an optical system is the fact that the light is reflected at the top and the bottom surface of the layer. The thickness is normally calculated with the following formula according to Quinten (2015):
where m is the pixel number of the spectral analysis and n is the refractive index. Since the wavelength-dependent refractive index cannot be determined by the white-light interferometer, the following simplified formula is used:
This equation leads to deviations in the determination of the layer thickness, as the refractive index is wavelength dependent. The resulting deviations are further discussed in Sect. 7.
The lubricant investigated is a single-layer lubricant system consisting of inorganic and organic components. The water-based lubricant is provided with wax particles to positively influence friction during the forming process. At a sufficient pressure, these particles burst and thus reduce friction. A pressure-dependent control of the tribological characteristics is useful, as in the case of SBMF large process forces, and different forming degrees occur. Consequently, the lubricant becomes fluid during the forming process, and after that, it becomes more viscous again and leads to systematic measurement deviations in the optical measurement if it stays on the part. The expected layer thicknesses in the SBMF are in the range of 1 to 35 µm.
A thin-film thickness standard based on DIN 32567 and DIN EN ISO 5436-1 for the measurement of thin films was developed to map the expected film thicknesses in a defined area. According to DIN 32567-5 the optical thickness can be determined by multiplication of the refractive index and the geometrical thickness. DIN EN ISO 5436-1 (Sect. 7.1) describes the definition of the measured quantities of the standards. It requires that only the middle third of the lower surface of the wedge and the outer two thirds of the upper surface is to be used for the evaluation of a step height. The thin-film thickness standard shown in Fig. 1 was made of stainless steel with a dimension of 30 mm × 30 mm × 10 mm.
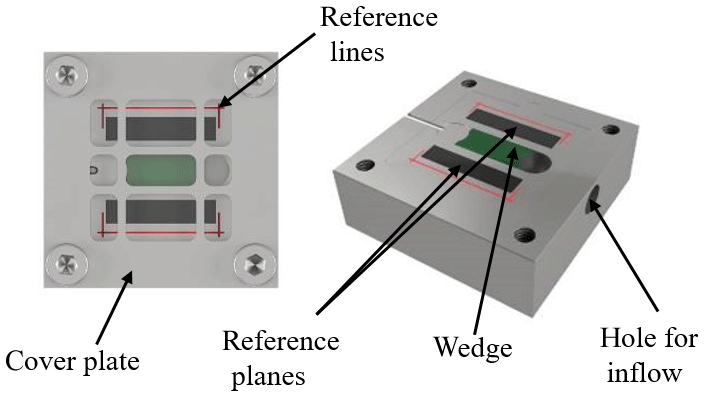
Figure 1Thin-film thickness standard as CAD model with the coloured functional surfaces (green and black).
A wedge-shaped cavity (green) was milled in the middle of the standard to measure different film thicknesses. The wedge covers a thickness range from 6 to 100 µm. Due to manufacturing reasons, the wedge height starts at 6 µm. The absolute layer thicknesses are determined in comparison to the two reference planes (black) placed next to the wedge according to DIN EN ISO 5436-1. These planes have increased requirements with regard to surface roughness and parallelism. The lubricant is supplied via a hole for the inflow, in which a medical tube is inserted. Afterwards the lubricant flows over a plateau onto the wedge. A thin plateau with a drain at the end site of the wedge allows extra lubricant and air to escape. Reference lines (red) ensure a reproducible measurement on the different positions of the wedge.
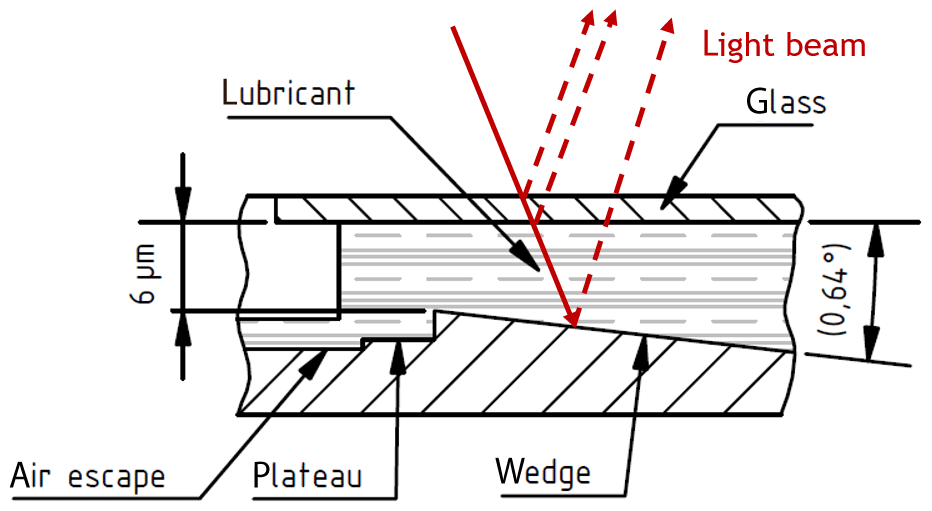
Figure 2Principle cross-sectional diagram of the thin-film thickness standard with a sketched light beam.
Figure 2 shows the wedge, the lubricant above it and the cover glass, which should prevent the lubricant from bulging. The white-light beam is first reflected on the wedge; its direction is then changed by the lubricant and the glass before it is detected. It should be noted that even at very small angles of the reflected beam, systematic deviations can occur due to longer distances (Lehmann et al., 2018). The plateau for the outflow of the surplus lubricant is on the left side.
Figure 3 shows the actual thin-film thickness standard filled with the lubricant Beruforge 152DL (BF152DL).
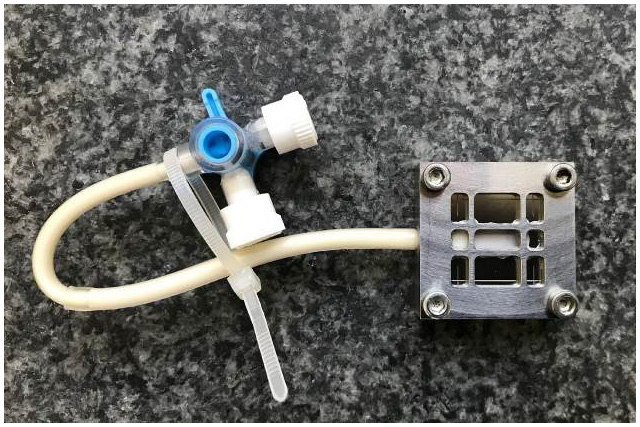
Figure 3Thin-film thickness standard filled with lubricant with mounted glass and a cover plate as well as an inflow tube.
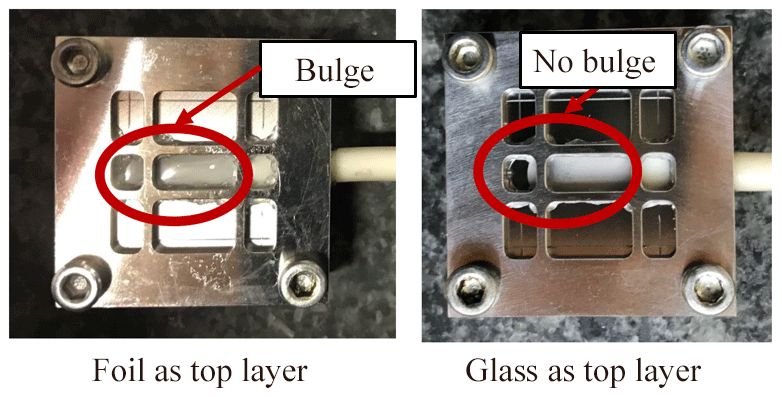
An additional cover plate presses a thin sheet of glass onto the standard surface, preventing the lubricant from escaping to the sides of the wedge. The struts of the cover plate prevent the cover layer from bulging up. Comparison measurements with a thin foil as a cover layer show distinct bulging and therefore a falsification of the measurement results. Figure 4 shows the bulging of the cover layer already visible with the application of a thin film as a cover layer in contrast to the cover layer made of an approximately 100 µm thin glass.
This chapter describes the measurement setup and the measurement procedure. The measurements are carried out on two different positioning systems. The experiments were first executed on the NMM-1 (Nanopositioning and Nanomeasuring Machine) available at the Institute of Manufacturing Metrology (Hausotte, 2010). This allows the film sensor to be positioned on the thin-film thickness standard with a positioning uncertainty of a few nanometres. In addition, it is possible to synchronize the machine with the measuring signal, which makes it possible to scan the surface in the measurement area.
Figure 5 shows the measurement setup on the nanomeasuring machine with the thin-film thickness standard. The reference markers in Fig. 1 on the CAD (computer-aided design) model make it possible to operate the thin-film thickness standard on different positioning systems. The positioning of the sensor on the reference lines is done manually using a joystick. The origin and the alignment of the coordinate system as well as the positions for the grid area are then calculated with the software MATLAB.
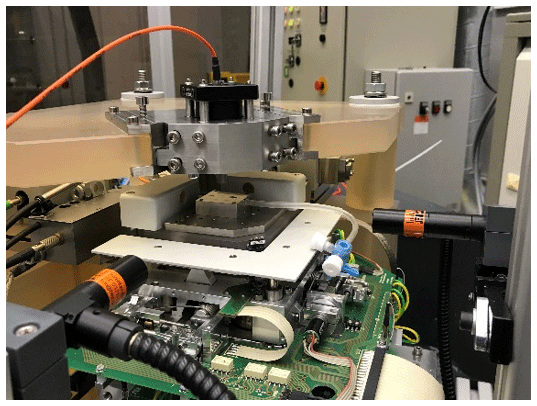
Figure 5Nanomeasuring machine NMM-1 with integrated interferometric measuring head and thin-film thickness standard.
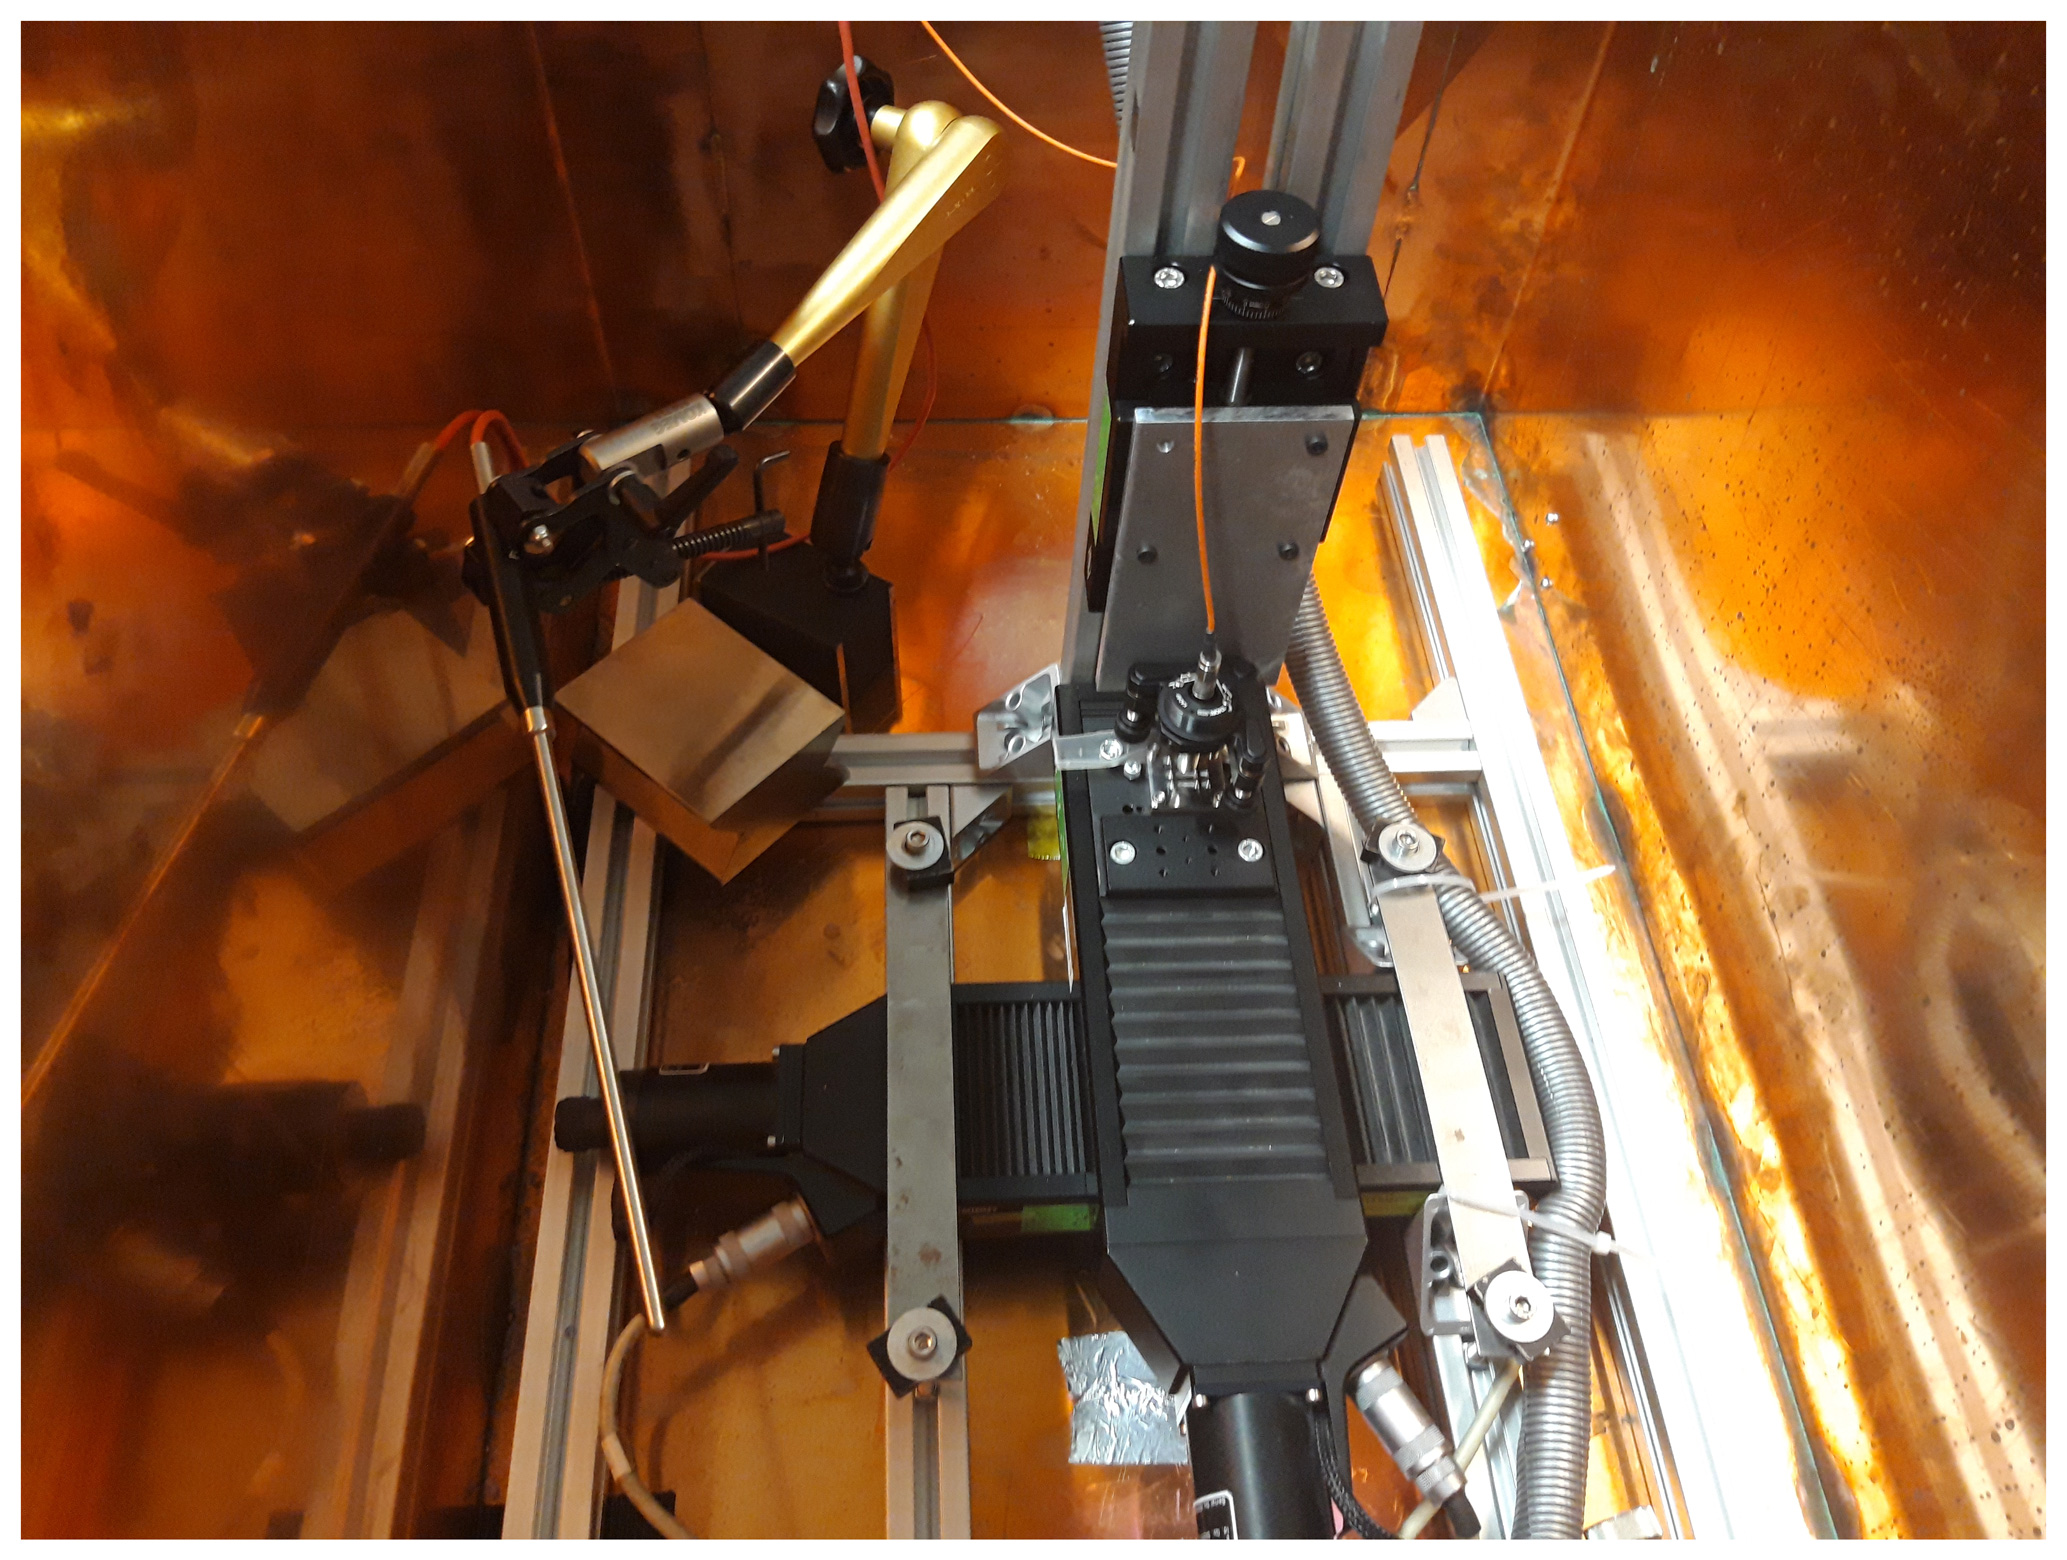
Tests of the effects of the temperature of the measurement were performed in a temperature box. The temperature control of the box was implemented with the connected JULABO HL/FPW 50 via external temperature control inside the temperature box. A PI miCos positioning unit was used as the XY stage. This is the second positioning system. The positioning accuracy of the system is given at 1.3 µm. The measurement temperatures were 20, 25 and 30 ∘C. The working distance to the thin-film thickness standard was set via an additional z axis, which must be operated manually. The adjustment of the working distance is normally realized by focusing on the reference surface. This ensures that the distance over the entire wedge is optimally adjusted. The sensor used has a working distance of 10.6 mm, which results from the lower edge of the measuring sensor head to the middle of the measuring area. The thickness of the glass plate is measured with an average value of 100 µm. Figure 6 shows the measurement setup in the temperature box with the thin-film thickness standard positioned on it.
In order to measure the entire surface of the wedge with a point sensor, the surface was scanned linearly in the direction of the wedge. As a result, possible deviations on the wedge bounds as well as any bulges caused by the liquid can be detected. For this purpose, a grid of previously defined layer thicknesses was measured during the reference measurements, and the position of this grid was calculated in order to the coordinate the origin. The number of repeated measurements for recording the surface is n=20. Figure 7 shows the interpolated surface with a total of 40 grid points and the algorithm at 20 ∘C with air as the medium. In Sect. 7.1 comparisons with different temperatures and materials are examined. The measurement direction is from the lower layer thickness to the higher layer thickness as shown in Fig. 8. The absolute position was determined by starting from the intersection in the direction of the wedge.
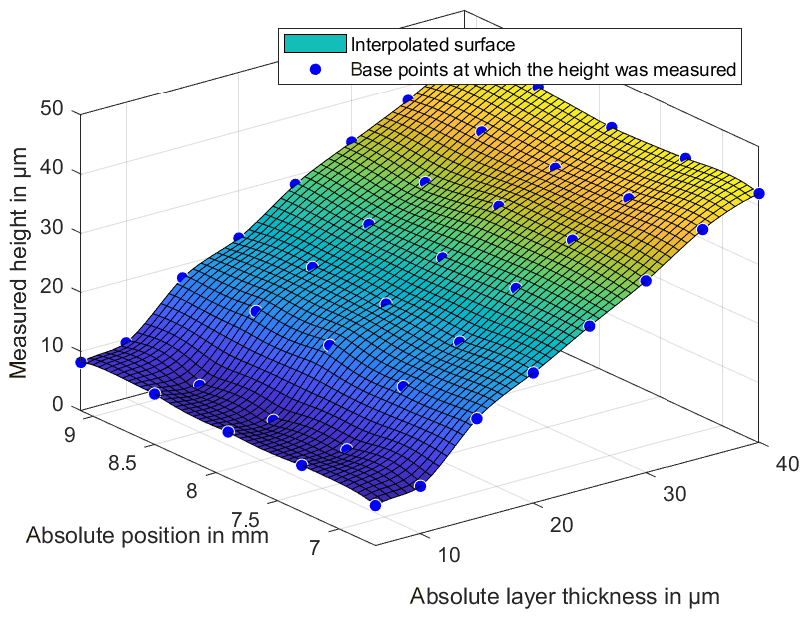
Figure 7Interpolated standard surface with grid points. The surface was calculated using biharmonic interpolation.
The wavelength dependence is a problem when determining the refractive index. Since the measuring method used here uses exclusively white light, a wavelength-dependent consideration is not possible. A constant value for the refractive index is therefore assumed for the layer. According to Quinten (2014) this can lead to a deviation in the determined layer thickness of up to 5 %. With a layer thickness of up to 40 µm, deviations of up to 2 µm are possible. In addition, the layer thickness can be determined according to Eq. (2) only as an integer multiple of m. The error to which this circumstance leads is in the range of results from the lower edge of the measuring head to the middle of the measuring range. In principle, the leakage effect occurs with the discrete fast Fourier transformation. Since a non-infinite number of frequencies is taken into account for a discrete output signal, the subsequent layer thickness result deviates from the real layer thickness.
The refractive index was determined on the basis of DIN 32567-5. The optical thickness dopt results from the multiplication of the refractive index n and the geometric thickness dgeo.
If the geometric thickness is known, the refractive index can then be calculated. To determine the absolute geometric thickness, the thin-film thickness standard was first measured with the calibrated focus variation measuring system Alicona InfiniteFocus. Figure 8 shows the topography of the measured thin-film thickness standard. The reference lines on the thin-film thickness standard are visible. The possible measurable layer thicknesses on the wedge range is 6 to 30 µm. The geometric thickness of the cover glass is given as 100 µm. For lubricants with a refractive index of approximately 1.5, it is therefore only possible to measure layer thicknesses in a range of up to 30 µm, as the measuring range of the sensor is between 3 and 180 µm of optical thickness. Because the glass is not uniformly thick, the measurement was carried out up to a range of 40 µm.
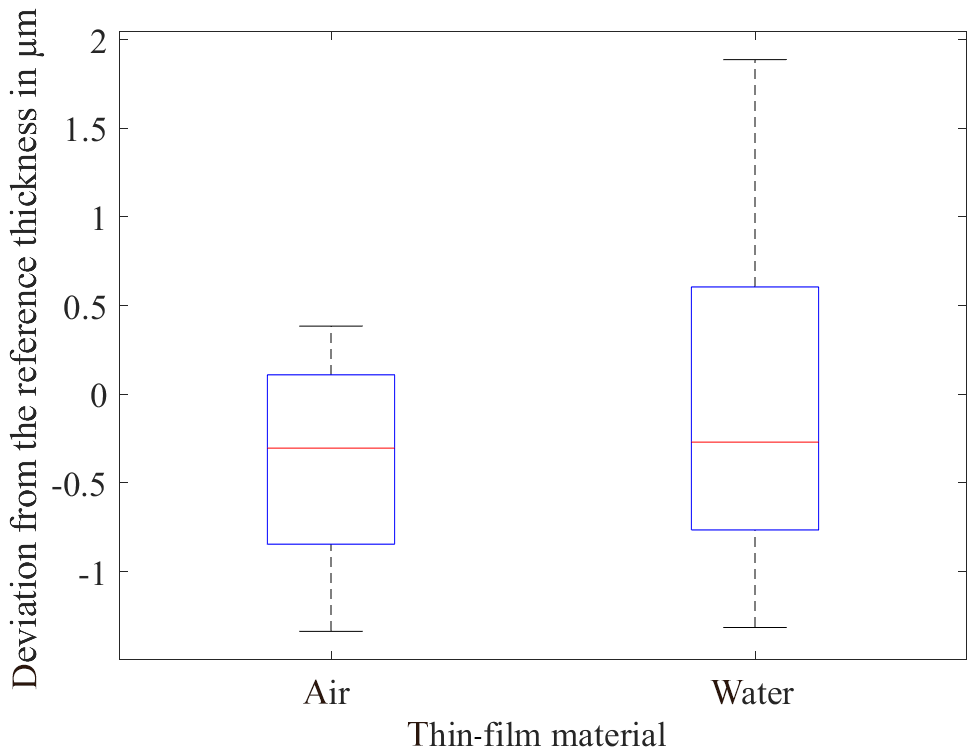
Since the refractive index was still unknown, repeated measurements were first performed to determine the optical thickness in order to then calculate the refractive index according to Eq. (3). For the evaluation of the measuring instrument, measurements with air and water as reference layers were carried out with five repetitions each in a range from 6 to 30 µm.
Figure 9 shows the deviation of the layer thicknesses in relation to the absolute geometric thickness. The refractive index was assumed to be 1.333 for water and 1.000 for air.
The standard deviation for water, independent of the layer thickness, is greater than for the measurement of the air layer. The reason for the increased standard deviation is the wavelength dependence of the refractive index. However, the executed FFT needs a constant value for the refractive index. In the case of nontransparent lubricants, the effect of absorption has to be considered. Quinten (2015) describes that on absorbing materials the complex refractive index is calculated with the extinction coefficient k.

Figure 8Topography of the thin-film thickness standard measured with the Alicona InfiniteFocus without lubricant and a cover plate.
The very small observable deviations show the ability of the measuring system to determine the exact height values at the defined measuring distance regardless of the wavelength dependency. Figure 10 shows the refractive index for air, water and the lubricant BF152DL calculated according to Eq. (2) as a function of the absolute layer thickness.
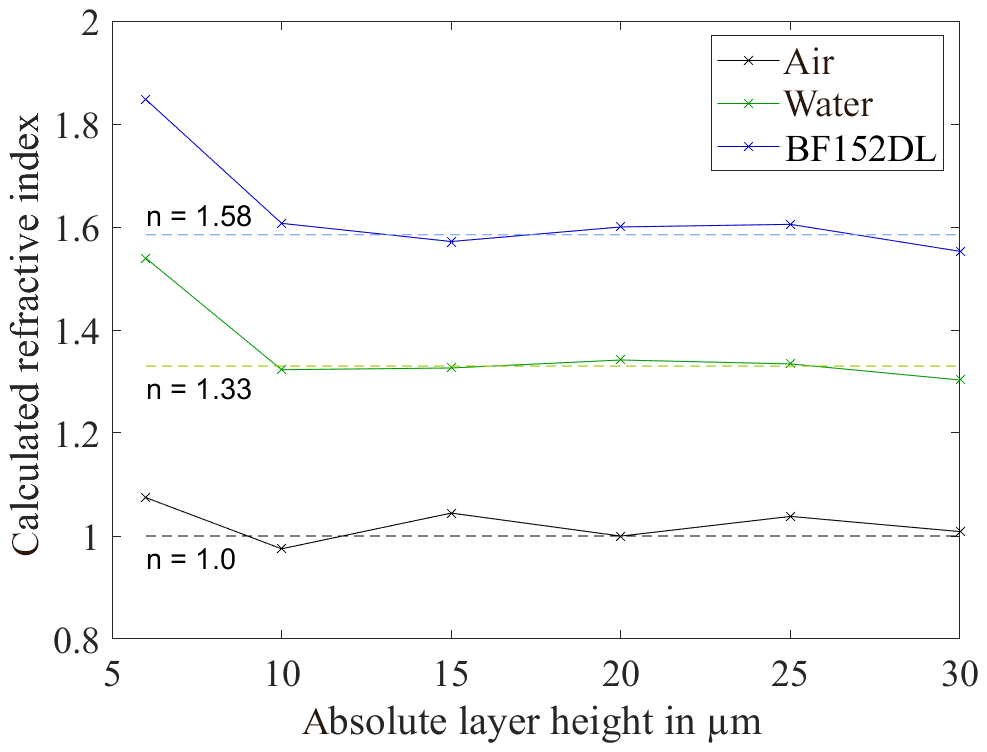
The systematically increased deviation at an absolute layer thickness of 6 µm is noticeable. A determination of the refractive index according to DIN 32567-5 can lead to a deviation of the refractive index from the true value for small layer thicknesses. The results confirm this thesis. The refractive index of the lubricant only converges from a layer thickness of 10 µm to the expected refractive index. The refractive index of the lubricant was therefore determined to be 1.585±0.079. The refractive index of wax is around 1.4. Due to the fact that the real ingredients of the lubricant are unknown and the determination is done by white-light interferometry, the captured refractive index is possible. For a wavelength-dependent determination of the refractive index, measurements with a refractometer should be performed.
Once the refractive index has been determined, a measurement of the geometric distances between the glass and wedge can be performed. The mean values of Fig. 11 show a slightly negative deviation from the absolute layer thickness. This figure shows in addition the standard deviations of the individual thin-film measurements over the entire thickness range of the wedge.
The standard deviations for water and BF152DL are increased compared to the measurement of the layer thickness with air. The increased scattering results can be explained by the different reflections of the light rays at the boundary surface between the layers. The results show the expected dependence of the layer thickness on the geometric height of the wedge with an average deviation of less than 1 µm. The standard deviations of the layer with air are less than 0.5 µm. In comparison, the standard deviations of the layer with water and BF152DL are approximately 1.0 µm.
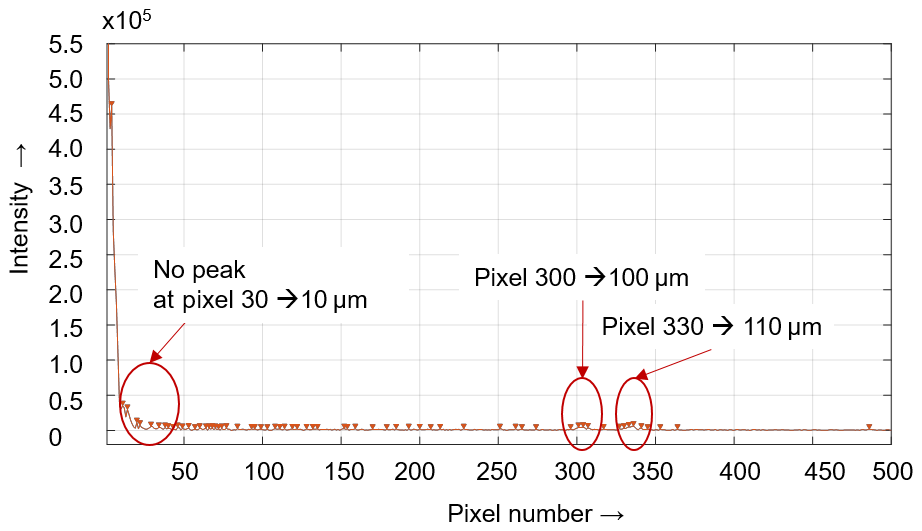
The increased standard deviations are due to stronger ambient noise. In addition, a clear detection of the peaks in the performance spectrum of the measurements with BF152DL is often not possible because of diffuse reflection of the rays at the wax particles and the high absorption rate in the lubricant. Figure 12 shows an example of a recorded performance spectrum of the lubricant with a geometric layer thickness of 10 µm. In this case, it is only possible to determine the layer thickness by the difference between the layer thickness of the top layer and the total layer thickness as the individual peak that indicates the layer thickness of 10 µm is not visible.
It is only possible to determine the layer thickness by the difference between the pixel number of the layer thickness of the top layer and the pixel number of total layer thickness, as there is no peak of the smallest layer visible. Then it is possible to calculate the layer thickness manually by using Eq. (2). The attenuation of the peaks is caused by the absorption of the light in the lubricant layer. Due to the increased absorption of the signal, the signal-to-noise ratio is significantly worse, which leads to a reduced measurable maximum layer thickness. In addition, the incident rays are diffusely reflected by the wax particles in the lubricant. This means that the detector no longer captures the reflected rays and that the detection of the peaks becomes less accurate. Therefore, in the case of several layers, a layer thickness determination is sometimes only possible with the unambiguous detection of a peak. The layer thickness increases with a rising pixel number. However, it is not possible to assign a concrete pixel number to a concrete layer thickness, as the layer thickness is dependent on the refractive index. Thus the pixel number and the assigned layer thickness change for different materials.
7.1 Evaluation of the layer thickness measurement with an area scan and temperature change
The investigations of the temperature changes of the measuring environment should show whether the properties of the lubricant change with increasing temperature and whether the position and thus the measured layer thickness changes. Figures 13 and 14 show the difference between the layer thicknesses at temperatures of 25 and 30 ∘C to the reference temperature of 20 ∘C. In a range of 10 µm there are significant differences in the layer thickness. In a range of 15 to 40 µm there is no clear dependence kit or change of shape in the layer thickness measurements.
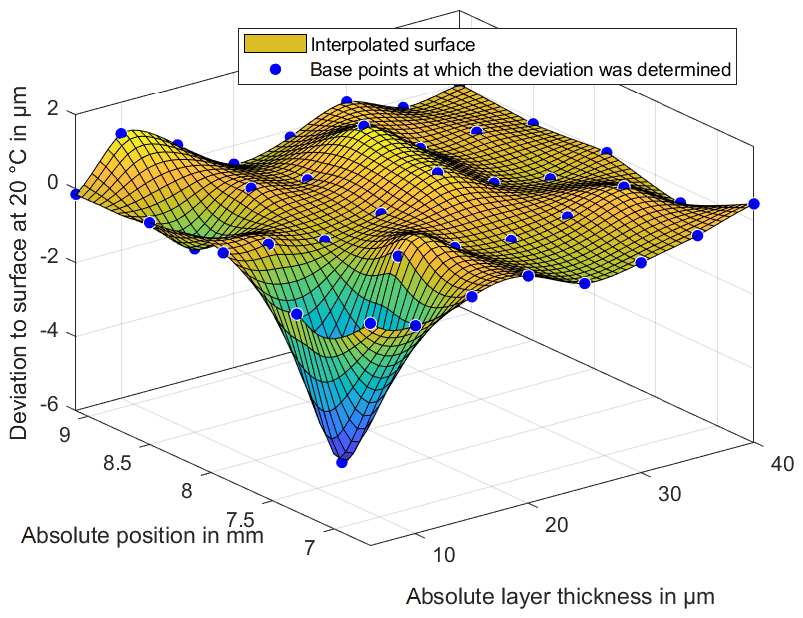
Figure 13Deviation of the measured BF152DL layer thicknesses at a temperature of 25 ∘C to the reference measurement at 20 ∘C.
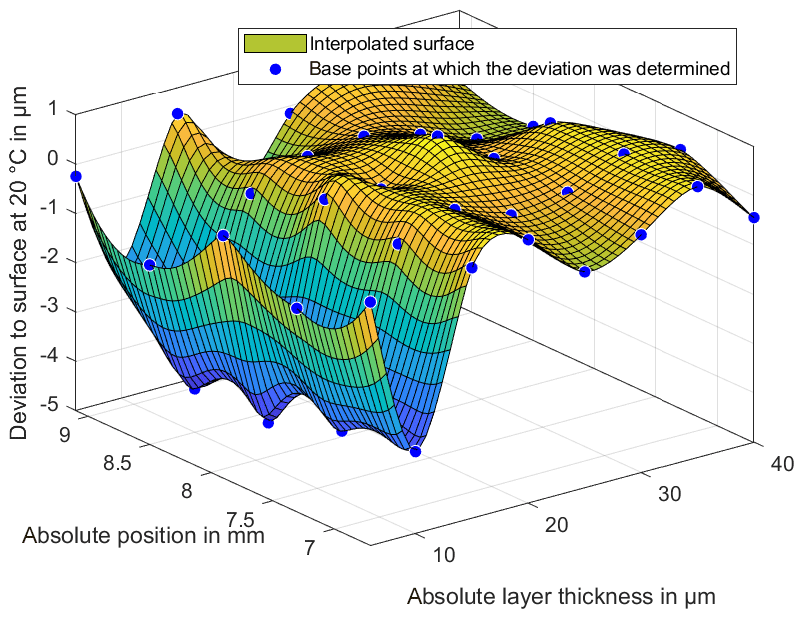
Figure 14Deviation of the measured BF152DL layer thicknesses at a temperature of 30 ∘C to the reference measurement at 20 ∘C.
The layer thickness also shows no significant curvature of the lubricant in the middle area of the wedge. This curvature was expected due to the viscous lubricant and the resulting pressure during the filling of the lubricant. The integrated expansion tank on the thin-film thickness standard is therefore adequately proportioned for the viscosity of the lubricant. To explain the large deviations in the range of 10 µm, the standard deviation of the 20 repeat measurements will be considered in the following. Figures 15–17 show the standard deviations of the sampling points for repeat measurements. The standard deviations show a significant increase in the lower ranges and especially in the range of 10 µm. The increased deviation from Figs. 13 and 14 is therefore not only due to a change in the layer thickness but especially to an increased random scattering of the individual points. The standard deviation in a range above 10 µm is very small. This is among other things due to a very precise positioning of the XY stage.
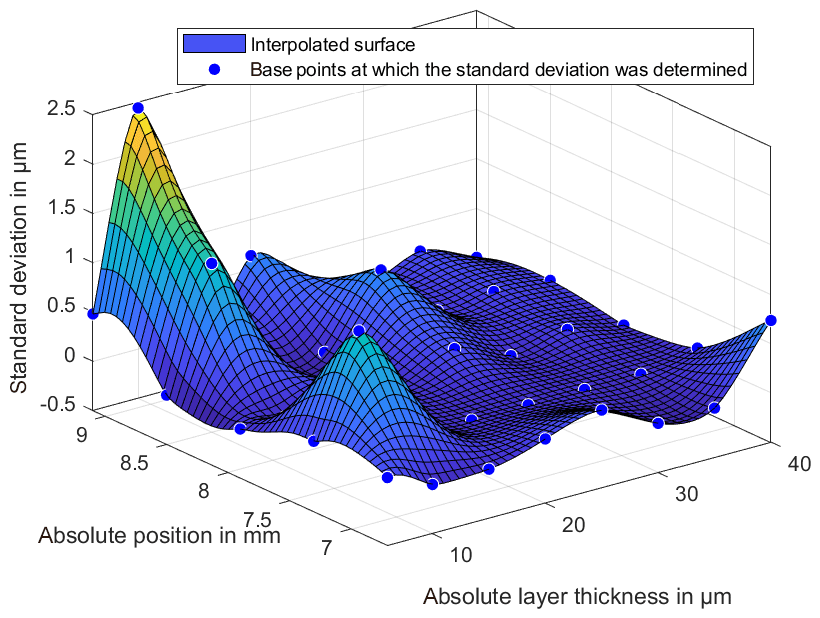
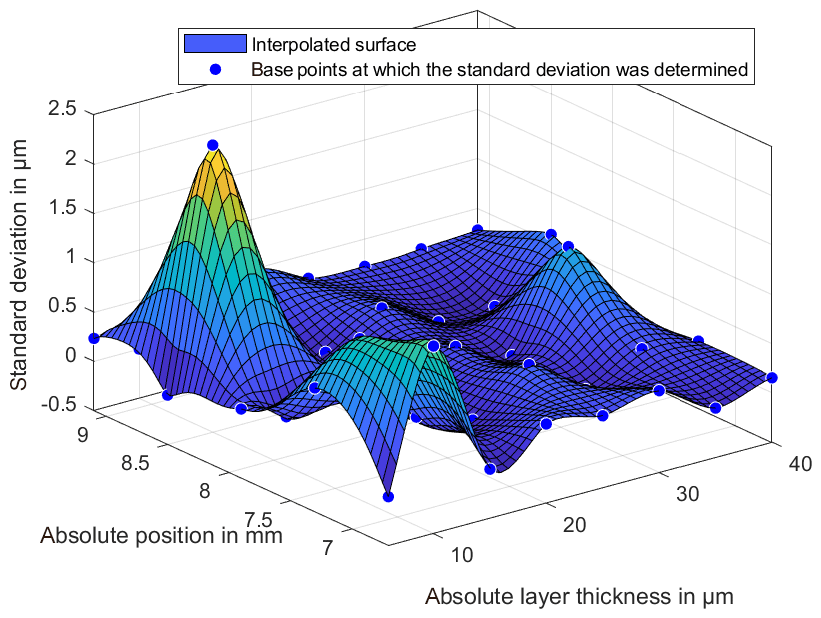
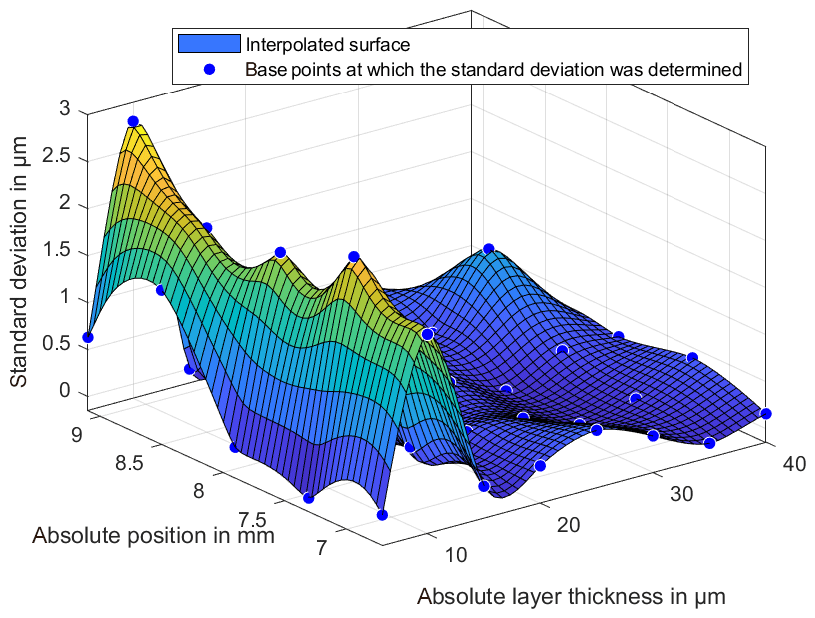
In general, no larger absolute deviation is to be recognized with higher temperatures. At a low temperature, the deviation increases with layers at 10 µm. Due to the higher standard deviation, significant changes are not recognizable. The increasing random deviations with higher temperatures can be explained by a changing condition of the lubricant. As written in Sect. 3 BF152DL, becomes fluid during the forming process. As during the forming process not only the pressure but also the temperature increases, Figs. 15–17 indicate thus that the condition of the lubricant changes with elevated temperatures. The water included condensates, and the wax particles melt or start moving. This leads to deviations and thus to increasing scattering in the thickness measurement. Therefore, the standard deviation is slightly larger at higher temperatures than for lower temperatures.
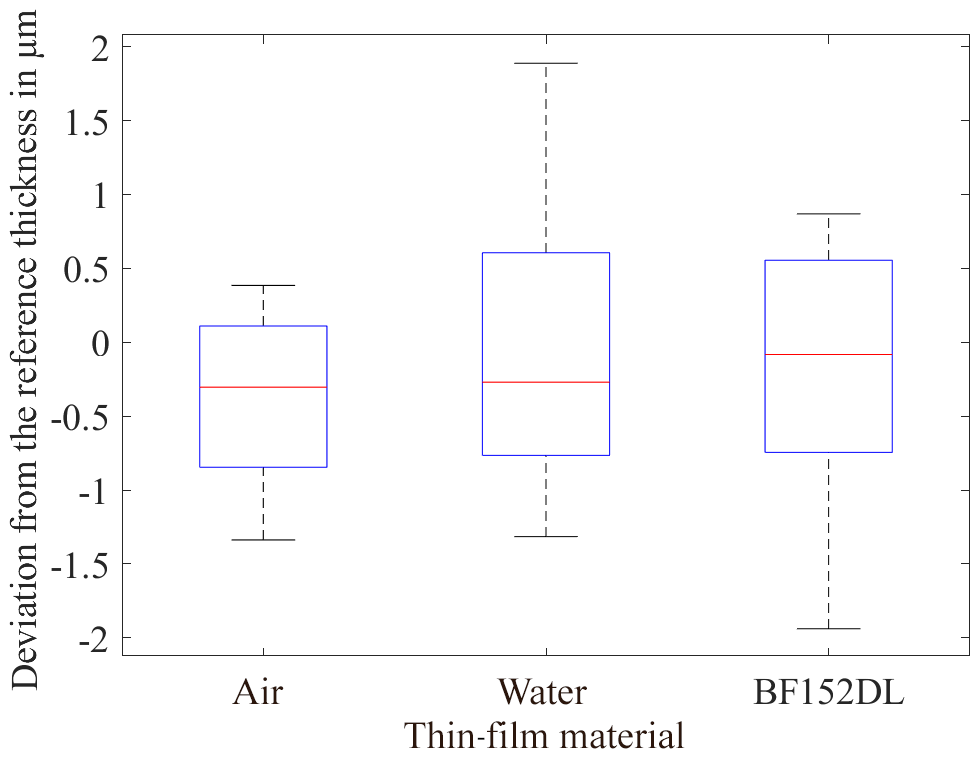
In order to compare the effects of the layer thickness and depending on the temperature, Fig. 18 shows the boxplot diagram of the lubricant at all temperatures (averaged). Especially in the range of 10 µm, significantly larger standard deviations can be detected. In higher thickness ranges, the standard deviations are decreasing. The mean deviations are about 2 µm regardless of temperature. The deviation is to be justified by the non-observance of the wavelength-dependent refractive index. However, large differences between the two measurements with the lubricant and air as the intermediate layer cannot be detected.
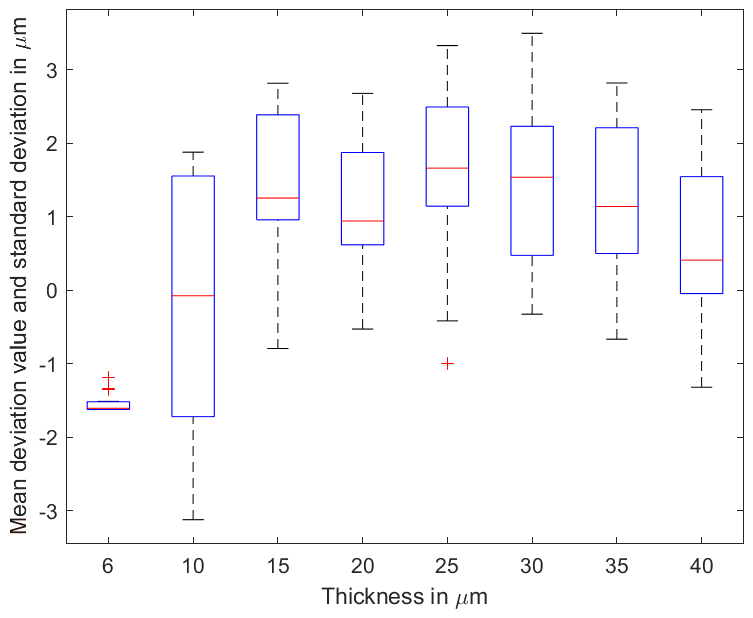
Figure 18Boxplot of the calculated variation to the true thickness at different layer thicknesses across all temperatures.
The developed thin-film thickness standard allows for the expected layer thicknesses to be imaged on the workpiece and measured in a way that can be reproduced. The wedge-shaped cavity in which the lubricant is inserted allows for the continuous measurement of layer thicknesses up to 100 µm. As shown, the glass plate and the struts on the cover plate ensure that on the one hand an additional layer between the lubricant is formed, which makes an interferometric measurement possible in the first place. On the other hand, a curvature of the lubricant is suppressed in the middle of the wedge. The results show that the refractive index of the investigated lubricant BF152DL is approximately 1.58. The measuring instrument was validated beforehand with water and air layers, as the refractive index of these substances is known. Due to the problems described in the calculation of the wavelength-dependent refractive index, it is not possible to determine the exact refractive index with this measurement system. A deviation of approximately 5 % is therefore assumed. In principle, however, layer thicknesses in a range of up to 40 µm can be reliably measured. Thanks to the scanning strategy developed and the subsequent interpolation, it is now possible to determine the layer thickness of two-dimensional measuring fields. The limits of the system are reached at thicknesses of more than 40 µm. As the previously published results show, with higher layer thicknesses it is not possible to detect the underside of the wedge. Final investigations of the temperature dependence of the position and the effects on the thickness calculations show a purely random measurement deviation of the lubricating film thickness with a slightly increasing standard deviation with increasing temperature.
In this paper, we present a methodology to determine the refractive index of the Beruforge 152DL lubricant for structured-light scanning. The developed thin-film thickness standard is described in detail with the relevant functions and geometrical specifications. Additionally, publications cited in the paper describe the measurement systems used as well as the evaluation methods of the measurement results Thus, all information needed for a reproduction of the presented results is available to the reader.
SM conceptualized the project, performed the investigation, worked with the software, visualized the results and wrote the original draft of the paper. TR performed the investigation, visualized the results, and wrote and reviewed the original draft of the paper. TH conceptualized the project, acquired the project's funding, and reviewed and edited the paper.
The authors declare that they have no conflict of interest.
This article is part of the special issue “Sensors and Measurement Systems 2019”. It is a result of the “Sensoren und Messsysteme 2019, 20. ITG-/GMA-Fachtagung”, Nuremberg, Germany, 25–26 June 2019.
The authors thank the German Research Foundation (DFG) for its financial support and all laboratory assistants who supported the realization of this work. The investigations were carried out at the Friedrich-Alexander University Erlangen-Nürnberg (FAU).
This research has been supported by the German Research Foundation (DFG) within the scope of the Transregional Collaborative Research Centre for sheet-bulk metal forming (TCRC 73; subproject A06).
This paper was edited by Andreas Nocke and reviewed by two anonymous referees.
Cardin, J. and Leduc, D.: Determination of refractive index, thickness, and the optical losses of thin films from prism-film coupling measurements, Appl. Opt., 47, 894, https://doi.org/10.1364/ao.47.000894, 2008. a
Ghim, Y.-S. and Kim, S.-W.: Thin-film thickness profile and its refractive index measurements by dispersive white-light interferometry, Opt. Express, 14, 11885, https://doi.org/10.1364/oe.14.011885, 2006. a
Ghim, Y.-S. and Kim, S.-W.: Fast, precise, tomographic measurements of thin films, Appl. Phys. Lett., 91, 091903, https://doi.org/10.1063/1.2776015, 2007. a
Gonçalves, D. and Irene, E. A.: Fundamentals and applications of spectroscopic ellipsometry, Química Nova, 25, 794–800, https://doi.org/10.1590/s0100-40422002000500015, 2002. a
Hausotte, T.: Nanopositionier- und Nanomessmaschinen: Geräte für hochpräzise makro- bis nanoskalige Oberflächen- und Koordinatenmessungen, Pro Business, 2010. a
Hlubina, P., Luňáček, J., Ciprian, D., and Chlebus, R.: Spectral interferometry and reflectometry used to measure thin films, Appl. Phys. B, 92, 203–207, https://doi.org/10.1007/s00340-008-3093-4, 2008. a
Lehmann, P., Xie, W., Allendorf, B., and Tereschenko, S.: Coherence scanning and phase imaging optical interference microscopy at the lateral resolution limit, Opt. Exp., 26, 7376, https://doi.org/10.1364/oe.26.007376, 2018. a
McCrackin, F. L., Passaglia, E., Stromberg, R. R., and Steinberg, H. L.: Measurement of the thickness and refractive index of very thin films and the optical properties of surfaces by ellipsometry, Journal of Research of the National Bureau of Standards Section A: Physics and Chemistry, 67A, 363, https://doi.org/10.6028/jres.067a.040, 1963. a
Merklein, M., Allwood, J., Behrens, B.-A., Brosius, A., Hagenah, H., Kuzman, K., Mori, K., Tekkaya, A., and Weckenmann, A.: Bulk forming of sheet metal, CIRP Annals, 61, 725–745, https://doi.org/10.1016/j.cirp.2012.05.007, 2012. a
Metzner, S., Ramesh, R., Müller, A., and Hausotte, T.: Evaluation of reflection properties of sheet bulk metal formed parts by pixel wise analysis of camera images provided for triangulation measurement, Sensoren und Messsysteme, ITG-Fachbericht 281 Sensoren und Messsysteme, 203–206, 2018. a
Metzner, S., Reuter, T., and Hausotte, T.: Evaluation on influences of thin lubricant on fringe projection measurements, Optical Technology and Measurement for Industrial Applications Conference, https://doi.org/10.1117/12.2535570, Proceedings Volume 11142, Optical Technology and Measurement for Industrial Applications Conference, 1114201, https://doi.org/10.1117/12.2535570, Event: Optics and Photonics International Congress, Yokohama, Japan, 21 April 2019, 2019a. a
Metzner, S., Reuter, T., Wirthmann, E., and Hausotte, T.: Bestimmung des Brechungsindex des Schmiermittels Beruforge 152DL unter Verwendung eines dafür entwickelten Dünnschichtnormals, 20. GMA/ITG-Fachtagung Sensoren und Messsysteme 2019, AMA Service GmbH, pp. 406–411, https://doi.org/10.5162/sensoren2019/5.1.4, 2019b. a
Quinten, M.: Optische Schichtdickenbestimmung, Opt. Photon., 9, 53–57, https://doi.org/10.1002/opph.201300037, 2014. a, b
Quinten, M.: Optische Schichtdickenmessung mit miniaturisierten Spektrometern (German Edition), Books On Demand, 2015. a, b
Tremmel, A. J., Rauscher, M. S., Murr, P. J., Schardt, M., and Koch, A. W.: Reflektometrische hyperspektrale Dünnschichtmessung, XXIX Messtechnisches Symposium, DE GRUYTER, https://doi.org/10.1515/9783110408539-013, 2015. a
Tremmel, A. J., Weiss, R., Schardt, M., and Koch, A. W.: Inline hyperspectral thickness determination of thin films using neural networks, in: Hyperspectral Imaging Sensors: Innovative Applications and Sensor Standards 2017, edited by: Bannon, D. P., SPIE, https://doi.org/10.1117/12.2262070, 2017. a
- Abstract
- Introduction
- Coaxial interferometric measurement system
- Beruforge 152DL lubricant
- Developed thin-film thickness standard for the measurement of thin lubricant films
- Measurement setup with positioning systems and measurement procedure
- Results of refractive index determination for the thin-film thickness measurement
- Results of the measurement of the absolute layer thickness of the lubricant
- Conclusions
- Data availability
- Author contributions
- Competing interests
- Special issue statement
- Acknowledgements
- Financial support
- Review statement
- References