the Creative Commons Attribution 4.0 License.
the Creative Commons Attribution 4.0 License.
 | 17 Jul 2020
Novel method to reduce the transverse sensitivity of granular thin film strain gauges by modification of strain transfer
Maximilian Mathis
Dennis Vollberg
Matthäus Langosch
Dirk Göttel
Angela Lellig
Günter Schultes
Strain gauges based on polyimide carrier foils and piezoresistive granular thin films are highly sensitive to strain. Unlike conventional metal foil, granular film strain gauges also have a pronounced sensitivity to strain acting in the transverse direction. A novel method that allows for the modification of the strain transfer is proposed and proven experimentally. The method is based on the creation of stand-alone polyimide paths, on top of which the piezoresistive thin film is located. In this way, the granular film hardly receives any transverse strain; hence, the transverse sensitivity is drastically reduced. A picosecond laser system can be used for both patterning of the thin film and for controlled ablation of polyimide in order to generate well-defined high path structures. The working principle of the method is demonstrated by simulation, followed by an experimental verification using measurements of the transverse gauge factor. Furthermore, the output signal of force transducers may be increased using granular thin film strain gauges of reduced transverse sensitivity.
- Article
(2461 KB) - Full-text XML
- BibTeX
- EndNote


Foil strain gauges are used for sensor applications, such as load cells or torque transducers, and also for the stress analysis of mechanical components. The strain gauges (SGs) are usually mechanically attached to a component or spring element by bonding. Surface strain due to a force acting on the component or spring element is directly transferred to the strain gauge and results in a change in its electrical resistance. The constant of proportionality between the relative resistance change and strain is called the gauge factor (k). SGs are not only sensitive to strain in the direction of the grid design but also if the strain is acting in the perpendicular or transverse direction. Therefore, it is necessary to differentiate between the longitudinal gauge factor (kL) and the transverse gauge factor (kT).
Commonly used metal foil strain gauges have longitudinal gauge factors of 2 to 4 depending on the grid material utilized. The most common grid materials are constantan and NiCr alloys (Keil, 2017). The transverse gauge factor of metal foil SGs is typically around ±1 % of the longitudinal gauge factor; hence, it is virtually negligible. Since the kT of metal SGs is caused by elastical deformations of the measuring grid and reverse loops, it can be influenced by the layout of the SGs. Another way of influencing the transverse gauge factor without changing the measuring grid is the introduction of additional grid lines (of a different material) without electrical connections between the gauge grid lines. These additional grid lines increase the mechanical stiffness of the gaps and change the transfer of transverse strain (Naumann and Stockmann, 1998).
A novel type of highly sensitive foil strain gauges consists of a polyimide foil as the carrier and a piezoresistive granular thin film, such as the nearly isotropically responding films of Au nanoparticles (Jiang et al., 2015) or granular metal–carbon films. Metal–carbon films with thicknesses of approx. 150 nm are based on granular Ni–C (Koppert et al., 2012) or NiCr–C (Vollberg et al., 2015). The highly sensitive foil SGs show different properties compared with conventional metal foil SGs, especially concerning the gauge factor values (Vollberg et al., 2015). Highly sensitive SGs can reach longitudinal gauge factors up to 30 (Schultes et al., 2018), allowing for the measurement of very small strains, which can be advantageous for stress analysis and sensor applications. For load cells or pressure sensors, the higher gauge factor also allows the use of stiffer spring elements with increased overload capability. The kT∕kL ratio of granular thin films based on NiCr–C is typically around 50 %. The transverse strain sensitivity is the result of local, transverse current paths caused by the particle arrangement of the granular thin film. A straight, global current path in a granular thin film is comprised of many particle-to-particle currents with different directions. This intrinsic property of the thin film causes its transverse gauge factor. (Schwebke et al., 2018).
Our approach to reduce the transverse gauge factor of highly sensitive SGs is based on an invention concerning the polyimide substrate with the objective of decreasing the transverse strain transfer (Langosch and Vollberg, 2017). The usage of a picosecond laser system allows for the production of a stand-alone polyimide path with the granular film on top. By creating such a polyimide path with a certain width (w) and height (h), as shown in Fig. 1, the transfer of transverse strain from the metal component to the active granular thin film may be reduced. Therefore, a strain perpendicular to the current direction and parallel to the surface plane of the thin film only results in a comparatively small resistance change in the SG. This principle was first examined by means of finite element analysis (FEA), and it was verified via measurements of the transverse gauge factor. Using these measurements, the influence of the path geometry and different SG cover materials was evaluated. The resultant low kT of the strain gauges was then utilized for tension/compression force transducers with the benefit of a higher sensitivity.
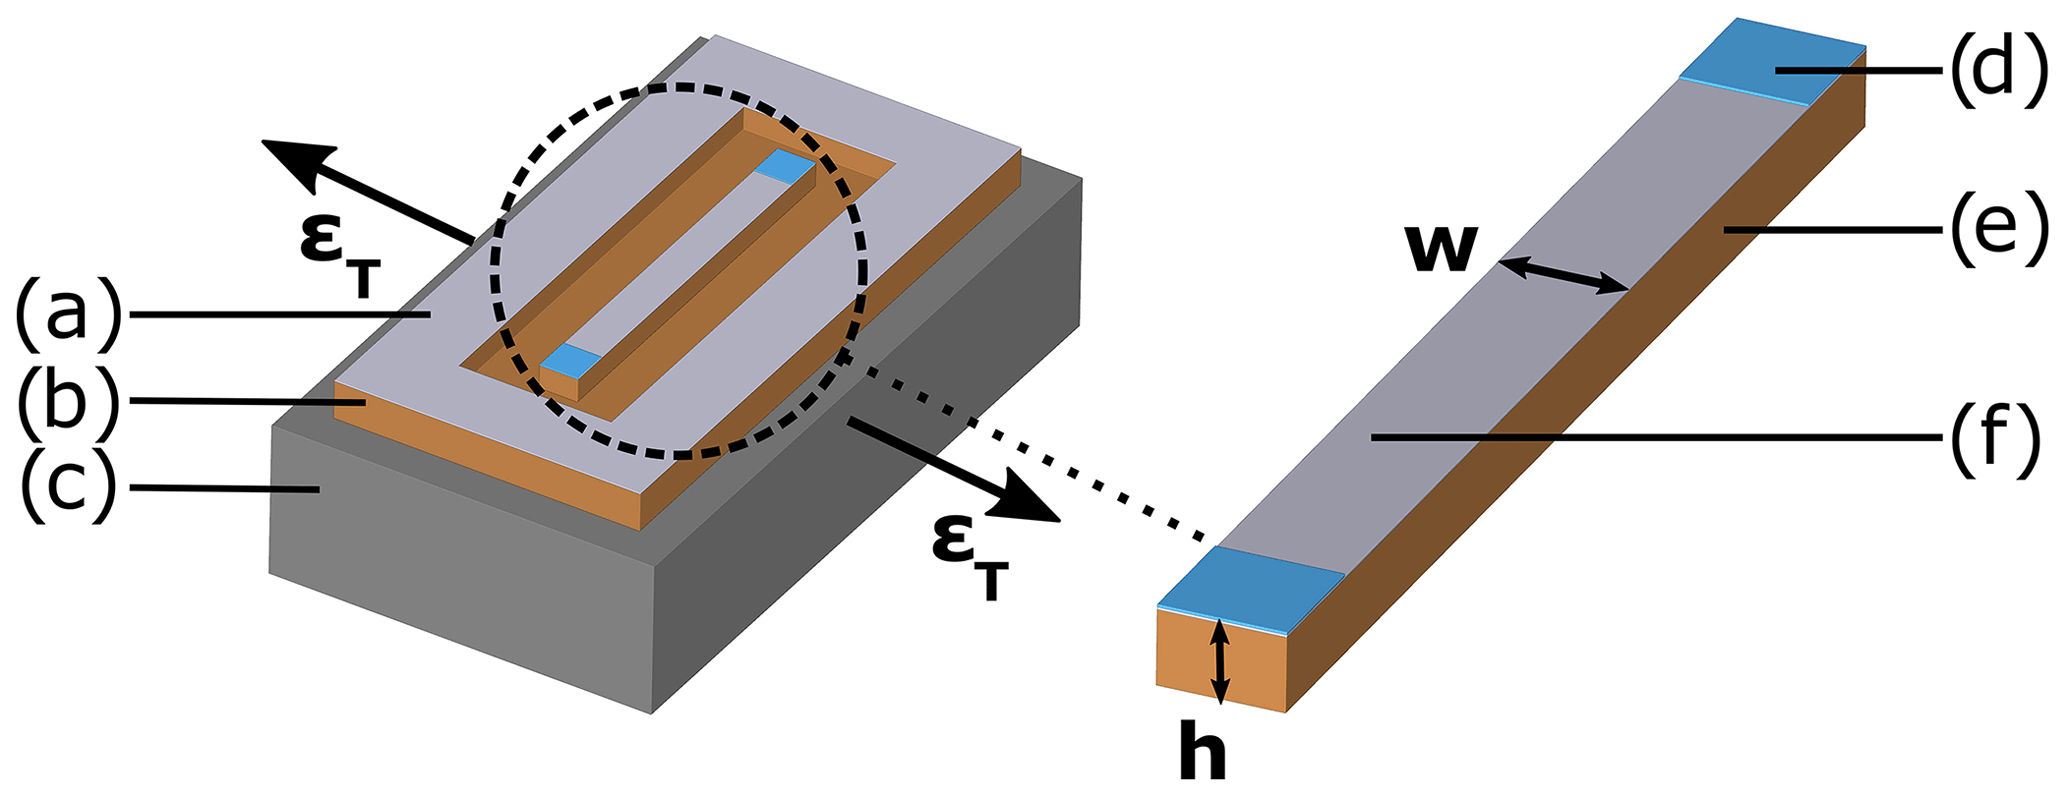
Figure 1Model of an SG that allows for the strain transfer from the metal component to the active thin film to be influenced; the (a) granular thin film, (b) polyimide carrier, (c) transversally strained metal component, (d) solder pad, (e) polyimide path with height h and width w, and (f) active granular thin film element are shown.
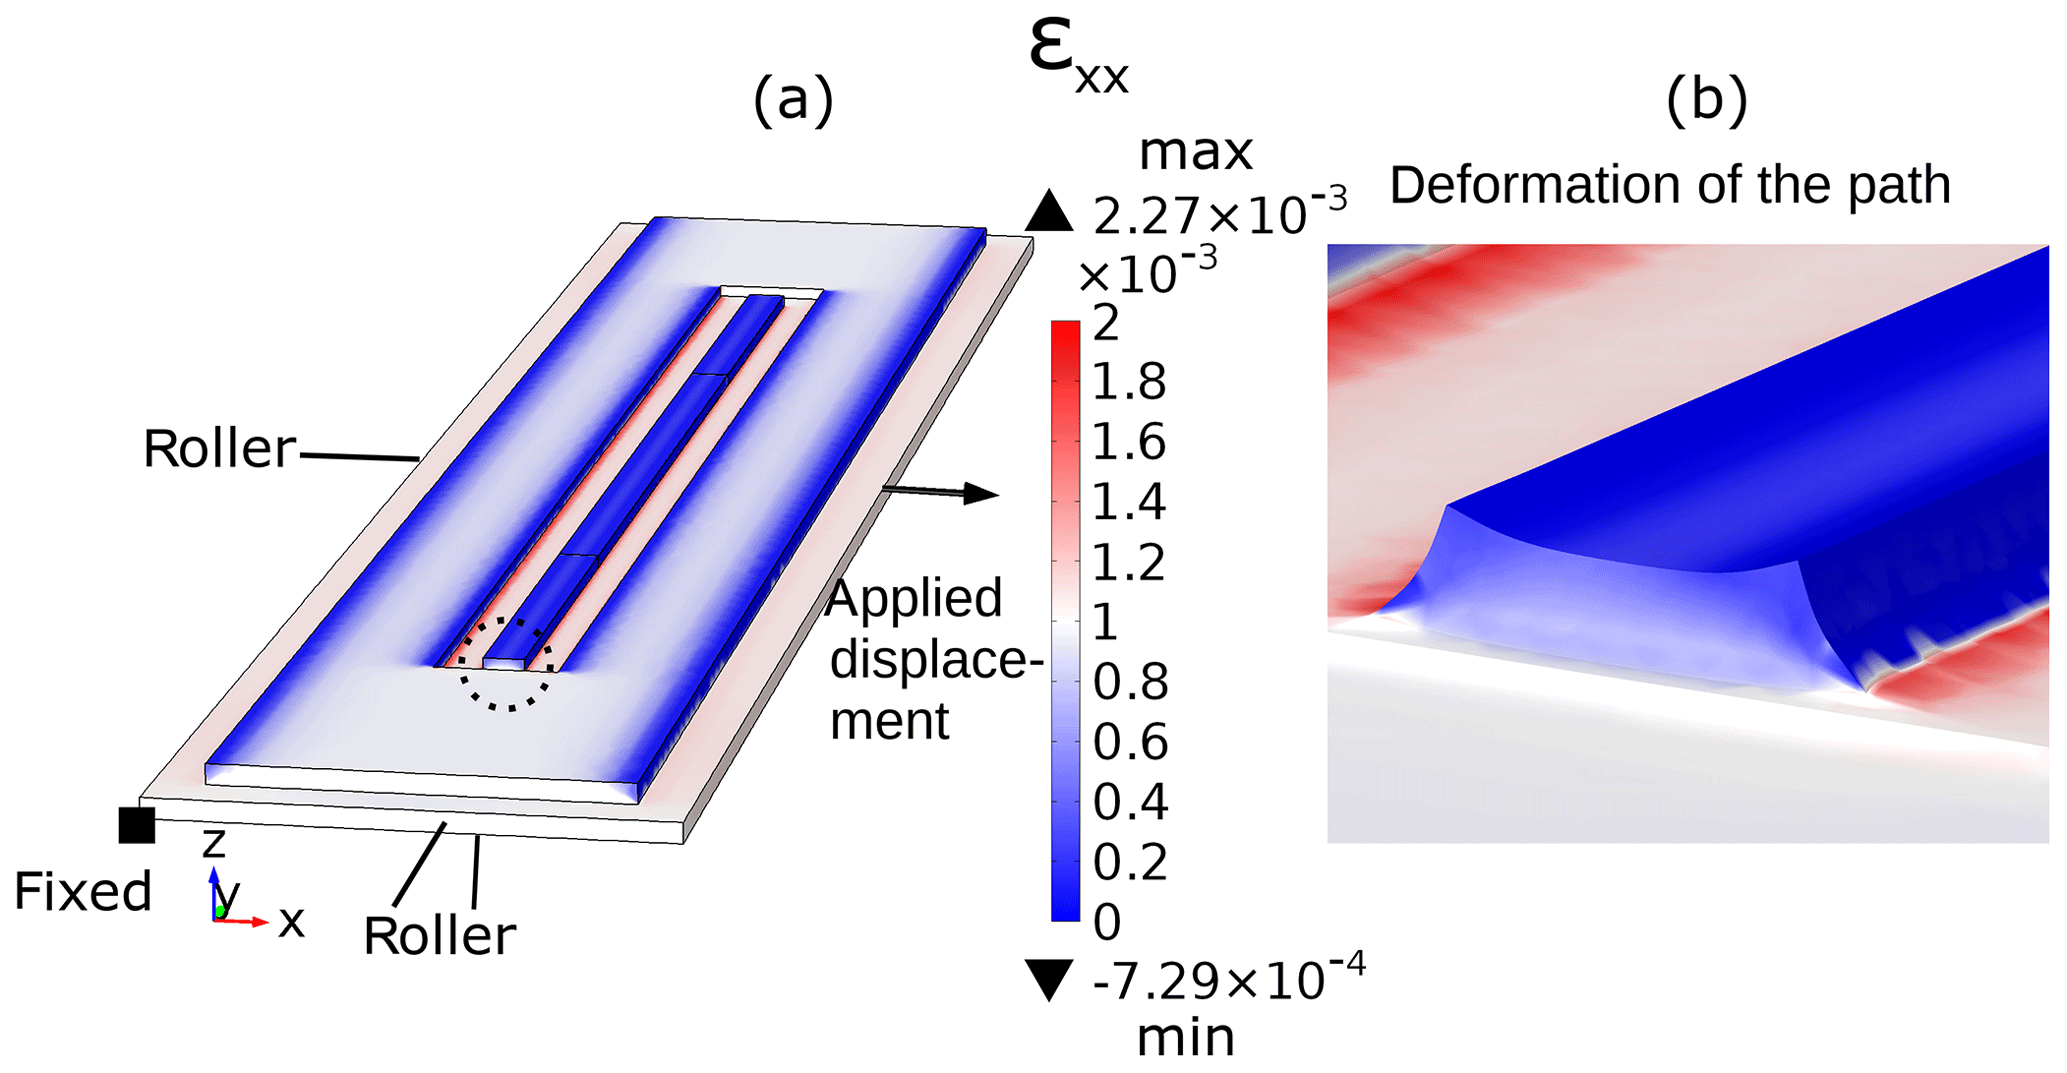
Figure 2The FEA model (according to Fig. 1) is composed of an aluminum plate and a polyimide SG with a stand-alone path (h=30 µm and w=100 µm). The boundary conditions (roller, fixed and displacement) are marked accordingly. (a) The resulting strain ϵxx of the model. (b) The deformation of the circled path section that occurred (with a scale factor of 500).
The operating principle of SGs with a stand-alone polyimide path according to Fig. 1 was investigated by means of FEA with COMSOL Multiphysics. The geometry used, which is shown in Fig. 2, consists of an aluminum plate ( mm) and a polyimide SG ( mm) with a stand-alone path of h=30 µm and w=100 µm. The length of the path is 4 mm. The geometry is simulated with respect to the transfer of transverse strain from the plate to the top of the path using a linear elastic material model. The metal plate is strained by 1 ‰ in the transverse direction by applying a displacement on its right lateral surface. A fixed constraint is placed in the bottom left corner of the aluminum plate, while roller constraints are placed on its bottom, front and left lateral surfaces. A roller is a boundary condition that constrains displacement in the normal direction of the selected surface. The resulting transverse strain ϵxx is recognizable by means of the scale in Fig. 2a. While the surface strain on the aluminum plate equals the applied strain of 1 ‰, the strain on top of the path and on the edges of the polyimide carrier is slightly above or below 0 ‰. The deformation, shown in Fig. 2b, illustrates that material at the bottom of the polyimide path is strained by 2 ‰ (red areas), whereas the path itself is only strained slightly. The excessive strain at the bottom pulls the material in the center of the path downwards, creating a concave surface on top. The strain on top of the path at a certain displacement of the metal component is highly dependent on the width and height of the path. To identify the influences of the width and height of the path, a parametric sweep was performed. In order to investigate the method's dependence on the amount of tensile and compressive strain, the applied strain was varied between −1, −0.5, 0.5 and 1 ‰. The sweep was executed for w=50 µm and w=100 µm, while h was varied in 5 µm steps from 5 to 45 µm. The resulting transverse strain was averaged over the top surface of the path and is illustrated in Fig. 3. Noticeably, all curves intersect at a certain path height at which the resulting strain is 0 ‰, leading to a transverse gauge factor of zero. This is the case for both path widths; however, the slope of the curves is different. For w=50 µm and h=15 µm the transmitted strain is only −1 % of the applied strain, whereas for w=100 µm and h=15 µm the transmitted strain is 29 %. For path heights beyond the intersection point an overshoot of the curves can be observed. In practice, this would lead to a negative transverse gauge factor. In further simulations, the metal component was not only strained in the transverse direction, but it was additionally strained in the longitudinal direction. This leads to the transverse contraction of the path and, consequently, results in a reduced longitudinal gauge factor. The extent of the reduction depends on the path geometry and the Poisson's ratio ν of the polyimide. The maximally reduced longitudinal gauge factor kL, red can be approximated by means of Eq. (1). Assuming a Poisson's ratio of 0.3, kL, red equals 85 % of kL.
The results of this parametric sweep reveal that the transverse gauge factor of granular strain gauges with a certain path width can be reduced to almost zero if the height of the path is chosen correctly. Broader paths need to be cut deeper in order to eliminate the transverse strain sensitivity. For thinner paths, small changes of the path height have a stronger impact on the transverse gauge factor compared with broader paths. The simulation also showed that the reduction of the transverse gauge factor accompanies a reduced longitudinal gauge factor caused by the transverse contraction of the polyimide.
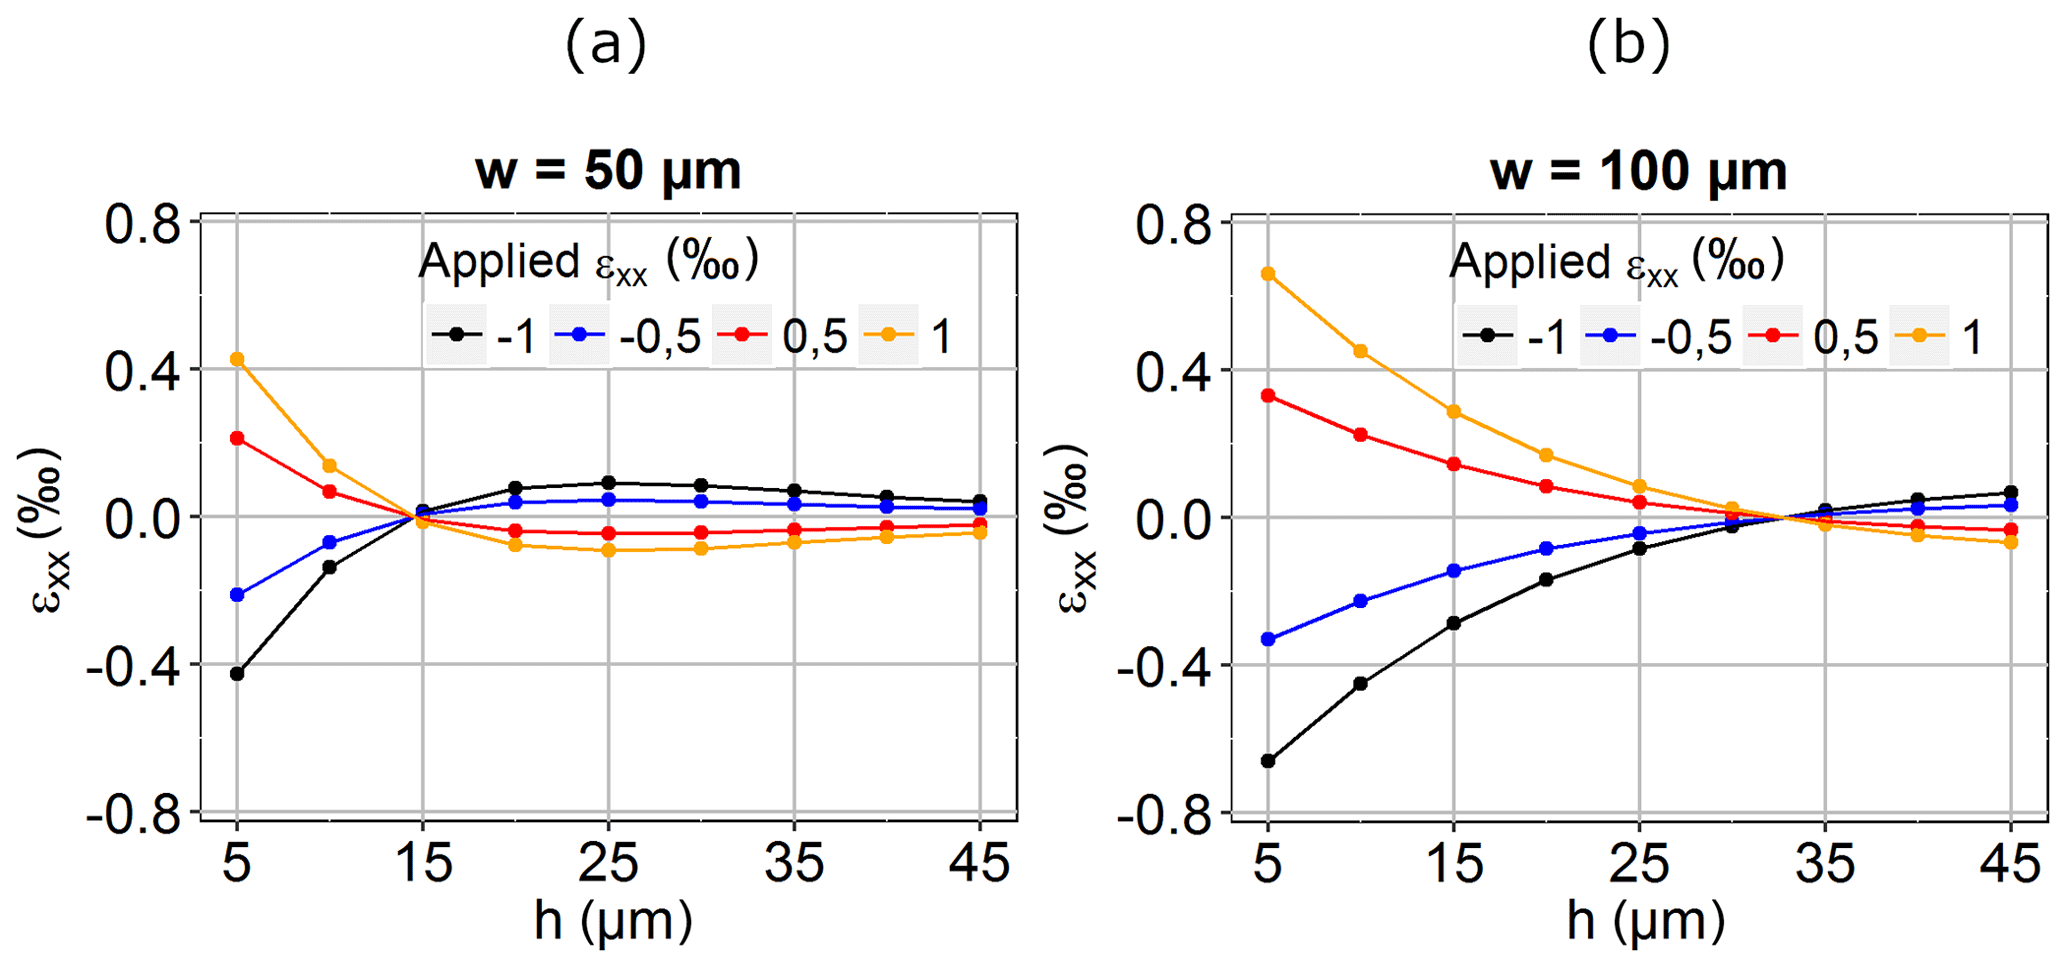
Figure 3The graphs show the resulting transverse strain (xx component) averaged over the top surface of the path and plotted vs. the path height for different applied strains. Panel (a) shows the results for a path width of 50 µm, and panel (b) shows the results for a path width of 100 µm.
Thin film strain gauges were produced according to Vollberg et al. (2015). The piezoresistive, NiCr–C-based thin film (thickness of 150 nm) was deposited onto a polyimide carrier (thickness of 50 µm) via reactive sputter deposition. Subsequently, the thin film and the polyimide foil were structured using a Nd:YVO4 laser system (3D-Micromac) with a wavelength of 355 nm and a pulse duration of less than 15 ps. Moreover, the mark speed was set to 100 mm s−1 with a repetition rate of 50 kHz. The laser type used allows for a local ablation of the thin film with only minimal damage to the polyimide carrier while maintaining its electrical insulation (Langosch et al., 2015). The usage of ultrashort UV laser pulses also allows for the systematic, high quality removal of polyimide (Gomez et al., 2005; Adhi et al., 2004); thus, the production of fine path structures is possible. Consequently, the structuring of the thin film and the polyimide foil was executed in one single process step. For both the structuring of the thin film and the ablation of the polyimide, the laser parameters for polyimide ablation were used, whereby the laser scan path had to be repeated several times. The first scan repetition structures the thin film and ablates some polyimide, while the following repetitions continuously remove the polyimide. The minimal line width that can be removed is dependent on the diameter of the laser spot – in our case 20 µm. In order to ensure a sufficient trench width, the scan path used consisted of 10 lines with an overlap of 50 %. Prior to application, the SGs produced were cleaned with isopropanol, annealed and provided with solder pads that consisted of a solderable, sputter-deposited thin film. Figure 4a presents a microscopic image of an SG with bone structure that was produced in this manner. This simple bone structure consists of a path (w=50 µm, h=18 µm) and two solder pads. The topography of the SGs produced was characterized by means of a chromatic white-light profilometer (CWL, FRT), as illustrated in Fig. 4b. The line scan in Fig. 4c displays the path height of approximately 20 µm. Due to the steep edges of the path, the light is not reflected in some spots which causes missing points in the plot.

Figure 4(a) Microscopic image of an SG produced with bone structure. (b) Topography of a strain gauge with bone structure measured by means of a chromatic white-light sensor. (c) The height of the path that is recognizable in the line scan is around 20 µm.
4.1 Laser ablation of polyimide structures
The height of the polyimide path depending on the number of scan repetitions was measured using a tactile profilometer (Veeco Dektak 150). For each number of scan repetitions (1, 5, 10 and 15 repetitions) four samples were produced, cleaned in an ultrasonic bath and measured. Figure 5 shows the arithmetic means of the measured path heights vs. the scan repetitions; the SD are also stated. The path height (h) increases almost linearly with the scan repetitions, as does the SD. Tokarev et al. (2003) showed that the ablation rate for polymers starts to decrease above a certain number of laser pulses, ultimately resulting in a spontaneous ablation stop. In our case, this leads to a reduced path height and probably greater deviations above a certain number of scan repetitions. The results show that it is possible to create reproducible polyimide path structures via laser ablation. The path height can be controlled by the number of scan repetitions.
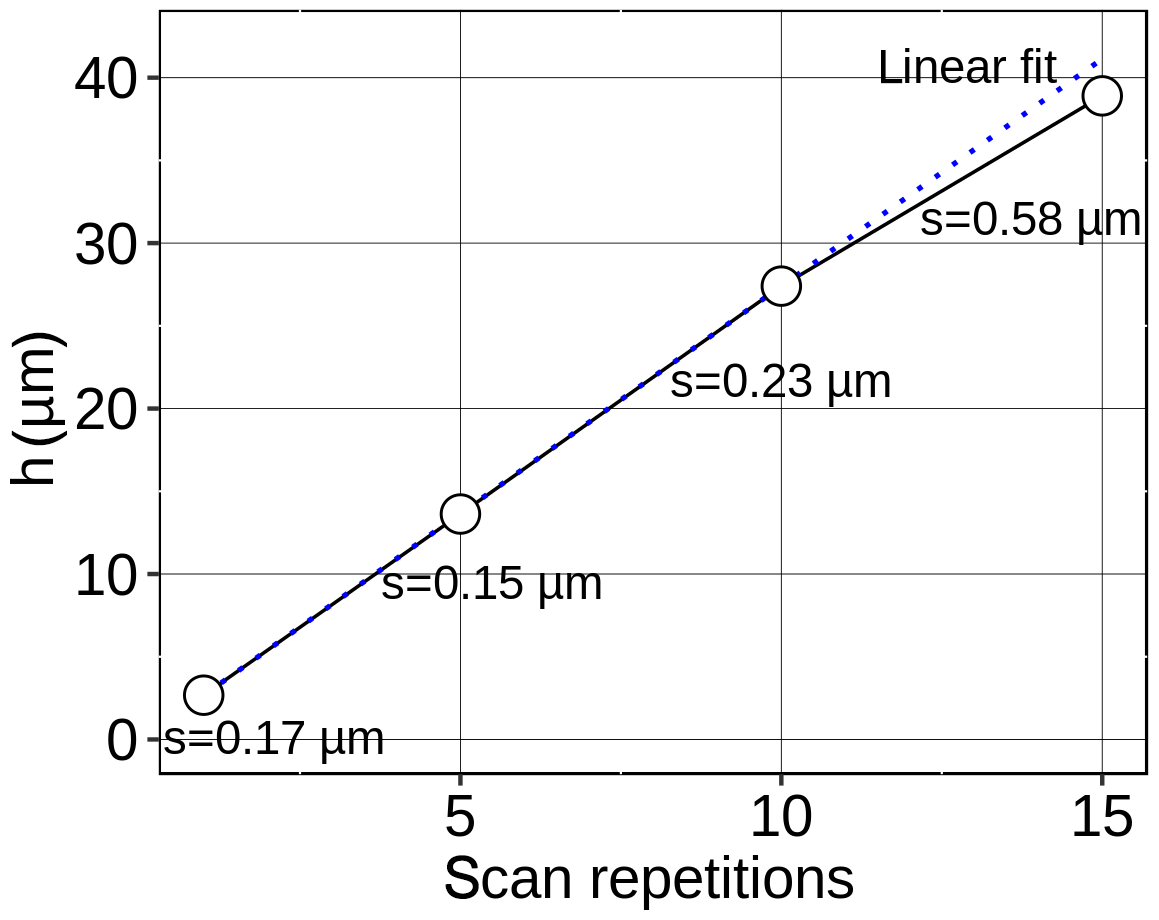
Figure 5The figure depicts the measured path height vs. the number of scan repetitions. The height of four samples for each number of scan repetitions was measured using a tactile profilometer. The arithmetic means of the measured heights as well as the SD (represented using “s” in the figure) are shown. The dotted line represents a linear fit of points one to three.
4.2 Characterization of the transverse gauge factor
The transverse gauge factor of SGs with a bone structure was determined using a device according to VDI/VDE guideline 2635. The device, illustrated in Fig. 6b, consists of a wide metal beam with thickened ends and metal plates on both sides. A force is applied between the plates, creating a bending moment of the beam. The resulting ratio of transverse to longitudinal strain ϵT∕ϵL in the middle of the device is almost zero (Keil, 2017). To measure the transverse gauge factor of the strain gauges, they were bonded in the middle of the beam: two SGs in the longitudinal direction and two in the transverse direction. As a reference, a 90∘ T-rosette metal foil SG (designation: FAET-A6259L-35-S13E; Vishay Precision Group) was also bonded onto the beam. Three load and four unload cycles with a strain of 1 ‰ and 0 ‰, respectively, were executed, resulting in 10 measurement values per cycle and strain gauge. The electrical resistances of the SGs were measured by four-wire sensing using an Agilent 34970A data acquisition/switch unit. The longitudinal and transverse gauge factors (kL and kT, respectively) were calculated by means of the measured resistance changes and the strain ϵL according to Eq. (2). ϵL is the longitudinal strain on the device measured using the reference SG. The resistance of the longitudinally or transversely applied SGs is designated as RL or RT, respectively.
Figure 6a illustrates the relative resistance change for two strain gauges with the same path width (w=50 µm) but different path heights that are both bonded in transverse direction. The SG with the higher path (h=18 µm) showed a drastically reduced transverse sensitivity compared with the SG with the lower path (h=2.5 µm). Thus, the transverse gauge factor is reduced from 4.0 to 0.5, while the longitudinal gauge factor is also slightly reduced from 10.3 to 9.5, as predicted by the FEA simulation. The kT∕kL ratio is 38.5 % for the SG with the lower path and only 5.6 % for the SG with the higher path.

Figure 6(a) Relative resistance change in transversely applied SGs (w=50 µm) depending on the path height (h=2.5 and 18 µm). Three load cycles with a strain ϵL of 1 ‰ were performed. (b) The device, according to VDI/VDE standard 2635, used to characterize the transverse sensitivity of SGs.
In order to verify the greater path height of the SGs as the reason for the reduced transverse gauge factor, the lasered trenches were filled with soft silicone rubber or with hard UV varnish based on epoxy acrylate. Depending on the elastic modulus of the cover material used a more or less pronounced increase in the transverse gauge factor should be observed. The transverse gauge factor of SGs with a path width of 50 µm and a path height of 18 µm was first measured without and then with a cover material. The kT∕kL ratio increased from 5.1 % to 24.7 % for SGs covered with UV varnish. On the contrary, kT∕kL was 5.6 % for SGs without as well as with silicone rubber cover. Since the cover material creates a new mechanical connection from the polyimide path to the polyimide carrier material, the strain transfer to the thin film increases depending on the cover material's elastic modulus. Cover materials like silicone rubber with a low modulus around 1 MPa (Li et al., 2004) do not increase the transverse gauge factor, whereas materials with a higher elastic modulus of approximately 1 GPa (Priola and Renzi, 1985), like UV varnish, lead to a (partial) return to the initial level of strain transfer.
To further examine the influence of the path width on the transverse sensitivity, SGs with a path height of 18 µm and path widths of 50, 40, 30 and 20 µm were measured. Figure 7 shows that the kT∕kL ratio of the strain gauges increases with the path width. In contrast to the simulation results, no negative transverse gauge factors were measured. Therefore, it can be assumed that the transverse gauge factor declines asymptotically towards zero for increasing path heights or decreasing path widths, respectively. kT∕kL could be reduced to 0.93 % for w=20 µm and h=18 µm, which is a value comparable with conventional strain gauges.
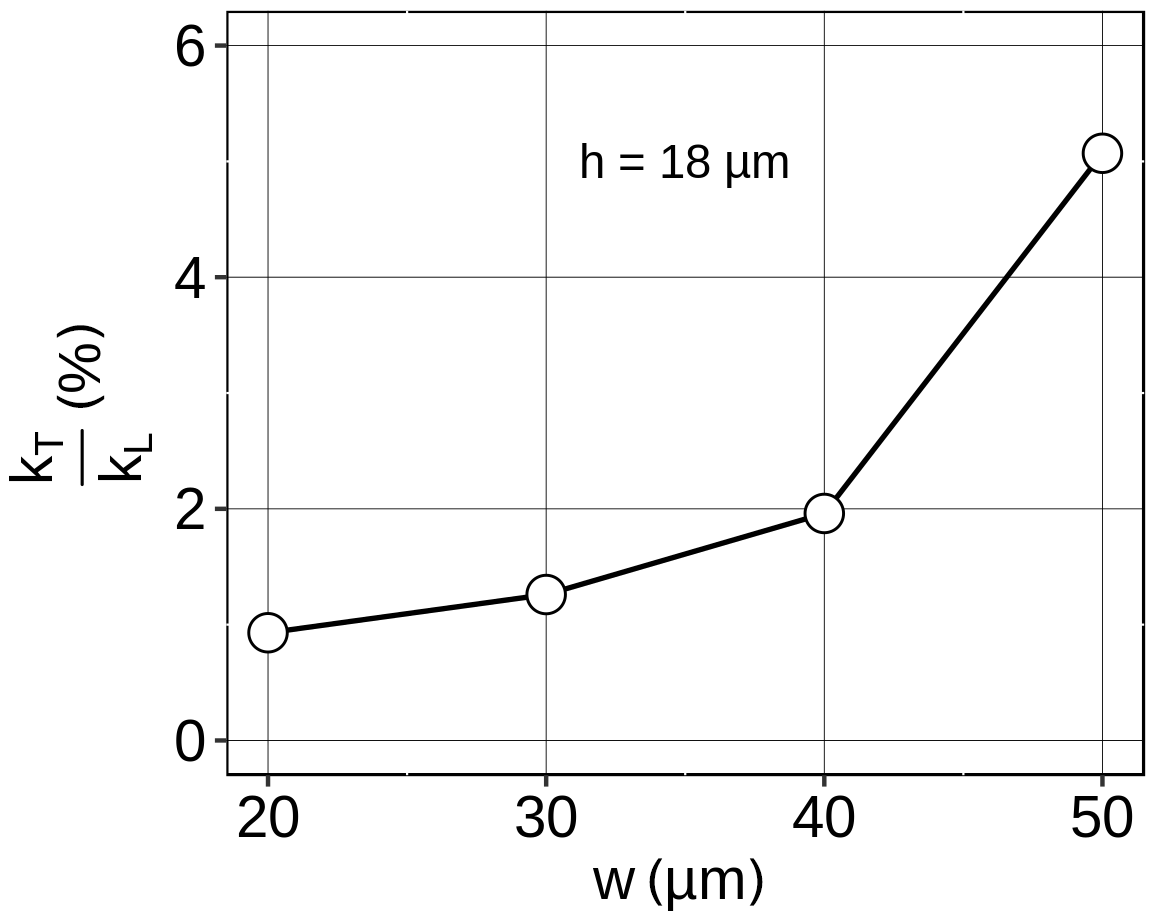
Figure 7The graph illustrates the influence of the path width on the kT∕kL ratio of highly sensitive strain gauges. The path height was fixed at 18 µm.
4.3 Application of strain gauges with reduced transverse gauge factor
A low transverse sensitivity of strain gauges can be advantageous for applications on biaxial strain fields occurring on tension/compression force transducers as shown in Fig. 8. An applied tensile force generates a deformation of the transducer's membrane. Therefore, tensile strain occurs in the force direction, whereas compressive strain is perpendicular to the force direction. The resulting output signal of a Wheatstone bridge, consisting of two strained and two compressed SGs, is highly dependent on the SG's longitudinal and transverse gauge factors. The relation between the nominal SG resistance R0, the resistance changes of the SGs ΔRi with , the bridge output voltage VM and the bridge supply voltage VB under the assumption that ΔRi≪R0 is given in Eq. (3) (Keil, 2017).
Considering the definition of the gauge factor in Eq. (4) and the present strain field with and , the sensitivity of the bridge can be transformed to
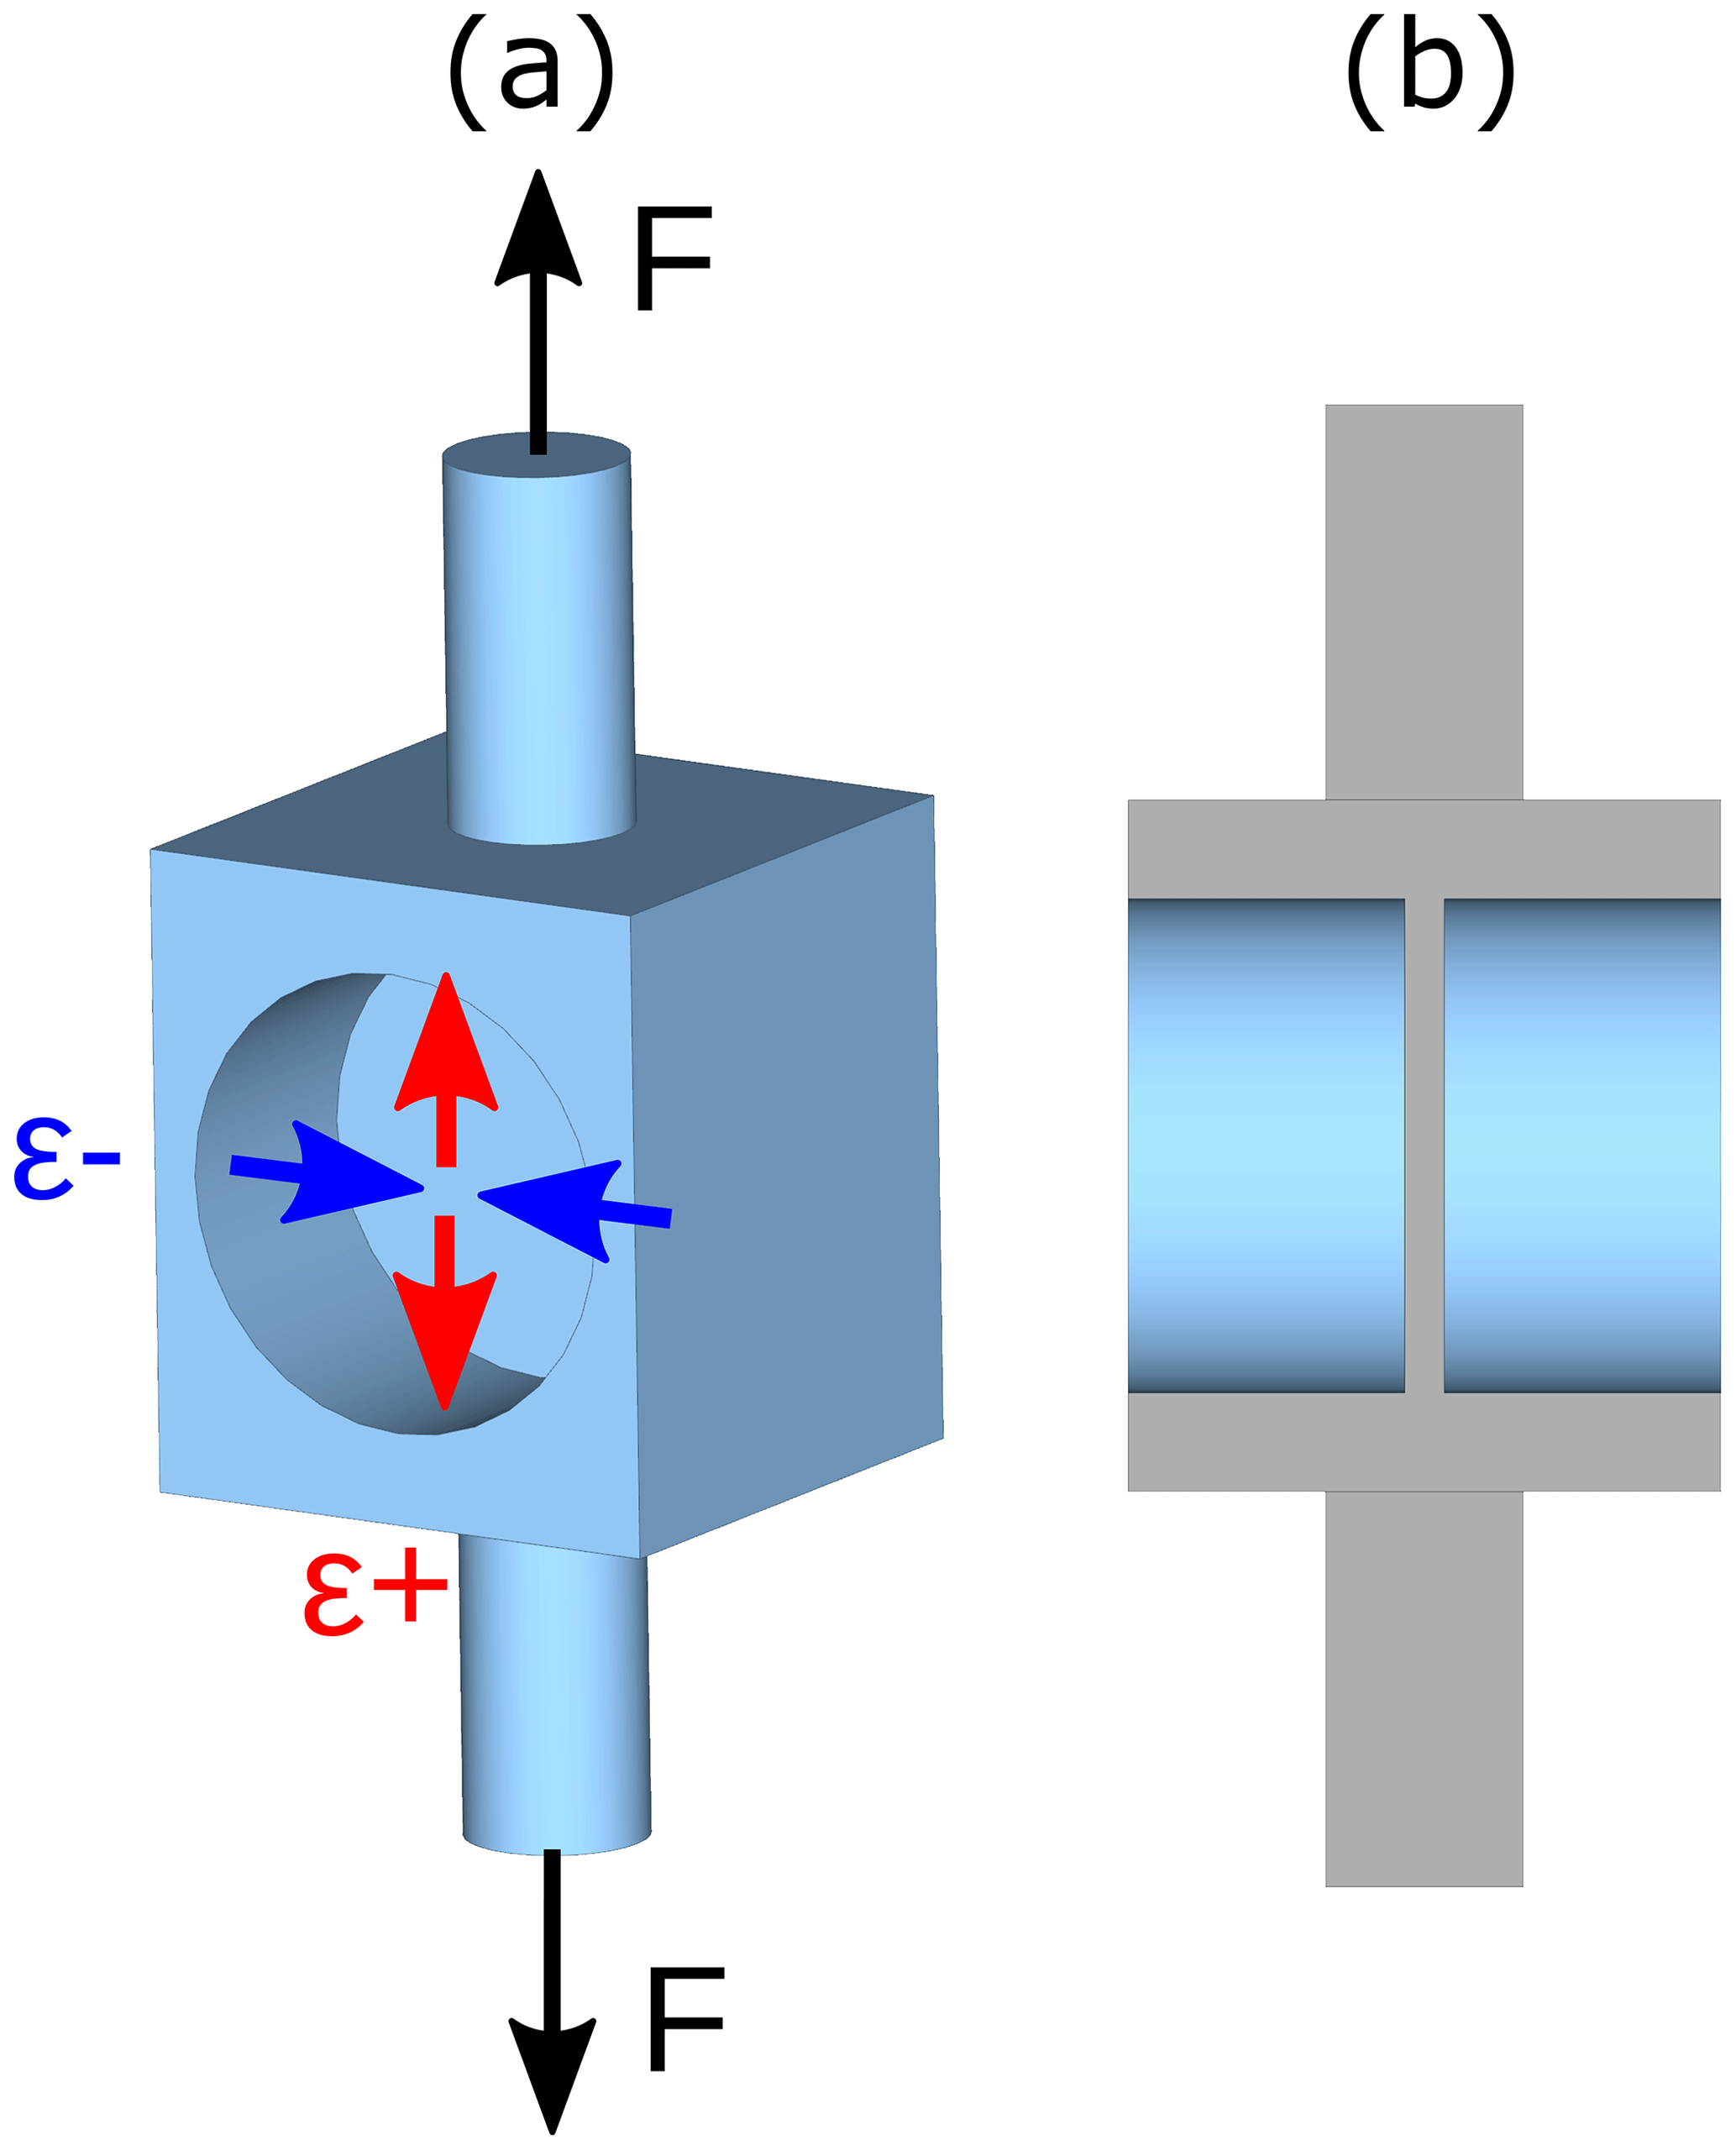
Figure 8(a) Model of a tension/compression force transducer with the applied force and resulting strains on the membrane surface. (b) A sectional view of the transducer shows the position and thickness of the membrane.

Figure 9(a) Signal of four tension/compression force transducers vs. the applied mass. The full bridges of two transducers (red squares/circles) consist of SGs with w=100 µm and h=2.5 µm, resulting in . For the full bridges of two additional transducers (black squares/circles), SGs with w=50 µm and h=18 µm were used, leading to . Panel (b) shows the positioning of the SGs on the transducer's membrane.
Since and , a large transverse gauge factor will result in a reduced signal (). To verify this concept, force transducers of a tension/compression type made of aluminum were characterized using SGs with different path geometries and, accordingly, different transverse gauge factors. The SG layout for the characterization is linear, consisting of two paths with a length of 2.1 mm, two solder pads and a reverse loop with a length of 0.7 mm. On the one hand, SGs with a path width of 100 µm, a path height of 2.5 µm and a longitudinal gauge factor of 10.9 were used. The transverse gauge factor was 5.3 for these SGs (). On the other hand, SGs with a path width of 50 µm, a path height of 18 µm, a longitudinal gauge factor of 9.1 and a transverse gauge factor of 0.5 were applied (). Per transducer, four SGs were bonded onto one side of the membrane, according to Fig. 9b, and connected to a Wheatstone bridge. The force transducers were loaded in 20 kg steps up to a mass of 100 kg, which corresponds to a tensile strain ϵ+ of 0.45 ‰ and a compressive strain ϵ− of −0.4 ‰. The graph in Fig. 9a shows the measured signals vs. the applied mass for two SG transducers. The transducer sensitivity is nearly doubled due to the 90 % reduction in the transverse gauge factor, despite the slightly lower longitudinal gauge factor. The higher sensitivity allows for a thicker membrane for this transducer type, increasing the overload capability.
The transverse gauge factor of highly sensitive strain gauges based on a piezoresistive, granular thin film and a polyimide carrier can be dramatically reduced by modifying the strain transfer. This can be achieved by means of a picosecond laser which allows for the reproducible production of strain gauges consisting of a stand-alone polyimide path with the thin film on top. FEA showed that the width and height of such a polyimide path has a massive impact on the transfer of transverse strain. The thinner and higher the path, the less strain will be transferred to the granular film; as a result, the transverse gauge factor will be reduced to almost zero. This was proven by measurements of the transverse gauge factor for different SG path geometries. The ratio of the transverse to the longitudinal gauge factor was reduced to about 1 % for a path width of 20 µm and a path height of 18 µm. The reduced transverse gauge factor will increase again if the previously created laser trenches are filled with a hard material-like UV varnish that has a high elastic modulus compared with polyimide. On the contrary, soft materials like silicone rubber do not affect the reduced transverse gauge factor. A Wheatstone bridge consisting of highly sensitive SGs with a greatly decreased kT shows significantly higher sensitivity than a bridge of SGs with a regular kT when applied on a biaxial strain field of tension/compression force transducers. Therefore, this new method to reduce the transverse sensitivity of granular thin film SGs allows for the use of stiffer force transducers with an even more increased overload capability. Furthermore, the low transverse sensitivity might be advantageous for uniaxial stress analysis. In this case, the direction of stress is known, and the amount of transverse contraction, for example, needs to be measured. In further experiments, the impact of stand-alone polyimide paths on creep error, temperature-related errors and moisture sensitivity will be investigated.
The underlying data are available from https://doi.org/10.6084/m9.figshare.11996250.v1 (Mathis, 2020).
MM was responsible for the investigation, methodology, visualization and writing the original draft of the paper. DV and ML contributed to the conceptualization, methodology, and reviewing and editing the paper. DG was responsible for the validation. AL carried out project administration. GS was responsible for supervision and review and editing the paper.
The authors declare that they have no conflict of interest.
This research has been supported by the German Federal Ministry for Economic Affairs and Energy (grant no. 49VF170017, INNO-KOM).
This paper was edited by Michael Kraft and reviewed by two anonymous referees.
Adhi, K. P., Owings, R. L., Railkar, T. A., Brown, W., and Malshe, A.: Chemical modifications in femtosecond ultraviolet (248 nm) excimer laser radiation-processed polyimide, Appl. Surf. Sci., 225, 324–331, 2004. a
Gomez, D., Goenaga, I., Lizuain, I., and Ozaita, M.: Femtosecond laser ablation for microfluidics, Opt. Eng., 44, 051105, https://doi.org/10.1117/1.1902783, 2005. a
Jiang, C.-W., Ni, I.-C., Tzeng, S.-D., and Kuo, W.: Nearly isotropic piezoresistive response due to charge detour conduction in nanoparticle thin films, Sci. Rep.-UK, 5, 1–9, 2015. a
Keil, S.: Technology and practical use of strain gages: with particular consideration of stress analysis using strain gages, John Wiley and Sons, Berlin, Germany, 2017. a, b, c
Koppert, R., Uhlig, S., Schmid-Engel, H., Göttel, D., Probst, A.-C., Schultes, G., and Werner, U.: Structural and physical properties of highly piezoresistive nickel containing hydrogenated carbon thin films, Diam. Relat. Mater., 25, 50–58, 2012. a
Langosch, M. and Vollberg, D.: DE102017223831A1, Dehnungsstreifen umfassend ein flexibles Substrat sowie eine Widerstandsschicht und Sensorelement umfassend einen Dehnungsmessstreifen, Hochschule für Technik und Wirtschaft des Saarlandes, 2017. a
Langosch, M., Cerino, M., Lellig, A., Vollberg, D., Probst, A.-C., Freitag-Weber, O., Schultes, G., Landes, A., and Göttel, D.: P2.1-Pattern Definition of Foil Based Sensors with Ultrafast UV Lasers, in: Proceedings SENSOR 2015, AMA Conferences 2015, Nürnberg, Germany, 755–758, https://doi.org/10.5162/sensor2015/P2.1, 2015. a
Li, Z., Brokken-Zijp, J. C., and de With, G.: Determination of the elastic moduli of silicone rubber coatings and films using depth-sensing indentation, Polymer, 45, 5403–5406, 2004. a
Mathis, M.: Novel method to reduce the transverse sensitivity of granular thin film strain gauges by modification of strain transfer, 11:15, Figshare, https://doi.org/10.6084/m9.figshare.11996250.v1, 2020. a
Naumann, J. and Stockmann, M.: DE19826411A1, Dehnungsmeßstreifen und Verfahren zur Querempfindlichkeitskompensation, 1998. a
Priola, A. and Renzi, F.: Ultraviolet curable epoxy acrylic resins – network flexibilization in the presence of reactive diluents, J. Mater. Sci., 20, 2889–2902, 1985. a
Schultes, G., Schmid-Engel, H., Schwebke, S., and Werner, U.: Granular metal–carbon nanocomposites as piezoresistive sensor films – Part 1: Experimental results and morphology, J. Sens. Sens. Syst., 7, 1–11, https://doi.org/10.5194/jsss-7-1-2018, 2018. a
Schwebke, S., Werner, U., and Schultes, G.: Granular metal–carbon nanocomposites as piezoresistive sensor films –Part 2: Modeling longitudinal and transverse strain sensitivity, J. Sens. Sens. Syst., 7, 69–78, https://doi.org/10.5194/jsss-7-69-2018, 2018. a
Tokarev, V., Lopez, J., Lazare, S., and Weisbuch, F.: High-aspect-ratio microdrilling of polymers with UV laser ablation: experiment with analytical model, Appl. Phys. A, 76, 385–396, 2003. a
VDI/VDE: guideline 2635 part 1, Experimental structure analysis, Metallic bonded resistance strain gauges, Characteristics and testing conditions, The Association of German Engineers (VDI) and Association for Electrical, Electronic & Information Technologies (VDI), 07/2015. a
Vollberg, D., Probst, A.-C., Langosch, M., Landes, A., Göttel, D., Cerino, M., Lellig, A., Freitag-Weber, O., and Schultes, G.: Hochempfindliche Folien-Dehnungsmessstreifen auf dem Weg zur technologischen Reife, tm-Tech. Mess., 82, 506–516, 2015. a, b, c