the Creative Commons Attribution 4.0 License.
the Creative Commons Attribution 4.0 License.
 | 19 Aug 2020
In-line monitoring of electrolytes and urea during continuous renal replacement therapy
Merle Sehlmeyer
Flora Sellering
Hannes Röhrich
Thorsten Perl
Hussam Mansour
Daniel Baasner
Stefan Zimmermann
The individualization of dialysis treatment using a customized dialysate composition usually requires a continuous measurement of electrolytes and urea in blood. The current practices are spot measurements of blood samples either with blood gas analyzers or in the laboratory, involving considerable personnel effort. Furthermore, the measured values are time delayed and not available in a continuous fashion. In this paper we investigate an in-line concept for continuous monitoring of important blood parameters such as sodium, potassium, calcium and urea concentrations in blood serum using ion-selective electrodes. This concept is evaluated in a preclinical study with human packed red blood cells as a test medium over a period of 7 h. It has been shown that the electrolytes can be well monitored. In addition, we present first measurements with ion-sensitive field-effect transistors in a miniaturized sensor assembly. Therefore, new low-cost electronics for such ion-sensitive field-effect transistors have been developed.
- Article
(1911 KB) - Full-text XML
- BibTeX
- EndNote


The individualization of dialysis treatment is receiving increasing attention in research as critically ill patients in intensive care units (ICUs) with acute kidney injury (AKI) particularly benefit from it (Palmer, 2001; Locatelli et al., 2015; Sharma et al., 2016; Kovesdy et al., 2007; Paula et al., 2004; Stiller et al., 2001).
AKI is the rapid loss of renal function, usually diagnosed by the accumulation of end products of the nitrogen metabolism, such as urea nitrogen and creatinine, in conjunction with reduced urinary excretion (Bellomo et al., 2012). In particular, critically ill patients in ICUs who suffer from multiorgan failure or sepsis often develop AKI (Zarjou and Agarwal, 2011; Baue et al., 2000; Bagshaw et al., 2008). Such patients show mortality rates of 50 %–60 % (Ricci et al., 2006; Palmer, 2001). Critically ill patients with AKI usually receive continuous renal replacement therapy (CRRT) treatments (Patel et al., 2010; Patschan and Müller, 2015; Ricci et al., 2006; Tumlin et al., 2008). The major difference between CRRT and the regular intermittent dialysis applied to chronic kidney diseases is the duration of the treatment and the rate at which water and waste products are removed from the extracorporeal circuit via diffusion across the semipermeable membrane of the dialyzer (Patel et al., 2010). While intermittent dialysis aims at the maximum clearance of waste products and the normalization of electrolytes at a treatment with a duration of 3–4 h, CRRT focuses on a significantly slower normalization of blood parameters over a treatment duration of several days, which is beneficial for critically ill patients as a rapid change in osmotic substances can lead to different complications (Patel et al., 2010; Sivalingam and Farrington, 2007; Stiller et al., 2001).
For example, a rapid change in the sodium plasma concentration, and thus an abrupt shift in plasma osmolarity, can cause cardiovascular instability, overhydrating of cells and disequilibrium syndrome with muscle cramps, fatigue symptoms and headaches. However, insufficient sodium removal and hence sodium accumulation can lead to increased thirst, hypertension and pulmonary edema (Stiller et al., 2001; Palmer, 2001; Locatelli et al., 2015; Paula et al., 2004).
Although other approaches exist for determining the sodium concentration by conductivity measurements, and some of these approaches even work in a contactless manner, other electrolytes cannot be determined this way (Stragier et al., 2018; Tura et al., 2013; Berger et al., 2019b, 2020). In particular, potassium is another important parameter as a frequent complication of AKI is hyperkalemia, known as a trigger for heart arrhythmia. The same applies to hypokalemia. However, not only the absolute concentration of potassium is important. In Buemi et al. (2005) and Palmer (2001), it is shown that an abrupt change in the potassium concentration can trigger such arrhythmias as well because it induces a critical ratio between the intracellular and extracellular potassium concentration. Therefore, Redaelli et al. (1996) recommend a maximum difference in the potassium concentration of 1.5 mmol L−1 between the dialysate and the blood, with an exponential profile of the dialysate concentration to limit the diffusion and thus to limit the change in potassium concentration in the blood. In order to adjust this required concentration gradient and to achieve the desired plasma concentration profile for potassium and sodium, it is necessary to continuously monitor the plasma concentration.
Ionized (free) calcium is another important parameter in extracorporeal circuits, since it is essential for blood coagulation. Especially in CRRT, anticoagulation is necessary to avoid clotting inside the dialyzer over the long period of treatment. As critically ill patients may also have an increased risk of bleeding, a global anticoagulation using, for example, heparin, which is currently the most commonly used extracorporeal anticoagulant, has to be avoided. In contrast to heparin, citrate can be used as a regional anticoagulant. Therefore, citrate is added to the blood inside the extracorporeal circuit before the blood passes through the dialyzer, binding the ionized calcium into a complex and thus preventing blood coagulation. After passing the dialyzer and before the blood is returned to the patient, additional ionized calcium is added to the extracorporeal circuit to reactivate coagulation (Davenport and Tolwani, 2009). In order to control the exact amount of citrate being added, it is necessary to continuously measure the ionized calcium concentration as it is the measure for blood coagulation.
Furthermore, an important marker representing the efficiency of a dialysis treatment is the urea reduction ratio (URR), according to Eq. (1), as urea represents all waste products (Keshaviah et al., 1995) as follows:
Here, cpre is the predialysis urea concentration in blood and cpost is the blood urea concentration after the dialysis treatment. URRs of less than 60 % are associated with a higher mortality in patients during dialysis (Owen et al., 1993). However, using Eq. (1), the efficiency can only be determined after the treatment. Thus, it is also beneficial to continuously monitor the blood urea concentration in order to evaluate the efficiency of dialysis treatment in line and in real time.
The current practice for determining blood parameters is to analyze blood samples in the laboratory or use a blood gas analyzer. This way, monitoring requires a considerable amount of personnel effort and high costs. Moreover, the results are time delayed and not available in a continuous fashion.
In Berger and Zimmermann (2017) and Berger et al. (2019a) we introduced a simple concept for the continuous in-line monitoring of electrolyte and urea concentrations in extracorporeal circuits, enabling an individualized dialysis treatment using ion-selective electrodes (ISEs). As shown in Fig. 1, this concept is based on separating the blood in the extracorporeal circuit from the sensor compartment containing the ISEs with a dialysis membrane.

Figure 1Schematic depiction of the in-line measuring concept with ion-selective electrodes placed in a sensor compartment separated from the blood in the extracorporeal circuit by a dialysis membrane. The sensor compartment also enables calibration of the ion-selective electrodes just before usage by simply flushing the sensor compartment with a calibration solution. Furthermore, cyclical recalibration is possible for long-term measurements to improve accuracy.
The membrane allows the exchange of all relevant substances, such as electrolytes and urea, between the sensor compartment and blood, while retaining, for example, proteins which can adsorb on the sensor surface, causing a sensor drift (Sharma et al., 2016) or blood coagulation. Since substance transport between the blood and sensor compartment is based on diffusion, a certain time is required to reach a concentration equilibrium between the blood in the extracorporeal circuit and the fluid in the sensor compartment. A detailed investigation of the sensor response dynamics and the resulting errors related to this measurement concept is shown in Berger et al. (2018). For higher accuracy, sensor calibration just before usage is possible by simply flushing the sensor compartment with two different calibration solutions in sequence. This also allows for cyclical recalibration because the sensor compartment can be flushed with a physiological solution of known concentrations at certain intervals, which is especially useful for longer treatments. Such in-line offset adjustments significantly improve the accuracy of potentiometric measurements and are especially useful for compensating for any temporal sensor drift. Figure 2 shows a photograph of the measuring chamber used that consists of two parts made of polyether ether ketone (PEEK). The upper part contains the ISEs and has two Luer connectors to fill in the calibration solutions. The calcium and potassium electrode was purchased from AMEL S.r.l. The sodium electrode was purchased from Metrohm. As a reference electrode, we used an Ag∕AgCl electrode (Mettler-Toledo GmbH). The lower part also has two Luer connectors, enabling a simple integration into the extracorporeal circuit. The semipermeable dialysis membrane is located between the two PEEK parts. The measuring chamber was developed and manufactured, and particularly designed to achieve hemocompatible blood flow, in cooperation with InnoMe GmbH (Espelkamp, Germany) and Barkey GmbH & Co. KG (Leopoldshöhe, Germany).
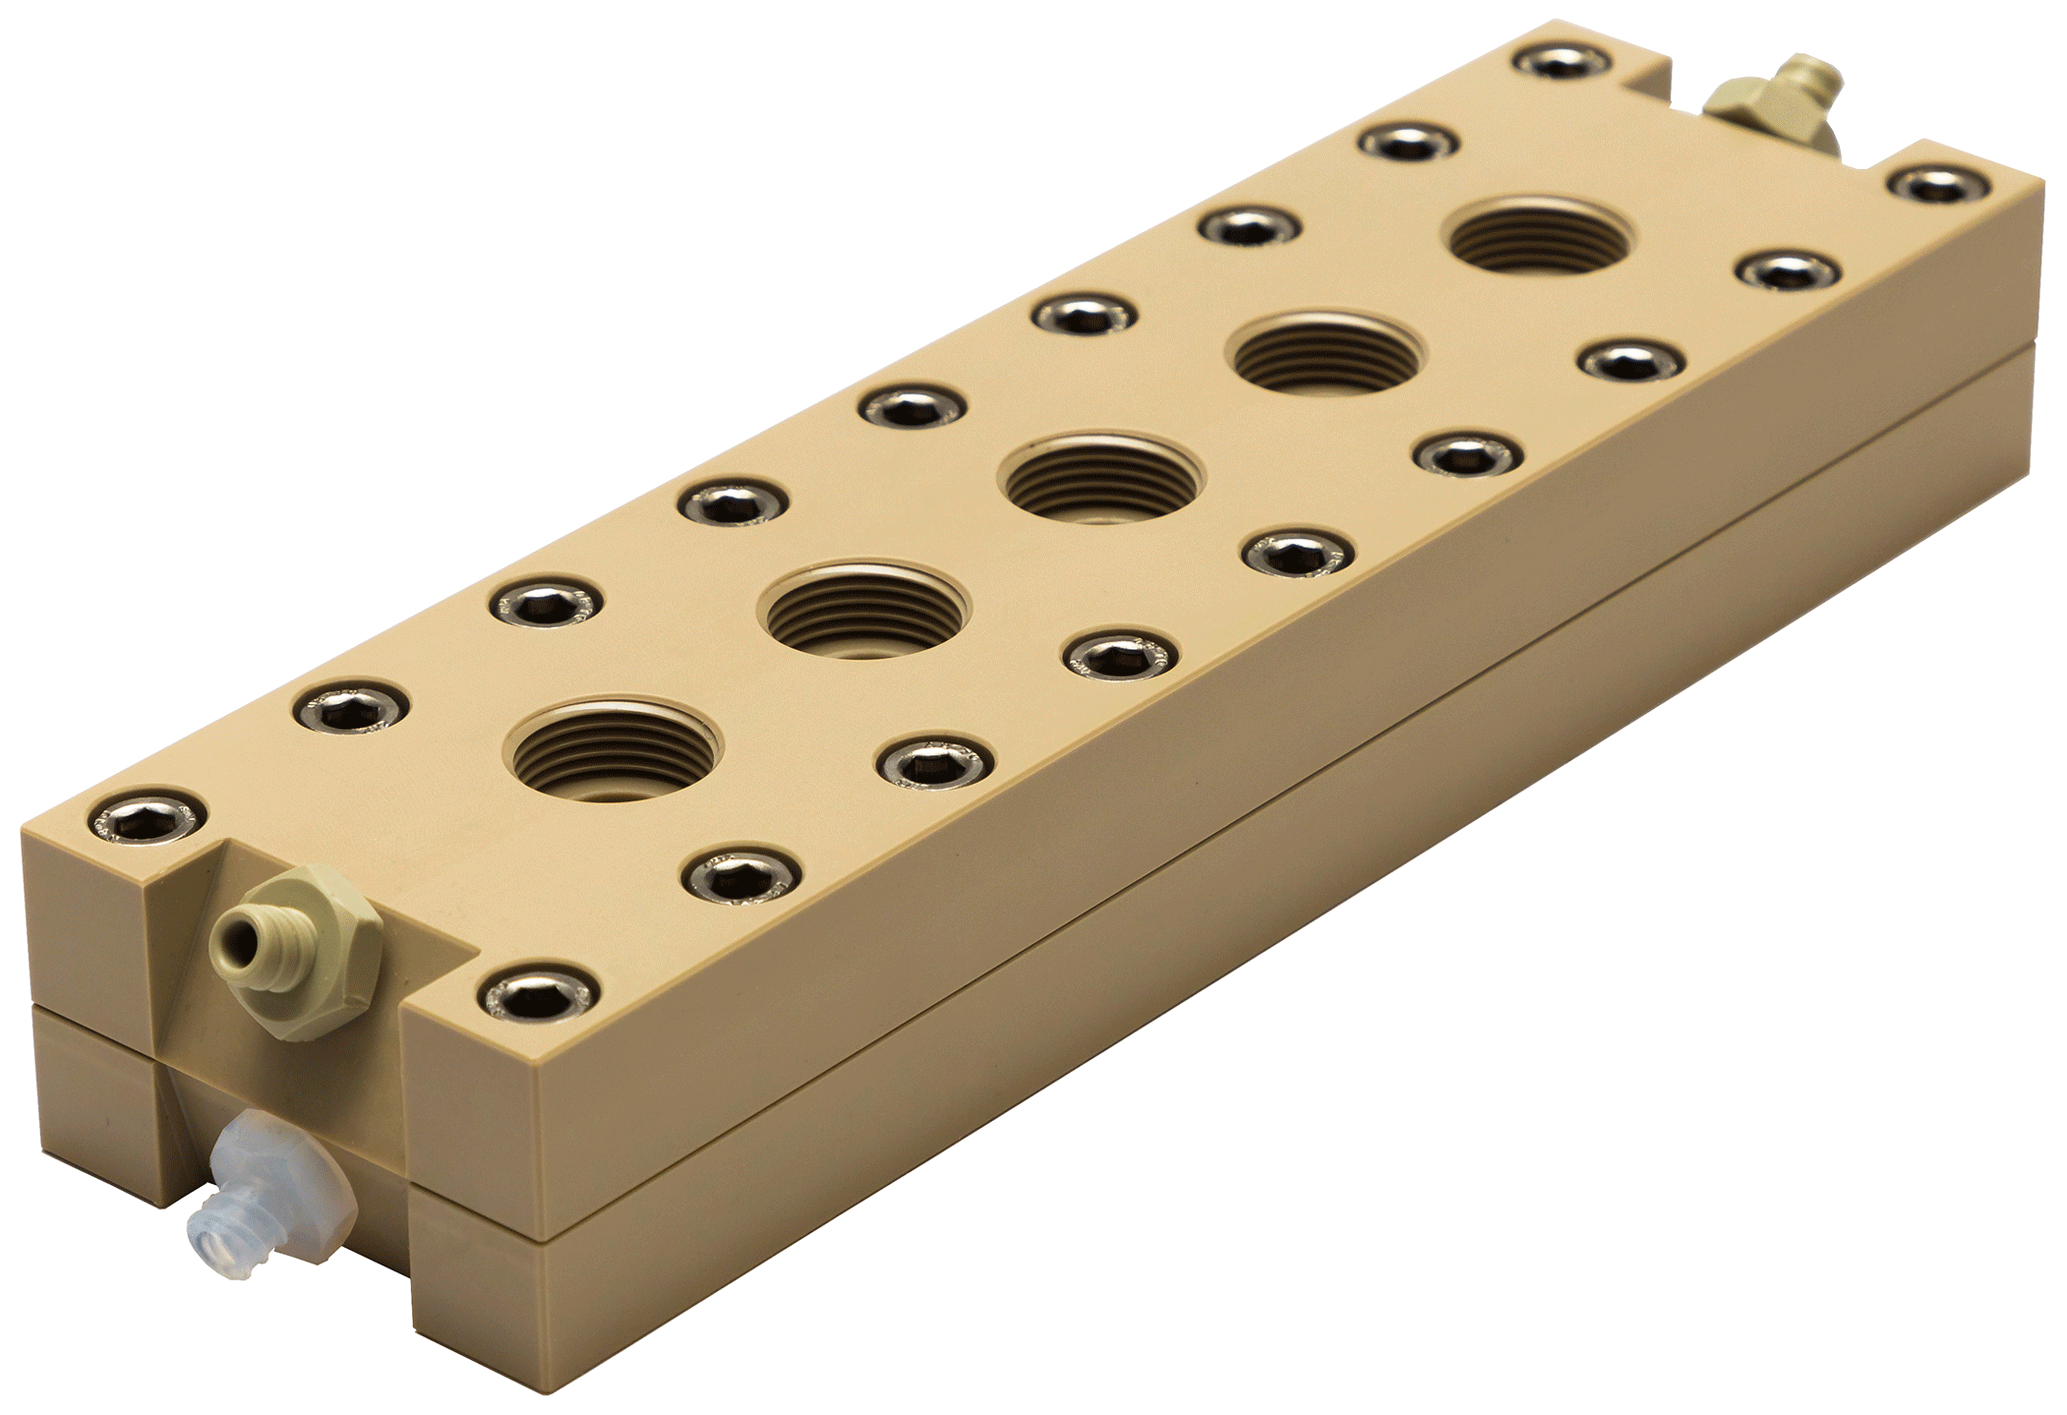
Figure 2Photograph of the in-line measuring chamber for continuous monitoring of blood parameters in extracorporeal circuits.
In this work, we present the first measurements using this concept in an extracorporeal circuit with human packed red blood cells (PRBCs) as a test medium to simulate realistic conditions. Moreover, we propose miniaturizing the sensor compartment by using ion-sensitive field-effect transistors (ISFETs). This includes the development of low-cost electronics to drive the ISFETs.
To measure the urea concentration, we used a biosensor consisting of an ammonium ISE (AMEL S.r.l.) and the enzyme urease. Using urease, the urea is catalyzed into ammonium and carbonate ions according to Eq. (2), and the ammonium ions are measured with the ammonium ISE as follows (Hu et al., 2010):
Different approaches exist to immobilize the enzyme near the electrode; for example, the cross-linking of the enzymes (Singh et al., 2008). However, such an approach often uses toxic chemicals, making an in-line measurement according to our concept difficult. Moreover, the activity of the enzyme is often reduced. Therefore, we used a simple method for immobilization consisting of a dialysis membrane (RCT NatureFlex-NP; Reichelt Chemietechnik) with a molecular weight cutoff of 10–20 kDa to retain the enzyme solution inside a small enzyme compartment created by a 0.5 mm spacer, which is bonded to the ISEs as depicted in Fig. 3. The bonding of the 0.5 mm spacer to the ISEs was realized in cooperation with InnoMe GmbH (Espelkamp, Germany).
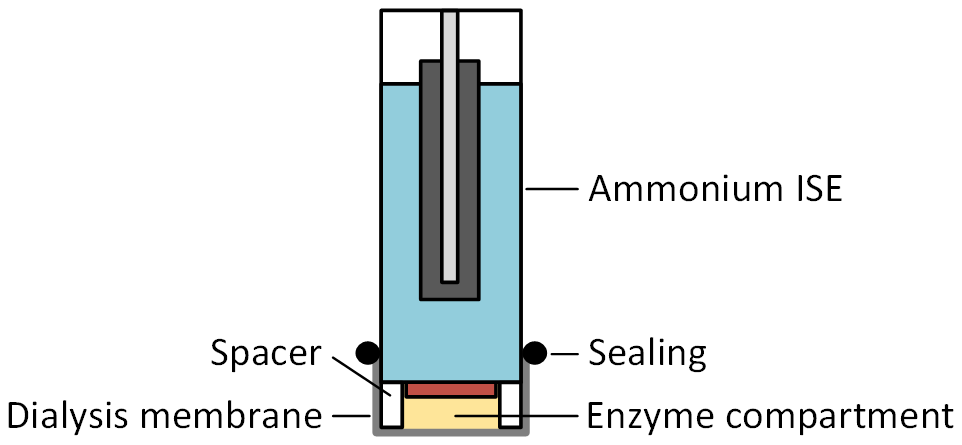
Figure 3Schematic cross section of the urea sensor, consisting of an ammonium ISE with an additional 0.5 mm spacer, and a dialysis membrane that forms the enzyme compartment.
Since urea has a molecular weight of about 60 Da, it can diffuse into the enzyme compartment. However, urease cannot pass the membrane and is retained inside this compartment as its molecular weight is 480 kDa. Thus, the ammonium ions are generated near the sensitive layer of the ammonium ISE at full enzyme activity. The urea sensor was integrated into the sensor compartment of the measuring chamber together with the ISEs for the electrolytes.
In order to simulate an extracorporeal circuit under realistic conditions, we used a test bench set up at the University Medical Center Göttingen containing the multiFiltrate dialysis system and the AV 600S Ultraflux dialyzer (both from Fresenius Medical Care), as depicted in Fig. 4.
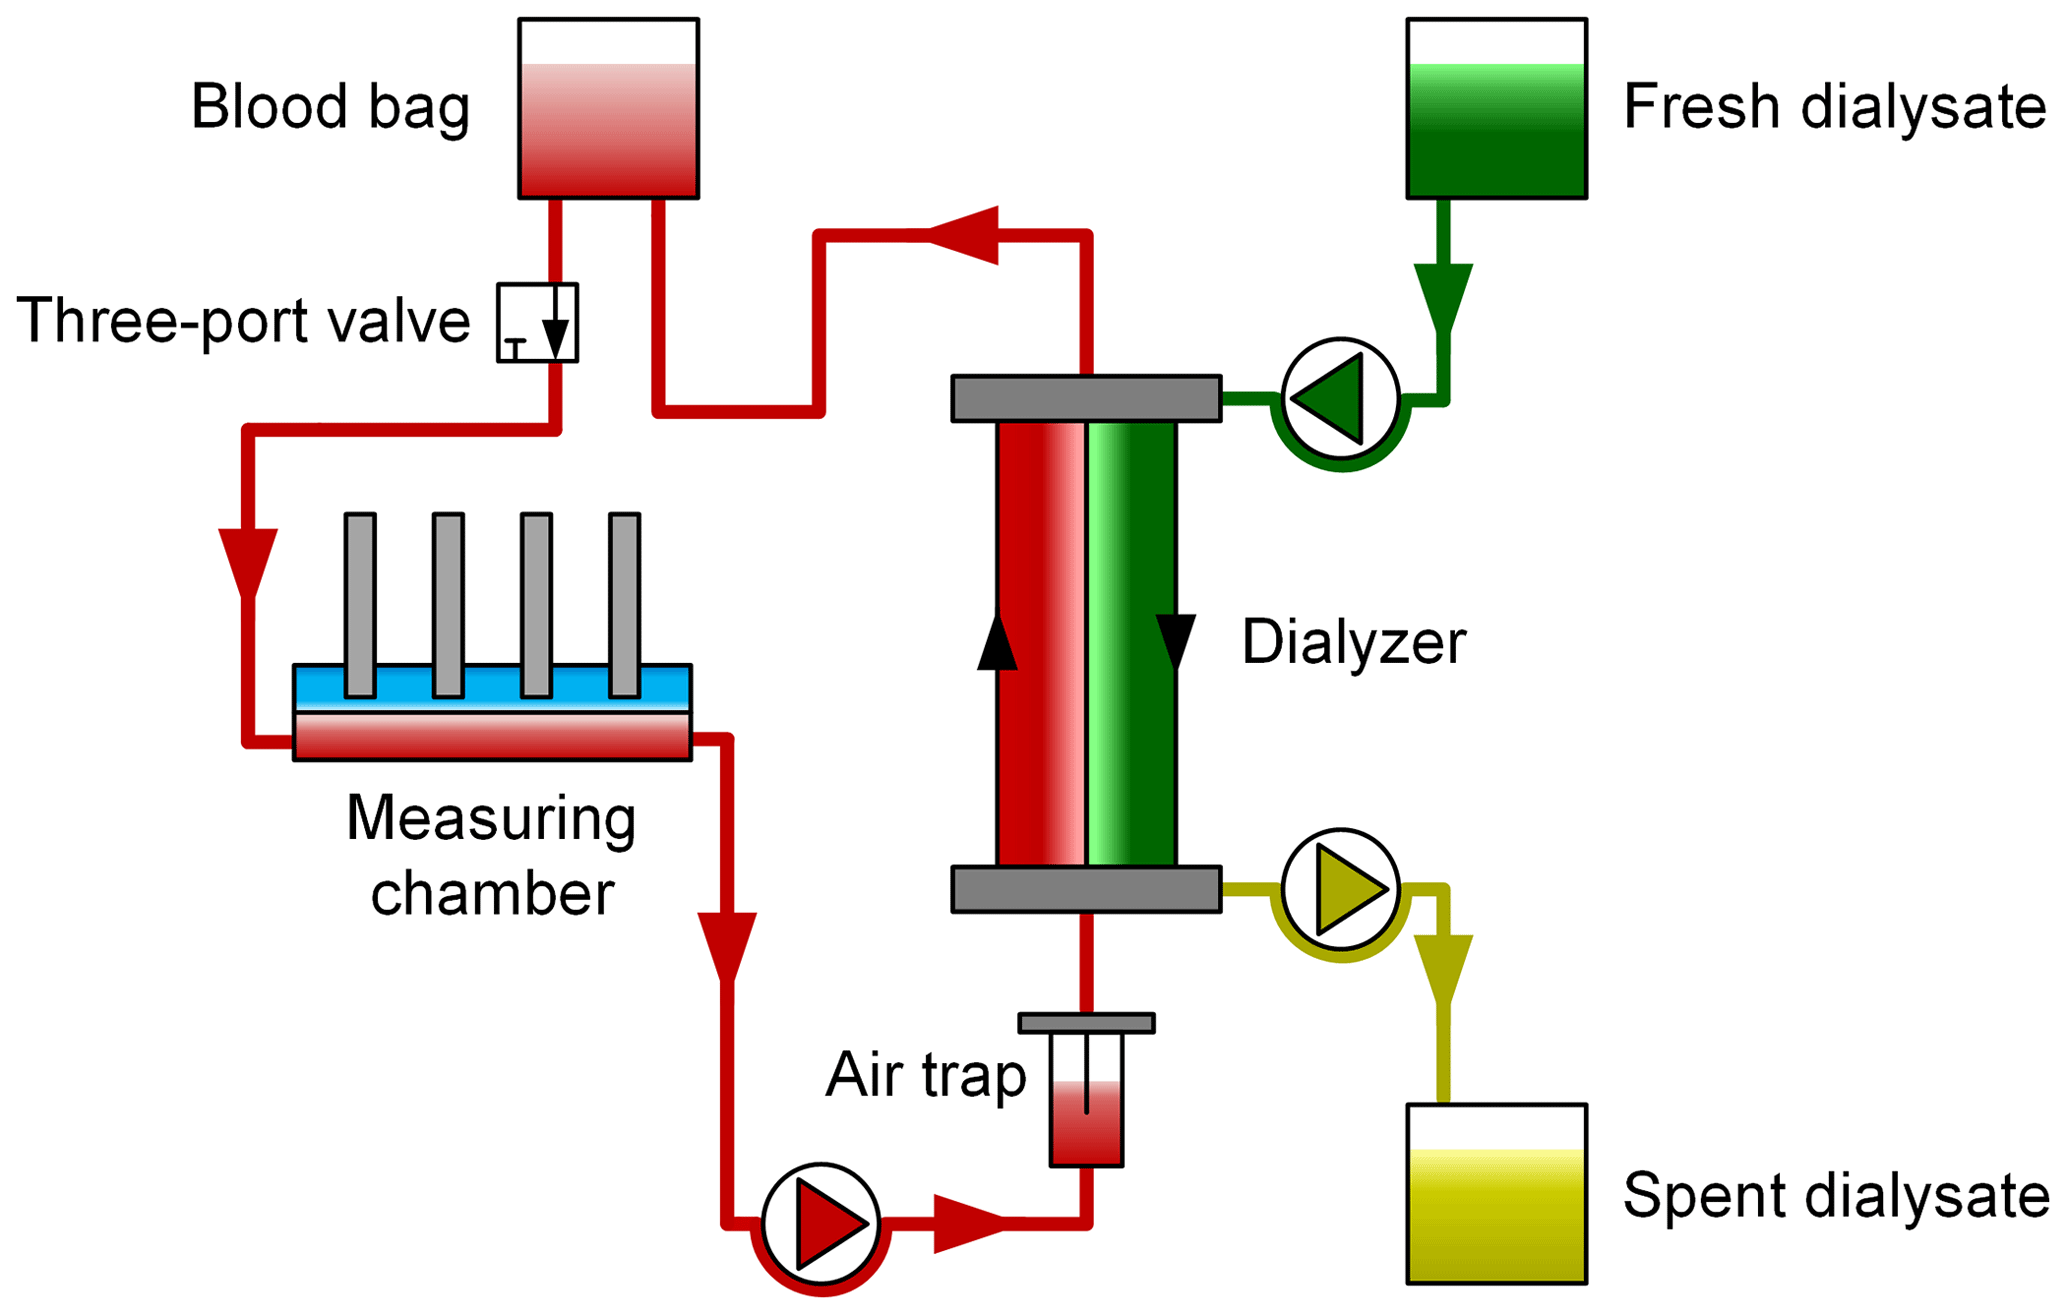
Figure 4Schematic depiction of the test bench using human packed red blood cells as a test medium. Blood samples are drawn at regular intervals via the three-port valve and are then analyzed by a standard blood gas analyzer (BGA) and in the laboratory. The BGA values serve as a reference for the ion-selective electrodes to determine the electrolyte concentration, and the laboratory values serve as a reference for the urea sensor.
Using the peristaltic pump of the dialysis system, the PRBCs are pumped from the blood bag through a three-port valve, an air trap and then the dialyzer at a flow rate of about 100 mL min−1, representing a typical flow rate in CRRT. The in-line measurement system is integrated into this simulated extracorporeal circuit. The three-port valve enables one to draw blood samples, which are taken approximately every 10 min, for analysis in a GEM Premier 4000 (Instrumentation Laboratory) blood gas analyzer (BGA) and to also draw samples for analysis in the laboratory every 20 min. The blood gas analyzer is used as a reference for the electrolyte concentrations, and the laboratory analysis as a reference for the urea concentration. It should be noted that, according to Bénéteau-Burnat et al. (2008), the GEM Premier 4000 has a standard deviation coefficient (CV) of 1 % for sodium, 1.5 % for potassium and 1.2 % for calcium. On the other side of the filter membrane of the dialyzer, fresh dialysate is pumped into the dialyzer, and the spent dialysate is pumped into a waste bag.
The electrolyte and urea concentrations in the fresh dialysate were varied for test purposes over the duration of the experiment. Diffusion between the dialysate and the blood caused a continuous change in the concentrations in the blood, resulting in a maximum change of 50 (113 to 163 mmol L−1) for sodium, 8.8 (1.9 to 10.7 mmol L−1) for potassium, 1.695 (0.095 to 1.790 mmol L−1) for calcium and 178.2 (1.8 to 180 mg dL−1) for blood urea nitrogen (BUN), all covering the clinical relevant concentration ranges.
4.1 Results – electrolyte monitoring
To experimentally investigate the in-line measuring concept, we changed the concentration of all blood parameters of interest (namely sodium, potassium, calcium and urea) simultaneously, as described above, via the dialysate concentration within the clinically relevant range. The ISEs were calibrated just before the measurement term by filling the sensor compartment with two defined calibration solutions according to (Cammann, 1979; Osswald and Wuhrmann, 1981; Cammann and Galster, 1996). The two calibration solutions we use have different electrolyte concentrations, namely c0 and c1, of the individual electrolytes but have the same ionic strength of 160 mmol L−1 in total, which compares to the blood ionic strength, enabling a so-called concentration calibration in which the output voltage of the respective electrodes versus an Ag∕AgCl reference electrode is approximately proportional to the concentration in a certain concentration range and not only to the activity of the ions. With the calibration, the sensitivities S of the sodium, potassium and calcium ISEs as well as the voltage U0 between the ISEs versus the Ag∕AgCl reference electrode for a known concentration c0 can be determined. Table 1 summarizes these values.
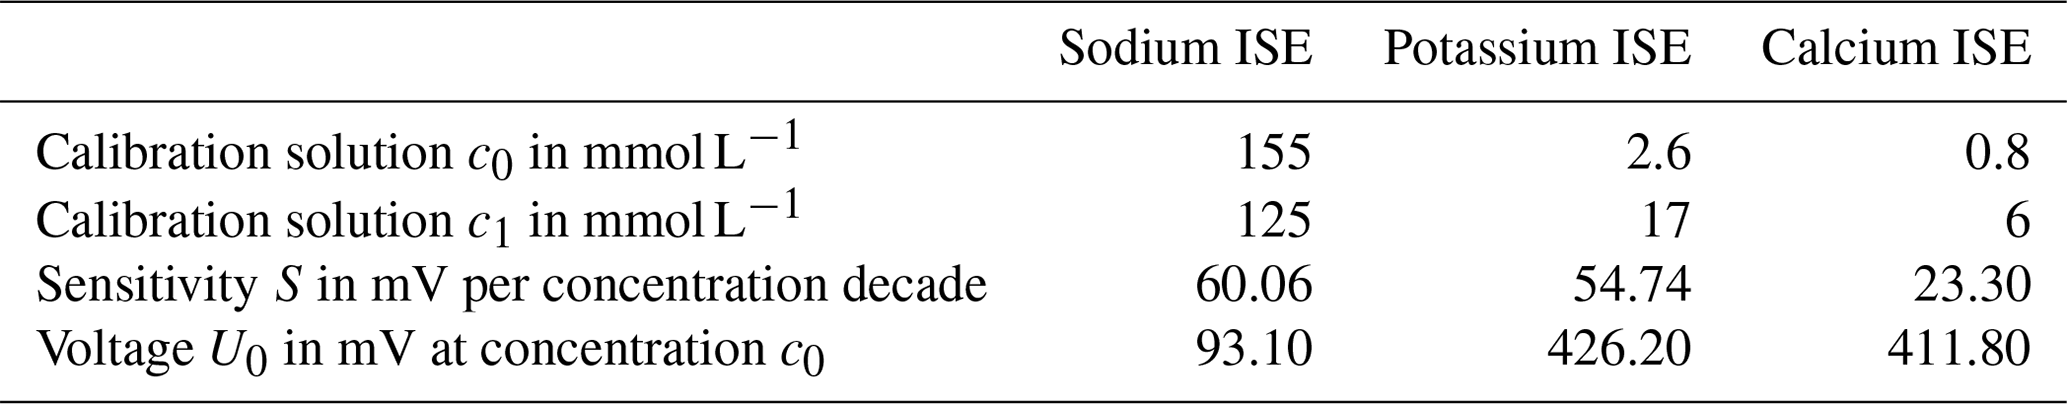
Using the parameters in Table 1 and the voltage UISE recorded between the ISEs versus the reference electrode during the experiment, the concentration c can be calculated, according to Eq. (3), as follows:
Figure 5 shows the results for the sodium concentration over a period of 7 h. The circles depict the blood samples analyzed by the blood gas analyzer as a reference. The solid curve is the output signal of the calibrated ISEs. It can be seen that the measured sensor signal and the reference signal correlate very well, and there are just small deviations at about 3 and 6 h. This is due to the dynamic behavior of the measurement concept, as shown in Berger et al. (2018). However, the blood concentration was changed very fast for test purposes, which is much higher than physiological rates.
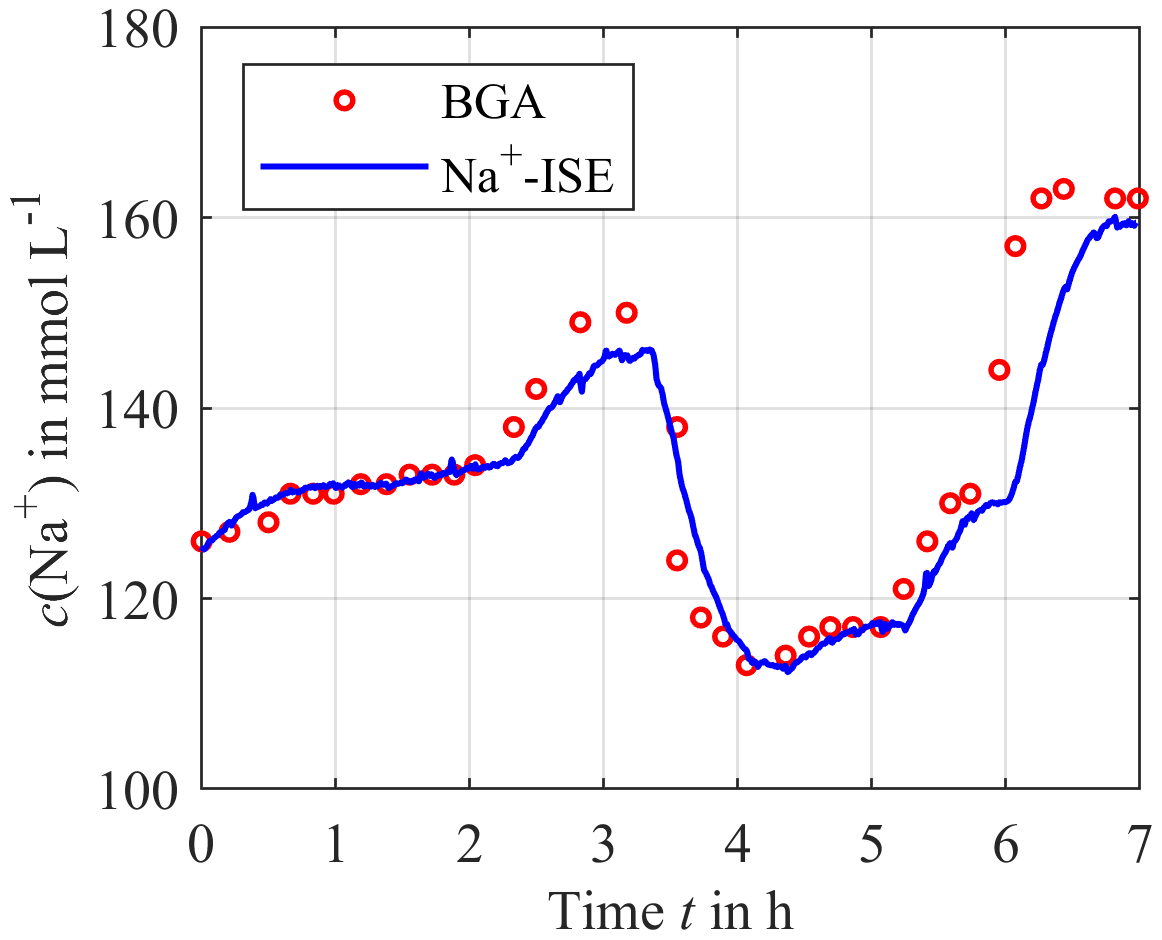
Figure 5Continuously measured sodium concentration using the calibrated ISEs (solid blue line) compared to the blood gas analyzer (BGA) as a reference (red circles).
For the potassium concentration, depicted in Fig. 6, there is a deviation between the sensor and the reference at the beginning of the measurement since the calibration solution is still in the sensor compartment when the system is integrated into the extracorporeal circuit, and in this case it has a different initial electrolyte concentration compared to blood. Thus, a certain time is required until the concentration equilibration between the blood and the sensor compartment is reached. After this initial mismatch, the sensor signal and the reference signal agree in good approximation for most of the time after the initial mismatch.
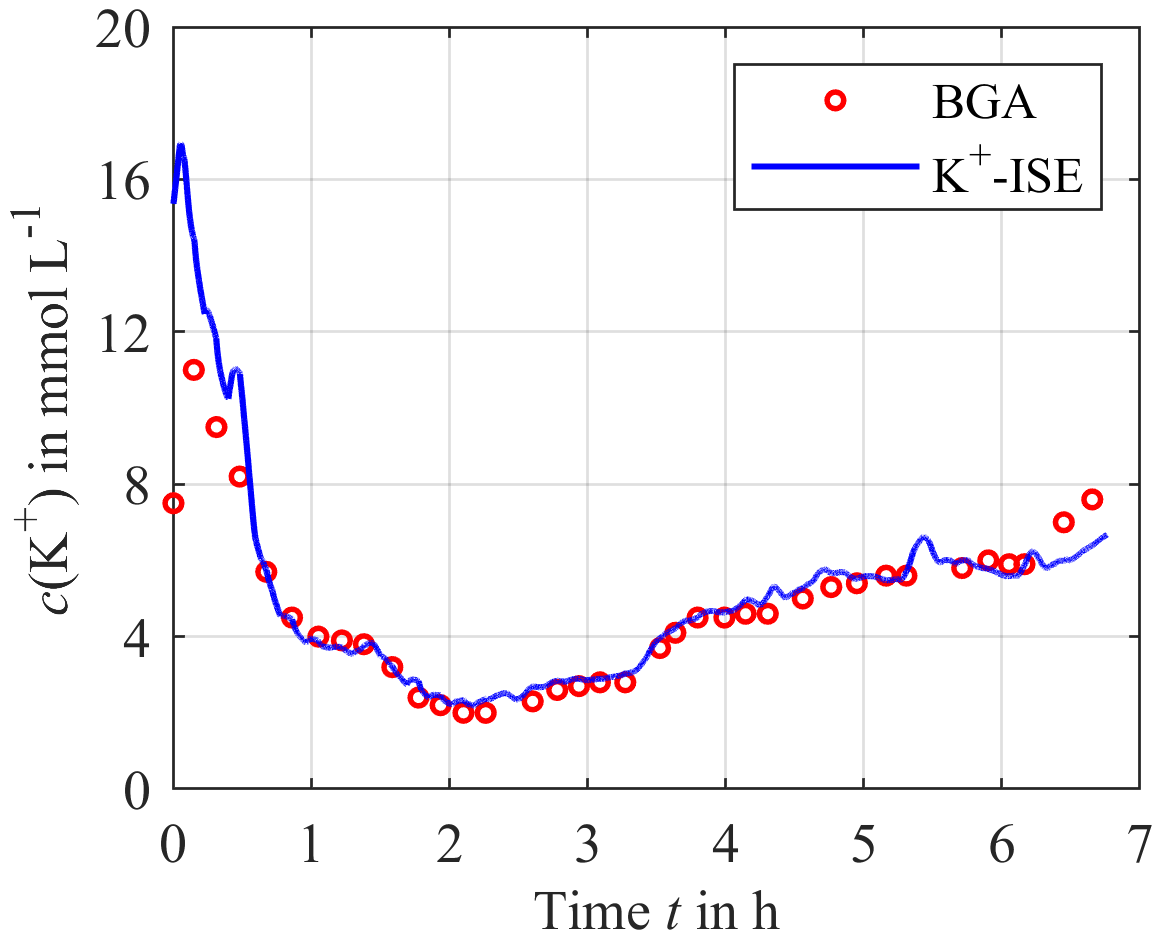
Figure 6Continuously measured potassium concentration using the calibrated ISEs (solid blue line) compared to the blood gas analyzer as a reference (red circles).
As shown in Fig. 7, the reference and the measurement signal agree well, with the exception of the time between hour 5 and 6 where a small deviation of about 0.25 mmol L−1 can be observed. This also applies for the very low concentration after 6 h, which is particularly interesting for citrate anticoagulation. The reason for the mismatch from hour 5 to 6 is unknown.
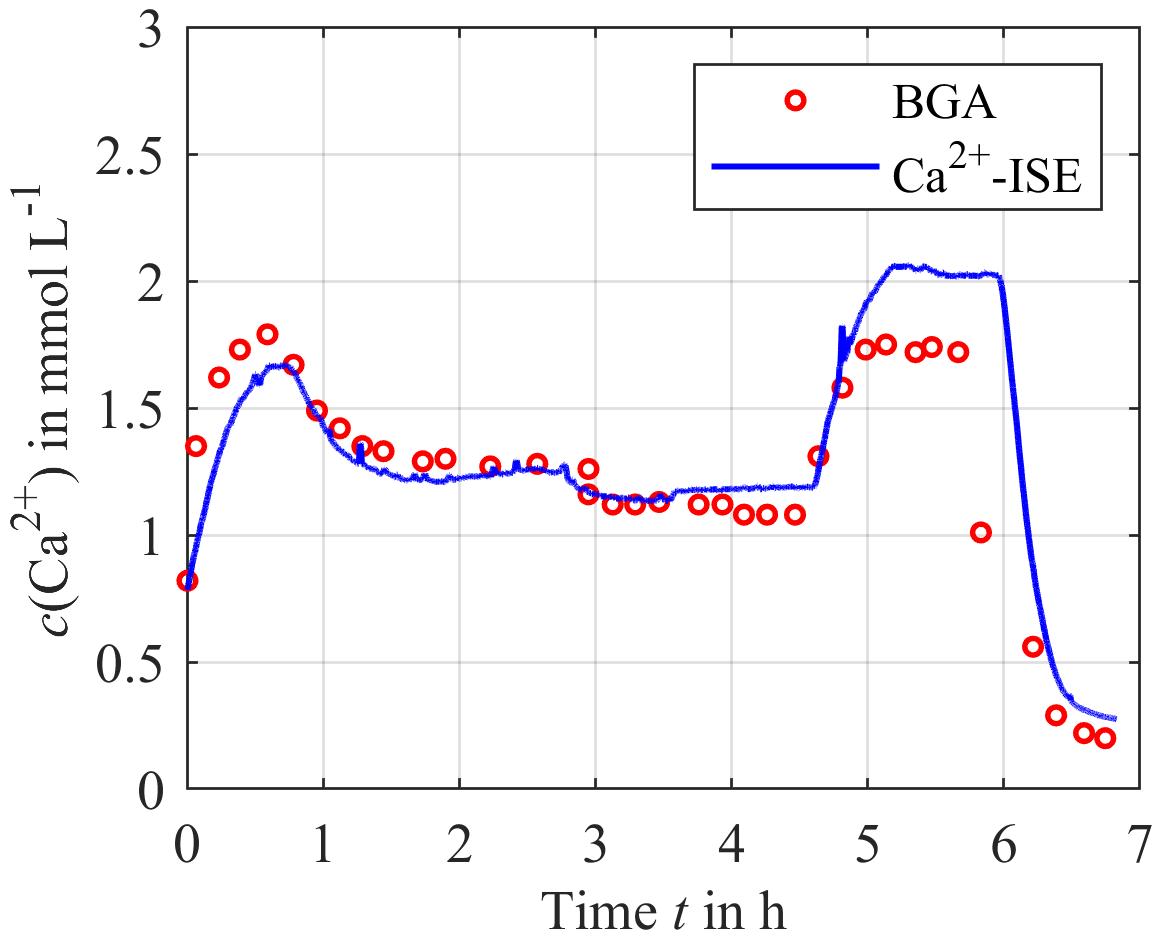
Figure 7Continuously measured calcium concentration using the calibrated ISEs (solid blue line) compared to the blood gas analyzer as a reference (red circles).
All the results show that the electrolyte concentrations can be measured in good agreement with the reference system. No relevant sensor drift or cross-sensitivity was observed during the experiment, as was expected, for the given cross-sensitivity coefficients for the calcium ISE to sodium of (mol L and to potassium of (mol L, potassium ISE to sodium of and to calcium (mol L, and sodium ISE to potassium of and to calcium of (mol L.
4.2 Results – urea monitoring
The first experiments concentrated on the time delay between the sensor signal and the urea concentration caused by the additional diffusion length and membrane used for enzyme immobilization. Figure 8 shows a significant time delay of about 20–30 min. Furthermore, a drift in the sensor signal can be observed. One possible reason could be the loss of the enzyme urease from the enzyme compartment due to a damaged membrane. At least the urea concentration trend is visible, but future work needs to concentrate on improving the urea sensor construction to reduce this time delay and allow for a calibration just before the usage and quantitative measurements.
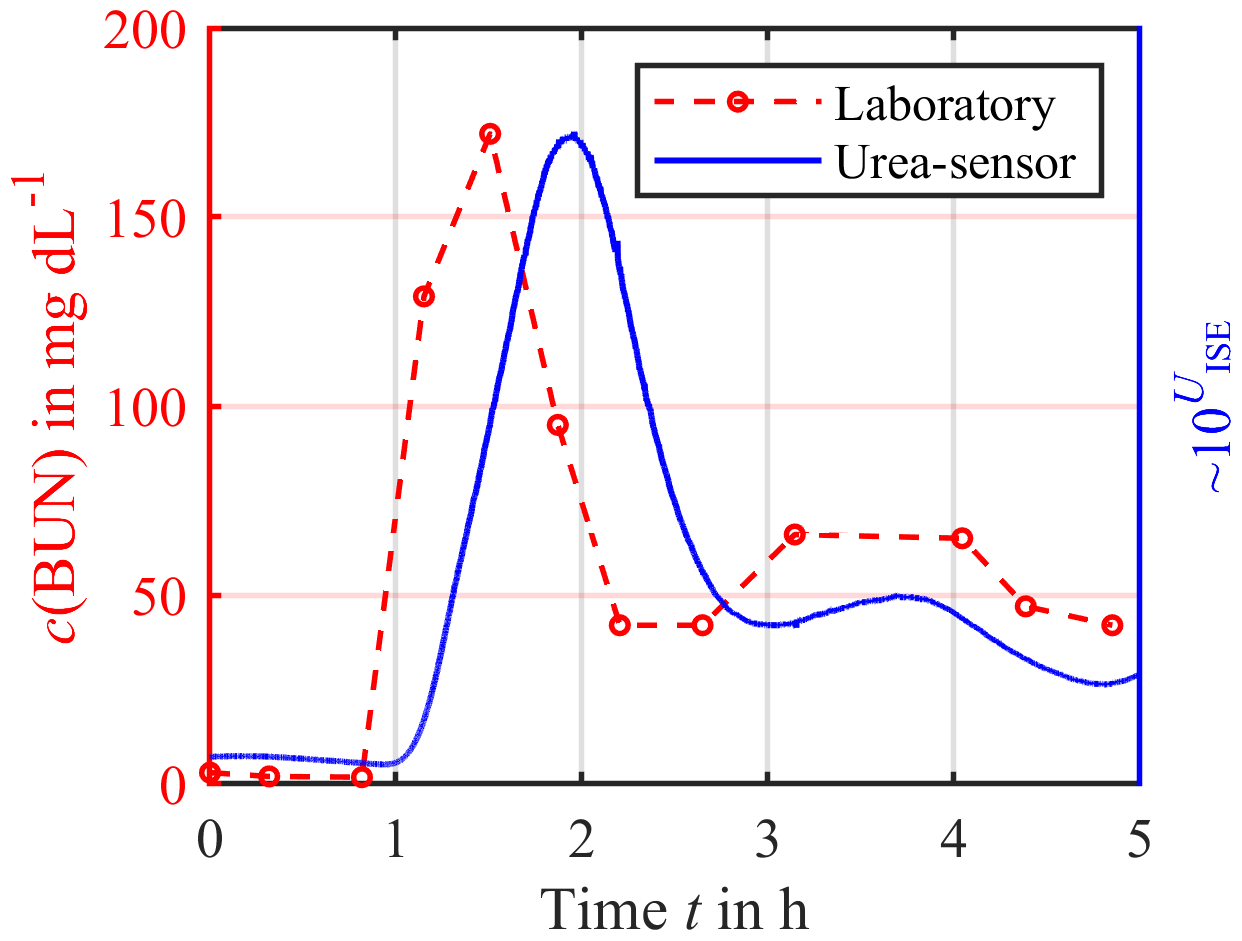
Figure 8Continuously measured urea concentration using the ammonium ISE (solid blue line) compared to the laboratory analysis (red circles).
As shown by the preclinical investigations above, the concept of electrochemical sensors is suited for continuous monitoring of electrolyte concentrations in extracorporeal circuits. However, using standard ion-selective electrodes makes the measuring chamber difficult to handle and cost intensive as the electrodes are quite large and expensive. Therefore, we tried to replace the ISEs with ISFETs. However, we will just show the preliminary data and present this section as an outlook on miniaturization, with a focus on newly developed electronics for driving several ISFETs with one reference electrode.
An ISFET has the same basic structure as a common metal oxide semiconductor field-effect transistor (MOSFET) with a source pin S and a drain pin D, but the metal gate is replaced by an ion-selective membrane used for measuring the ion concentration in a liquid solution (Bergveld, 2003a, b). The linear mode, also known as ohmic mode, of the ISFET is characterized by the linear dependence of the drain current ID on the gate-source voltage UGS and can be described according to Eq. (4) as follows (Cruz et al., 2018):
Here β is a geometric constant that depends on the ISFET manufacturing process. UGS can be considered to be the voltage between the reference electrode and the source potential of the ISFET, and UDS is the drain-source voltage across the ISFET. UTH is the threshold voltage at which a current ID begins to flow through the transistor. The linear mode is valid as long as the condition UDS < (UGS−UTH) is true.
As mentioned earlier, potentiometric measurements can be used to determine the concentration c if the concentration range of the target ion being investigated is limited and, thus, the ionic strength does not vary significantly (Cammann, 1979; Osswald and Wuhrmann, 1981; Cammann and Galster, 1996). This can be assumed to be valid for blood as a test medium. Incidentally, this is the reason why a commercially available blood gas analyzer works in a limited concentration range and the concentrations can be determined potentiometrically. Therefore, in the following equations the activity a is replaced by the concentration c, even if this is not fully correct but still permissible.
If the concentration c changes inside the test solution, the target molecules interacting with the ion-selective membrane of the gate connection change in the threshold voltage UTH according to Eq. (5) as follows (Cruz et al., 2018):
Here, R is the gas constant, F is the Faraday constant, z is the charge number and T is the absolute temperature. The result is a change in the drain current, according to Eq. (4), which is often used as a measure of the ion concentration. Below, we show a simple low-cost electronic circuit which controls both the drain current and the drain-source voltage at a constant value.
There are numerous concepts for the readout circuits of ISFETs. However, some of these circuits have a disadvantage in that multiple ISFETs cannot have a common reference electrode, thus making a miniaturization impossible (Cruz et al., 2018; Chung et al., 2004, 2006). Others have a disadvantage in that they are difficult to realize with inexpensive discrete components (Premanode et al., 2006; Cruz et al., 2018; Premanode et al., 2007), the operation point is difficult to adjust (Cruz et al., 2018; Morgenshtein et al., 2004) or they are subject to greater temperature or humidity effects (Chung et al., 2006; Cruz et al., 2018; Premanode et al., 2006). Our approach controls the drain-source voltage and the drain current at a constant value. This keeps the input power for the readout constant, leading to a concentration-independent temperature and therefore a constant temperature of the ISFETs. Since the temperature of the blood in the extracorporeal circuit corresponds to the body temperature, temperature effects are thus limited to a minimum. In addition, the chosen circuit allows the simultaneous readout of multiple ISFETs sharing a common reference electrode, enabling real miniaturization and further cost reduction. Figure 9 shows the schematic of the readout circuit for one ISFET. As an operational amplifier (OP), we use the low-cost TL072 (Texas Instruments).
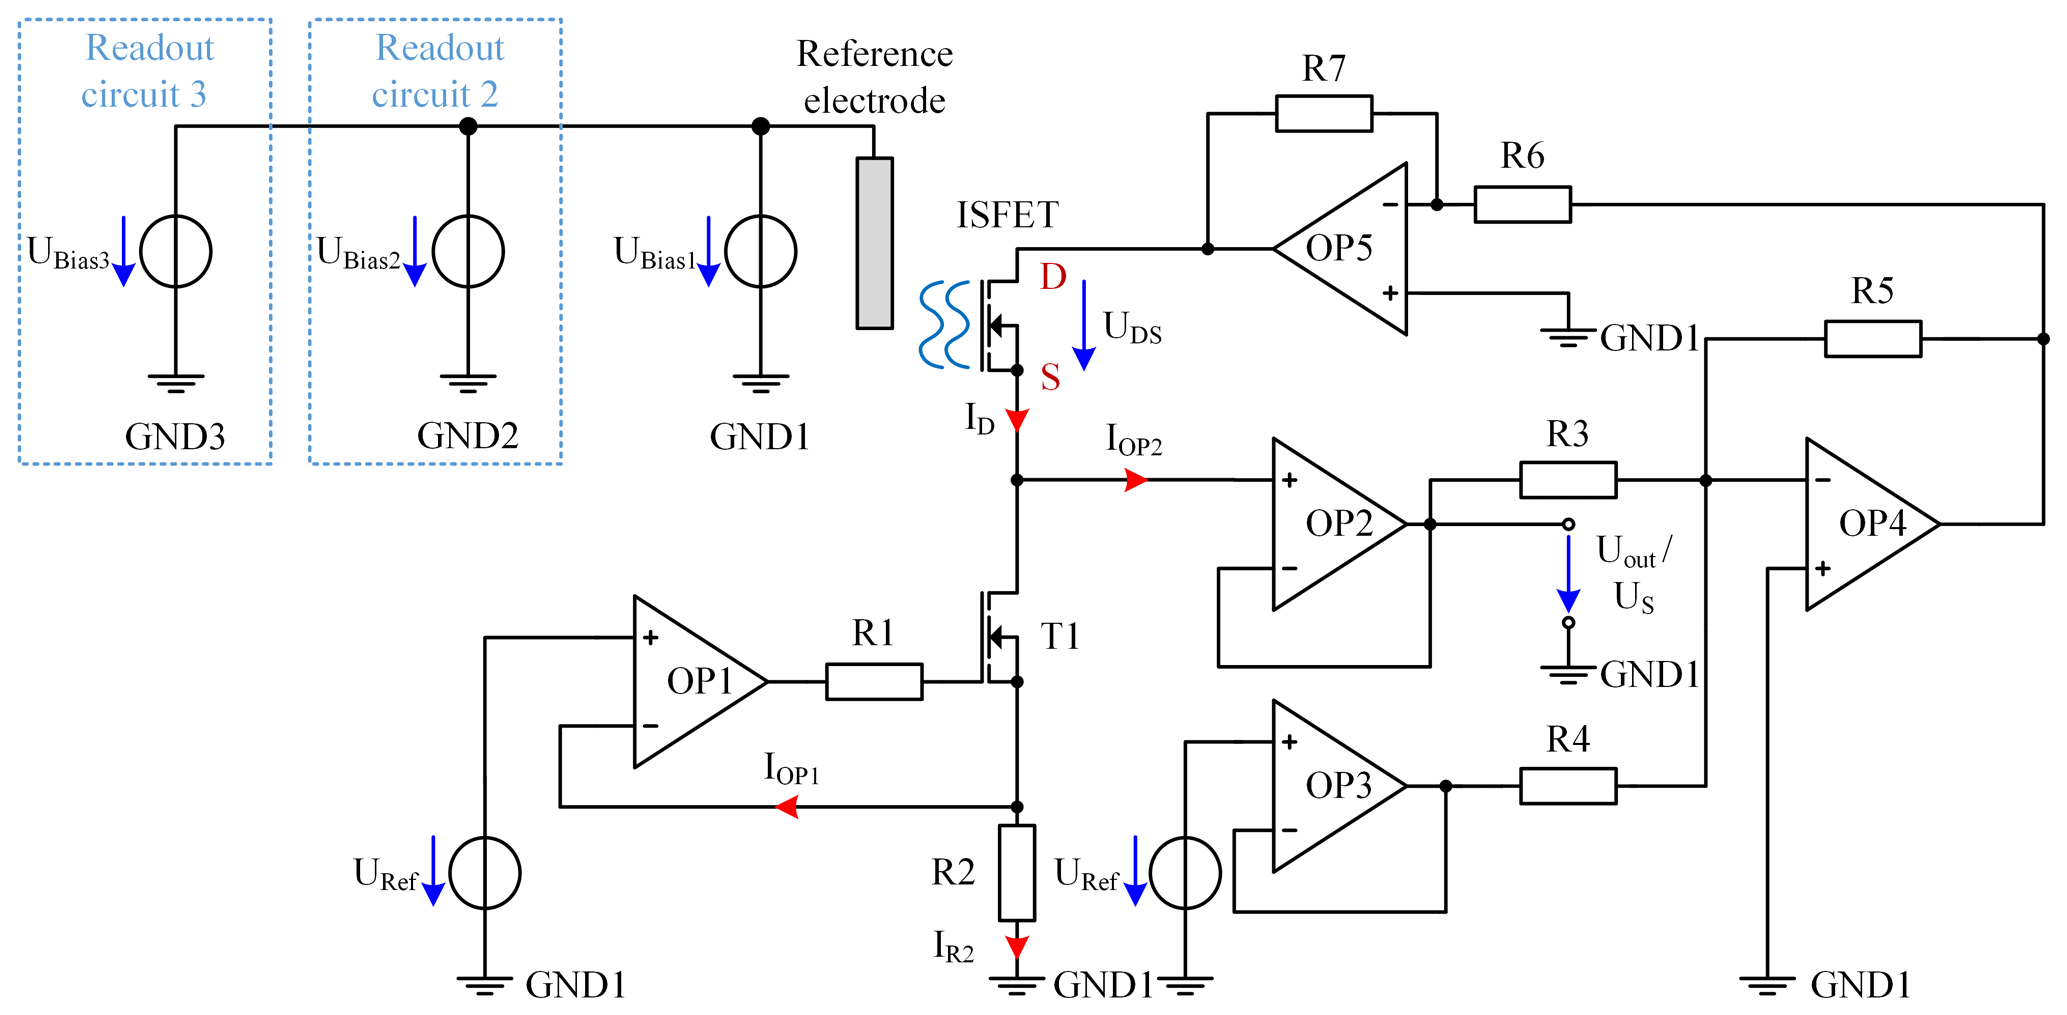
Figure 9Schematic of the ISFET readout circuit for one ISFET with TL072 OPs. In addition, the bias voltages UBias2 and UBias3 are shown for the additional two independent readout circuits.
The current control of ID is realized by the operational amplifiers, namely OP1 and OP2, the MOSFET T1 (IRLML2502; Infineon Technologies AG), the resistor R2, and the reference voltage source URef. For this purpose, URef has a constant voltage of 3 V provided by the ADR443 (Analog Devices, Inc.) and is connected to the noninverting input of OP1. To obtain the current ID of 100 µA, R2 has a resistance of 30 kΩ. If the current IR2 is 100 µA, a voltage drop of 3 V across R2 is caused, which is fed back to the inverting input of OP1. The output of OP1 controls T1 to keep the current of IR2 constant. A smaller current IR2, for example, would result in a smaller voltage drop over R2. Consequently, the voltage at the noninverting input of OP1 would be higher compared to the inverting input, leading to an increased output voltage of OP1, thus further driving the MOSFET T1, and resulting in an increased current IR2. In contrast, a higher current would be decreased by reducing the output voltage of OP1. As the input of OP1 and OP2 draws a maximum current of 7 nA over the full temperature range of 0 to 70 ∘C (Texas Instruments, 1978), the current ID through the ISFET, which is the sum of IR2, IOP1 and IOP2, is a good approximation for the controlled current IR2. Resistor R1 limits the output current of OP1 required for charging the gate capacity of T1. To obtain a constant voltage drop of UDS=0.5 V from drain D to source S across the ISFET, a voltage of 0.5 V is added to the source voltage US by the summing amplifier, consisting of resistor R3, R4 and R5 as well as OP4. The value for R3 and R5 is 10 kΩ and R4 is 60 kΩ. The output voltage of OP4 can be calculated as follows:
This voltage is amplified by the inverting amplifier, consisting of OP5 and the resistors R6 and R7 by a factor of −1, resulting in a drain potential of V. The operational amplifiers are supplied with V and V. The ground reference potential is not directly connected to the potential of the reference electrode but is biased by the voltage source UBias1 to ensure that the ISFET begins to conduct even at low concentrations and always has a voltage drop of 3 V across R2, indicating a drain current ID of 100 µA.
By changing the concentration of the target electrolyte in the liquid, the threshold voltage of the ISFET changes, leading to a change in ID. However, by controlling ID to 100 µA, the source potential US of the ISFET has to be adjusted. Thus, the source potential US depends on the ion concentration in the liquid and can therefore be used as the output signal UOut according to Nernst law. To not affect the current ID with a voltage measurement, it is determined after the buffer amplifier consisting of OP2.
In order to enable a simultaneous readout of all ISFETs for sodium, potassium and calcium with one common reference electrode, the described circuit is built up three times, which is indicated in Fig. 9 by the blue boxes. As the different ISFETs have different threshold voltages, different gate-source voltages UGS are required for each ISFET to meet the conditions for the linear mode. Since UGS depends on the potential of the reference electrode, it is necessary to set the potential of this electrode independently for each circuit. Therefore, the ground potentials (GND1 to GND3) of the three readout circuits are isolated from each other. As illustrated in Fig. 9, three voltage sources, UBias1 to UBias3, are connected in parallel to each other and to the reference electrode in order to shift the respective isolated ground potential (GND1 to GND3) of the individual readout circuits. Due to UBias1 to UBais3 and the insulated circuit design, these voltages can be adjusted independently, even if one common reference electrode is shared, enabling a compact design.
5.1 Preliminary results – ISFETs
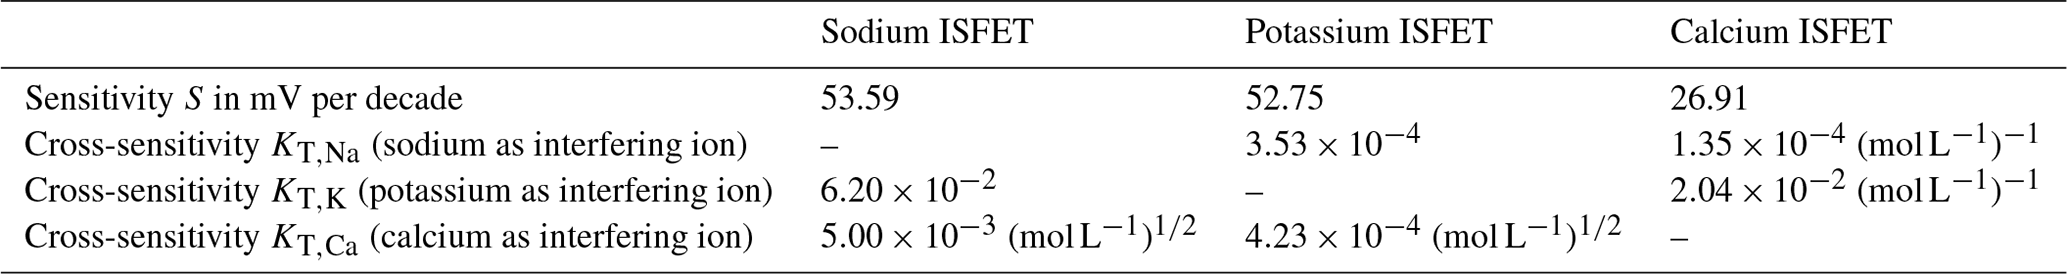
In a preliminary investigation we tested the ISFETs purchased from D+T Microelectrónica, A.I.E. In particular, the sensitivity S and the cross-sensitivities of the sensors were analyzed. Here, the cross-sensitivities of the potassium ISFET to sodium (KK,Na) and of the calcium ISFET to sodium (KCa,Na) are relevant, since sodium has the highest absolute concentration and, more importantly, the highest fluctuation in blood serum. However, large cross-sensitivity coefficients can also lead to high absolute errors – even for small concentration variations.
First, the sensitivity of each sensor was determined. Therefore, we increased the concentration of the target ion for the corresponding sensor in a sample solution at room temperature, while the concentration of interfering ions was kept constant. For the sodium sensor the sample solution contained 1 mmol L−1 calcium chloride (CaCl2) and 4 mmol L−1 potassium chloride (KCl) in deionized water. The sample solution for the potassium sensor included a constant concentration of 140 mmol L−1 sodium chloride (NaCl) and 1 mmol L−1 CaCl2 in deionized water. Accordingly, the sample solution for the calcium sensor contained 140 mmol L−1 NaCl and 4 mmol L−1 KCl in deionized water. If the output voltage UOut is plotted against the common logarithm of the concentration of the target ion, the slope of the linear fit in the range of higher concentrations represents the sensitivity S in that concentration range. The sensitivity SNa for sodium is 53.59 mV per decade (Fig. 10a) and the sensitivity SK for potassium is 52.75 mV per decade (Fig. 10b), with both slightly below the theoretical maximum for monovalent ions of about 59.50 mV per decade at room temperature according to the Nernst law. The calcium ISFET (Fig. 10c) has a sensitivity of SCa=26.91 mV per decade, which is also slightly below the theoretical maximum for divalent ions of 29.75 mV per decade.
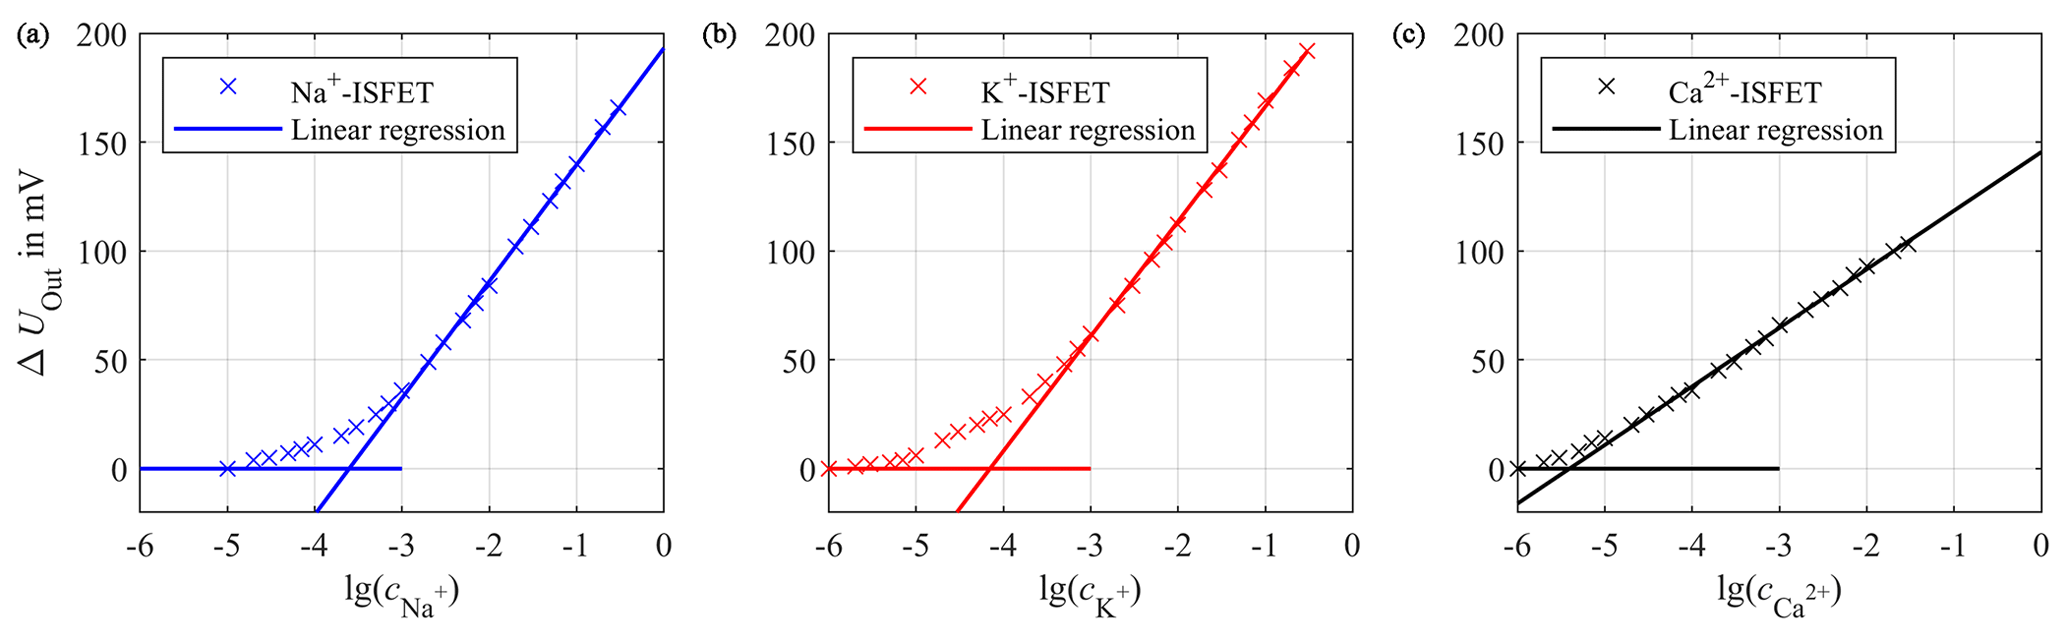
Figure 10Calibration curve of the sodium ISFET (a), potassium ISFET (b) and calcium ISFET (c) with linear regressions for high concentrations to calculate the sensitivities. The concentration c is given in mol L−1.
The cross-sensitivity of ion-selective sensors is described by the Nikolsky equation, according to Eq. (7), as follows:
Here, U0 is the output voltage at concentration cT of 1 mol L−1 of the target ion with the charge number zT. cI is the concentration of one interfering ion with the charge number zI. KT,I is the cross-sensitivity coefficient for the target ion to the interfering ion I. It indicates by how many times the interfering ion is suppressed in the sensor output compared to the target ion.
According to the International Union of Pure and Applied Chemistry's (IUPAC) recommendations, the cross-sensitivity can be determined in a similar way to the sensitivity, with the difference being that a constant concentration of one single interfering ion is present in the sample solution. Since the cross-sensitivity is a function of the concentration cI of the interfering ion, it is advisable to choose cI close to the expected concentration in the later application. Subsequently, a calibration curve is recorded for the target ion. For very small concentrations cT of the target ion it can be assumed that Uout is mainly determined by the interfering ion, and thus Uout is a constant. For higher concentrations of cT the target ion determines the output voltage Uout, which can be approximated with the linear fit of the slope S. At the point of intersection for both extrapolated lines (comparable with Fig. 10), the two simplified output voltages can be equalized, resulting in the following:
where cintersection is the concentration at the point of intersection for both extrapolated lines. This yields Eq. (9) for the cross-sensitivity coefficient KS,I as follows:
KT,I was determined in this manner for the ISFETs for sodium, potassium and calcium. The cross-sensitivity coefficients are KCa,Na and KK,Na for the calcium sensor and the potassium sensor affected by sodium, which were determined to be (mol L and . Assuming a maximum physiological change in the sodium concentration of 40 mmol L−1, this would result in an error of only 14.12 µmol L−1 for potassium and 0.22 µmol L−1 for calcium according to Eq. (7). Table 2 summarizes all measured ISFETs parameters. As can be seen in Table 2, the cross-sensitivity coefficient of the sodium ISFET to potassium is the highest with , leading to an error of 0.25 mmol L−1 for a maximum possible potassium concentration change of 4 mmol L−1.
Table 2Characterized parameters of sodium, potassium and calcium ISFETs.
One major issue of ISFETs is their limited long-term stability, a fact that still prevents their commercial use until today (van der Schoot et al., 1983; Jamasb et al., 1998; Jamasb, 2004; Chou and Hsiao, 2000). The ISFETs used here also show such a drift. In particular, at the beginning of a measurement the drift can be very high. To illustrate this, we have placed the ISFETs for the three electrolytes in a physiological solution consisting of 140 mmol L−1 NaCl, 4 mmol L−1 KCl and 1 mmol L−1 CaCl2 in deionized water over a period of more than 4 h and recorded the output voltage UOut. The results are depicted in Fig. 11.
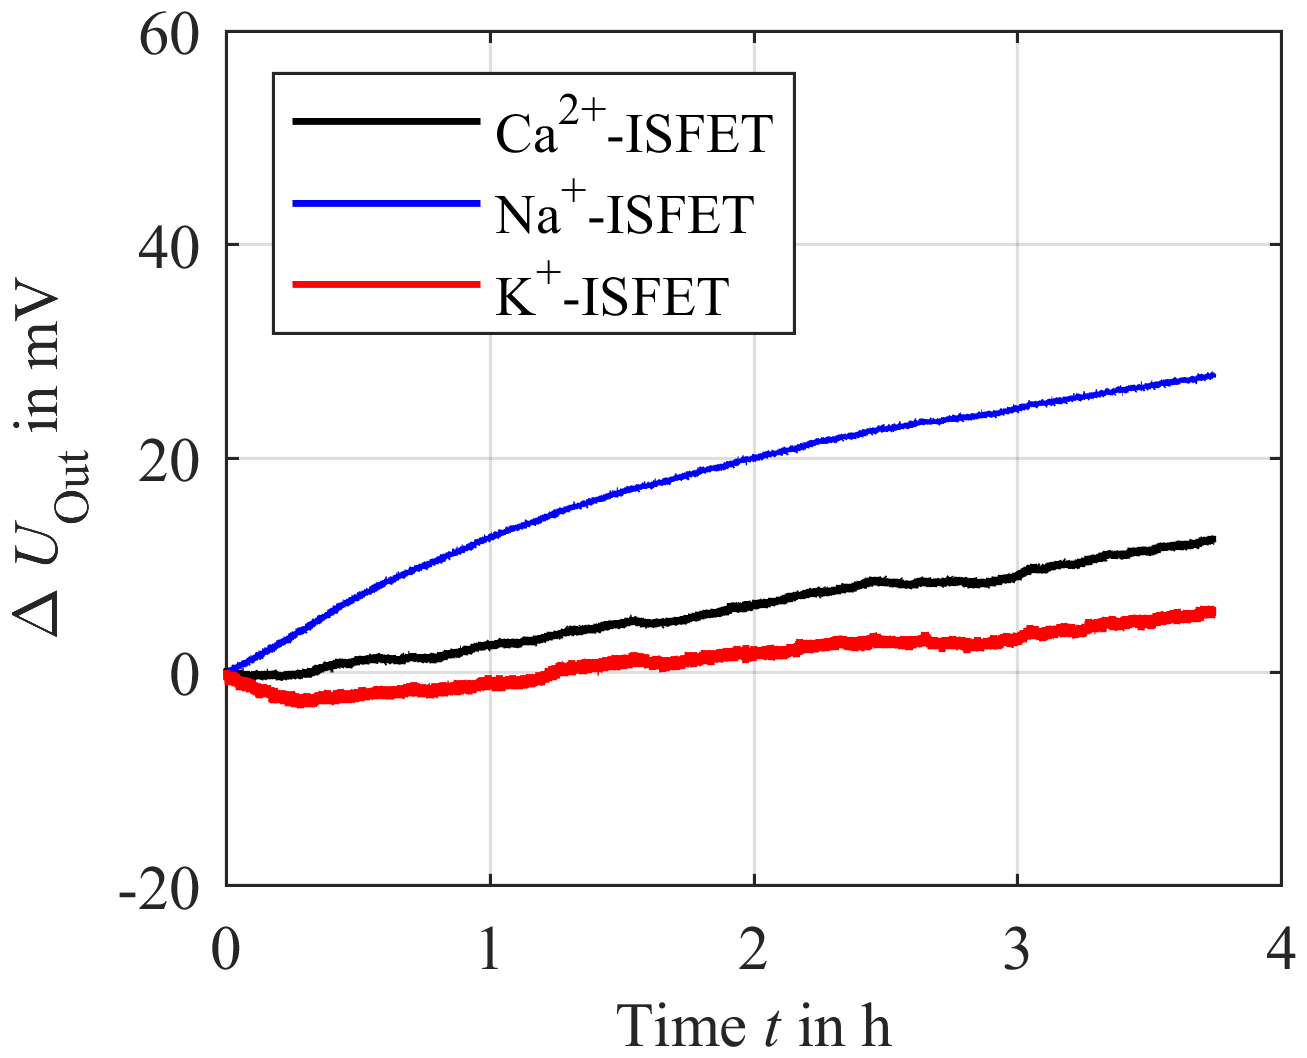
Figure 11Long-term stability measurement of the sodium ISFET (blue), potassium ISFET (red) and calcium ISFET (black) in deionized water with constant concentration of 140 mmol L−1 of sodium chloride, 4 mmol L−1 of potassium chloride and 1 mmol L−1 of calcium chloride over a period of about 4 h.
Figure 11 illustrates that the output voltage of the ISFETs is subject to a temporal drift in which the potassium ISFET significantly drifts at the beginning of the measurement. However, in the proposed in-line measuring concept, the ISFETs could be easily and periodically recalibrated to compensate for such a drift. This approach will be investigated in future work, including a preclinical investigation with human packed red blood cells as a test medium.
In this work, we have investigated a new concept for the continuous in-line monitoring of electrolyte and urea concentrations under realistic conditions in a preclinical study using human packed red blood cells as a test medium in an extracorporeal circuit. It is shown that the measured sodium, potassium and calcium concentrations agree very well with the blood gas analyzer values used as a reference system. No relevant sensor drift or cross-sensitivities were observed over a test duration of 7 h. The urea sensor, consisting of an ammonium ISE and the enzyme urease, immobilized with an additional dialysis membrane attached to the ammonium ISE, showed a significant time delay in the sensor signal due to the additional membrane and the increased diffusion length. Furthermore, a sensor drift could be observed, which was probably caused by a damaged membrane used for enzyme immobilization.
As we move towards miniaturization, we have tried ion-sensitive field-effect transistors (ISFETs) purchased from D+T Microelectrónica, A.I.E. instead of using large and expensive standard ISEs. Therefore, low-cost electronics were developed, enabling all ISFETs to be read out together, sharing a common reference electrode. In addition, the ISFETs were characterized regarding their sensitivity, cross-sensitivity and temporal drift. As expected, the sensitivity is close to the Nernst sensitivity. With respect to cross-sensitivities, the interferences between the calcium ISFET and potassium ISFET in relation to sodium described by KCa,Na and KK,Na are particularly important, since the fluctuation of sodium is the most significant. However, even a change in the sodium concentration of 40 mmol L−1 just causes an error of 0.22 µmol L−1 for calcium and 14.12 µmol L−1 for potassium due to the small cross-sensitivity coefficients. A crucial disadvantage of ISFETs is the temporal drift. The sensors used in this study are also subject to such a drift. However, the measurement concept presented in this work allows for a cyclical recalibration of the ISFETs. The concept of cyclical recalibration needs to be further investigated in future work. In summary, the presented measuring concept using ISEs is suitable for the continuous monitoring of sodium, potassium and calcium. For urea, a significant time delay caused by the urea sensor concept is present, leaving much room for improvement. In principle, the ISFETs can be used for miniaturization. However, to assess the ISFETs under practical conditions another preclinical investigation with a miniaturized setup is necessary in future work.
To conclude, the presented in-line measuring system could be a considerable advancement compared to the current gold standard of a few spot measurements with a time-delayed response due to laboratory analysis. Furthermore, personnel effort would be significantly reduced. In general, the continuous measurement of blood parameters is an important step towards individualized dialysis, leading to a significant improvement in the patient's treatment.
All underlying research data are given in this paper. There is no supplementary or additional underlying material.
MB designed the measuring chamber concept, the urea sensor concept, the ISFET readout circuit and is the author of the paper. MS and MB performed the ISFET experiments and the corresponding data analysis. FS, HR and MB carried out the preclinical investigation and data analysis. TP supervised the medical aspect. HM and DB contributed to the measuring chamber and the construction of the urea sensor. SZ supervised the research project, and gave scientific and conceptual advice. All authors contributed to the discussions and the paper.
The authors declare that they have no conflict of interest.
This article is part of the special issue “Dresden Sensor Symposium DSS 2019”. It is a result of the “14. Dresdner Sensor-Symposium”, Dresden, Germany, 2–4 December 2019.
This research has been supported by the German Federal Ministry of Education and Research (BMBF; grant no: 13GW0085B).
This research has been supported by the Bundesministerium für Bildung und Forschung (BMBF; grant no. 13GW0085B).
The publication of this article was funded by the open-access fund of Leibniz Universität Hannover.
This paper was edited by Udo Weimar and reviewed by two anonymous referees.
Bagshaw, S. M., George, C., and Bellomo, R.: Early acute kidney injury and sepsis: A multicentre evaluation, Critical care (London, England), 12, R47, https://doi.org/10.1186/cc6863, 2008.
Baue, A. E., Faist, E., and Fry, D. E.: Multiple Organ Failure: Pathophysiology, Prevention, and Therapy, N, Springer New York, New York, 1, 2000.
Bellomo, R., Kellum, J. A., and Ronco, C.: Acute kidney injury, The Lancet, 380, 756–766, https://doi.org/10.1016/S0140-6736(11)61454-2, 2012.
Bénéteau-Burnat, B., Pernet, P., Pilon, A., Latour, D., Goujon, S., Feuillu, A., and Vaubourdolle, M.: Evaluation of the GEM Premier 4000: a compact blood gas CO-Oximeter and electrolyte analyzer for point-of-care and laboratory testing, Clin. Chem. Lab. Med., 46, 271–279, https://doi.org/10.1515/CCLM.2008.043, 2008.
Berger, M. and Zimmermann, S. (Eds.): P1.03 – In-line-Monitoring der Elektrolyt- und Harnstoffkonzentration in extrakorporalen Kreisläufen zur Individualisierung der Nierenersatztherapie, 13. Dresdner Sensor-Symposium, https://doi.org/10.5162/13dss2017, Dresden, Germany, 2017.
Berger, M., Faulstich, M., Perl, T., and Zimmermann, S.: Continuous in-line monitoring of electrolyte concentrations in extracorporeal circuits for individualization of dialysis treatment, J. Sens. Sens. Syst., 7, 559–567, https://doi.org/10.5194/jsss-7-559-2018, 2018.
Berger, M., Sellering, F., Röhrich, H., Perl, T., Mansour, H., Baasner, D., and Zimmermann, S. (Eds.): P1.03 – Continuous In-Line Monitoring of Electrolyte and Urea Concentrations in Extracorporeal Circuits, 14. Dresdner Sensor-Symposium, Dresden, Germany, https://doi.org/10.5162/14dss2019/P1.03, 2019a.
Berger, M., Sellering, F., Rohrich, H., Mansour, H., Perl, T., and Zimmermann, S.: A Differential Transformer for Noninvasive Continuous Sodium Monitoring During Dialysis Treatment, in: IEEE SENSORS 2019: 2019 conference proceedings Palais des Congrès de Montréal, 27–30 October 2019, Montreal, Canada, 2019 IEEE SENSORS, Montreal, QC, Canada, IEEE, Piscataway, NJ, 1–4, 2019b.
Berger, M., Zygmanowski, A., Sellering, F., Röhrich, H., Perl, T., Mansour, H., and Zimmermann, S.: Contactless and continuous sodium concentration monitoring during continuous renal replacement therapy, Electron. Lett., 320, 128372, https://doi.org/10.1016/j.snb.2020.128372, 2020.
Bergveld, P.: ISFET, Theory and Practice: IEEE SENSORS 2003, Toronto, Canada, available at: http://tmec.nectec.or.th/public/uploaded/products/isfet/ISFET2016/ISFET-Bergveld.pdf (last access: 17 March 2020), 2003a.
Bergveld, P.: Thirty years of ISFETOLOGY, Sensor. Actuat. B-Chem., 88, 1–20, https://doi.org/10.1016/S0925-4005(02)00301-5, 2003b.
Buemi, M., Aloisi, E., Coppolino, G., Loddo, S., Crascì, E., Aloisi, C., Barillà, A., Cosentini, V., Nostro, L., Caccamo, C., Floccari, F., Romeo, A., Frisina, N., and Teti, D.: The effect of two different protocols of potassium haemodiafiltration on QT dispersion, Nephrology, dialysis, transplantation official publication of the European Dialysis and Transplant Association – European Renal Association, 20, 1148–1154, https://doi.org/10.1093/ndt/gfh770, 2005.
Cammann, K.: Working with Ion-Selective Electrodes: Chemical Laboratory Practice, Chemical Laboratory Practice, Springer, Berlin, Heidelberg, 22665 pp., 1979.
Cammann, K. and Galster, H.: Das Arbeiten mit ionenselektiven Elektroden: Eine Einführung für Praktiker, Dritte Auflage, Springer Berlin Heidelberg, Berlin, Heidelberg, 296104 pp., 1996.
Chou, J.-C. and Hsiao, C.-N.: Drift behavior of ISFETs with a-Si:H-SiO2 gate insulator, Mater. Chem. Phys., 63, 270–273, https://doi.org/10.1016/S0254-0584(99)00188-1, 2000.
Chung, W.-Y., Yang, C.-H., Wang, Y.-F., Chan, Y.-J., Torbicz, W., and Pijanowska, D. G.: A signal processing ASIC for ISFET-based chemical sensors, Microelectr. J., 35, 667–675, https://doi.org/10.1016/j.mejo.2004.04.003, 2004.
Chung, W.-Y., Lin, Y.-T., Pijanowska, D. G., Yang, C.-H., Wang, M.-C., Krzyskow, A., and Torbicz, W.: New ISFET interface circuit design with temperature compensation, Microelectr. J., 37, 1105–1114, https://doi.org/10.1016/j.mejo.2006.05.001, 2006.
Cruz, F. R. G., Montealegre, E. S. R. P., Aranel, J. C. M., Jason Hao Paredes, D., Ramirez, G. R. P., and Chung, W.: ISFET Bridge Type Readout Circuit with Programmable Voltage and Current, TENCON 2018 – 2018 IEEE Region 10 Conference, Jeju, Korea (South), 2362–2365, https://doi.org/10.1109/TENCON.2018.8650085, 2018.
Davenport, A. and Tolwani, A.: Citrate anticoagulation for continuous renal replacement therapy (CRRT) in patients with acute kidney injury admitted to the intensive care unit, NDT Plus, 2, 439–447, https://doi.org/10.1093/ndtplus/sfp136, 2009.
Hu, G., Pojman, J. A., Scott, S. K., Wrobel, M. M., and Taylor, A. F.: Base-catalyzed feedback in the urea-urease reaction, J. Phys. Chem. B, 114, 14059–14063, https://doi.org/10.1021/jp106532d, 2010.
Jamasb, S.: An Analytical Technique for Counteracting Drift in Ion-Selective Field Effect Transistors (ISFETs), IEEE Sens. J., 4, 795–801, https://doi.org/10.1109/JSEN.2004.833148, 2004.
Jamasb, S., Collins, S., and Smith, R. L.: A physical model for drift in pH ISFETs, Sensor. Actuat. B-Chem., 49, 146–155, https://doi.org/10.1016/S0925-4005(98)00040-9, 1998.
Keshaviah, P. R., Ebben, J. P., and Emerson, P. F.: On-line monitoring of the delivery of the hemodialysis prescription, Pediatr. Nephrol., 9, S2–S8, https://doi.org/10.1007/BF00867675, 1995.
Kovesdy, C. P., Regidor, D. L., Mehrotra, R., Jing, J., McAllister, C. J., Greenland, S., Kopple, J. D., and Kalantar-Zadeh, K.: Serum and dialysate potassium concentrations and survival in hemodialysis patients, Clin. J. Am. Soc. Nephro., 2, 999–1007, https://doi.org/10.2215/CJN.04451206, 2007.
Locatelli, F., La Milia, V., Violo, L., Del Vecchio, L., and Di Filippo, S.: Optimizing haemodialysate composition, Clinical Kidney Journal, 8, 580–589, https://doi.org/10.1093/ckj/sfv057, 2015.
Morgenshtein, A., Sudakov-Boreysha, L., Dinnar, U., Jakobson, C. G., and Nemirovsky, Y.: Wheatstone-Bridge readout interface for ISFET/REFET applications, Sensor. Actuat. B-Chem., 98, 18–27, https://doi.org/10.1016/j.snb.2003.07.017, 2004.
Osswald, H. F. and Wuhrmann, H. R.: Calibration Standards for Multi Ion Analysis in Whole Blood Samples, in: Progress in Enzyme and Ion-Selective Electrodes, edited by: Lübbers, D. W., Acker, H., Buck, R. P., Eisenman, G., Kessler, M. D., and Simon, W., Berlin, Heidelberg, 1981, Springer Berlin Heidelberg, Berlin, Heidelberg, 74–78, 1981.
Owen, W. F., Lew, N. L., Liu, Y., Lowrie, E. G., and Lazarus, J. M.: The urea reduction ratio and serum albumin concentration as predictors of mortality in patients undergoing hemodialysis, New Engl. J. Med., 329, 1001–1006, https://doi.org/10.1056/NEJM199309303291404, 1993.
Palmer, B. F.: Individualizing the Dialysate in the Hemodialysis Patient, Semin. Dialysis, 14, 41–49, https://doi.org/10.1046/j.1525-139x.2001.00013.x, 2001.
Patel, P., Nandwani, V., McCarthy, P. J., Conrad, S. A., and Keith Scott, L.: Continuous renal replacement therapies: A brief primer for the neurointensivist, Neurocrit. Care, 13, 286–294, https://doi.org/10.1007/s12028-010-9386-6, 2010.
Patschan, D. and Müller, G. A.: Acute kidney injury, Journal of Injury & Violence Research, 7, 19–26, https://doi.org/10.5249/jivr.v7i1.604, 2015.
Paula, F. M. de, Peixoto, A. J., Pinto, L. V., Dorigo, D., Patricio, P. J. M., and Santos, S. F. F.: Clinical consequences of an individualized dialysate sodium prescription in hemodialysis patients, Kidney Int., 66, 1232–1238, https://doi.org/10.1111/j.1523-1755.2004.00876.x, 2004.
Premanode, B., Chan, W. P., and Toumazou, C.: Ultra-low power precision ISFET readout using global current feedback, Electron. Lett., 42, 1264, https://doi.org/10.1049/el:20061690, 2006.
Premanode, B., Silawan, N., Chan, W. P., and Toumazou, C.: A composite ISFET readout circuit employing current feedback, Sensor. Actuat. B-Chem., 127, 486–490, https://doi.org/10.1016/j.snb.2007.05.001, 2007.
Redaelli, B., Locatelli, F., Limido, D., Andrulli, S., Signorini, M. G., Sforzini, S., Bonoldi, L., Vincenti, A., Cerutti, S., and Orlandini, G.: Effect of a new model of hemodialysis potassium removal on the control of ventricular arrhythmias, Kidney Int., 50, 609–617, 1996.
Ricci, Z., Bellomo, R., and Ronco, C.: Dose of dialysis in acute renal failure, Clin. J. Am. Soc. Nephro., 1, 380–388, https://doi.org/10.2215/CJN.00520705, 2006.
Sharma, M. K., Wieringa, F. P., Frijns, A. J. H., and Kooman, J. P.: On-line monitoring of electrolytes in hemodialysis: on the road towards individualizing treatment, Expert Rev. Med. Devic., 13, 933–943, https://doi.org/10.1080/17434440.2016.1230494, 2016.
Singh, M., Verma, N., Garg, A., and Redhu, N.: Urea biosensors, Sensor. Actuat. B-Chem., 134, 345–351, https://doi.org/10.1016/j.snb.2008.04.025, 2008.
Sivalingam, M. and Farrington, K.: Haemodialysis, Medicine, 35, 461–465, https://doi.org/10.1016/j.mpmed.2007.05.005, 2007.
Stiller, S., Bonnie-Schorn, E., Grassmann, A., Uhlenbusch-Körwer, I., and Mann, H.: A Critical Review of Sodium Profiling for Hemodialysis, Semin. Dialysis, 14, 337–347, https://doi.org/10.1046/j.1525-139X.2001.00086.x, 2001.
Stragier, A., Lopot, F., Švára, F., and Polakovič, V.: Fallacies and Pitfalls of Dialysis Sodium Prescription and Control, Blood Purificat., 46, 27–33, https://doi.org/10.1159/000484921, 2018.
Texas Instruments: Data sheet: TL07xx Low-Noise JFET-Input Operational Amplifiers, available at: http://www.ti.com/lit/ds/symlink/tl074.pdf (last access: 3 March 2020), 1978.
Tumlin, J., Wali, R., Williams, W., Murray, P., Tolwani, A. J., Vinnikova, A. K., Szerlip, H. M., Ye, J., Paganini, E. P., Dworkin, L., Finkel, K. W., Kraus, M. A., and Humes, H. D.: Efficacy and safety of renal tubule cell therapy for acute renal failure, J. Am. Soc. Nephrol., 19, 1034–1040, https://doi.org/10.1681/ASN.2007080895, 2008.
Tura, A., Sbrignadello, S., Mambelli, E., Ravazzani, P., Santoro, A., and Pacini, G.: Sodium concentration measurement during hemodialysis through ion-exchange resin and conductivity measure approach: In vitro experiments, PloS One, 8, e69227, https://doi.org/10.1371/journal.pone.0069227, 2013.
van der Schoot, B. H., Bergveld, P., Bos, M., and Bousse, L. J.: The isfet in analytical chemistry, Sensor. Actuat., 4, 267–272, https://doi.org/10.1016/0250-6874(83)85032-X, 1983.
Zarjou, A. and Agarwal, A.: Sepsis and acute kidney injury, J. Am. Soc. Nephrol., 22, 999–1006, https://doi.org/10.1681/ASN.2010050484, 2011.
- Abstract
- Introduction
- Concept – continuous in-line monitoring of electrolytes and urea
- Concept – urea sensor
- Experiment – preclinical investigation
- ISFETs for miniaturization
- Conclusion
- Data availability
- Author contributions
- Competing interests
- Special issue statement
- Acknowledgements
- Financial support
- Review statement
- References