the Creative Commons Attribution 4.0 License.
the Creative Commons Attribution 4.0 License.
 | 05 Oct 2020
Development and test of a highly sensitive and selective hydrogen sensor system
Pramit Sood
Jens Zosel
Michael Mertig
Wolfram Oelßner
Olaf Herrmann
Michael Woratz
A miniaturized field-applicable sensor system was developed for the measurement of hydrogen (H2) in air in the concentration range 0.2–200 ppmv. The sensor system is based on the application of an yttria-stabilized zirconia (YSZ) solid electrolyte cell (SEC) as a coulometric detector with gas chromatographic (GC) pre-separation. The main system components for injection, chromatographic separation, and the oxygen pumping cell were significantly miniaturized and tested separately to characterize important measurement properties like selectivity, lower limit of detection, repeatability, and signal-to-noise ratio. Measurements were conducted under varying GC parameters and detector operating conditions. While changing the detector temperature influences the hydrogen peak significantly due to diffusion processes at the electrode–electrolyte interface; different oxygen-partial pressures at the measuring electrode have no visible effect. The combination of two packed columns with 1 m length, one filled with a molecular sieve (13X) and the other one with silica gel, enabled highly reproducible and selective H2 measurements with more than 90 % analyte turnover compared to Faraday's law. The resulting insights were used to define appropriate system parameters, construction guidelines, and material properties for the final test prototype.
- Article
(4144 KB) - Full-text XML
- BibTeX
- EndNote


Two of the largest challenges for a sustainable energy infrastructure of the future are its supply security and its renewability. All modern-day assessments of the global energy future suggest that the growing demand of energy and the reduction in anthropogenic carbon emissions must both go hand in hand, using a diverse energy mix which is simultaneously environmentally acceptable (Edwards et al., 2007). Hydrogen (H2), which has been extensively used as a raw material and energy carrier in many industry branches over the last century (Ramachandran, 1998), shows great potential to address the above-mentioned challenges as a cleaner and renewable energy source (Dagdougui, 2012). On the one hand, there has been significant development in the use of H2 to supply energy in different sectors, e.g. through fuel cells (Mohapatra and Tripathy, 2018; Sinigaglia et al., 2017), and on the other hand, technologies have been developed to produce H2 using renewable sources (e.g. power to gas; Hosseini and Wahid, 2016; Maroufmashat and Fowler, 2017).
A decentralization of the H2-based energy supply chain will thus affect the consumer sector, prospectively to a far greater extent than today, which will result in new challenges in application security. A straightforward and comprehensive consideration of these challenges is essential for maintaining the acceptance of this energy source for public use (Pasman, 2011). Since H2 is a very light, highly flammable, and odourless gas with a wide explosion range in air, a widely accepted approach to risk management is its automated, highly selective online measurement in a wide concentration range down to concentrations below 10 vol.-ppm, so that any leak can be detected at an early stage (Hübert et al., 2014).
This approach requires complex safety monitoring infrastructure based on highly sensitive, selective, and long-term stable sensor systems that can be installed and operated flexibly in the field for the complete supply chain. In Boon-Brett et al. (2010) different commercial sensor technologies and test methods for H2 leak detection and safety monitoring are described and evaluated. One result of this evaluation indicates that a variety of sensors in use today still have inappropriate selectivity, causing false alarms in leakage detection. One possibility for improving selectivity is a chromatographic pre-separation of the gas mixture to be measured. In Schelter et al. (2013) and Teske et al. (1986), the use of a solid electrolyte coulometric (SEC) gas sensor as a GC detector is described, which detects trace concentrations of oxidizable gas components (H2 and CH4) in oxygen-containing gas mixtures. Zirconium dioxide stabilized with yttrium oxide (YSZ) was used as solid electrolyte in that detector. Between 600 and 800 ∘C, its conductivity for oxide ions ranges from to S cm−1 (Park and Blumenthal, 1989). At the constantly polarized detector, an electrolysis current is measured, which indicates the oxidation and/or reduction of chromatographically separated gas components in an O2-free inert carrier gas (N2, Ar, and He). The negative polarization of the measuring electrode versus a Pt reference electrode in air generates a constant oxygen partial pressure below 0.2 Pa (Schelter et al., 2013). Equation (1) describes the relationship between the concentration φ of the analyte x and the detector signal I, based on Faraday's law as follows:
where ts and te are the start and end times of the chromatographic peak, respectively. F denotes the Faraday constant, IB stands for the baseline current, and z for the number of electrons transferred in the reaction (z=2 for H2 and 4 for O2). Vm and Vs stand for the molar volume of the gas and for the injected sample volume, respectively. Commercial SECs have been characterized and optimized in terms of material properties (Schelter et al., 2016) and intrinsic and/or extrinsic noise sources (Schelter et al., 2013) to enable selective measurement of H2 concentrations down to 400 ppbv. The present contribution reports recent developments in two thematic directions which, on the one hand, are concerned with the miniaturization and characterization of the essential components of the SEC and GC system and, on the other hand, the characterization of the essential sensor parameters under changing operating conditions in order to optimize the miniaturized system for field application.
To characterize SEC parameters under varying measurement conditions, a gas chromatograph, denoted with C in Fig. 1 (8610C, multiple gas analyser no. 1; SRI Instruments Europe GmbH, Bad Honnef, Germany), was combined with a commercially available oxygen-pumping cell D (O2-DF-28.0; ZIROX Sensoren & Elektronik GmbH, Greifswald, Germany) with a proportional–integral–derivative (PID) temperature control F and a self-developed potentiostatic control circuit E (Schelter et al., 2013). The gas sample is injected directly through a 10-port rotary valve A, with a sample loop with Vs=1 mL. The components H2 and O2 are separated chromatographically in two consecutively rinsed stainless steel columns packed with a molecular sieve 13X and silica gel, respectively, and positioned in a conventional air bath oven B. Nitrogen (N2) of the quality 5.0 was used as a GC carrier gas. The sample loop is continuously purged with sample gas mixtures prepared using test gases with either 103 or 1000 vol.-ppm H2 in synthetic air, which were diluted with calibrated mass flow controllers G (Brooks Instruments, Hatfield, Pennsylvania, USA). The system was thoroughly investigated in terms of chromatographic separation behaviour, lower limit of detection, accuracy, reproducibility, and long-term stability. Based on an experimental design, the operating conditions were varied for detector temperatures between TD=600 and 750 ∘C, polarization voltages between and −450 mV, injected H2 concentrations between ϕ(H2)=0.2–225 vol.-ppm, carrier gas flow rates –31.5 standard cubic centimetres per minute (sccm; at 0 ∘C and 101 325 Pa), and different column geometries (lengths lc=1 and 2 m; inner diameters and 2.1 mm). The carrier gas flow rates were measured with a calibrated flowmeter (DryCal 800-3; Mesa Laboratories, Inc., Butler, New Jersey, USA) at the outlet of the columns. Multiple chromatograms were recorded at each setting, and average values for peak area and peak height were calculated.
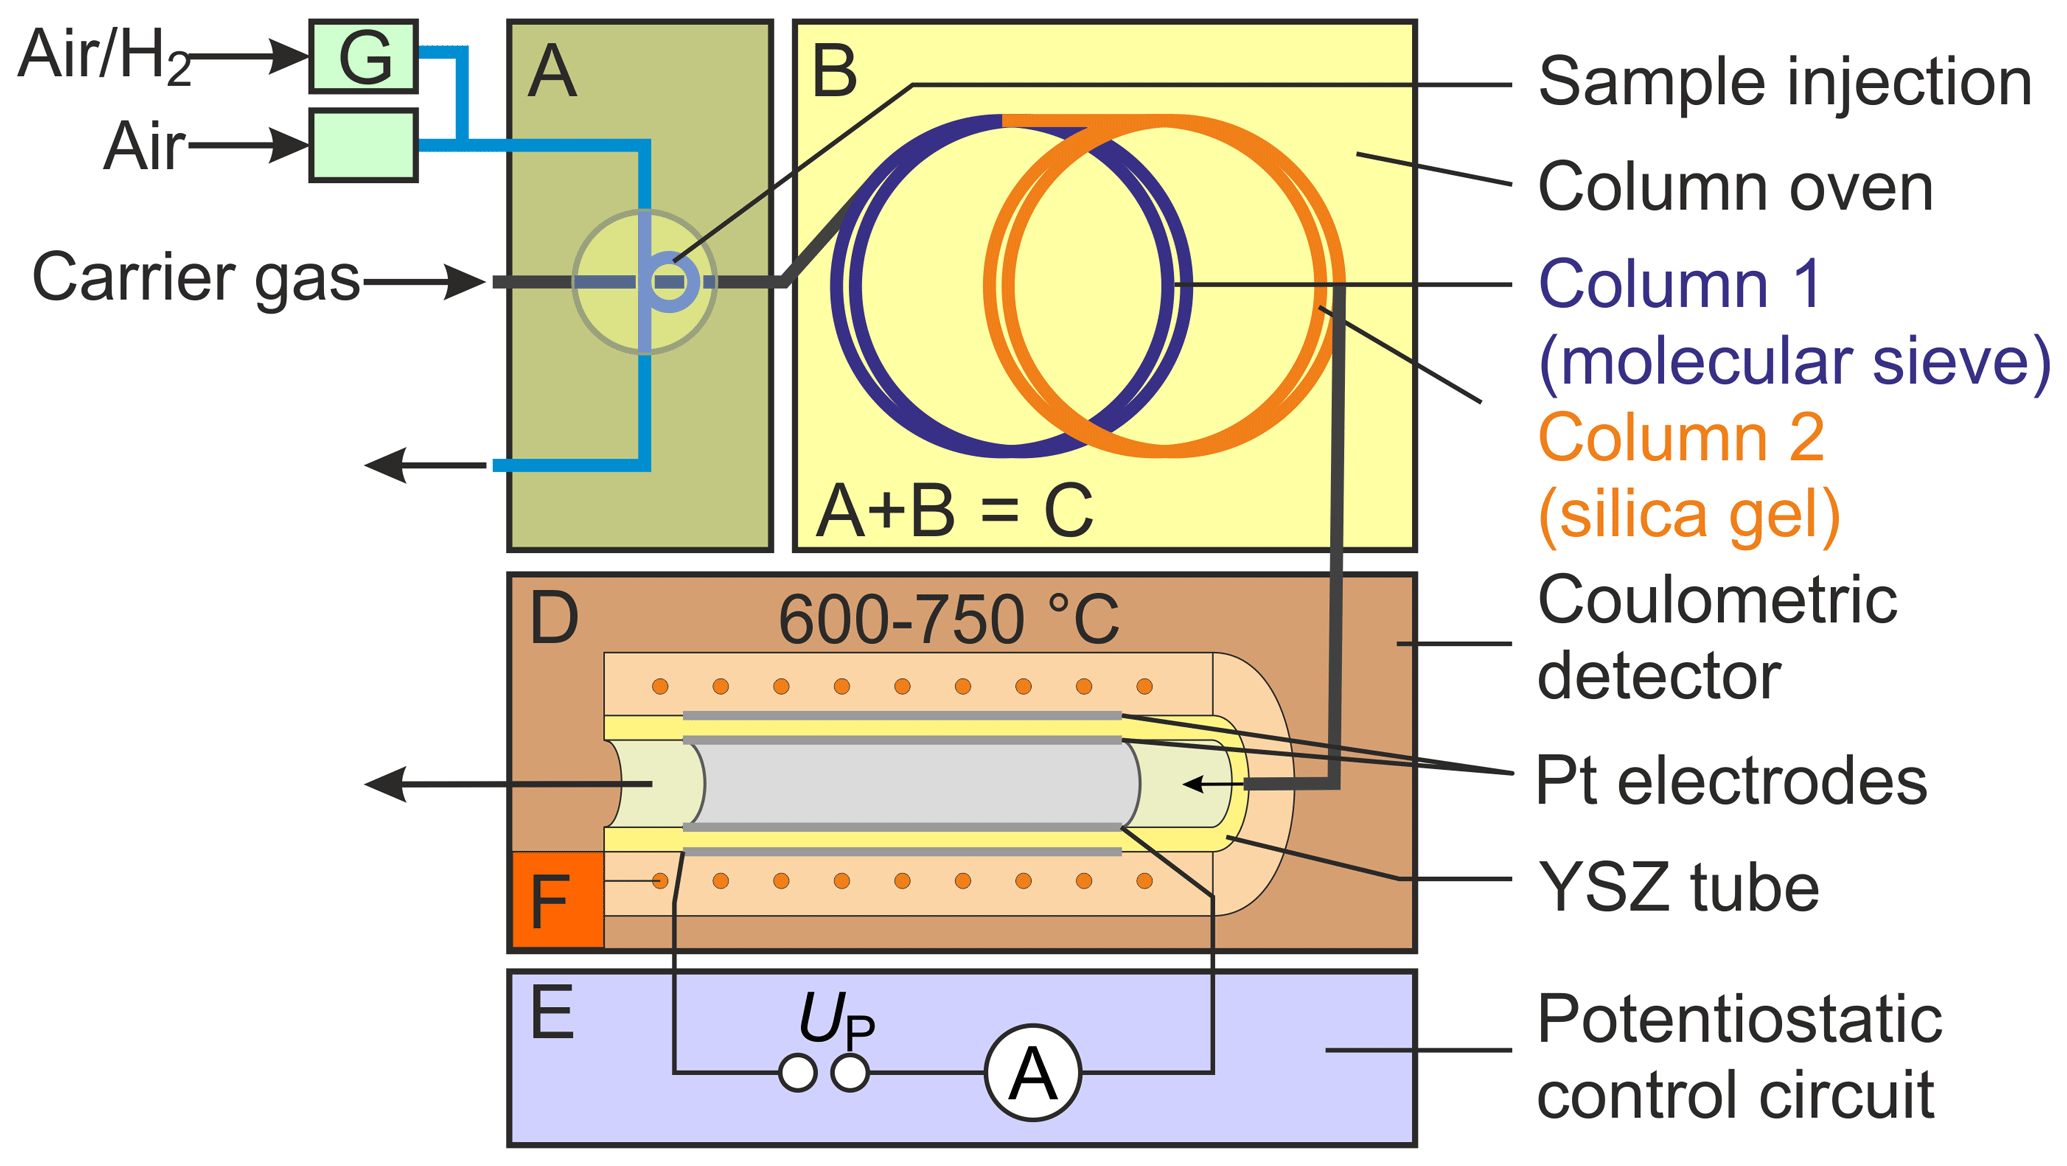
Figure 1Scheme of the experimental setup for testing the chromatographic approach. Note: A – injection unit, B – column oven, C – gas chromatograph, D – solid electrolyte detector, E – potentiostatic control circuit, F – temperature control, and G – mass flow control.
Based on the obtained data during parametric characterization, the main components of the H2 sensor system, i.e. sample injection unit, column oven, and detector, were miniaturized, characterized, and optimized in terms of material properties and design. The newly developed injection unit consists of eight individually controlled solenoid micro-valves (S0705DX-CO, three way, two position (3∕2) valves; SMC Deutschland GmbH, Egelsbach, Germany), which are mounted on a newly developed miniaturized manifold, as shown in Fig. 2. This manifold is significantly smaller ( mm3) than the 3D-printed prototype described in Sood et al. (2019) and was manufactured by precision drilling of five tailored modules, which were joined with O-ring connectors. The manifold was tested for gas tightness by means of a helium leak test unit (ASM 310; Pfeiffer Vacuum, Aßlar, Germany). Injection behaviour and gas dispersion in the manifold were tested by connecting the manifold to a commercial SEC with short-circuited separation column connections and also tested with N2 as carrier gas and 300 vol.-ppm H2 in N2 as sample gas. The detector signal was recorded using a potentiostat (Interface 1000; Gamry Instruments, Warminster, Pennsylvania, USA) over several load and injection cycles at different polarization voltages, detector temperatures, carrier gas volumetric flow rates, and injected H2 concentrations.
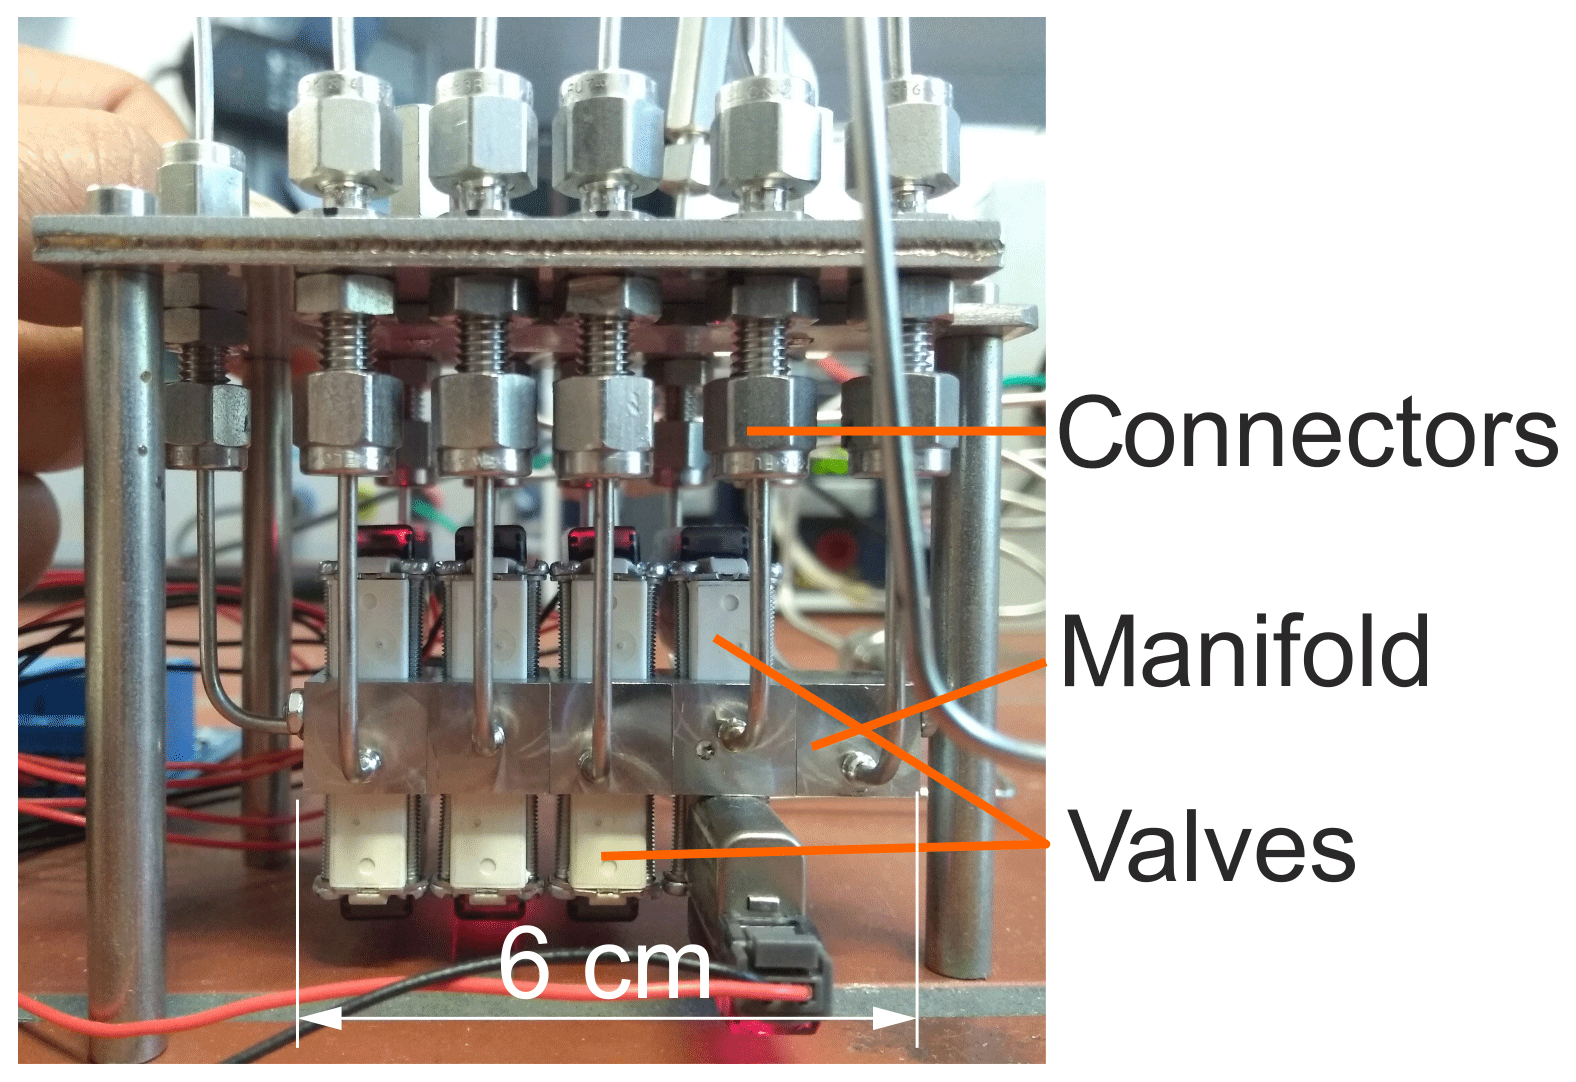
Figure 2Picture of the newly developed injection unit with the valve-equipped micro-manifold made of five modules.
The basic design concept and a corresponding prototype of a miniaturized GC column oven are described elsewhere (Sood et al., 2019). To characterize the functional performance, heating and cooling rates were measured at constant or increasing heating power and maximum cooling power. The cylindrical support, with reduced size ( mm3) and optimized cooling fins, is shown in Fig. 3. Here, the cylindrical support structure was manufactured using aluminium 3D-printing technology. Separation columns with lc=1 m are wound on the structure along with a mineral-insulated resistive heating wire (ThermoExpert Deutschland GmbH, Stapelfeld, Germany). Temperature control is based on the signal of a PT1000 sensor. The support structure consists of an integrated 3D-printed heat sink structure, which is convectively cooled by a DC axial fan. The exterior of the columns was thermally insulated from the ambient air with an aluminium silicate-based material (not shown in Fig. 3).
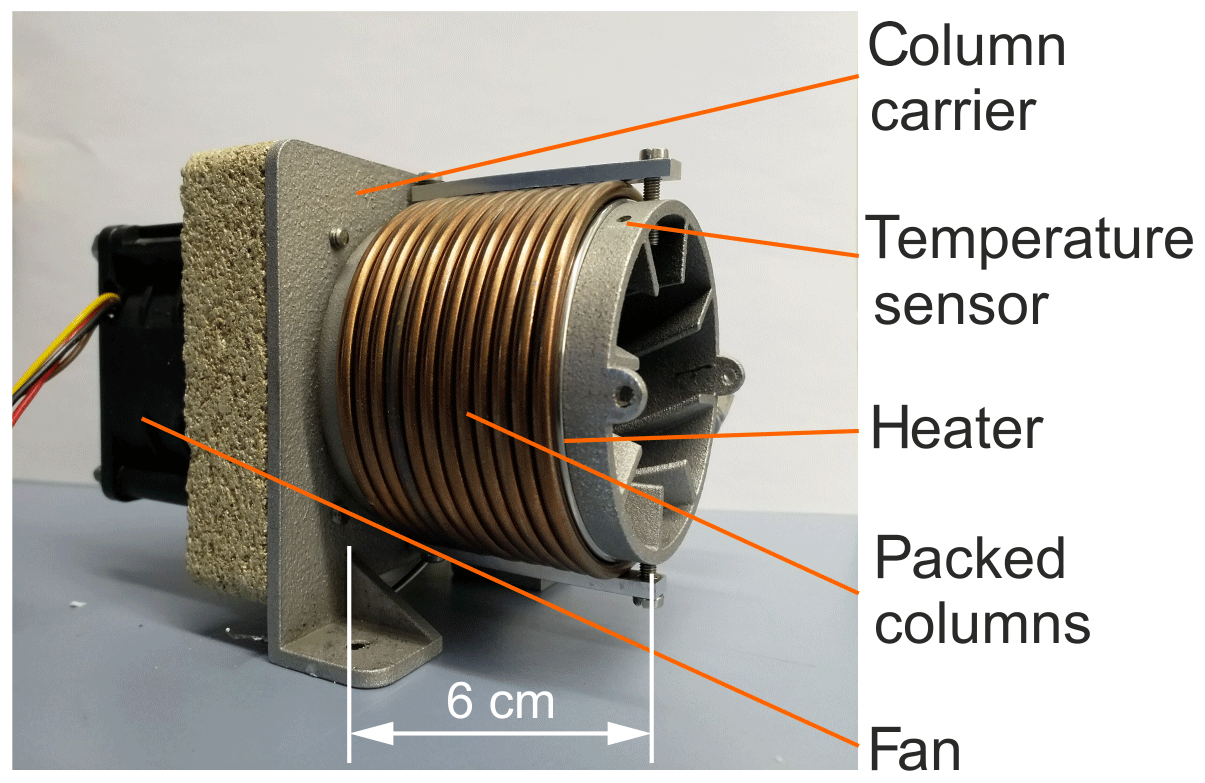
Figure 4 shows the laboratory prototype of a miniaturized SEC detector using a 3 mol % YSZ tube (MicroCeram GmbH, Meißen, Germany; lt=80 mm, mm, and mm). The cylindrical outer electrode (working electrode) and inner electrode (reference electrode) were both prepared by sintering the Pt paste at 1200 ∘C on the YSZ tube with 0.3 mm Pt wires as electrical contacts. The YSZ tube is axially enclosed by a quartz glass tube carrying a Kanthal® heater providing the operating temperature of the YSZ. The SEC detector was thermally insulated with vermiculite blocks. As an input signal for the temperature control of the detector, a PT200 resistance temperature detector (RTD) sensor (UST Umweltsensortechnik GmbH, Geschwenda, Germany) was used and was positioned near to the inner reference electrode towards the middle of solid electrolyte tube. Both ends of the glass and YSZ tubes were fixed into specially constructed stainless steel blocks with gas connectors using O-ring seals. The miniaturized detector was characterized for gas tightness with the same leakage test described for the injection manifold and by N2 rinsing and measuring the open circuit potential (OCP). To test its kinetic properties, it was coupled with the GC setup described above and operated coulometrically.
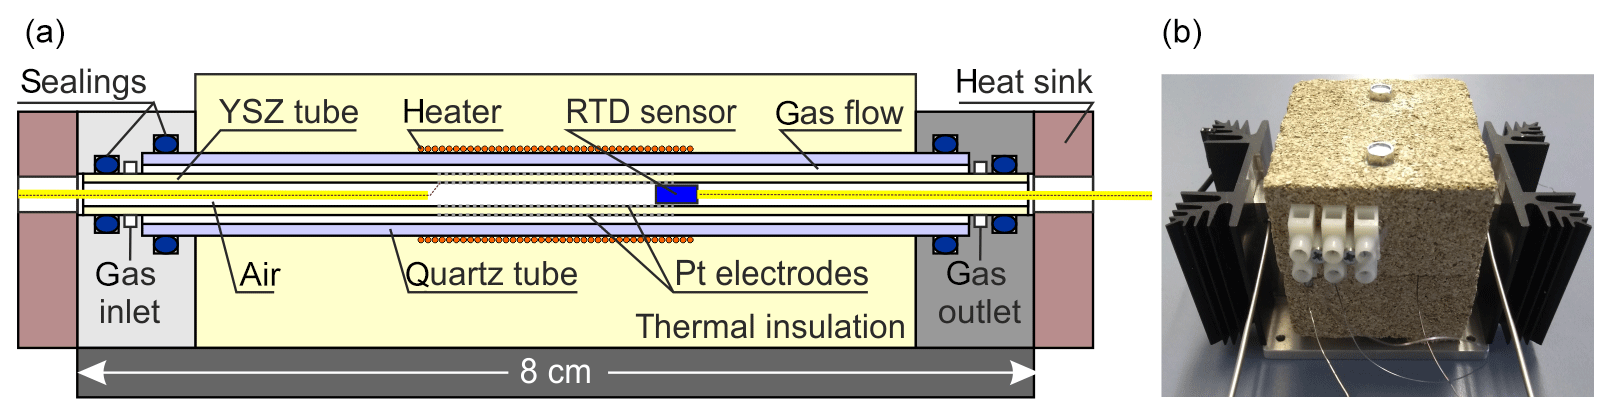
Figure 4Schematic cross section through the miniaturized SEC detector (a) and a picture of the detector (b).
3.1 Effect of detector temperature and polarization voltage
The temperature and polarization voltage of the measuring electrode in the SEC can intensively determine the kinetics of the signal establishing electrochemical H2 oxidation reaction and the interaction of hydrogen with the sensor materials. Figure 5 shows chromatographic H2 peaks at detector temperatures (TD=600, 650, 700, and 750 ∘C), polarization voltage ( mV), H2 sample gas concentration (ϕ(H2)=225 vol.-ppm), and carrier gas flow rate ( sccm). The results indicate that the area and height of the H2-related peaks decrease with increasing detector temperature. In addition, a tailing is observed at the end of each peak, which flattens and significantly prolongs with increasing temperature (see enlarged view, from 160 to 200 s, in Fig. 5). Since the amount of hydrogen titrated during peak tailing is also a part of the injected quantity that is incompletely taken into account during peak integration because of the upcoming oxygen peak, the peak areas and heights are lower with prolonged tailing. This peak tailing suggests that a certain amount of introduced H2 (approx. 10 %, when comparing the peaks at 750 and 600 ∘C) is temporarily stored in the detector near the measuring electrode. As described in Ruchets et al. (2019), the interface between the Pt mesh electrode and the solid electrolyte is formed by a porous YSZ layer sintered onto the YSZ tube that provides an extended three-phase boundary for accelerated oxygen transfer. This setup enables the detection of H2 traces with cyclovoltammetry, utilizing the intermediate storage of H2 at the electrode. Here, with chromatographic detection, the temporarily stored H2 elutes from this layer and the Pt bulk after the main peak and leads to the observed peak tailing.
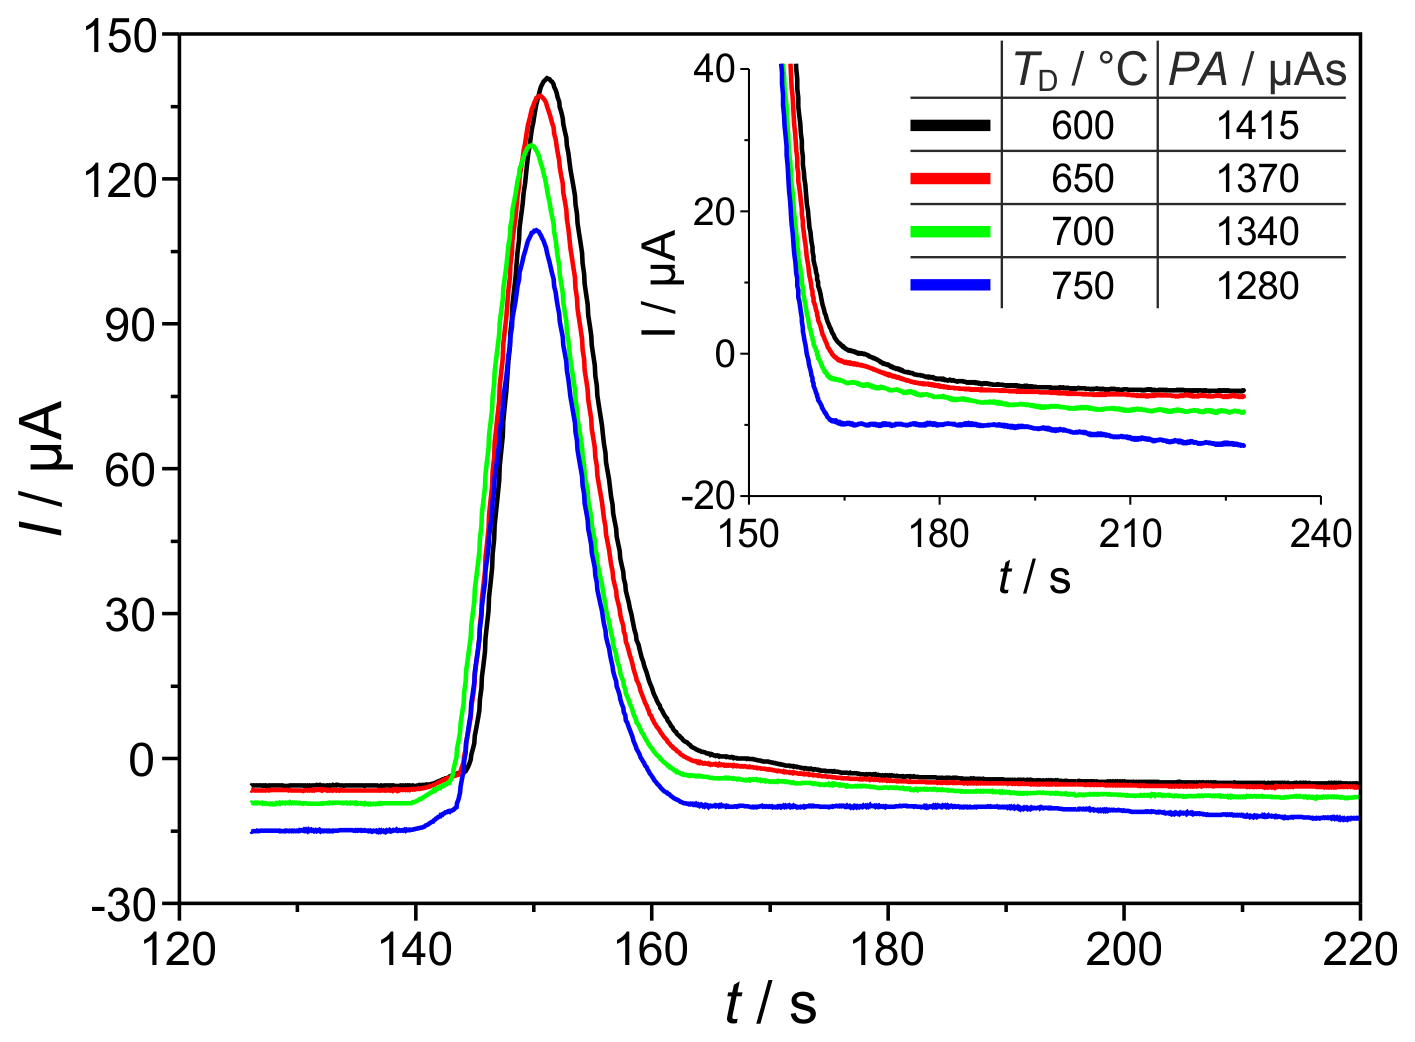
Figure 5Sections of chromatograms with H2 peaks at different detector temperatures TD. Peak area (PA) is given in the insert. mV, ϕ(H2)=225 vol.-ppm, lc=2 m, and mm.
While at TD=750 ∘C the injected H2 is detected incompletely, at TD=600 ∘C the tailing is much shorter, and the amount of charge found in the peak almost corresponds to the injected amount of H2 as calculated by Eq. (1). Investigations of the detector behaviour at varying polarization voltages in the range between mV (p(O2)=25 mPa) and mV (p(O2)=0.27 mPa) prove that the peak tailing described above is not influenced by p(O2) in the investigated range. While SEC temperature has to be adjusted with respect to the desired measurement range, the polarization voltage does not influence the kinetics in the investigated range.
3.2 Peak form and signal dependency on the injected H2 concentration
The response of the SEC detector was characterized at different injected hydrogen concentrations in the range ϕ(H2)=0.2–180 vol.-ppm, with other parameters remaining constant for the characterization of the sensitivity of the developed system. The corresponding chromatogram sections with mean peak areas and peak heights are shown in Fig. 6a for TD=700 ∘C. The peak tailing described in Sect. 3.1 also occurs at all lower H2 concentrations. In addition, at ϕ(H2=20–225 vol.-ppm, front- and back-end lobes occur in the peak, due to the corrugated laminar flow regime in the packed columns, and disappear at ϕ(H2)<10 ppmv.
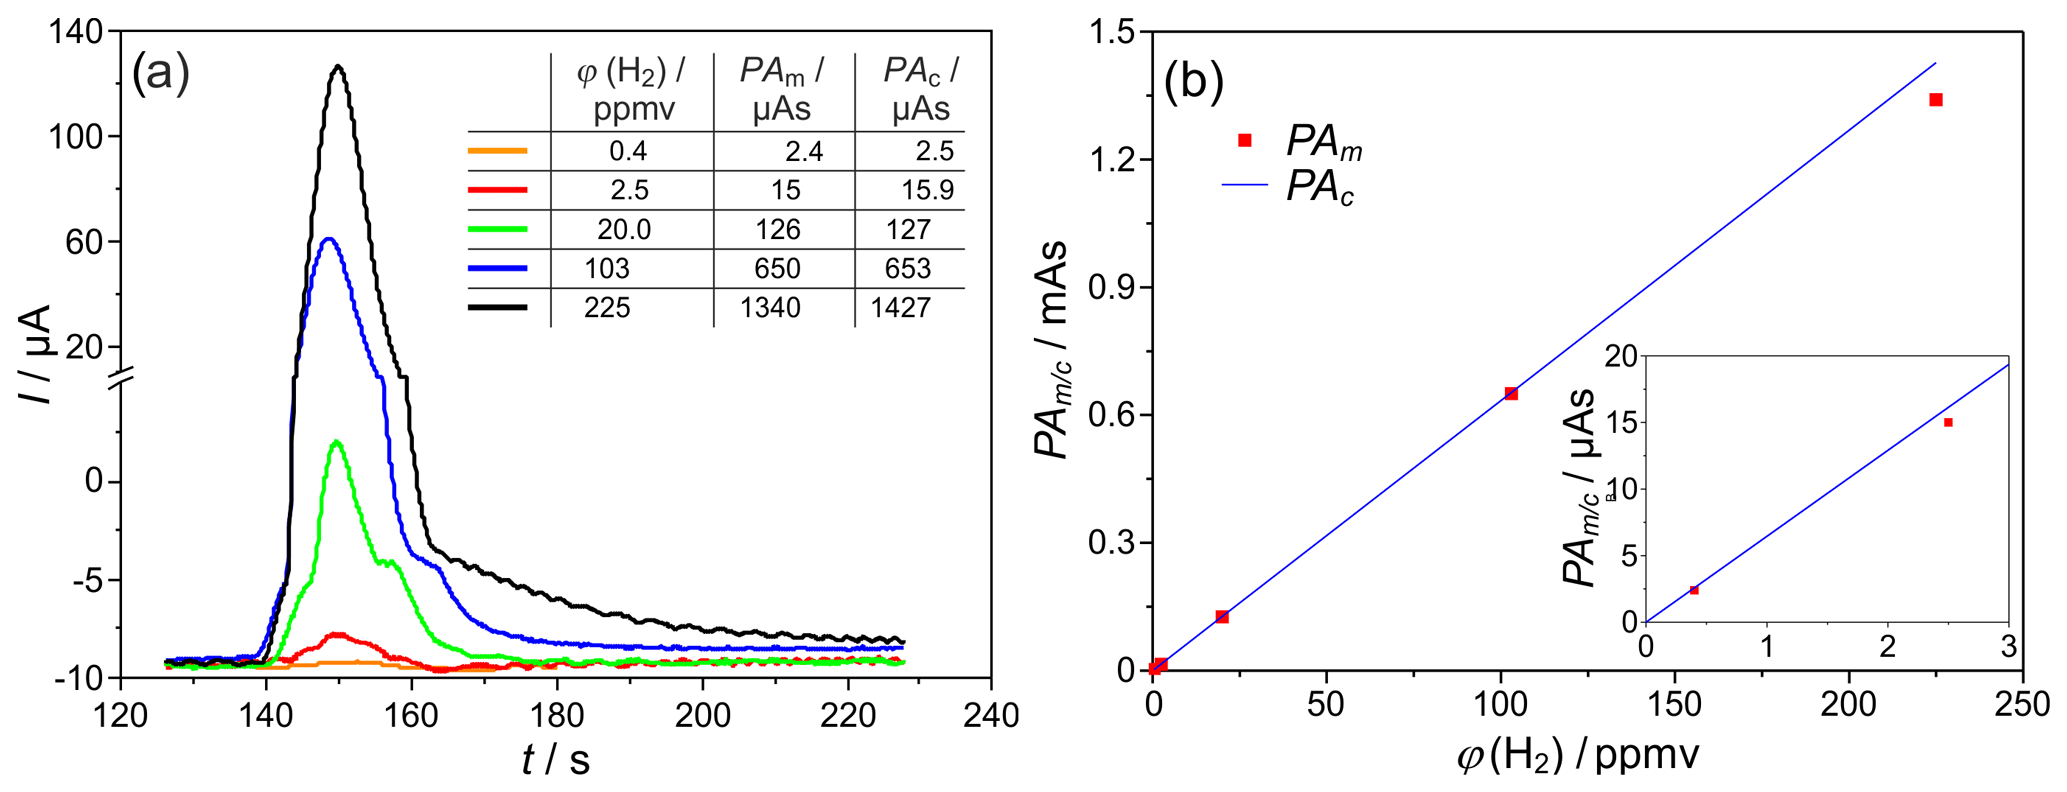
Figure 6(a) H2 peaks at different injected H2 concentrations, and PAm∕c = peak area (measured and/or calculated according to Eq. (1) – Faraday's law). (b) Peak area dependency on the injected H2 concentration, TD=700 ∘C, mV, lc=2 m, and mm. The insert in (b) indicates the low concentration values with enhanced resolution.
The comparison of the measured peak areas with values calculated according to Eq. (1) for different injected H2 concentrations is provided in the insert table of Fig. 6a and graphically in Fig. 6b. For the given operating conditions, an almost complete coulometric conversion of the analyte was found between ϕ(H2)=0.4–100 ppmv. On the one hand, this complete oxidation causes a maximum accuracy of the detector. On the other hand, it allows a largely calibration-free operation of the entire measuring system. The smallest deviations between measured and calculated charge quantities of <4 % were found at ϕ(H2)=2.5 vol.-ppm and TD=600 ∘C. For ϕ(H2)<2 vol.-ppm and TD=700 ∘C, there are increased fluctuations in the baseline electrolysis current and, thus, lower signal-to-noise ratios (SNR), causing an elevated measurement error. For ϕ(H2)>20 vol.-ppm and higher temperatures, increased storage effects were observed. These in turn cause long peak tailing and possible overlap with the O2 peak, resulting in an increased loss of detected H2. In summary, the linear relationship between the H2 concentration and the peak area could be established with this setup in the range between ϕ(H2)=0.4–100 ppmv.
3.3 Influence of carrier gas flow rates and GC column geometry
The column geometry influences the carrier gas flow rate, which is controlled indirectly here by fixing the column inlet pressure. The flow rate determines the available time span for the oxidation reaction in the SEC. The investigation of the dependencies of the peak parameters on the carrier gas flow rate through the packed GC columns with lc=2 m showed only very minor influences of this parameter, as described in Sood et al. (2019). It could be demonstrated that, with the tested flow rates in the range –16 sccm, the analyte is always completely electrochemically titrated. In addition, higher flow rates always lead to increased peak heights connected with higher SNR (calculated according to ISO 11843-1). Furthermore, it was found that the SNR also increases with decreasing detector temperature since baseline current fluctuations and noise amplitudes mainly depend on the detector temperature and its control circuit (Schelter et al., 2013). The results enabled conclusions for design optimization of the miniaturized measurement system to ensure an adequate SNR with a complete electrochemical H2 conversion, a short analysis time, and a low detection limit in the parts per billion concentration range.
Significant miniaturization of the column oven can be achieved, primarily, by using shorter columns. Therefore, different packed columns with inner diameters of and 2.1 mm and lc=1 m were tested under varying operating conditions by monitoring H2 peaks with the commercial SEC. The corresponding H2 peaks are shown in Fig. 7 for the carrier gas flow rates , 25.5 and 31.5 sccm, and three different injected H2 concentrations. The reduction of the column length leads to the expected reduction in the retention time of all peaks by a factor of about 4. The values of the analysed peak areas, listed in Fig. 7, lead to the assumption that, in these shortened columns, different processes result in an elevated influence of the carrier gas volume flow on the amount of titrated H2. At concentrations in the range around 20 vol.-ppm, two processes take place and lead to a decrease in peak area. At low flow rates, the peaks are broadened with extended tailing. At higher flow rates, however, the O2 peak starts so early that the H2 peak is again incompletely titrated. In the trace concentration range, the storage effects are less pronounced. The peaks at ϕ(H2)=0.5 vol.-ppm and column length lc=1 m exhibit elevated height and, therefore, higher SNR than those from columns with lc=2 m.
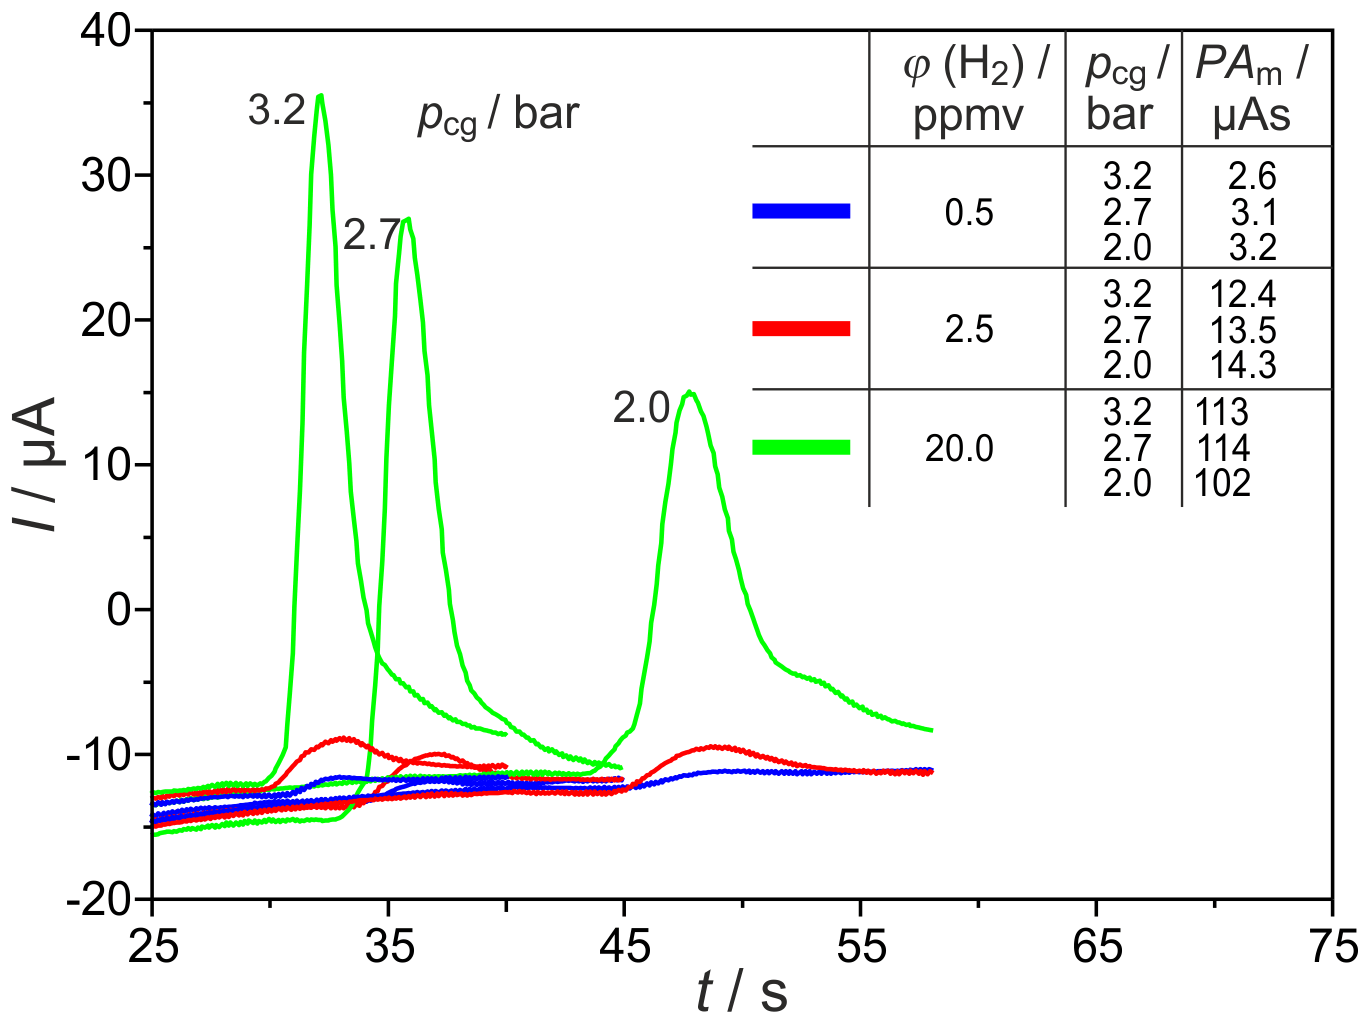
Figure 7H2 peaks at different carrier gas inlet pressures pcg and injected H2 concentrations φ(H2). PAm = measured peak area, Up = −450 mV, TD = 650 ∘C, lc=1 m, and mm.
Figure 8 shows H2 peaks at the highest tested carrier gas flow rate and three different detector temperatures. This proves that, at ϕ(H2)=0.4 vol.-ppm, TD=700 ∘C, and sccm, the relative deviation between titrated and injected H2 amounts was reproducibly the lowest. This result shows that the goal of developing a miniaturized field-applicable device with increased sensitivity can be better achieved with shorter columns.
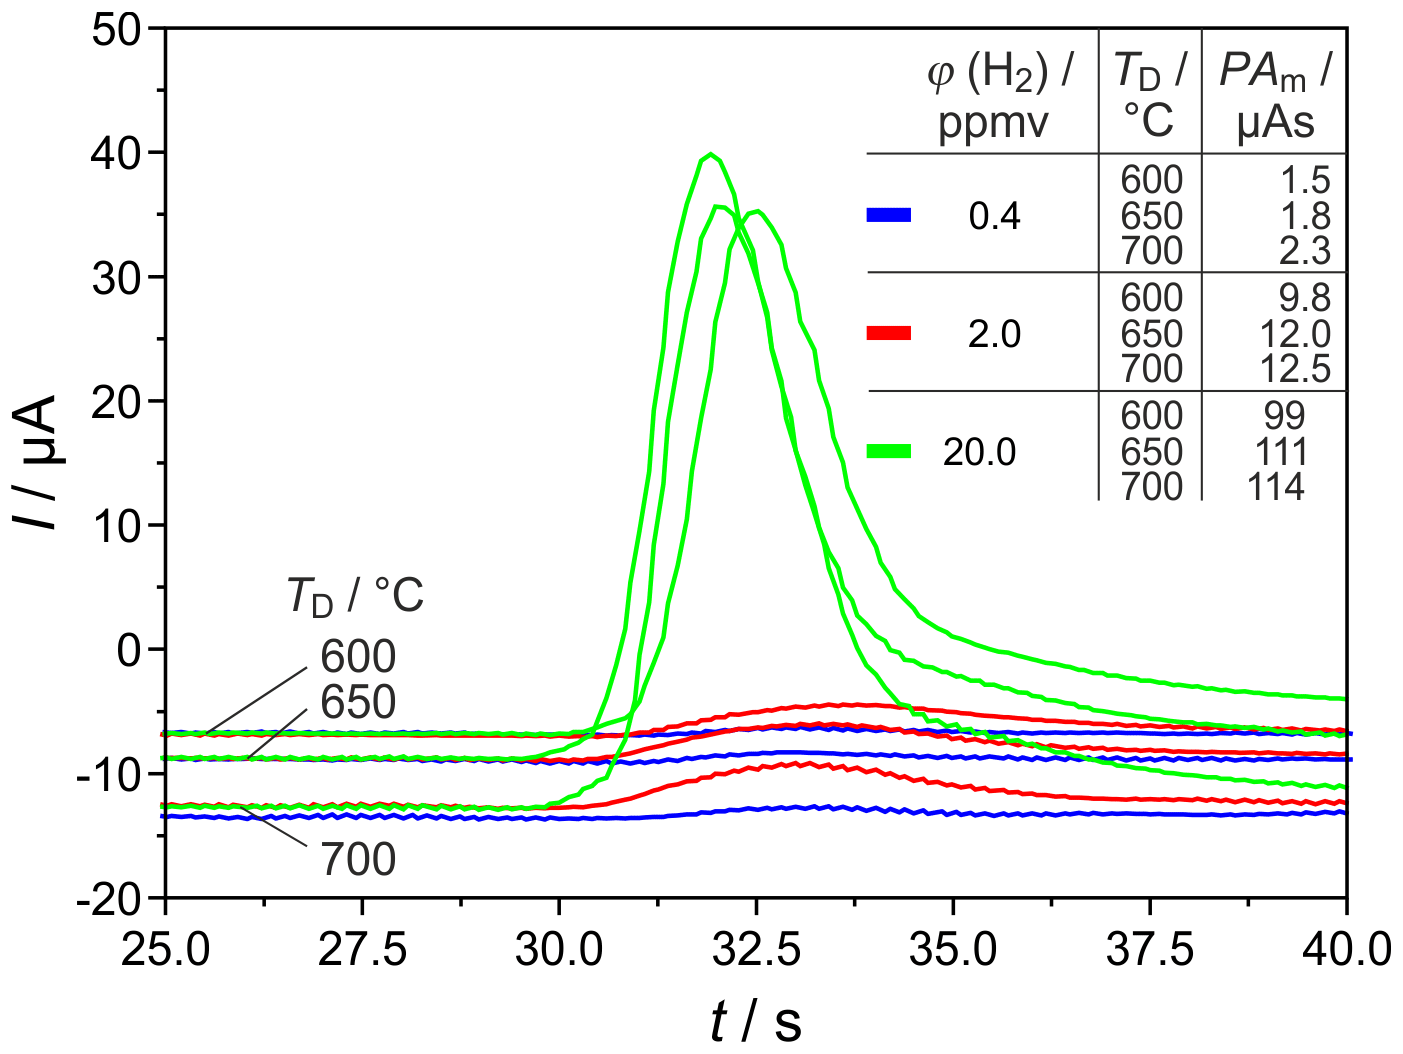
Figure 8H2 peaks at different detector temperatures TD and injected H2 concentrations φ(H2). PAm = measured peak area, pcg=3.2 bar, mV, lc=1 m, and mm.
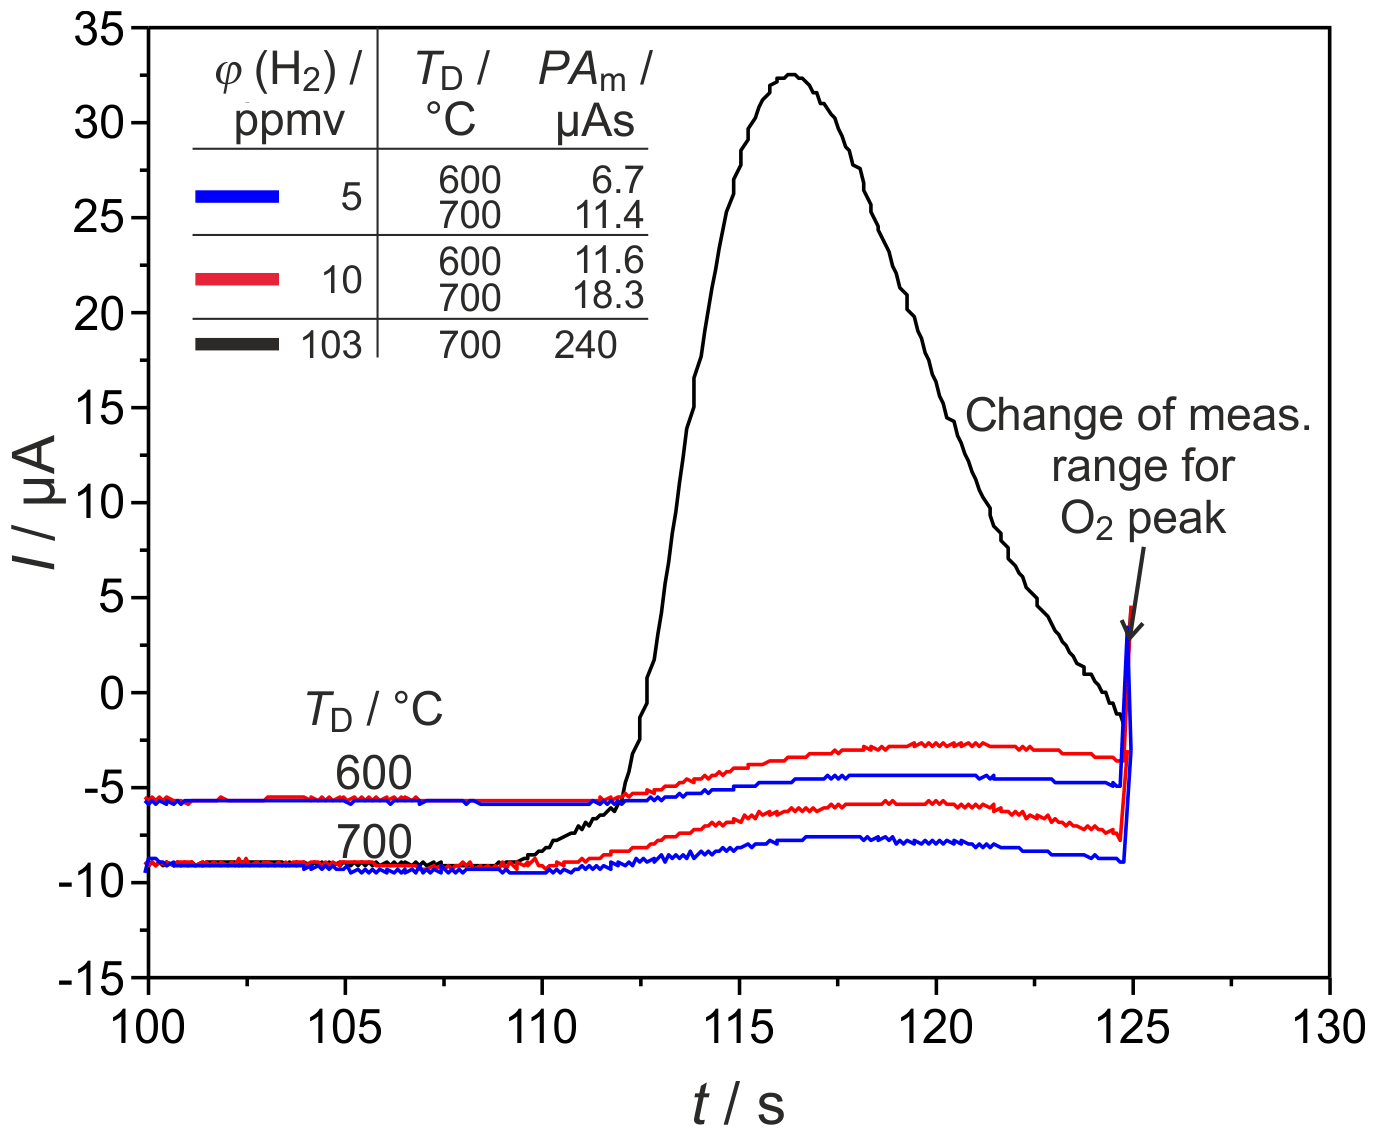
Figure 9H2 peaks at different detector temperatures TD and injected H2 concentrations φ(H2) in narrow columns. PAm = measured peak area, pcg=4.1 bar, mV, lc=1 m, and mm.
H2 peaks from columns, with mm for ϕ(H2)=5, 10, and 103 vol.-ppm and TD=600 and 700 ∘C, are illustrated in Fig. 9. Compared to the columns with mm, the peaks are broadened for all injected ϕ(H2) coming with the increased flow resistance of the stationary phase in these much more densely packed columns, resulting in very low carrier gas velocities in the range of 1.6 cm s−1. At all studied concentrations and temperatures, this peak broadening results in an overlap with the following O2 peak, which starts at around 126 s. That overlap results in a reduction in the titrated H2 to roughly one-third of the injected amount, as the numbers in Fig. 9 reveal. At ϕ(H2)<1 vol.-ppm, this peak broadening disables a clear peak identification within in the baseline noise, as the original and smoothed curves for ϕ(H2)=0.5 vol.-ppm in Fig. 10 indicate. The lower difference between measured and injected H2 amounts at lower Td values shown in Fig. 5 is reversed for these narrow columns. Here, the complex interaction between column flow and detector kinetics results in higher titrated H2 amounts at higher Td values. A comparable separation performance to that of columns with mm can probably also be achieved for the narrower columns with mm, if the inlet pressure could be adjusted above the setup limit of 5 bar or by modification of the stationary phase packing density. While the adjusted flow rates do not limit the amount of titrated H2, the column geometry influences the peak separation significantly.
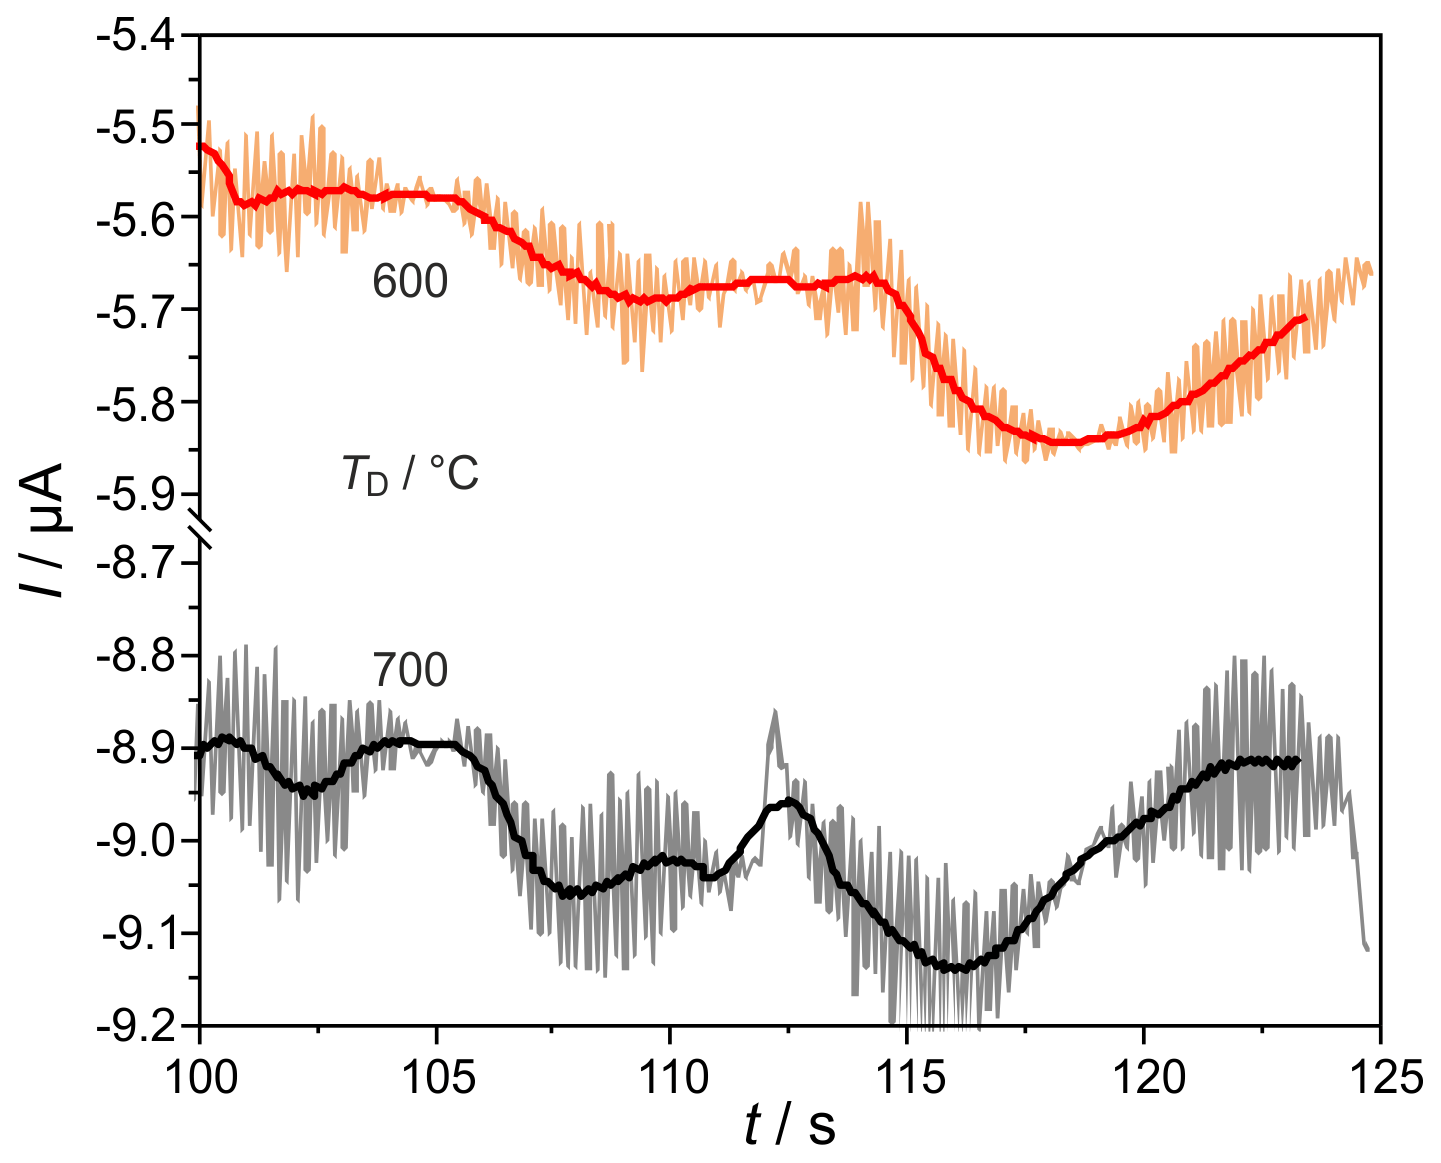
Figure 10Enlarged sections of chromatograms, at the conditions described in Fig. 9, at φ(H2)=0.5 ppmv. Filtered signals are shown as solid lines.
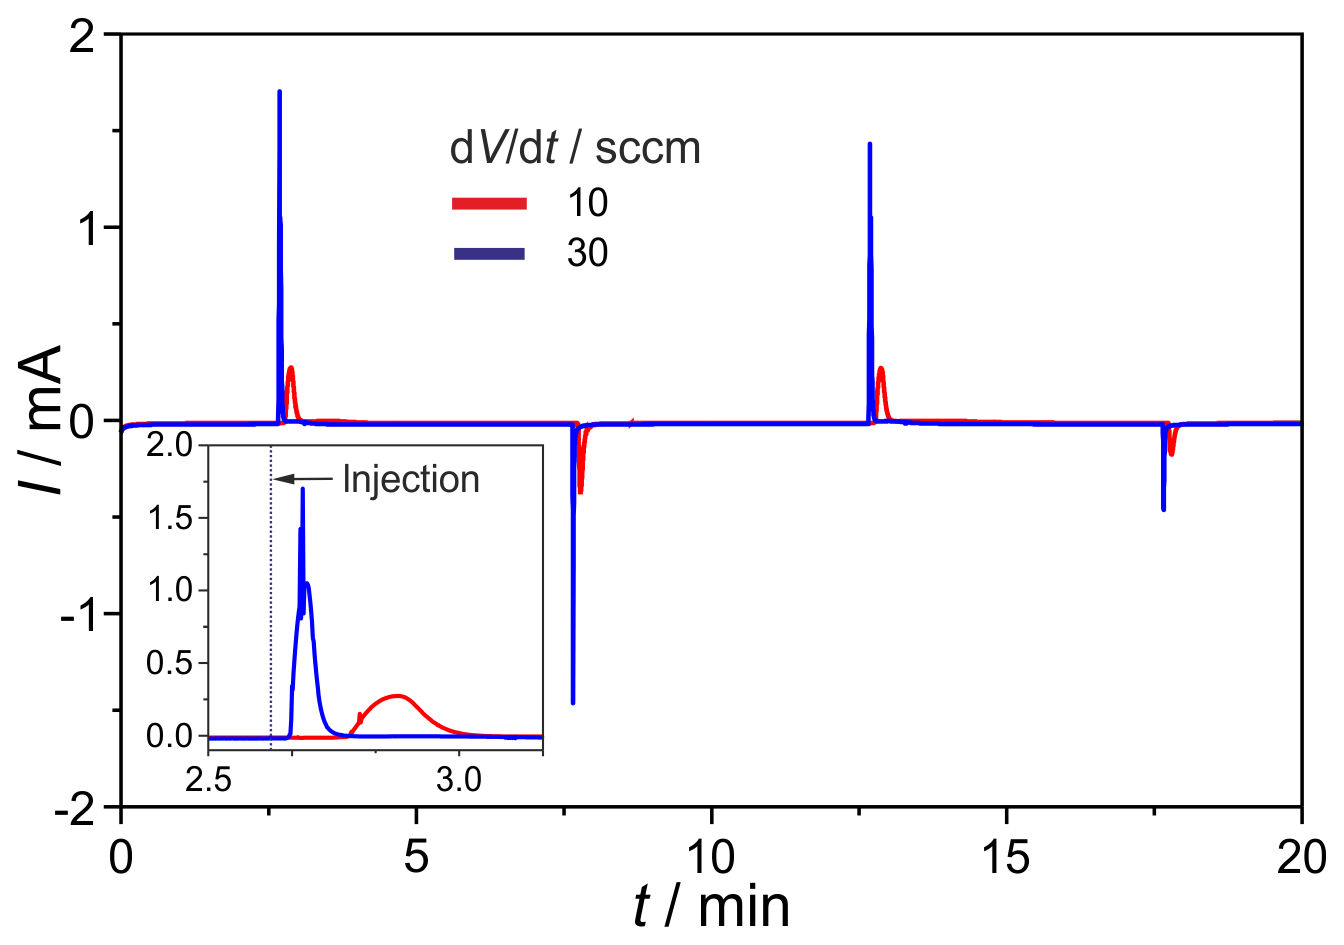
Figure 11H2 peaks after injection with the micro-manifold, shown in Fig. 2, at different carrier flow rates of dV∕dt, mV, Vs=1 mL, φ(H2)=300 vol.-ppm (in N2), and TD=700 ∘C. The first injection step is enlarged in the insert.
3.4 Characterization of the miniaturized sample injection unit
The newly developed manifold was tested for gas tightness and dispersion. The leakage rates between the inner channels and at the outer connections range around 10−8 mbar L s−1. The O2 intake, measured on the completely assembled injection unit, amounts to <0.1 vol.-ppm and, thus, is negligible. In Fig. 11 the H2 peaks found after consecutive injections at the carrier gas flow rates of ; 30 sccm are given. The results prove a stable titration current baseline, and the expected peak height increases with the rising flow rate. The negative current peaks, occurring during the first injection cycles, are generated by residual oxygen in dead volumes of the manifold and in the valves. They disappear completely after about 10 injections. The H2 peaks generated by this manifold show a significantly reduced tailing compared to those found on the manifold described in Sood et al. (2019). Together with the much faster reduction in negative O2 peaks and the reduced retention time, the successful diminishing of dead volumes in the manifold is proved.
3.5 Characterization of the miniaturized GC column oven
The miniaturized column shown in Fig. 3 was characterized for its heating power consumption, heating and/or cooling rates, and heat dissipation. As the results in Fig. 12 describe, it enables heating rates up to 15 K min−1 at heating power 75 W. Its reduced thermal mass and optimized heat dissipation via cooling fins with elevated surface roughness lead to cooling rates around 80 K min−1. As expected, more linear temperature ramps can be established if the heating power is increased, ramp-like, by 5 W min−1. An additional RTD sensor positioned directly on the column surface indicates that the heat dissipation from the resistive heating to the columns is fast enough for the desired chromatographic procedure that requires a column heating of 10 K min−1 (dotted line in Fig. 12).

Figure 12Temperature course of the column oven (Tco) at heating and cooling ramps measured at the GC column oven, as shown in Fig. 3. The temporal course of the heating power Pel is given in the insert diagram, and the line with symbols denotes the temperature at the column surface.
3.6 Characterization of the miniaturized SEC detector
The miniaturized SEC detector, shown in Fig. 4, was tested for its gas tightness, using a helium leakage test unit, resulting in appropriately low leakage rates at around 10−10 mbar L s−1. Applying a heating power of around 25 W to the Kanthal® heating, a temperature of ∘C was established. The OCP measurement in N2, with flow rate 30 sccm, started with cell voltages below −700 mV, indicating the evaporation of gaseous hydrocarbons mainly from sealing materials. After several hours at operating temperature, this outgassing declined, bringing OCP to values at around −230 mV, which signals an appropriately low p(O2) in the carrier gas. The final testing with the GC setup shown in Fig. 1 leads to well-resolved H2 peaks at varying GC and detector operating parameters. An example is shown in Fig. 13 for ϕ(H2)=5, 10, and 103 vol.-ppm and TD=600 ∘C. Due to the reduced dead volume in the newly developed detector, the H2 peaks appeared earlier than in the commercial SEC when operated at same conditions. The absolute value of the baseline current was highest at ϕ(H2)=10 vol.-ppm and decreased during the following chromatograms at ϕ(H2)=5 and 103 ppmv. This indicates a declining residual p(O2) in the carrier gas, as it was found after each start of the system.
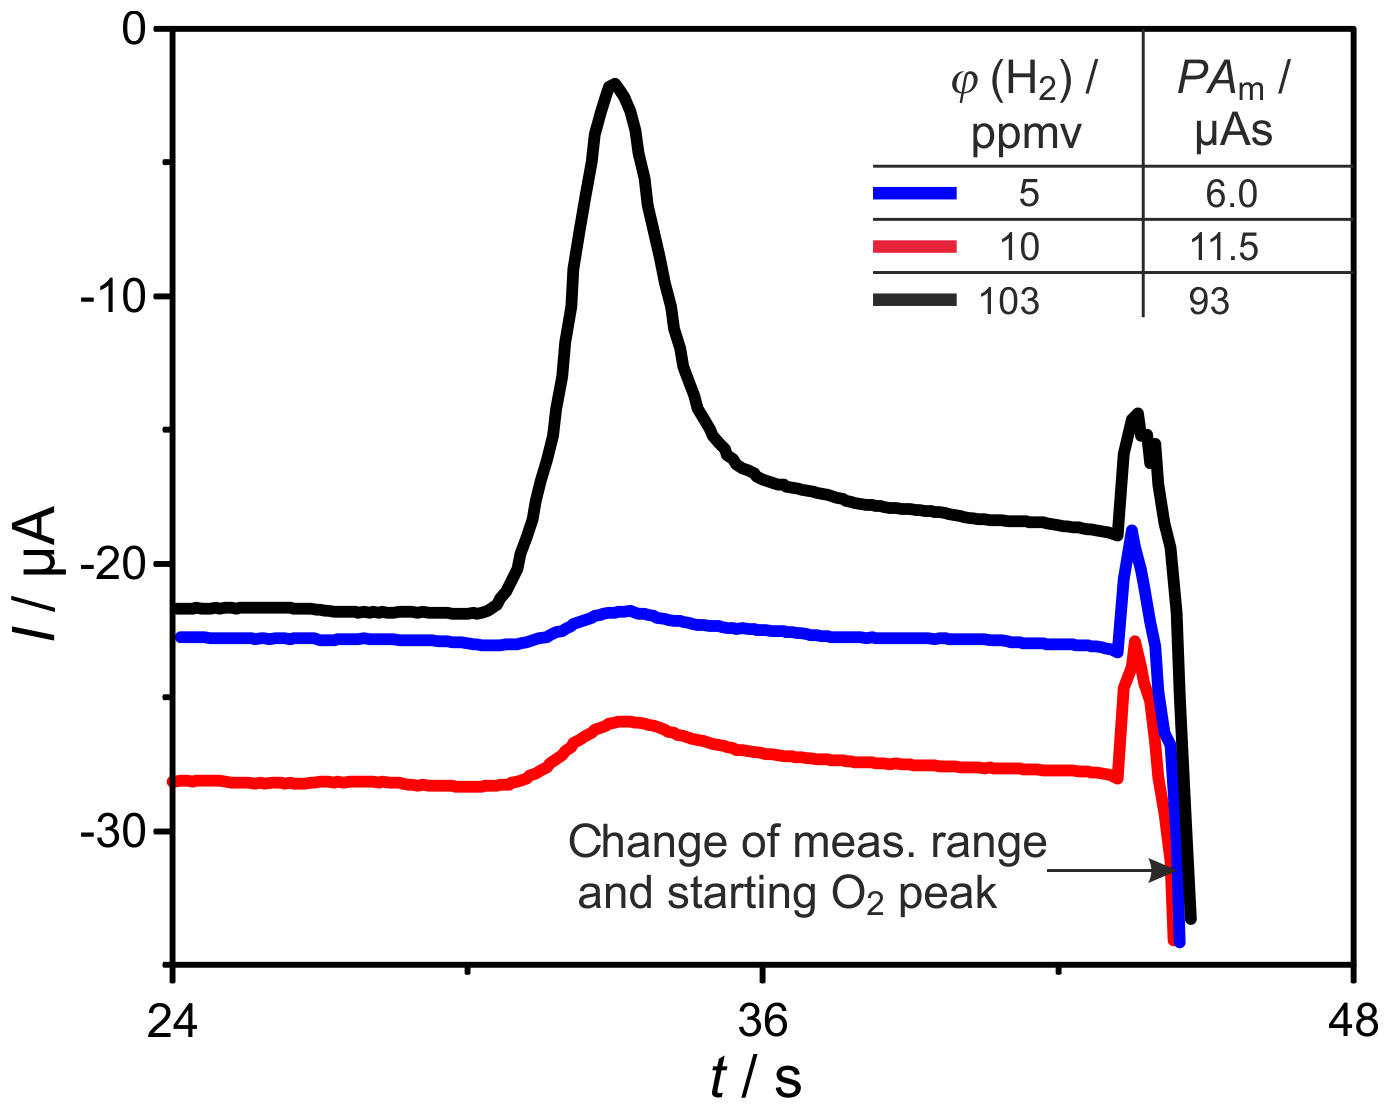
Figure 13H2 peaks measured with the newly developed detector, shown in Fig. 4, at different injected H2 concentrations of φ(H2), TD=600 ∘C, mV, lc=1 m, and mm.
The measuring behaviour of a coulometric solid electrolyte detector (SEC), in combination with a chromatographic separation of the sample gas for highly selective H2 detection, was investigated by varying the detector temperature, polarization voltage, injected H2 concentration, carrier gas flow rate, and column geometry. For all tested column configurations, a pronounced H2 peak tailing was observed at detector temperatures above 700 ∘C together with higher H2 concentrations, indicating the intermediate storage and subsequent slow release of H2 from a storage near the electrodes. This tailing can be minimized, to a large extent, by operating the detector at temperatures of ≤ 650 ∘C and by reducing the storage sites near the measuring electrode of the SEC. The peak areas measured at different H2 concentrations and the detector temperature of 700 ∘C showed a satisfactory agreement with Faraday's law in the range of ϕ(H2)=0.4–100 ppmv. The resulting high detector stability enables calibration-free system operation over long periods of time for quantitative, high-precision measurements. The application of leakage detection requires qualitative measurements with a low limit of detection and can be addressed with that system as well.
The reduction in column length by a factor of 2 leads to the expected decrease in retention time by a factor of around 4. Additionally, the peak height and the SNR increase enable improved resolution at H2 concentrations below 1 ppmv. The reduction in the inner column diameter resulted in broadened peaks and overlap between H2 and O2 peaks. These columns require higher inlet pressures for comparable separation efficiency, which could not be provided with the system in use.
To enable system integration into a 19 in. (482.6 mm) rack, the main components for injection, separation, and detection were miniaturized. The newly developed injection systems manufactured by 3D printing and precision engineering exhibit low dead volumes, low leakage rates, and low peak broadening. The miniaturized column oven, based on a 3D-printed aluminium support for the GC columns, provides elevated heating and cooling rates which surpass the requirements of the tested chromatographic method. A successfully developed and tested miniaturized SEC detector enables H2 peak detection down to trace concentrations of < 10 vol.-ppm but requires further optimization, primarily of the electrode morphology, to increase the amount of detected analyte.
All data presented in the article are stored according to institutional requirements and, as such, are not available online. However, all data used in this paper will be made available by the authors upon request.
JZ, WO, and MM created the project concept and were also responsible for the funding acquisition. The methodology and proof of concept were developed by JZ and PS. PS improved the measurement setup, conducted experimental investigations and performed data analysis for characterizing sensor parameters. JZ and PS developed the miniaturized system prototypes, in close discussion with MW and OH, and successfully implemented the improvement and testing processes for the prototypes. MM supervised the work and was responsible for managing the project consortium. All authors contributed to the interpretation of the data and to the review and editing of the final paper.
The authors declare that they have no conflict of interest.
This article is part of the special issue “Dresden Sensor Symposium DSS 2019”. It is a result of the “14. Dresdner Sensor-Symposium”, Dresden, Germany, 2–4 December 2019.
The presented work was carried out within a research project funded by the German Bundesministerium für Bildung und Forschung (BMBF; grant no. 03ZZ0724A). The authors are responsible for the content and acknowledge the funding they received. Furthermore, the authors would like to thank CS-Chromatographie Service GmbH, Langerwehe, and ZIROX Sensoren & Elektronik GmbH, Greifswald, for their professional and device-related support.
This research has been supported by the German Bundesministerium für Bildung und Forschung (grant no. 03ZZ0724A).
This paper was edited by Thomas Scheper and reviewed by two anonymous referees.
Boon-Brett, L., Bousek, J., Black, G., Moretto, P., Castello, P., Hübert, T., and Banach, U.: Identifying performance gaps in hydrogen safety sensor technology for automotive and stationary applications, Int. J. Hydrog. Energ., 35, 373–384, https://doi.org/10.1016/j.ijhydene.2009.10.064, 2010.
Dagdougui, H.: Models, methods and approaches for the planning and design of the future hydrogen supply chain, Int. J. Hydrog. Energ., 37, 5318–5327, https://doi.org/10.1016/j.ijhydene.2011.08.041, 2012.
Edwards, P. P., Kuznetsov, V. L. and David, W. I. F.: Hydrogen energy, Philos. T. Roy. Soc. A, 365, 1043–1056, https://doi.org/10.1098/rsta.2006.1965, 2007.
Hosseini, S. E. and Wahid, M. A.: Hydrogen production from renewable and sustainable energy resources: Promising green energy carrier for clean development, Renew. Sustain. Energ. Rev., 57, 850–866, https://doi.org/10.1016/j.rser.2015.12.112, 2016.
Hübert, T., Boon-Brett, L., Palmisano, V., and Bader, M. A.: Developments in gas sensor technology for hydrogen safety, Int. J. Hydrog. Energ., 39, 20474–20483, https://doi.org/10.1016/j.ijhydene.2014.05.042, 2014.
Maroufmashat, A. and Fowler, M.: Transition of Future Energy System Infrastructure; through Power-to-Gas Pathways, Energies, 10, 1089, https://doi.org/10.3390/en10081089, 2017.
Mohapatra, A. and Tripathy, S.: A Critical Review of the use of Fuel Cells Towards Sustainable Management of Resources, IOP Conf. Ser. Mater. Sci. Eng., 377, 012135, https://doi.org/10.1088/1757-899X/377/1/012135, 2018.
Park, J.-H. and Blumenthal, R. N.: Electronic Transport in 8 Mole Percent Y2O3-ZrO2, J. Electrochem. Soc., 136, 2867–2876, 1989.
Pasman, H. J.: Challenges to improve confidence level of risk assessment of hydrogen technologies, Int. J. Hydrog. Energ., 36, 2407–2413, https://doi.org/10.1016/j.ijhydene.2010.05.019, 2011.
Ramachandran, R.: An overview of industrial uses of hydrogen, Int. J. Hydrog. Energ., 23, 593–598, https://doi.org/10.1016/S0360-3199(97)00112-2, 1998.
Ruchets, A., Donker, N., Schönauer-Kamin, D., Moos, R., Zosel, J., Guth, U., and Mertig, M.: Selectivity improvement towards hydrogen and oxygen of solid electrolyte sensors by dynamic electrochemical methods, Sens. Actuat. B, 290, 53–58, https://doi.org/10.1016/j.snb.2019.03.063, 2019.
Schelter, M., Zosel, J., Oelßner, W., Guth, U., and Mertig, M.: A solid electrolyte sensor for trace gas analysis, Sens. Actuat. B, 187, 209–214, https://doi.org/10.1016/j.snb.2012.10.111, 2013.
Schelter, M., Zosel, J., Vashook, V., Guth, U., and Mertig, M.: Electrolyte related parameters of coulometric solid state devices, Solid State Ion., 288, 266–270, https://doi.org/10.1016/j.ssi.2016.01.020, 2016.
Sinigaglia, T., Lewiski, F., Santos Martins, M. E., and Mairesse Siluk, J. C.: Production, storage, fuel stations of hydrogen and its utilization in automotive applications-a review, Int. J. Hydrog. Energ., 42, 24597–24611, https://doi.org/10.1016/j.ijhydene.2017.08.063, 2017.
Sood, P., Zosel, J., Oelßner, W., Mertig, M., Woratz, M., and Herrmann, O.: Development and characterization of a highly selective hydrogen sensor system, in: Sensoren für eine moderne Wasserstoffwirtschaft, Association for Sensors and Measurement, Nürnberg, Germany, 264–270, 2019.
Teske, K., Popp, P., and Baumbach, J.: Solid-state coulometric cell as detector for gas chromatography, J. Chromatogr. A, 360, 417–420, https://doi.org/10.1016/S0021-9673(00)91690-X, 1986.