the Creative Commons Attribution 4.0 License.
the Creative Commons Attribution 4.0 License.
 | 11 Nov 2020
Glass electrode half-cells for measuring unified pH in ethanol–water mixtures
Agnes Heering
Frank Bastkowski
Steffen Seitz
The acidities of any given solvent or mixtures thereof can be compared by pH measurements on a unified scale, so-called pH measurements. The method is quite new and has not been characterized with respect to metrological criteria to date. Metal solid-contact glass electrode half-cells, three commercial, conventional glass electrode half-cells with inner liquid filling and one pair of combined electrodes were used to investigate the stability of the measurement and the reproducibility of pH results of ethanol mixtures with water. All electrodes are suitable for unified acidity measurements in standard aqueous buffers. In ethanol mixtures, the combined electrodes were found to be unsuitable. The half-cell electrodes can be reasonably used only in buffered solutions.
- Article
(820 KB) - Full-text XML
-
Supplement
(267 KB) - BibTeX
- EndNote


pH is an important measurand to monitor or control many processes in chemical industry. pH measurement in non-aqueous solvents has several problems, and interpretation of obtained pH values is complicated. Because of the significant dependence of proton activity on the solvent, every medium has its own pH scale. Thus, pH values measured in different solvents cannot be compared with respect to the actual acidity/alkalinity of the solutions. For instance, a pH of 7 in water indicates neutrality, while acetonitrile having a pH of 7 is acidic. Unified pH (pHabs) (Himmel et al., 2010) allows direct comparison of acidities in all media and is measured potentiometrically (Suu et al., 2015) by measuring directly the potential between two glass electrode half-cells.
The unified acidity scale uses an ideal proton gas as a theoretical, but universal reference point with its absolute chemical standard potential is set to zero. In solutions, the chemical potential of the proton is reduced by interaction with its environment which defines the pH scale of a specific solution (Himmel et al., 2010). However, the scales of different solutions can be related to each other through their common reference to the proton gas. Thus, their respective acidities can be compared if the pH values are transferred to this common, unified pH scale.
Since the aqueous pH scale is the most important, the pH value (Suu et al., 2015) was defined to align the zero values of the pHabs scale and the conventional aqueous pH scale (Eq. 1).
where R is the molar gas constant, T is the absolute temperature and is Gibbs energy of solvation of the proton in solvent. A more detailed explanation is given in a recent review (Himmel et al., 2018).
One of the biggest problems of potentiometry is the unknown potential drop at the liquid junction, called liquid junction potential (Anon, 2019). Recently, it was shown that liquid junction potentials of even different solvents cancel out (Ermantraut et al., 2018; Radtke et al., 2018) if an almost ideal ionic liquid is used. This means that we do not have to measure or estimate the liquid junction potential in our experiments if we use the ionic liquid mentioned in the reference.
It was also shown that the measured pH values in water do not depend on the used cell and instrument (Heering et al., 2020). However, all unified acidities have been measured in non-aqueous systems only with rather special metal solid-contact glass electrode half-cells (Beliustin et al., 1992) until now. The work on unified pH started with metal solid-contact electrodes, because these electrodes performed better in water than other electrodes that were tested (Suu, 2013), and similar glass electrodes filled with mercury worked well in DMSO (Koppel et al., 1977; Kütt et al., 2008). These electrodes give stable and reproducible signals in non-aqueous solvents and their mixtures with water. From a metrological perspective it is however desirable that a measurand does not depend on the instrument used to measure it.
These metal solid-contact electrodes are not common and therefore are difficult to obtain. A few years ago, the Laboratory of Glass Electrochemistry at St. Petersburg State University stopped the production of these electrodes. Currently, they can only be bought from one company. It is unknown which electrodes can be used instead to measure unified acidities and how they perform.
Therefore, we investigated the reproducibility of unified pH measurement results with liquid-filled electrodes from different manufacturers that are designed for non-aqueous solutions and that are commonly available. It was expected that these non-aqueous electrodes are more suitable compared to electrodes from the same manufactures that are designed for aqueous solutions. Moreover, liquid-filled electrodes were tested as alternatives to the metal solid-contact electrodes because this type of electrode is the most common one.
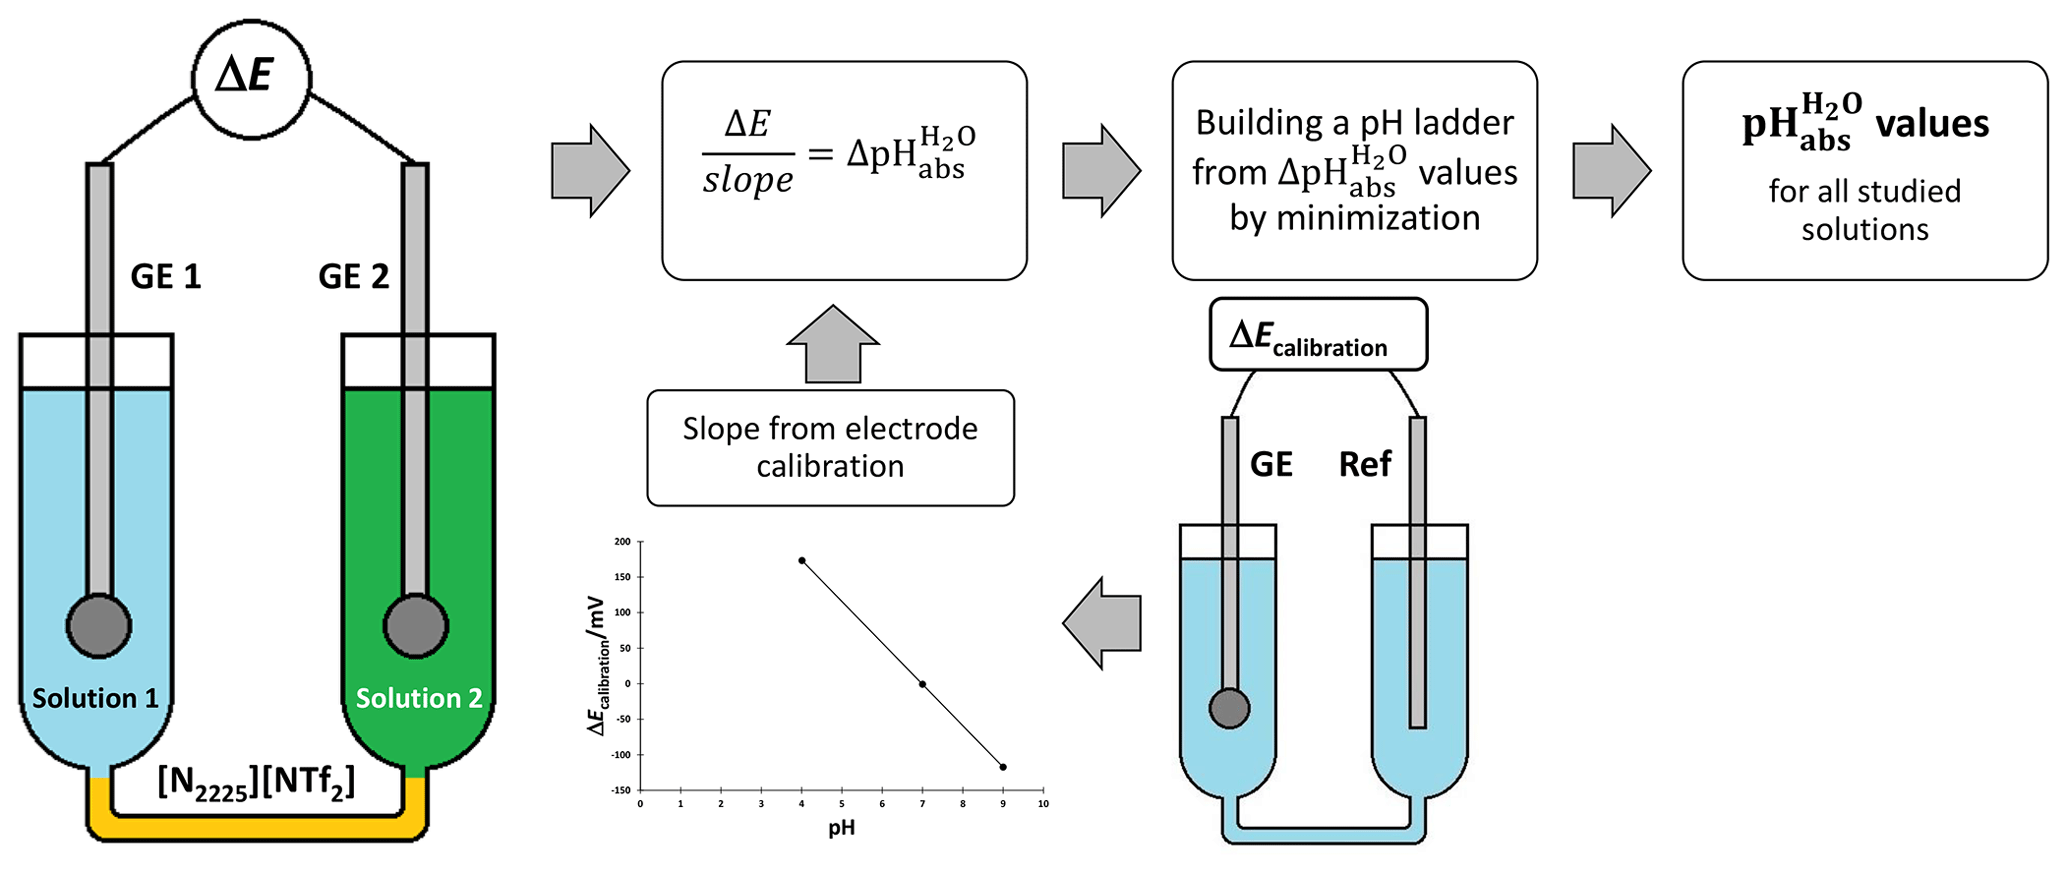
Glass electrode (GE) potential is directly connected to the activity of H+ ion in a solution. By measuring the differences in potentials of glass electrodes, we get the difference in acidities. These acidity differences are used to assign pH values. The method is outlined in Fig. 1.
The potential ΔE measured between two glass electrodes GE 1 and GE 2 is converted into with Eq. (2):
where slopeaverage is the average slope of the two electrodes. Slopes and intercepts are obtained by measuring the potential of an electrode against a reference electrode in aqueous standard buffers using the setup shown in Fig. 1.
A so-called ladder approach (Heering et al., 2020; Suu et al., 2015) is used to assign pH values to the measured solutions based on measured values between different combinations of the solutions in the cell. pH values are calculated by applying a least-squares minimization technique to the measured values. The consistency standard deviation, s, of the pH ladder is used to evaluate the mismatch between the measured and assigned pH values. In the case of validation with standard buffers, the pH 7 was used as an anchor point (fixed reference pH value) of the pH ladder during the minimization process. In the case of ethanol mixtures, buffers with pH 7 and pH 4 were used as anchor points. The consistency standard deviation is the main characteristic to evaluate the suitability of electrodes. It is affected by the repeatability and the stability of the signal.
An example of such a ladder is shown in Table 1, which shows the measured values of typical aqueous standard buffers (borate, phosphate and phthalate), the assigned pH values and, for comparison, the certified pH values provided by the manufacturer. Table 1 shows the worst results obtained, which are still acceptable.
Table 1The pH ladder with aqueous standard buffers measured with electrode pair A. Each value was measured twice for repeatability.

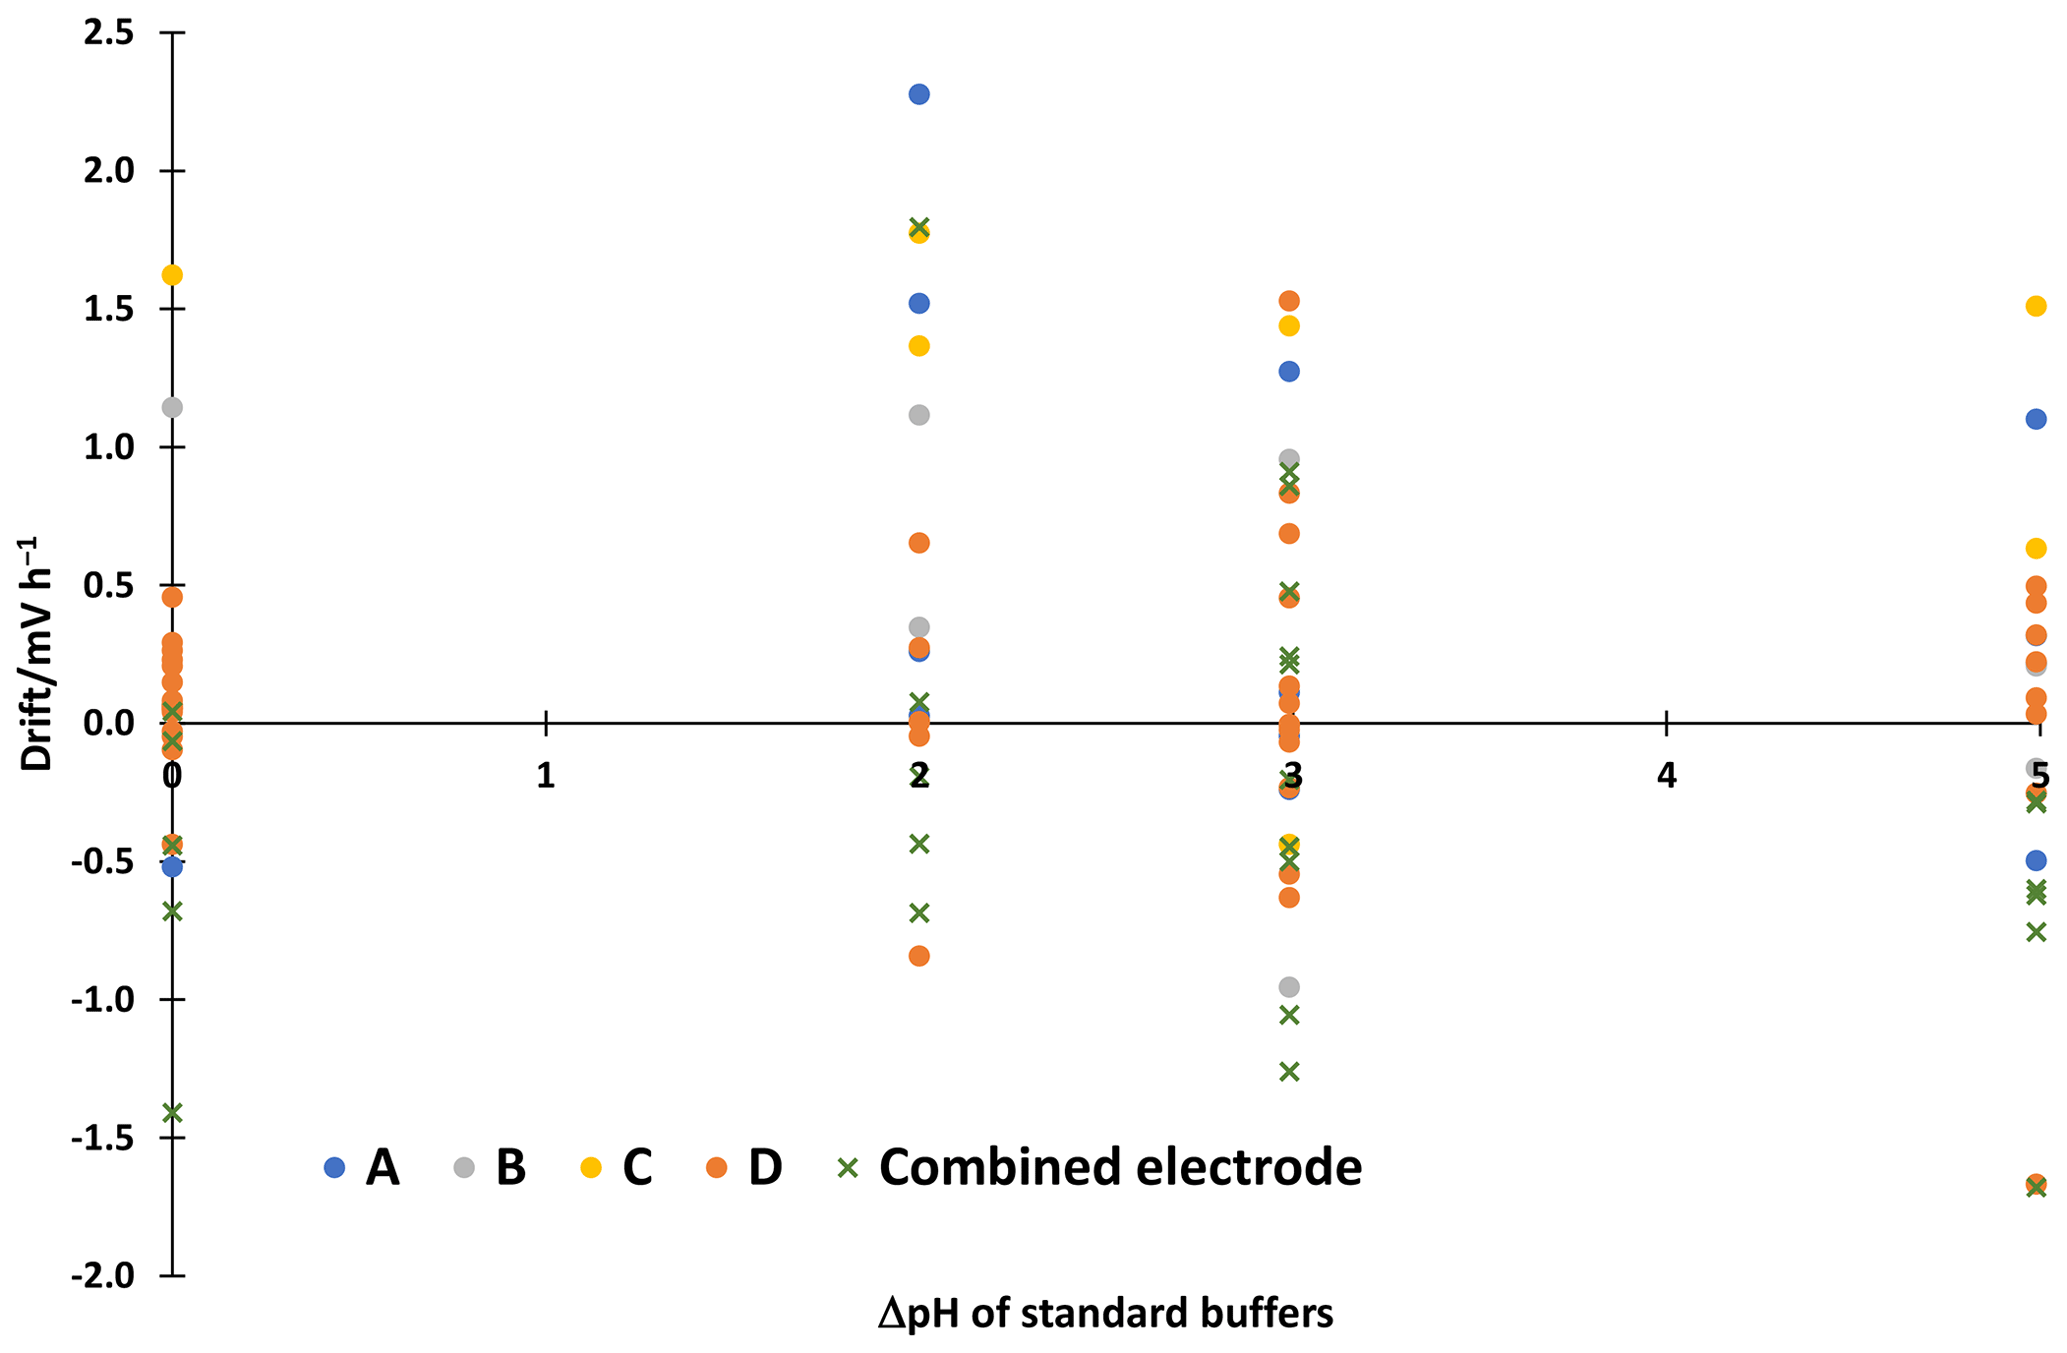
Figure 2Linear drift of potential measured in cell GE 1|aqueous buffer 1|[N2225][NTf2]|aqueous buffer 2|GE 2 for 30 to 60 min. A point represents a single measurement.
The used ionic liquid triethylpentylammonium bis(trifluoromethanesulfonyl)imide [N2225][NTf2] was from Iolitec GmbH (Heilbronn, Germany). The rest of the chemicals were also commercial products: aqueous standard buffers with pH 9.00, 7.00 and 4.01 (Certipur®, Merck), ethanol (≥99.9 %, absolute for analysis EMSURE® ACS, ISO, Reag. Ph. Eur., Merck; ≥99.5 %, absolute for analysis EMPARTA® ACS, Merck; min. 99.8 %, AnalaR NORMAPUR® analytical reagent, VWR Chemicals), ammonium formate (≥99 %, HiPerSolv CHROMANORM® for LC-MS, VWR Chemicals) and LiCl (≥99 %, for analysis EMSURE® ACS, Reag. Ph. Eur., Merck). Distilled water was used for solutions. The pH was measured in aqueous mixtures of ethanol. All solutions were prepared gravimetrically. Aqueous standard buffers with pH 4.01, 7.00 and 9.00 were used for validation.
A Keysight B2987A Electrometer/High Resistance Meter with Quick IV Measurement Software was used to measure the cell potentials. A glass cell with water jacket was used to stabilize the temperature of the investigated half-cells. It was made by Gebr. Rettberg GmbH (Göttingen, Germany). A LAUDA Proline RP845 was used to keep temperature constant at 25.0 ∘C.
A Metrohm 6.0750.100 Ag / AgCl 3 M KCl reference electrode was used for calibration of half-cell electrodes. Two electrodes of each manufacturer were used. Table 2 gives an overview of the electrodes. Half-cell electrodes from the same source are paired, and the pairs are randomly identified by letters A–D. Between experiments, the metal solid-contact electrodes were stored in phthalate buffer and the other electrodes were stored in storage solutions provided by the manufacturers.

In the case of combined electrodes, for pH measurements only the signal from the glass electrode part was used. All measurements were done without a Faraday cage. Reading was taken every 10 s, and the average of the measurements from 1800 to 3600 s was taken as the result. Measurement was started after filling the cell with solutions under investigation and inserting the electrodes. Test showed that usually reading stabilizes around 900 to 1800 s. Therefore, the first half an hour was left for the potential and temperature to equilibrate to ensure a stable reading.
The used cell was the same as in Heering et al. (2020), i.e. cell (I):
In the case of electrodes A, a correction was made to take into account the larger difference in intercepts (Eq. 3):
where Int1 and Int2 are the intercepts of the electrodes. For other electrodes, the correction did not significantly affect the results. The full equation that takes also into account the differences in slopes is given as Eq. (4) for the sake of completeness, even though it was not used here.
Ideally, every solution pair would be measured twice with the electrodes switched; hence, the difference in intercepts and slopes would cancel out. This unfortunately doubles the workload. The need for correction for A electrodes comes from the large differences of slope and intercept of the two electrodes used. If more similar electrodes are paired, there is no need for a correction.
All electrodes give acceptable results in standard aqueous buffers with differences from the reference values usually within ±0.05 in pH. The electrode pair A shows a slightly larger deviation for the phthalate buffer with 3.93 instead of 4.01, which is however still acceptable. The consistency standard deviations of the scales are 0.01 to 0.03 in pH. The correction with intercepts improved the consistency standard deviation of the electrode pair A pH ladder from 0.06 to 0.03. More detailed results of the other electrodes are given in the supplementary material. All electrodes give a similar stability of the reading. The linear drifts in the 30–60 min interval are shown in Fig 2. The drift is 2.3 mV h−1 at maximum. This corresponds to a change in ΔpH of about 0.04, which is small compared to the uncertainty of liquid junction potential cancellation assumption, which is 6.3 mV or around 0.11 in pH.

Figure 4Stability of potential measured in cell GE 1|80 wt % EtOH|[N2225][NTf2]|50 wt % EtOH|GE 2 for 1 h. (a) Without additives and (b) with 10 mM ammonium formate.
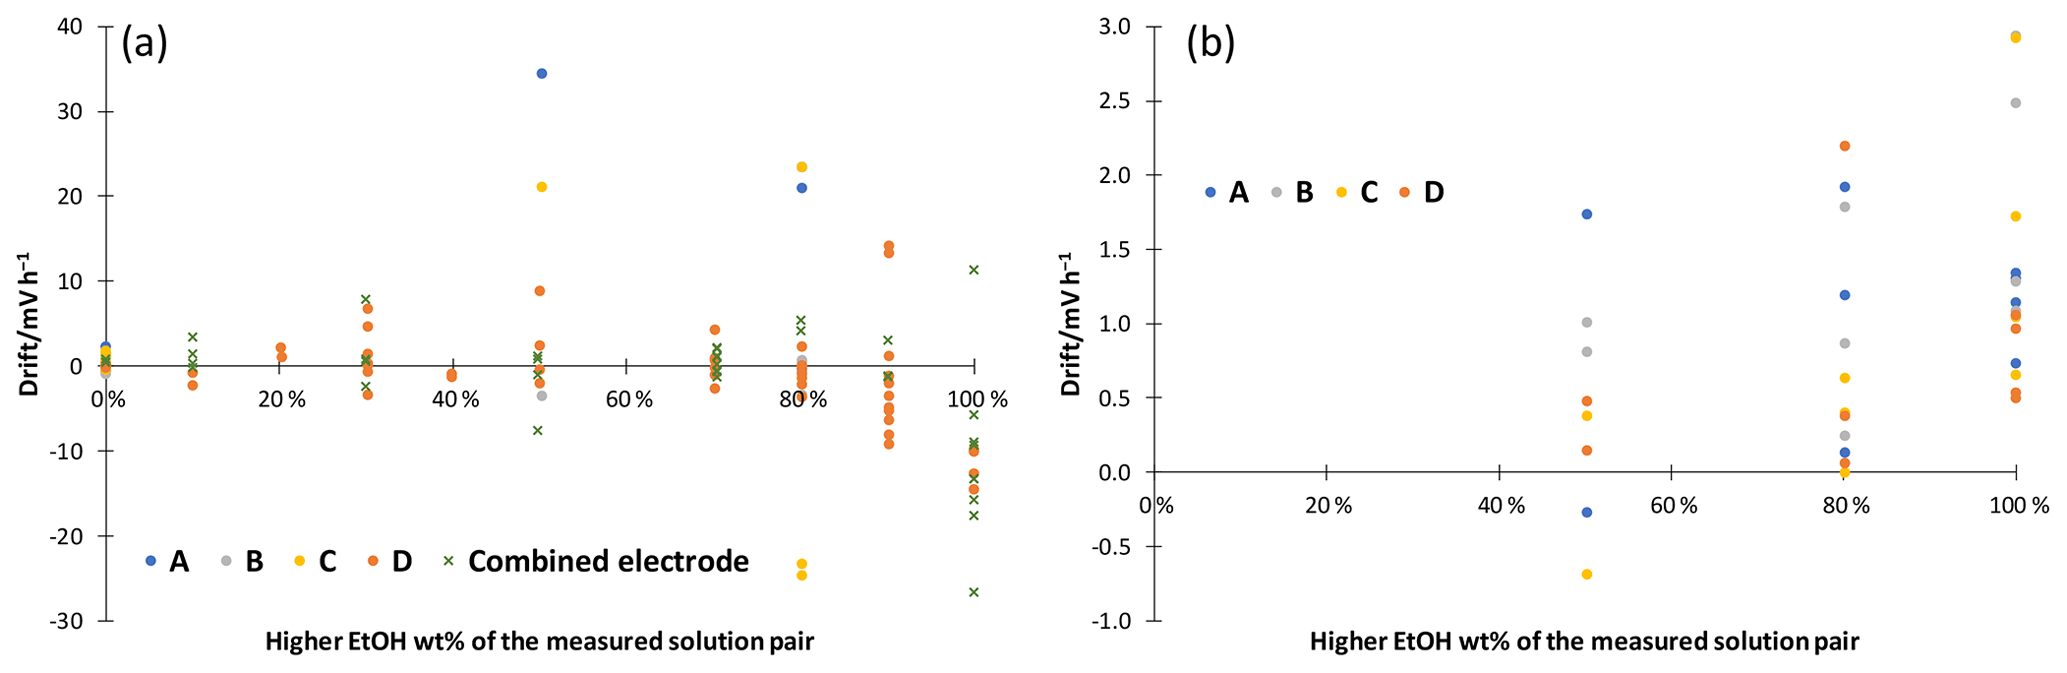
Figure 5Linear drift of potential measured in cell GE 1|solution 1|[N2225][NTf2]|solution 2|GE 2 for 30 to 60 min. (a) Without additives; (b) with 10 mM ammonium formate. A point represents a single measurement.
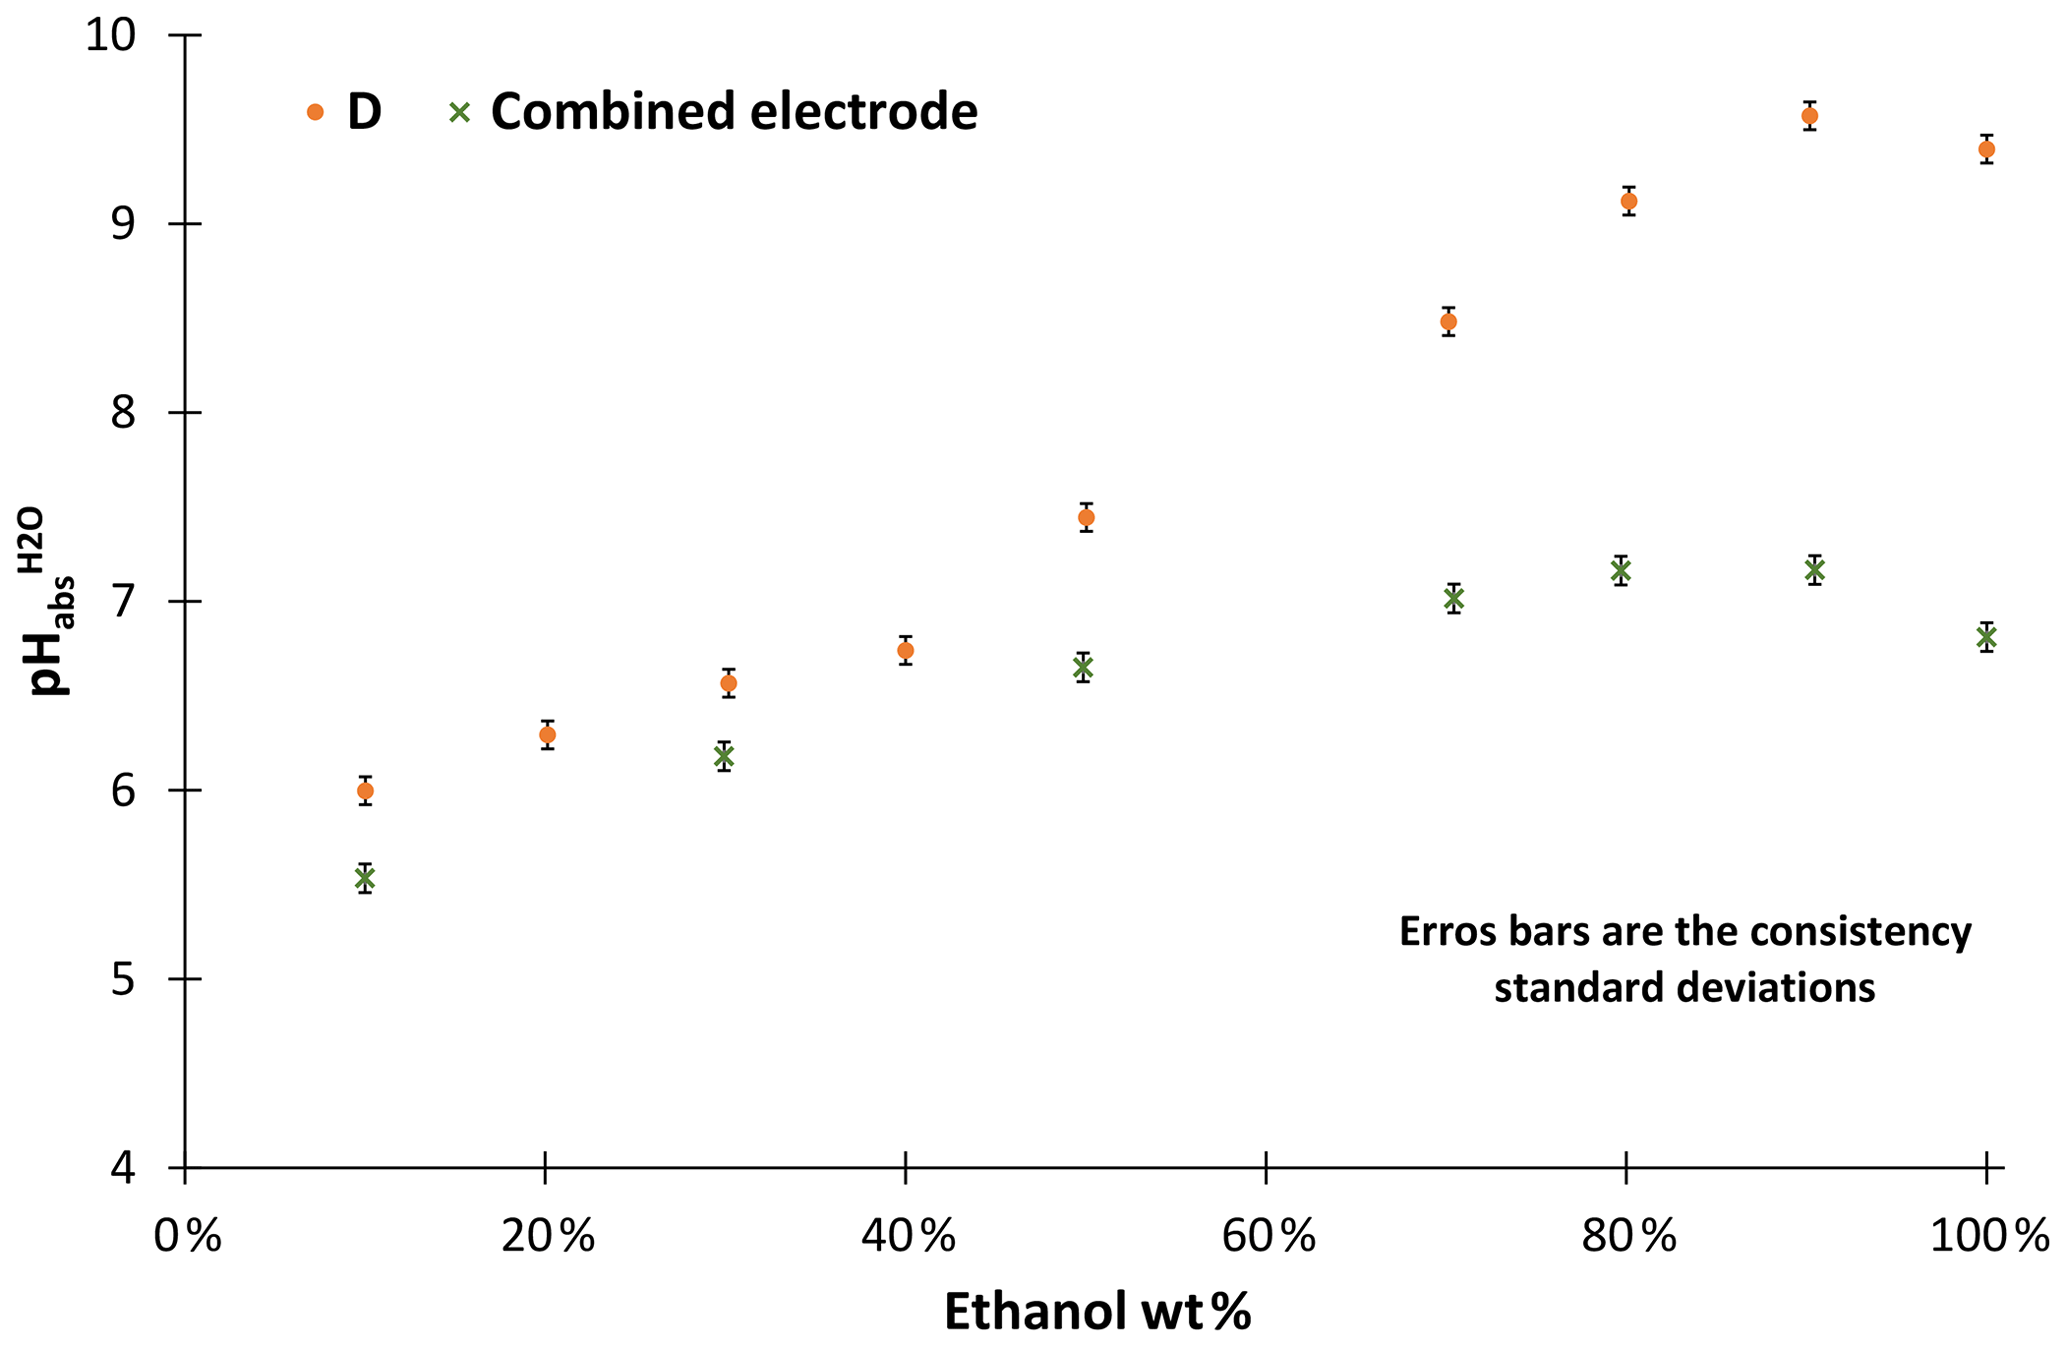
Our investigations have shown that combined electrodes are not suitable for pH measurements in ethanol–water mixtures. The acidities of unbuffered ethanol mixtures were measured with combined electrodes and compared with the results obtained with the metal solid-contact electrodes we used as a reference (D in Fig. 3). The ethanol used for the solutions was from the same source. Combined electrodes suffer from a leakage of KCl into the ethanol–water mixture, which is necessary since this provides connection to the inner reference electrode (not used in these measurements). The leaking KCl results in changing the composition of the test solutions and at higher ethanol concentrations KCl precipitation in the cell. This leakage causes the measured pH values of the basic solutions to level off. Thus, water-organic solutions cannot reasonably be measured with combined electrodes. Consequently, no further measurements have been conducted with combined electrodes.
The stability of ethanol–water mixtures without additives (Fig. 4, left) is not as good as in standard buffers. Although the electrodes are meant for non-aqueous solvents, they give a quite unstable reading, when used in the investigated cell I. First, the signal changes nonlinearly. After about 30 min, the signal reaches a stable drift where it changes approximately linearly. Figure 5 illustrates the drift in the linear stage for various ethanol–water mixtures. The linear drift can be more than 30 mV h−1 in the 30–60 min interval depending on the pair of solvents measured and the electrodes. B and D give a more stable reading than A and C. Both positive and negative drifts were observed. The dependence of the reading stability on the ethanol content was more thoroughly investigated with electrodes D. Up to 80 wt % ethanol there is no change in stability, but at higher ethanol content the reading is less stable. The stability problems lead to differences of more than 1 pH unit in the assigned pH values (Table 3).
Table 3The obtained pH values of the ethanol–water mixtures with and without buffering.
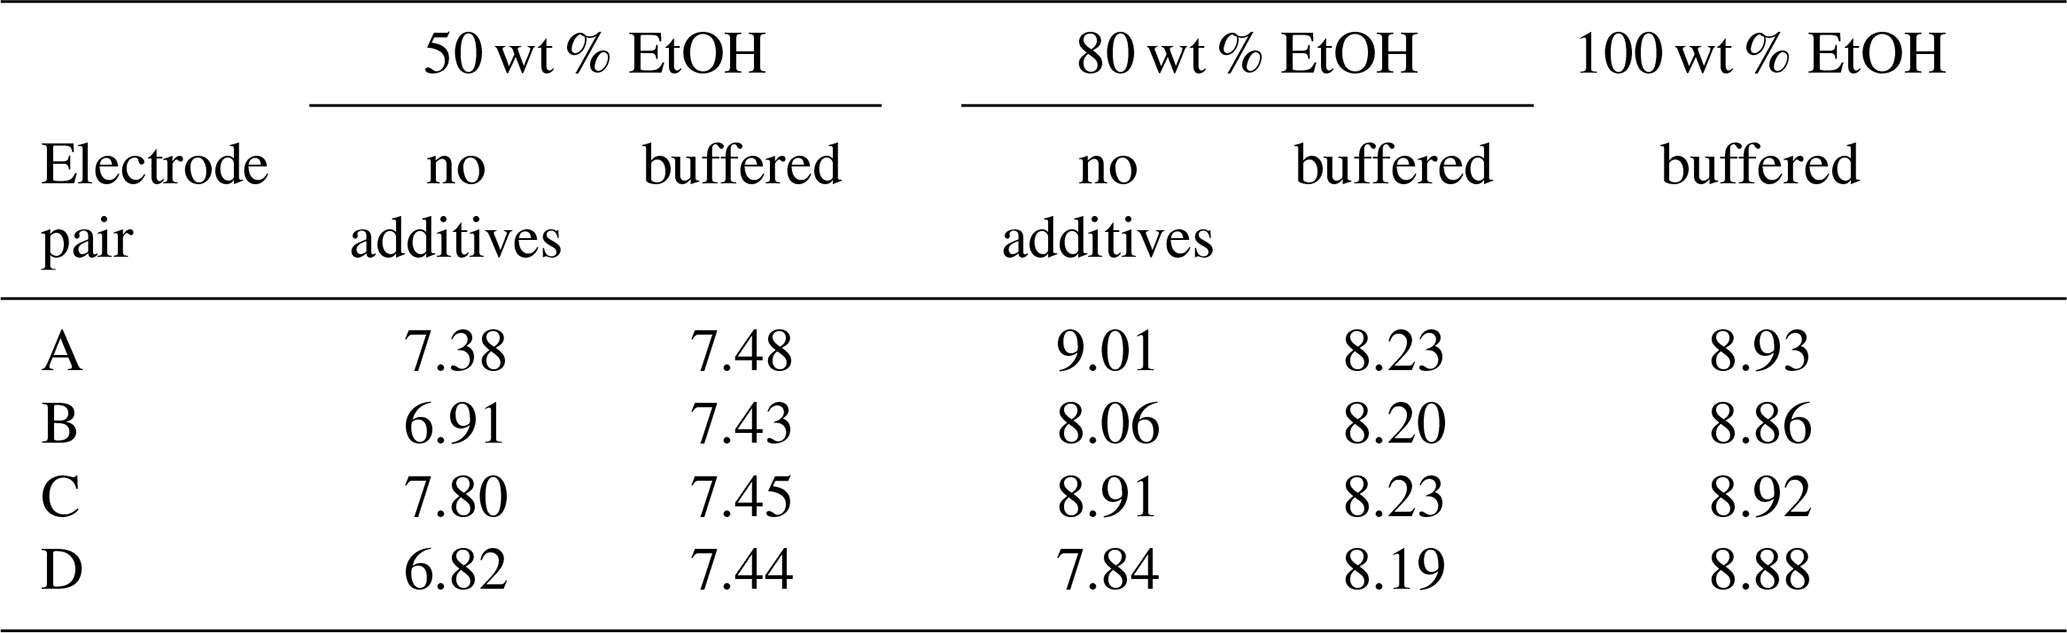
The unbuffered measurements shown in Table 3 were all done with the same source of ethanol, but this was not the bottle used for measurements of Fig. 3. Results with D electrodes vary a lot between these two ethanol sources. These solutions have low conductivity and buffer capacity. Due to the low buffer capacity, the inhomogeneity of ethanol from different sources leads to large differences in acidity. Low conductivity is another reason why reading is unstable with high ethanol content. These problems can be overcome by adding salts.
Neutral salts, LiCl and [N2225][NTf2] were tested at two concentration levels. Stability improved, but acidity results with ethanol from different source did still not match. LiCl addition reduced the drift of pure ethanol to a level of 10 mV h−1, and addition of [N2225][NTf2] gave similar results compared to ammonium formate; 10 mM ammonium formate buffers were prepared to improve the stability and reproducibility of the reading. A stable reading was reached after about 5 to 10 min (Fig. 4, right), and the drift was reduced to less than 3 mV h−1 for all electrodes (Fig. 5, right). Buffering also solved the ethanol inhomogeneity problem. The buffered solutions were made with ethanol from two sources, and the results were in good agreement. The measured ladders are given in the Supplement. If the acidity of a pure solvent without additives is needed, then measurements at different concentrations must be done and the results must be extrapolated to zero concentration.
The electrodes behave similarly in buffered aqueous ethanol mixtures as they did in standard aqueous buffers. The maximum difference in the obtained pH values is 0.07 pH units, and standard deviation is 0.03. The results with buffered ethanol mixtures are shown in Table 3.
All tested electrodes are suitable for pH measurements in standard aqueous buffers. In ethanol mixtures, the combined electrodes were found to be unsuitable and the half-cell electrodes can be reasonably used only in buffered ethanol–water mixtures, providing a standard deviation of obtained pH values around 0.03. The next step is to test the electrodes in methanol and acetonitrile. It is expected that electrodes will behave similarly in methanol, even though there might be larger differences in electrode stability in acetonitrile solutions.
Data sets are available at https://doi.org/10.5281/zenodo.4266452 (Heering, 2020).
The supplement related to this article is available online at: https://doi.org/10.5194/jsss-9-383-2020-supplement.
AH carried out experiments and prepared the manuscript with contributions from FB and SS.
The authors declare that they have no conflict of interest.
This research was funded by the EMPIR programme (project 17FUN09), co-financed by the participating states, and by
the European Union's Horizon 2020 research and innovation programme.
This open-access publication was funded
by the Physikalisch-Technische Bundesanstalt.
This paper was edited by Jens Zosel and reviewed by two anonymous referees.
Anon: Liquid junction, IUPAC, Compend. Chem. Terminol., 2nd Edn. (the “Gold Book”), https://doi.org/10.1351/goldbook.L03584, 2019.
Beliustin, A. A., Pisarevsky, A. M., Lepnev, G. P., Sergeyev, A. S., and Shultz, M. M.: Glass electrodes: a new generation, Sensors Actuat. B, 10, 61–66, https://doi.org/10.1016/0925-4005(92)80012-M, 1992.
Ermantraut, A., Radtke, V., Gebel, N., Himmel, D., Koslowski, T., and Leito, I.: The ideal ionic liquid salt bridge for direct determination of Gibbs Energies of transfer os single ions, part II: Evaluation of the role of ion solvation and ion mobilities, Angew. Chemie Int. Ed., 57, 2348–2352, https://doi.org/10.1002/anie.201707334, 2018.
Heering, A.: Dataset for Glass electrode half-cells for measuring unified pH in ethanol-water mixtures [Data set], Journal of Sensors and Sensor Systems, Zenodo, https://doi.org/10.5281/zenodo.4266452, 2020.
Heering, A., Stoica, D., Camoes, F., Anes, B., Nagy, D., Nagyné Szilágyi, Z., Quendera, R., Ribeiro, L., Bastkowski, F., Born, R., Nerut, J., Saame, J., Lainela, S., Liv, L., Uysal, E., Roziková, M., Vič, M., and Leito, I.: Symmetric potentiometric cells for the measurement of unified pH values, Symmetry, 12, 1150, https://doi.org/10.3390/sym12071150, 2020.
Himmel, D., Goll, S. K., Leito, I., and Krossing, I.: A unified pH scale for all phases, Angew. Chemie Int. Ed., 49, 6885–6888, https://doi.org/10.1002/anie.201000252, 2010.
Himmel, D., Radtke, V., Butschke, B., and Krossing, I.: Basic Remarks on Acidity, Angew. Chemie Int. Ed., 57, 4386–4411, https://doi.org/10.1002/anie.201709057, 2018.
Koppel, I., Maretskaya, L., Koppel, J., and Pihl, V.: Acidity of aliphatic-alcohols in dimethylsulfoxide, Org. React., 14, 81–87, 1977.
Kütt, A., Movchun, V., Rodima, T., Dansauer, T., Rusanov, E. B., Leito, I., Kaljurand, I., Koppel, J., Pihl, V., Koppel, I., Ovsjannikov, G., Toom, L., Mishima, M., Medebielle, M., Lork, E., Röschenthaler, G.-V., Koppel, I. A., and Kolomeitsev, A. A.: Pentakis(trifluoromethyl)phenyl, a sterically crowded and electron-withdrawing group: synthesis and acidity of pentakis(trifluoromethyl)benzene, -toluene, -phenol, and -aniline, J. Org. Chem., 73, 2607–2620, 2008.
Radtke, V., Ermantraut, A., Himmel, D., Koslowski, T., and Leito, I.: The Ideal Ionic Liquid Salt Bridge for the Direct Determination of Gibbs Energies of Transfer of Single Ions, Part I: The Concept, Angew. Chemie Int. Ed., 57, 2344–2347, https://doi.org/10.1002/anie.201707333, 2018.
Suu, A.: Experimental realization of the unified pH scale, University of Tartu, Tartu, 2013.
Suu, A., Jalukse, L., Liigand, J., Kruve, A., Himmel, D., Krossing, I., Rosés, M., and Leito, I.: Unified pH Values of Liquid Chromatography Mobile Phases, Anal. Chem., 87, 2623–2630, https://doi.org/10.1021/ac504692m, 2015.