the Creative Commons Attribution 4.0 License.
the Creative Commons Attribution 4.0 License.
 | 18 Dec 2020
Metrological characterization and calibration of thermographic cameras for quantitative temperature measurement
Berndt Gutschwager
Richard Dieter Taubert
Jörg Hollandt
We present the metrological characterization and calibration of three different types of thermographic cameras for quantitative temperature measurement traceable to the International Temperature Scale (ITS-90). Relevant technical specifications – i.e., the non-uniformity of the pixel-to-pixel responsivity, the inhomogeneity equivalent temperature difference (IETD), the noise equivalent temperature difference (NETD), and the size-of-source effect (SSE) – are determined according to the requirements given in the series of Technical Directives VDI/VDE 5585. The measurements are performed with the camera calibration facility of the Physikalisch-Technische Bundesanstalt. The data reference method is applied for the determination and improvement of the non-uniformity, leading to an improved IETD for all three cameras. Finally, the cameras are calibrated according to the different procedures discussed in the VDI/VDE 5585 series. Results achieved with the different calibration procedures are compared for each type of camera and among the three cameras. An uncertainty budget for the calibration of each camera is given according to GUM (ISO, 1995) and VDI/VDE 5585.
- Article
(3200 KB) - Full-text XML
- BibTeX
- EndNote


In non-contact temperature measurement thermographic cameras are rapidly gaining importance as they are becoming more and more effective and cost-efficient, due to significantly improved IR detector arrays (Budzier and Gerlach, 2011; Vollmer and Möllmann, 2010). While they are still being used mainly for qualitative temperature measurement, e.g., in maintenance, surveillance, security, and energy-saving applications, there is a clear trend that they are also progressively being used for quantitative temperature measurement monitoring and controlling industrial production processes. The metrological characterization and calibration of thermographic cameras are more complex than for spot-measuring radiation thermometers, which are still the most frequently used measuring instruments for quantitative non-contact temperature measurements. Whereas the metrologically relevant technical specifications of radiation thermometers as well as their traceable calibration are laid down in national and international standards (VDI/VDE 3511 Part 4.3, 2005; VDI/VDE 3511 Part 4.4, 2005; DIN IEC/TS 62492-2, 2014), definitions and standardized procedures for the determination of the relevant technical specifications of thermographic cameras and their traceable calibration have just been settled.
The German standardization committee VDI/VDE FA 8.16 Temperature Measurement with Thermal Imagers published Technical Directive VDI/VDE 5585 Part 1 Metrological Characterization of Thermographic Cameras (VDI/VDE 5585 Part 1, 2018) in March 2018. This is now being extended into an IEC Technical Specification by the international standardization committee IEC SC65B WG5 Temperature Sensors. Currently Technical Directive VDI/VDE 5585 Part 2 Calibration of Thermographic Cameras (VDI/VDE 5585 Part 2, 2020) is in the process of completion. Part 2 specifies in detail different calibration methods of thermographic cameras and the related measurement uncertainties.
PTB has developed a measuring facility for the metrological characterization and calibration of thermographic cameras for quantitative temperature measurement which meets all requirements of the VDI/VDE 5585 and is strictly traceable to ITS-90. Furthermore, with the data reference method (DRM) PTB has developed a fast and accurate method to determine the non-uniformity of the pixel-to-pixel response of a thermographic camera. For three different types of thermographic cameras we apply the PTB facility for the quantitative metrological characterization and calibration of these cameras according to Technical Directives VDI/VDE 5585. Additionally, the DRM is used to demonstrate the capability of this method in significantly improving the non-uniformity determination of thermographic cameras and, subsequently, also improving their inhomogeneity equivalent temperature difference (IETD). The achieved results for each measured technical specification of the different types of cameras are compared. All three methods of calibration described in VDI/VDE 5585 Part 2 (2020) are performed with each camera. The results of the different calibration methods are compared for each camera under the aspect of the achieved calibration uncertainty.
2.1 Camera calibration facility
Table 1Technical specifications of the radiation sources used in this work.


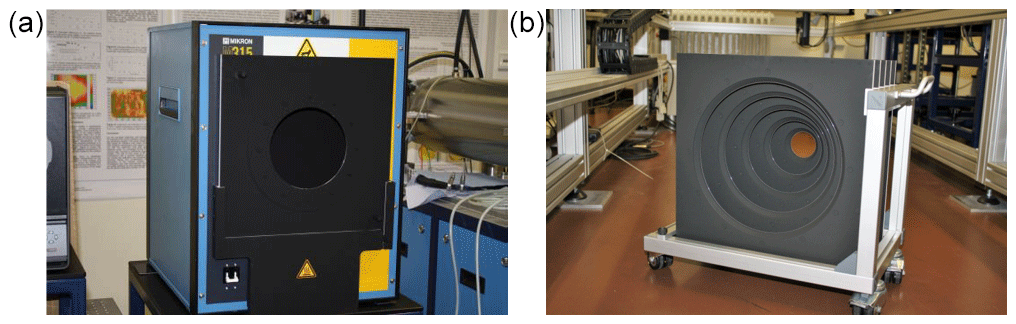
Figure 3Photo of the plate radiator (a) with exchangeable apertures (b) for SSE measurements.
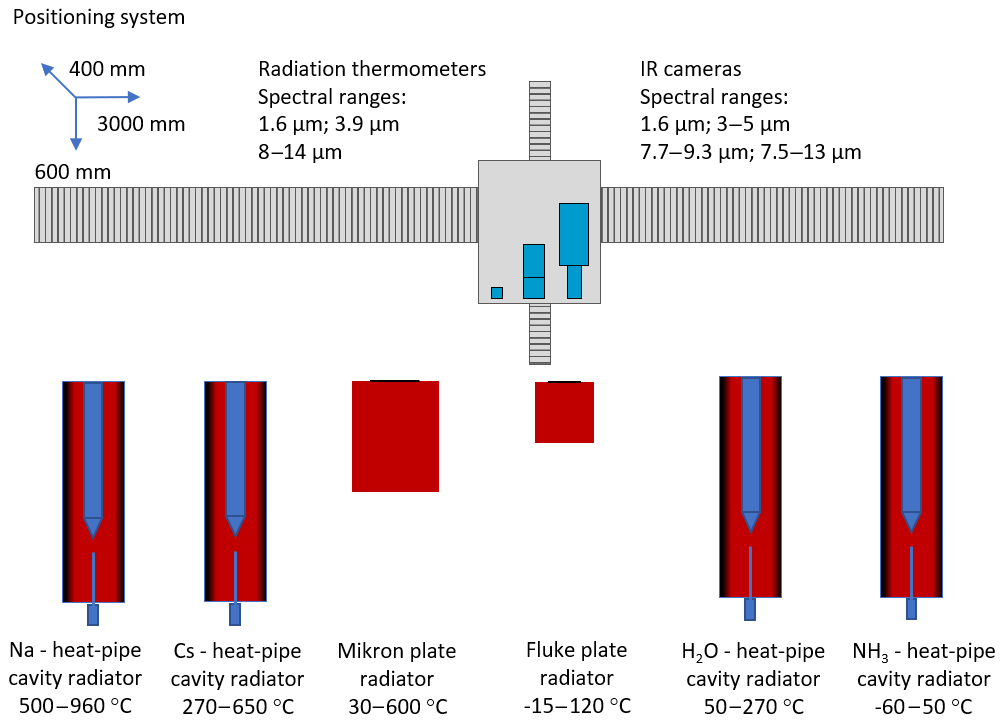
The camera calibration facility of PTB takes into account the specific technical requirements for the metrological characterization of thermographic cameras. The calibration facility is operated in a laboratory room with controlled air temperature and air humidity. The temperature control operates in a range from 18 to 30 ∘C with a stability of ± 1 ∘C. The relative air humidity can be adjusted over a range from 25 % to 60 % with a stability of ± 2 %. A schematic of the measuring facility is shown as a drawn plan view in Fig. 1. The characterization and calibration of thermographic cameras are carried out with the aid of heat-pipe cavity radiators and plate radiators of known radiance temperature which are installed side by side (Gutschwager et al., 2015a, b). The measuring facility includes four heat-pipe cavity radiators, which completely cover the temperature range from −60 to 962 ∘C. The temperature of the heat-pipe cavity radiators is measured according to the ITS-90 via a standard platinum resistance thermometer (SPRT) positioned very close to the bottom of the cavity and in good thermal contact with the heat transfer agent. The heat-pipe cavity radiators provide temperature radiation with state-of-the-art uncertainties. Typical uncertainties are shown in Müller et al. (2018). However, their apertures begin at 30 mm and are limited to a maximum of 75 mm. Therefore, the calibration facility operates, additionally, two commercial plate radiators in the temperature range of −15 to 600 ∘C. Plate radiators have larger radiating areas of up to 300 mm × 300 mm. The radiance temperature of the plate radiators is measured traceable to the ITS-90 via high-quality radiation thermometers comparable with the heat-pipe cavity radiators. Technical details on the applied radiation sources are given in Table 1. For its metrological characterization and calibration, the thermographic camera is precisely positioned in front of a radiation source with an automated x–y–z positioning system. The system has a mechanical reproducibility of 100 µm. Figure 2 shows a section of the calibration facility with a radiation thermometer and a thermographic camera placed on the positioning system. To measure the size-of-source effect (SSE) of thermographic cameras, a set of exchangeable apertures is used. These apertures can be placed in front of the largest plate radiator to measure the SSE in the temperature range from 30 to approx. 300 ∘C (Fig. 3).
2.2 Thermographic cameras
Table 2Technical specifications of investigated thermographic cameras given by the manufacturer.
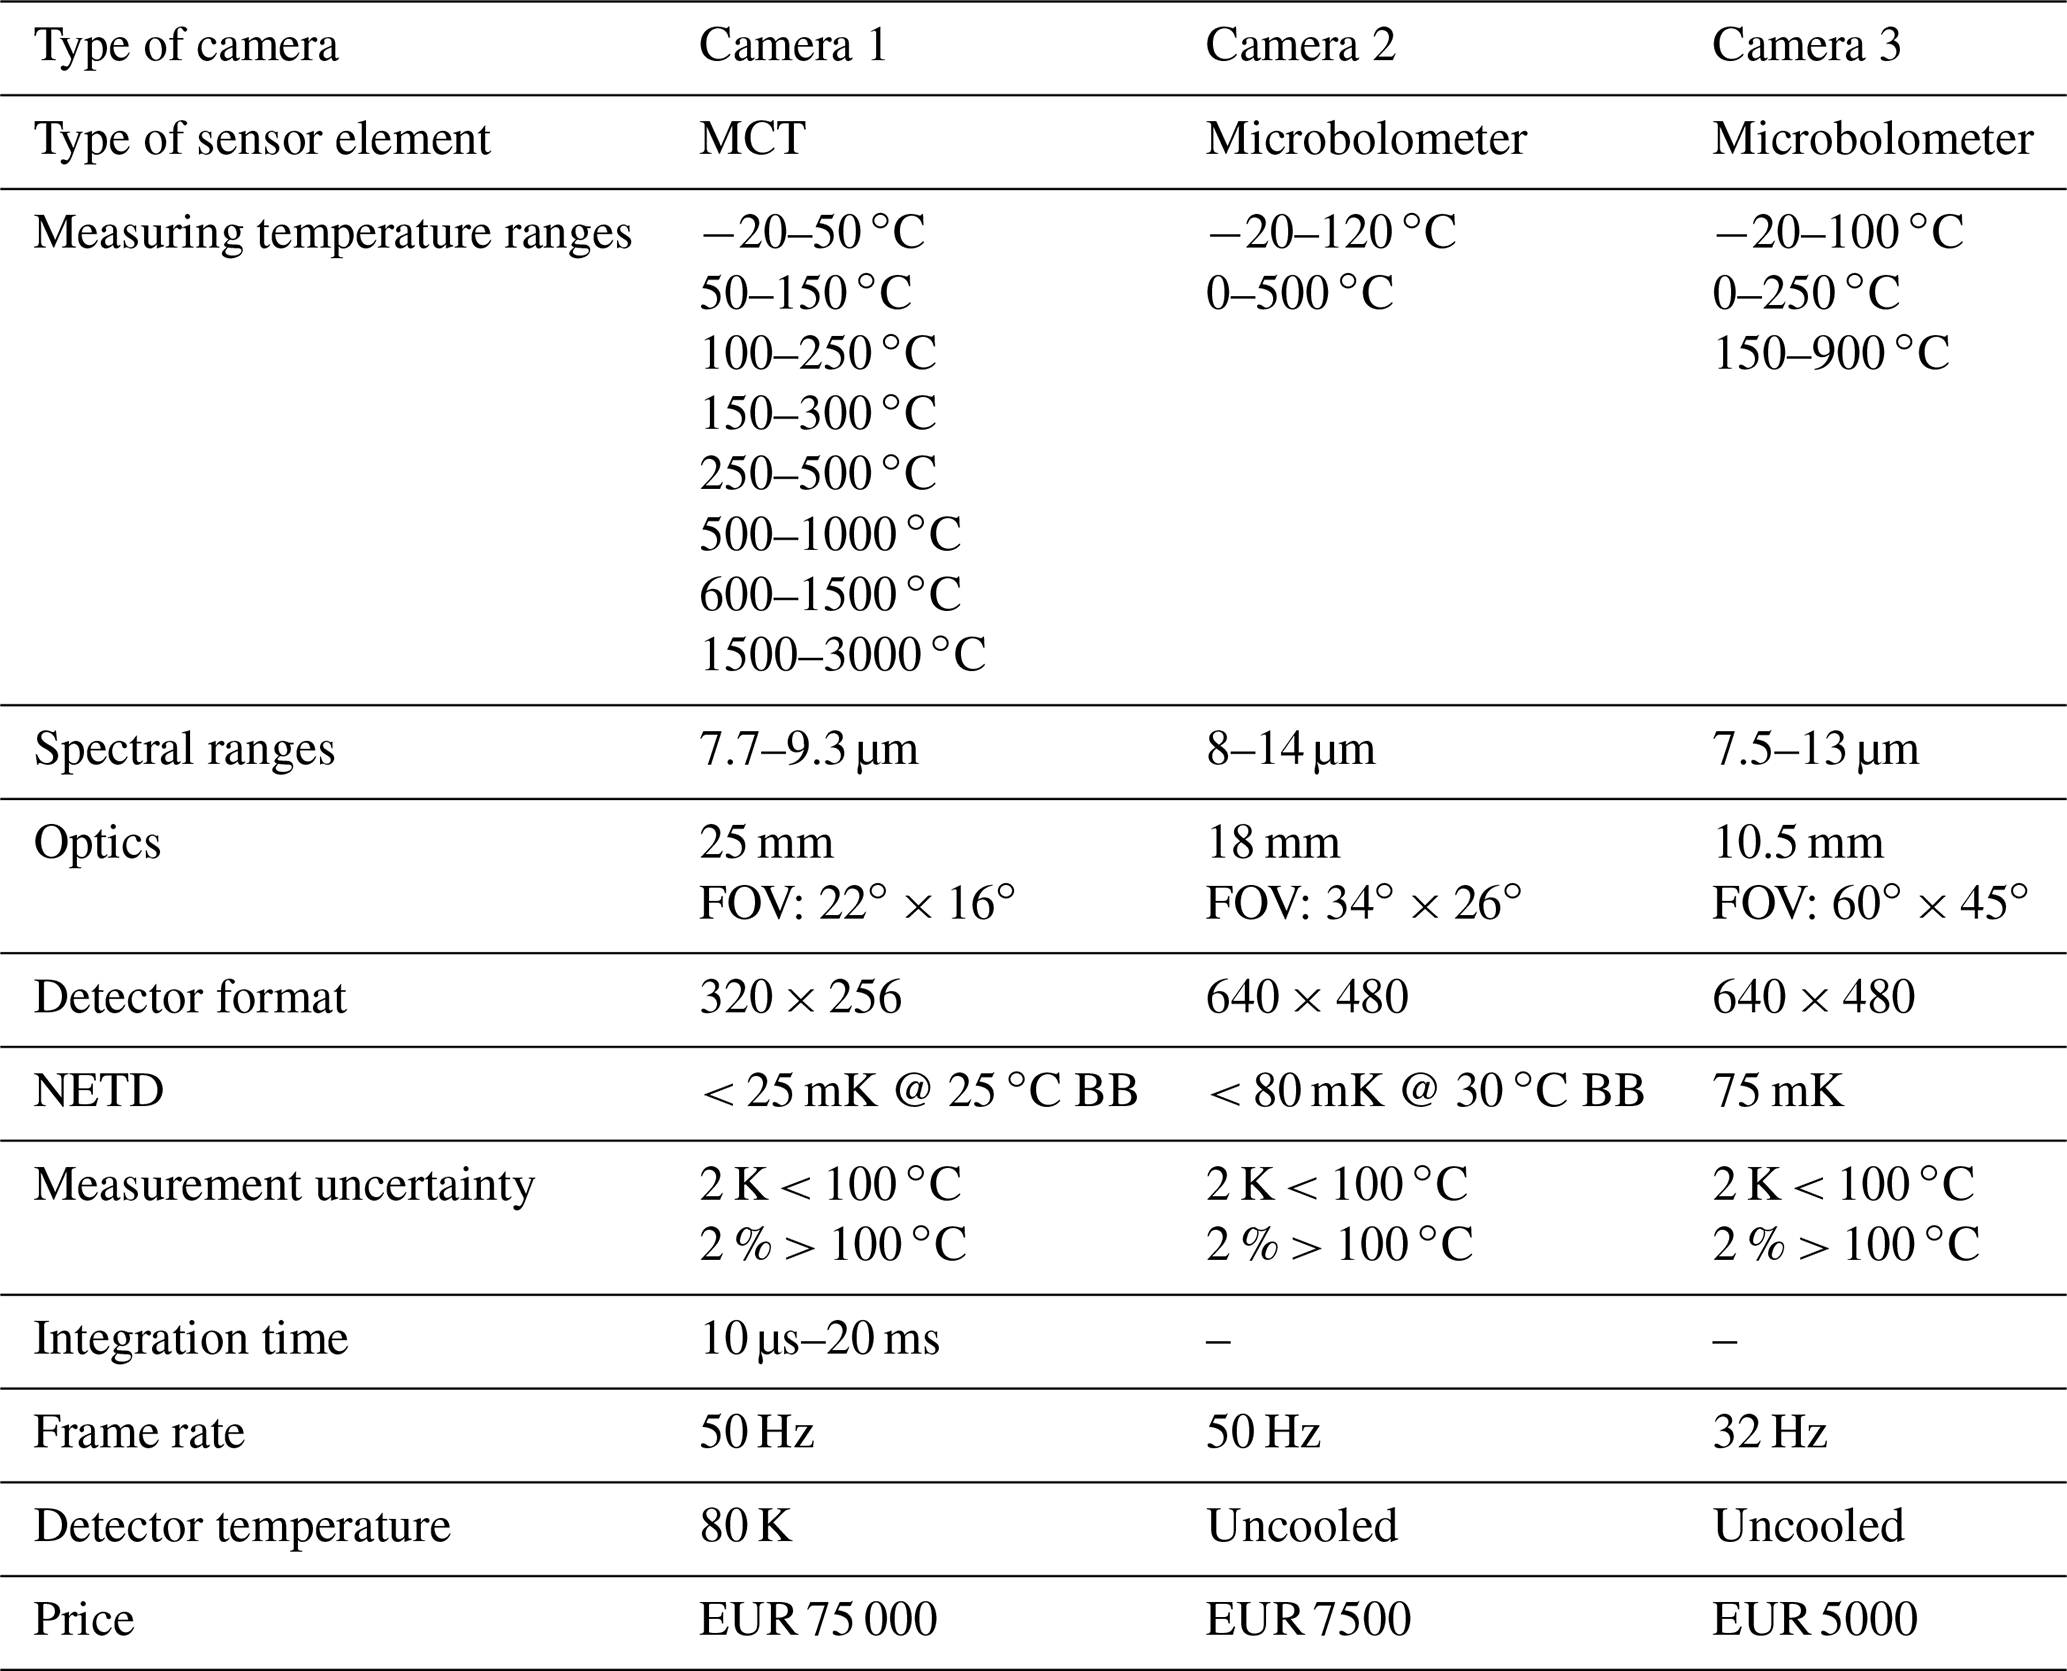
Three different types of commercial thermographic cameras were metrologically characterized and calibrated in this work. Their technical specifications are listed in Table 2. It is one camera with a cooled and temperature-stabilized MCT detector and two cameras with uncooled and non-temperature-stabilized microbolometer detectors. All cameras have been initially corrected for their non-uniformity and calibrated by their manufacturers. The measurement uncertainty of the cameras given in Table 2 is taken from the data sheets of the manufacturers. No confidence interval is given with this uncertainty.
A complete metrological characterization and calibration of a thermographic camera for absolute temperature measurement is very extensive and complex. Therefore, standardized methods for the determination of the technical specifications of cameras are needed to make the technical specifications and calibrations of cameras comprehensible, comparable, and traceable. In 2013 the German standardization committee GMA VDI/VDE FA 8.16 Temperature Measurement with Thermal Imagers started to set technical directives for the metrological characterization and calibration of thermographic cameras. In March 2018, Technical Directive VDI/VDE 5585 Part 1 Temperature Measurement with Thermographic Cameras – Metrological Characterization was published. Technical Directive VDI/VDE 5585 Part 2 Temperature Measurement with Thermography Cameras – Calibration will be published in 2020. Both technical directives are currently being internationalized in the standardization committee IEC SC65B WG5 Temperature Sensors. In the following we apply these technical directives for the metrological characterization and calibration of three different types of thermographic cameras.
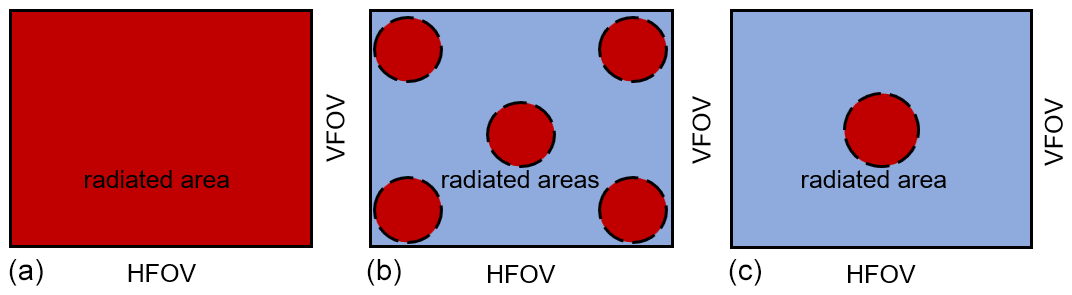
Figure 4Calibration procedures according to VDI/VDE 5585 Part 2. The three calibration procedures differ in the irradiated area of the detector array. (a) Procedure A – the entire detector array is irradiated. (b) Procedure B – the center and the corners of the detector array are irradiated. (c) Procedure C – the center of the detector array is irradiated.
3.1 Metrological characterization according to VDI/VDE 5585 Part 1
VDI/VDE 5585 Part 1 is improving the comparability and testability of the metrologically relevant data of thermographic cameras. Unambiguous procedures are laid down for the indication and determination of 27 technical specifications (VDI/VDE 5585 Part 1, 2018). In the following we focus on the highly relevant specifications for absolute temperature measurement:
-
non-uniformity (NU);
-
noise equivalent temperature difference (NETD);
-
inhomogeneity equivalent temperature difference (IETD);
-
size-of-source effect (SSE);
-
region of interest (ROI);
-
field of view (FOV).
3.2 Calibration according to VDI/VDE 5585 Part 2
VDI/VDE 5585 Part 2 defines different calibration methods of thermographic cameras and the associated uncertainties (VDI/VDE 5585 Part 2, 2020). The defined procedures mainly differ in the ways the traceability to ITS-90 is achieved and how the field of view of the thermographic camera is irradiated. The three main procedures of VDI/VDE 5585 Part 2 will be metrologically tested and discussed with three different types of cameras. The resulting measurement uncertainty will be determined.
3.2.1 Traceability to ITS-90
An important aspect of VDI/VDE 5585 Part 2 is the traceability of the radiance temperature of the applied radiators to the ITS-90 (VDI/VDE 5585 Part 2, 2020). The radiation sources of the calibration facility of PTB are traced back to ITS-90 in two different ways. The heat-pipe cavity radiators are traceable via a contact thermometer (SPRT) in combination with precise knowledge of the temperature homogeneity and effective emissivity of the cavity. This results in very low uncertainties for their radiance temperature. The plate radiators are traced to ITS-90 via high-quality radiation thermometers in combination with the heat-pipe cavity radiators. VDI/VDE 5585 Part 2 points out that when using a radiation thermometer for traceability to ITS-90, the spectral responsivity range of the applied radiation thermometer and the thermographic camera to be calibrated should be identical. Otherwise, a difference in the spectral responsivity range has to be considered in the uncertainty budget of the calibration.
3.2.2 Calibration procedures
In VDI/VDE 5585 Part 2 a distinction is made between three calibration procedures. The distinction is drawn by the irradiated detector area. In Procedure A (Fig. 4a) the entire detector area is irradiated with the calibration source. This procedure can be realized in two ways. The camera can be irradiated with a sufficiently large plate radiator, which irradiates the complete detector array simultaneously. Alternatively, parts of the detector array can be irradiated with the aid of a cavity radiator with a smaller aperture. In the later case, the camera is progressively moved in front of the cavity radiator until each detector element has been irradiated at least once. Subsequently, the image elements irradiated by the radiator are combined to form a new image, so that each image element of the new image was illuminated by the radiator. Procedure A provides calibration information for each detector element. The mean deviation between the individual temperature readings of the detector elements Trad,Xi and the respective radiance temperatures of the source Trad,Si is given according to Eq. (1) as the specified mean deviation of temperature measurement ΔT. In addition, the SD (standard deviation) of these temperature differences should be given as a calibration result.
Procedure B (Fig. 4b) takes five images of the calibration source. The center and the four corners of the detector area are radiated one after the other. The camera can either be moved in parallel to its optical axis in front of the calibration source or rotated around the optical axis of the detector array. When moving in parallel to the optical axis from the center to the corners, the calibration source is no longer on the optical axis of the camera. This results in an optical distortion of the image of the source. The type of movement should be, ideally, decided under the aspect of the later application. The calibration geometry should, as closely as possible, resemble the geometry of the subsequent application. For each image an ROI is defined in the irradiated detector area. The ROI always has to be smaller than the irradiated area. The signals of the detector elements of this ROI are averaged. Procedure B provides average calibration information for each of the five areas. Procedure C (Fig. 4c) takes one image of the calibration source. The center of the detector is irradiated and an ROI is defined. The signals of the detector elements of this ROI are averaged. Procedure C provides average calibration information for the center of the detector.
4.1 Measurement of technical specifications
When determining the parameters of the infrared cameras, they were positioned in front of a radiation source. Before each measurement, the warm-up time specified by the manufacturer was observed, and it was checked that a stable state was achieved. Before each measurement, a non-uniformity correction was carried out using the manufacturer's software.
Table 3Non-uniformity of the three investigated cameras measured in front of a plate radiator at a temperature of 100.0 ∘C.

Table 4IETD of the three investigated cameras at a measured temperature of 100.0 ∘C.

4.1.1 Non-uniformity
The non-uniformity (NU) is a property which describes the deviation between the indicated individual temperature values in an image at an image-filling, homogeneous radiance of the measurement object while neglecting the time-dependent intrinsic noise of the instrument (VDI/VDE 5585 Part 1, 2018). Typical sources of the non-uniformity are the inhomogeneity of the detector responsivity across the detector area and the optical properties of the camera lens. In thermographic cameras with multi-element detectors the appearance of non-uniformity is technically unavoidable. Usually, manufacturers compensate for the individual non-uniformity of a thermographic camera by means of the signal processing software with the initial adjustment of the camera (NUC – non-uniformity correction) (Milton et al.,1985). However, as there is limited or no availability to the perfectly homogeneous, large-area temperature radiation sources, this initial non-uniformity correction process is not perfect. The residual error manifests itself in a remaining camera non-uniformity (Miklavec et al., 2012). For the determination of the non-uniformity according to VDI/VDE 5585 Part 1 (2018) the camera is positioned centrally in front of a homogeneous reference radiator of known radiance temperature. The short-term temperature variations and spatial inhomogeneities of the radiator must be small in comparison to the non-uniformity to be measured. The total measuring time should be at least 100 times the image period and 10 times the response time. For all image elements at least 50 consecutive measurements are recorded, and from this the arithmetic mean of each image element is formed. The maximum deviation between the averaged indicated temperature values of 99 % of all image elements is the non-uniformity of the camera. When stating the non-uniformity of a camera, the measured temperature, the integration time, and the internal temperature of the camera must be given. For the following measurements the plate radiator Mikron M315 was used at a temperature of 100.0 ∘C. Ninety percent of the radiating surface was used to compensate for the temperature decrease towards the edges. Its radiance temperature was determined in the center of the radiating area with a standard uncertainty (k=1) of 35 mK using a radiation thermometer sensitive in the wavelength range from 8 to 14 µm. Figures 5 to 7 show images of the plate radiator by the investigated cameras and the resulting histograms of the measured temperature distributions. The integration time of Camera 1 was 0.127 ms. Camera 2 used a frame rate of 50 Hz and Camera 3, respectively, 32 Hz. The internal temperatures of the cameras were 28.6 ∘C (Camera 1), 31.1 ∘C (Camera 2), and 23.4 ∘C (Camera 3). The cameras were focused on the radiating surface of the plate radiator. In Table 3 the resulting non-uniformities of the three cameras with the relevant measurement parameters are given.
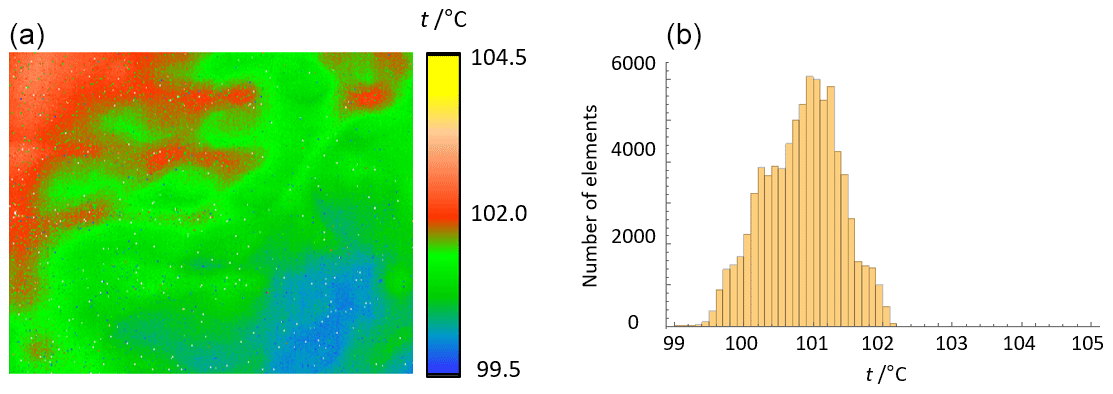
Figure 5(a) Image of a plate radiator at 100.0 ∘C by Camera 1. (b) Histogram of the observed temperature distribution.
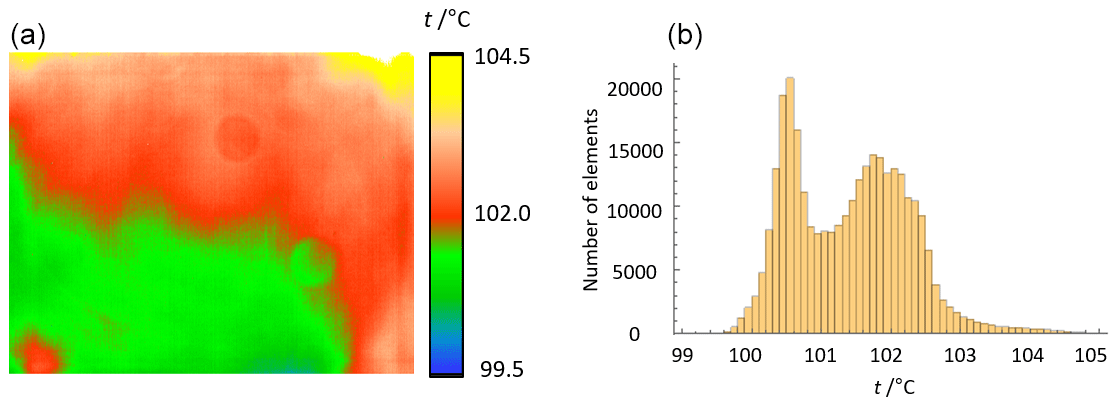
Figure 6(a) Image of a plate radiator at 100.0 ∘C by Camera 2. (b) Histogram of the observed temperature distribution.
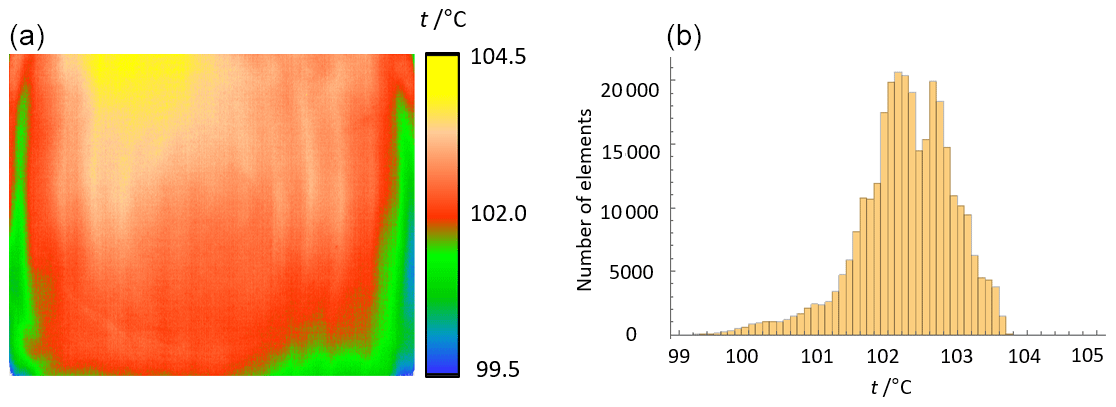
Figure 7(a) Image of a plate radiator at 100.0 ∘C by Camera 3. (b) Histogram of the resulting temperature distribution.
4.1.2 Inhomogeneity equivalent temperature difference
The IETD indicates the smallest resolvable temperature difference which corresponds to the noise that is distributed throughout the surface of the image (VDI/VDE 5585 Part 1, 2018). In contrast to the non-uniformity, the confidence interval of the IETD is always 68.3 % (standard uncertainty of measurement, coverage factor k=1). Table 4 summarizes the IETD of the three investigated thermographic cameras at the described conditions.
4.1.3 Noise equivalent temperature difference
The NETD indicates the contribution to the uncertainty of measurement which is caused by high-frequency temporal instrument noise (VDI/VDE 5585 Part 1, 2018). The NETD is the smallest resolvable temperature difference over time, which corresponds to a signal-to-noise ratio of 1 of the black body radiator (Nelson et al., 1991). The confidence interval for the noise equivalent temperature difference of a single detector is always 68.3 % (standard uncertainty of measurement, coverage factor k=1). Due to the different camera types, there are two different practical methods for determining the NETD defined in VDI/VDE 5585 Part 1 (2018). With Method A the camera provides data for each detector element for at least 100 subsequent images to determine the NETD, whereas Method B provides a mean value of the NETD of all detector elements from two subsequent images. We determined the NETD of all three cameras by both methods. With Method A 100 consecutive images of the plate radiator were taken and the temporal behavior of each picture element was analyzed. With Method B two pictures were taken, and then the NETD was determined using Eq. (2):
where ΔTi,j is the difference between the indicated temperature value of picture elements i, j; is the mean temperature difference between the picture's mean values; nh is the horizontal number of picture elements and nv is the vertical number of picture elements.
Table 5NETD of the three investigated cameras at two different measured temperatures.
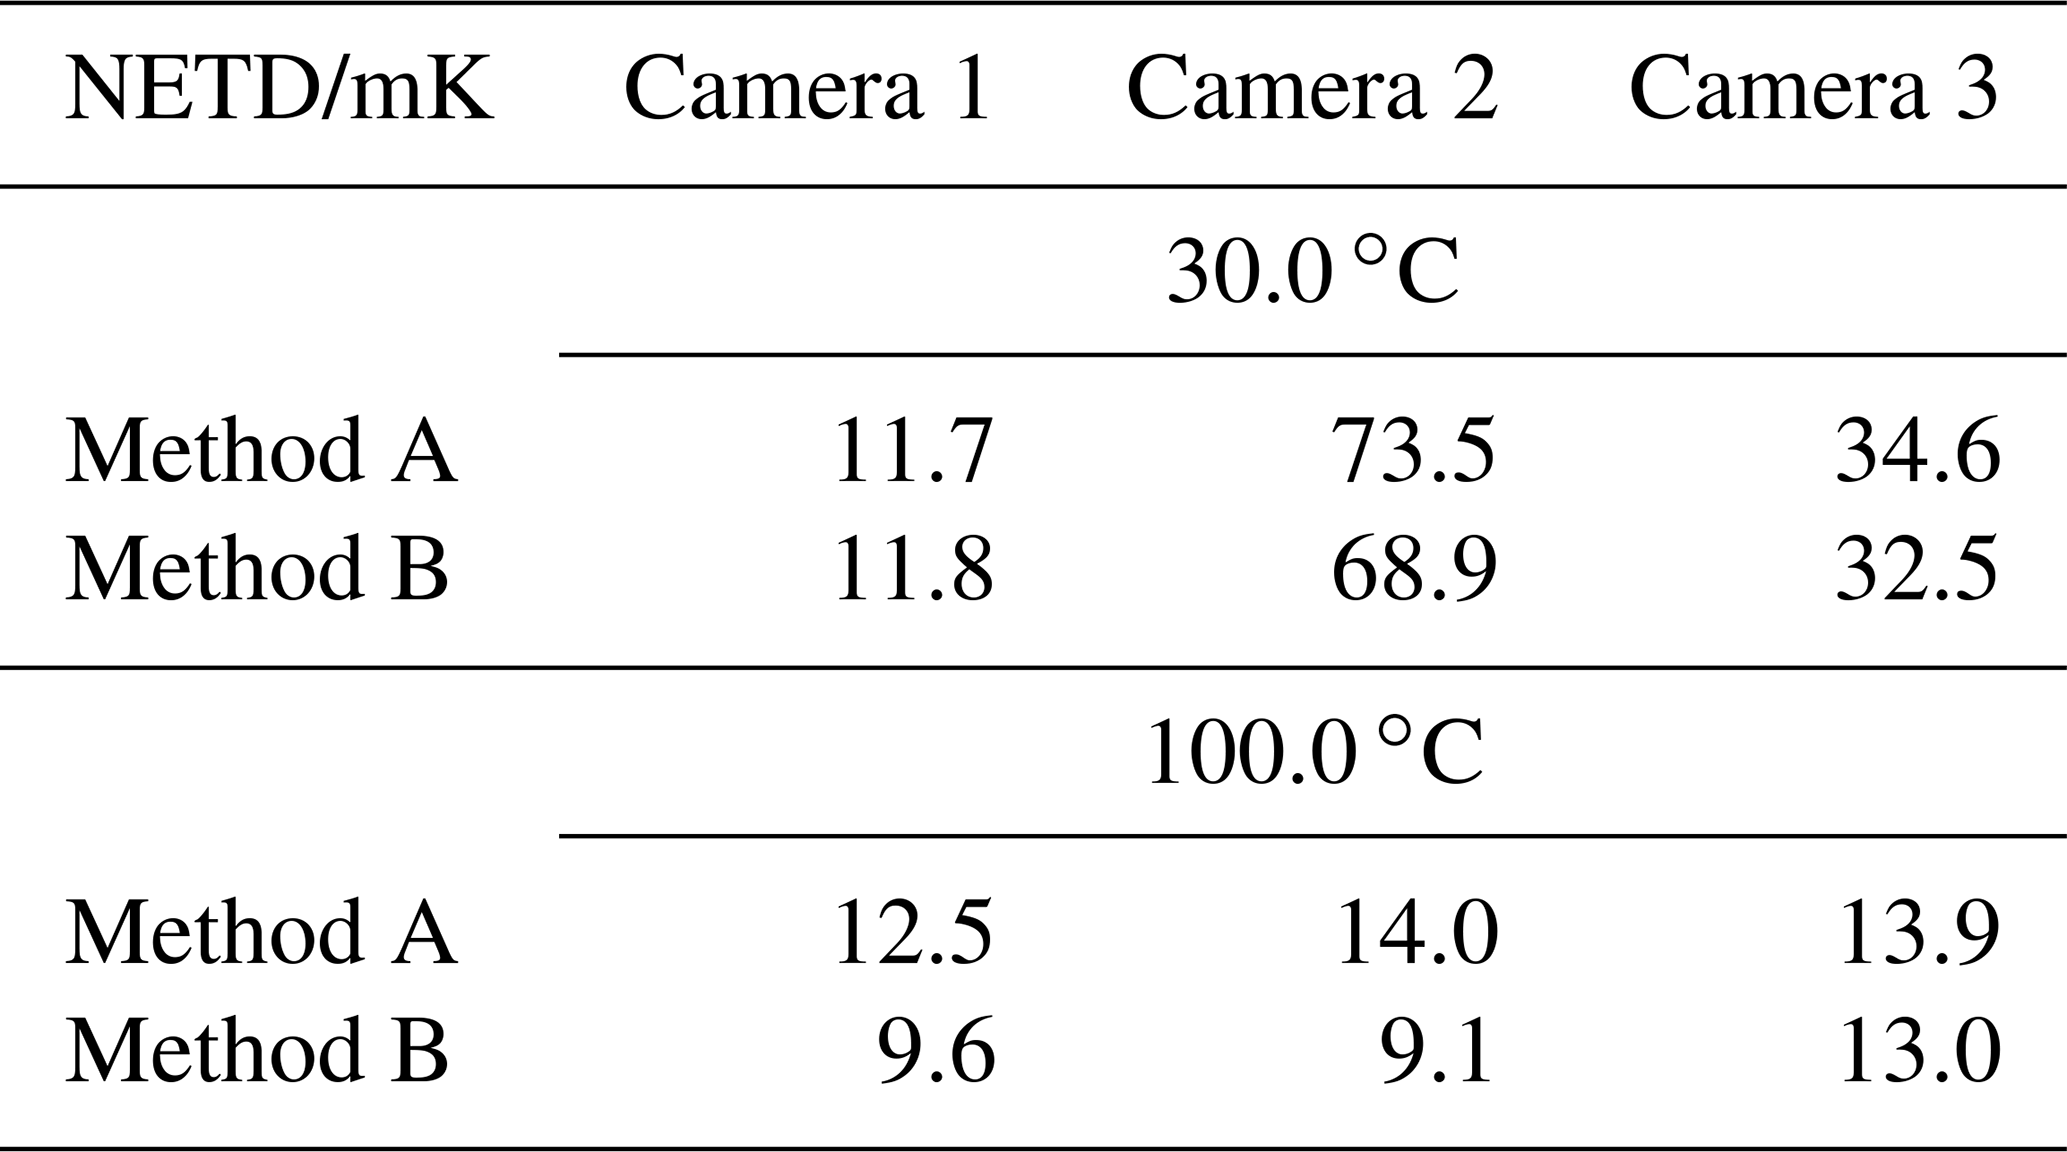
Table 5 summarizes the NETD of the three investigated cameras for both applied methods at two different temperatures.
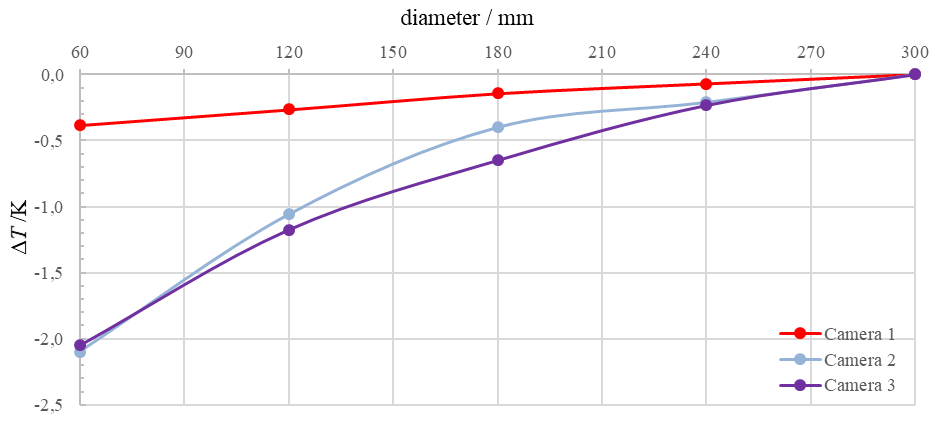
Figure 8Change in indicated temperature in the center of the observed irradiated area while changing the diameter of the aperture in front of a plate radiator. The size-of-source measurement of all three investigated cameras was performed at a radiance temperature of the plate radiator of 100.0 ∘C.
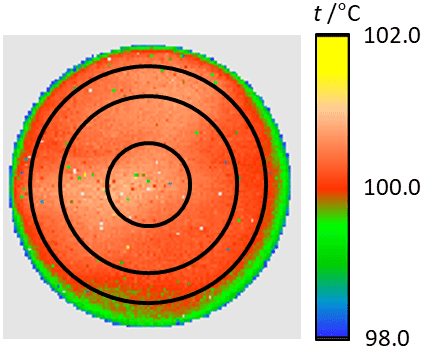
Figure 9The central part of a radiance temperature image of a water-heat-pipe cavity radiator taken by Camera 1 at a temperature of 100.00 ∘C. The black circles define different ROIs.
4.1.4 Size-of-source effect
Due to imperfections of the optical system of a camera, a change in the radiation of the surrounding area of the field of view may cause a change in the displayed value of the camera for a measuring point or a small reference surface (Pušnik et al., 2008; Gutschwager et al., 2009). Reasons for this change in the indicated radiance or temperature value are, e.g., scattering or reflection of the radiation in the optical system of the camera (Yoon et al., 2005). This effect is called the SSE. It can be described in detail by extending the graphical representation of the minimum field of view for temperature measurement MFOV of a thermographic camera. According to VDI/VDE 5585 Part 1 (2018) a simplified method to determine and represent the SSE of a camera is to state the absolute temperature change measured in the center of a stable reference radiator while changing the radiating area seen by the infrared cameras. To measure the SSE of all three cameras, apertures of various sizes were positioned in front of the plate radiator (Fig. 3) which was operated at a radiance temperature of about 100.0 ∘C. The diameters of the apertures ranged from 60 to 300 mm. In the center of the detector array of the camera, the temperature is averaged over a circular area with a diameter of 60 picture elements. This area is about 20 picture elements smaller than the irradiated area of the smallest aperture. Cameras 1 and 2 had a measuring distance of 400 mm and Camera 3 225 mm to the apertures. In Fig. 8 the change in the indicated temperature with the diameter of the aperture is given for all three cameras. Results are normalized to the result with the aperture of 300 mm in diameter. The SSE of Camera 1 is significantly smaller than the SSE of Cameras 2 and 3.
4.1.5 Region of interest
If the entire field of view of a thermographic camera cannot be or is not irradiated during a measurement, a particular ROI must be defined within the irradiated area to determine the technical specifications of a camera. This region must always be smaller than the irradiated area. The influence of the size of the selected ROI on the temperature measurement is demonstrated for each camera. A water-heat-pipe cavity radiator with an aperture of 60 mm in diameter was used at a temperature of 100.00 ∘C. The temperature homogeneity of the heat-pipe cavity radiator is within 29 mK. Figure 9 shows the central part of an image of the water-heat-pipe cavity radiator at 100.00 ∘C taken with Camera 1. The black circles symbolize different ROIs. Within each ROI the temperature values of the picture elements were averaged.

Figure 10Variation of the mean temperature with the region of interest of the image of a heat-pipe cavity radiator taken with Camera 1.
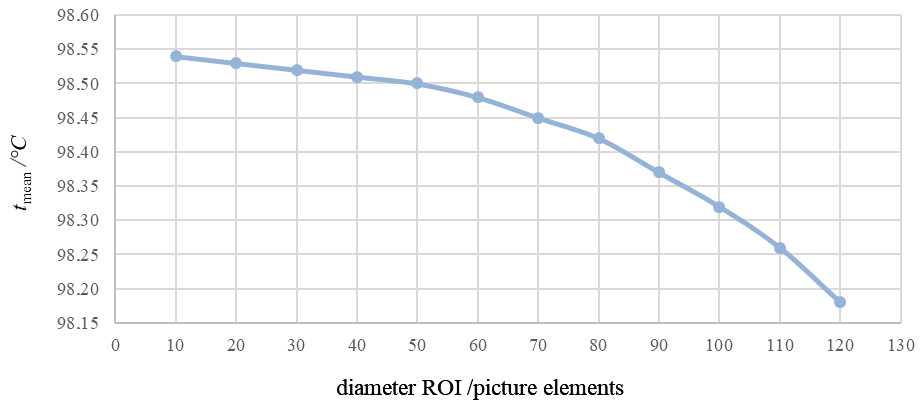
Figure 11Variation of the mean temperature with the region of interest of the image of a heat-pipe cavity radiator taken with Camera 2.
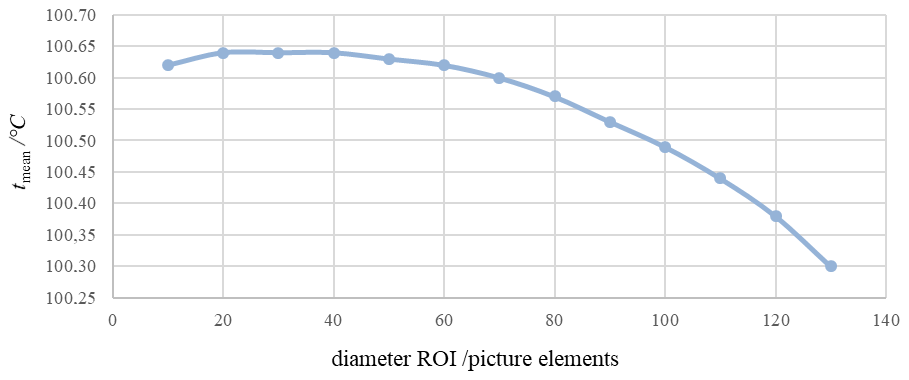
Figure 12Variation of the mean temperature with the region of interest of the image of a heat-pipe cavity radiator taken with Camera 3.
At a distance of 400 mm an area with a diameter of 105 picture elements was irradiated with Camera 1. Nine different ROIs have been defined within this area. The smallest ROI had a diameter of 10 picture elements and the largest ROI a diameter of 90 picture elements. For all ROIs the average of the recorded temperature values was determined (Fig. 10).
Camera 2 also had a measuring distance of 400 mm to the water-heat-pipe cavity radiator. The focal length of the optics resulted in an irradiated area of 144 picture elements in diameter. The smallest ROI had a diameter of 10 picture elements and the largest ROI a diameter of 120 picture elements. For all ROIs the average of the recorded temperature values was determined (Fig. 11).
Due to the larger field of view of Camera 3 the measuring distance was reduced to 225 mm. This resulted in an irradiated area of 156 picture elements in diameter. The smallest ROI had a diameter of 10 picture elements and the largest ROI a diameter of 130 picture elements. For all ROIs the average of the recorded temperature values was determined (Fig. 12).
From Figs. 10 to 12 a variation of the mean temperature of several 100 mK with a change in the ROI can be seen. As the temperature homogeneity of the applied radiator is within 29 mK, the main cause of the temperature change is clearly the metrological performance of the individual camera.
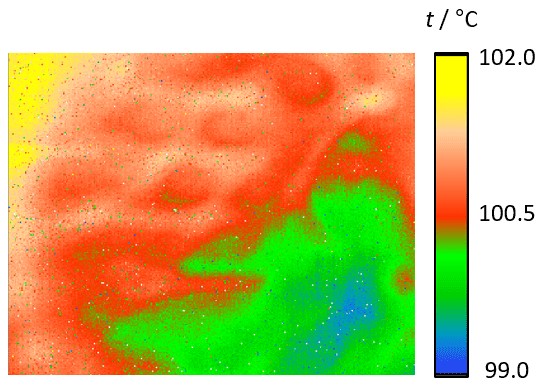
Figure 13Radiance temperature image of a plate radiator operated at about 100.0 ∘C taken by Camera 1. The observed temperature inhomogeneities partly result from the true temperature inhomogeneity across the plate and, partly, from the imperfect NUC of Camera 1.
4.2 The DRM for the improvement of technical specifications
The NU of a thermographic camera is generally corrected by means of a large-area plate radiator. However, the initial NUC of the camera can only be as good as the temperature homogeneity of the applied radiator. In order to overcome this limitation, PTB has developed a method for the determination and correction of the NU of a camera which does not require a homogeneous radiation source. This method is called the data reference method and has been described in detail in Gutschwager and Hollandt (2015), Gutschwager and Hollandt (2017), Deutsches Patent- und Markenamt (2014), and König et al. (2018). In the following we demonstrate the value of this method by applying it to all three cameras for improving their NU and IETD. The DRM can be applied to radiation sources of arbitrary spatial radiance temperature distribution. It only requires an adequate temporal stability of the radiance temperature distribution of the source during the measurement process. With the DRM at least three consecutive images of one scene are needed. The first image (image 1) is called the primary image. For the second image (image 2), starting from the primary image, the field of view of the camera is shifted in the direction represented by the columns of the focal plane array (FPA) of the camera. For the third image (image 3), subsequently, the field of view of the camera is shifted from the primary image in the direction represented by the rows of the FPA of the camera. From images 1 and 2 a first matrix (matrix 1) is formed which gives the radiation sensitivity of each detector element relative to a reference detector element in its row. From images 1 and 3 a second matrix (matrix 2) is formed giving the radiation sensitivity of each detector element relative to a reference detector element in its column. From matrices 1 and 2 a result matrix is calculated which provides the complete NU information of the imager with respect to an arbitrary reference detector element at the radiance temperature of the source. In addition, this result matrix can be used to determine the true temperature distribution of the radiating surface from image 1.
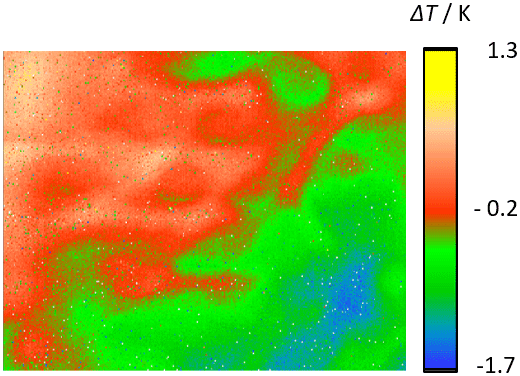
Figure 14Radiance temperature differences in Fig. 13 which are caused by the NU of Camera 1. The NU is given in temperature differences referring to a user-selected reference detector element in the center image.

Figure 15True radiance temperature distribution of the observed plate radiator with respect to the user-selected detector element in the center of the image.
For a practical demonstration, we show an application of the DRM with Camera 1. Figure 13 shows an original image of the plate radiator at a temperature of about 100.0 ∘C taken with Camera 1 (image 1). The temperature inhomogeneities in the image can be attributed to two reasons. Firstly, true temperature differences across the plate exist and, secondly, the initial NUC of Camera 1 is not perfect. Images 1 to 3 were taken, and the DRM was applied to determine the NU of Camera 1.
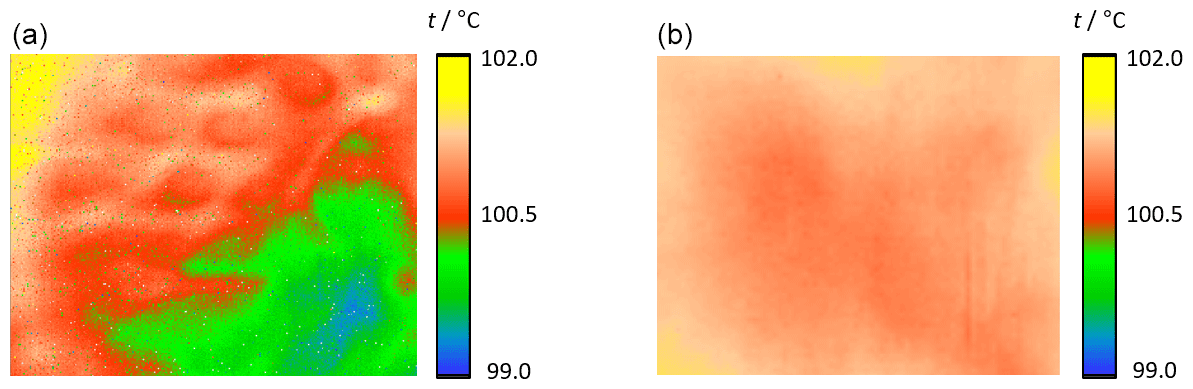
Figure 16(a) The originally taken image of Camera 1 (Fig. 13) is shown. (b) Figure 16 shows the true radiance temperature distribution of the plate radiator without the camera nonuniformity.
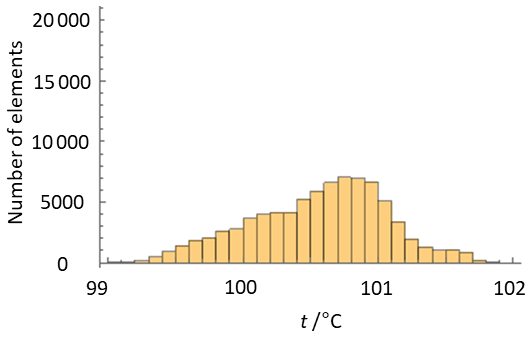
Figure 17Histogram of the radiance temperature of the plate radiator taken by Camera 1 (Fig. 16a).
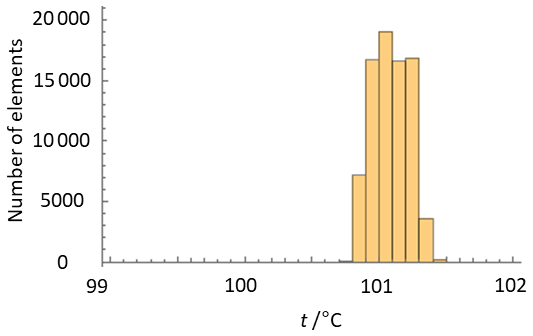
Figure 18Histogram of the radiance temperature distribution of the plate radiator taken by Camera 1 after the NU of Camera 1 has been corrected with the DRM (Fig. 16b).
As a result of the DRM Fig. 14 shows the radiance temperature differences which are solely caused by the NU of Camera 1. The NU is given in temperature differences referring to a user-selected reference detector element in the center of the image. Figure 15 is formed from Fig. 13 with the information of the NU of Camera 1 (Fig. 14) and shows the true temperature distribution of the plate radiator with respect to the user-selected reference detector element. Figures 14 and 15 clearly show that the significant contribution to the temperature inhomogeneity seen in Fig. 13 is caused by the NU of the camera and not by the temperature inhomogeneity of the radiator.
Figure 16 shows again the originally taken image of Camera 1 (Fig. 13). Figure 16b has been corrected for the NU of Camera 1 using the DRM and shows now the true radiance temperature distribution of the plate radiator. Both images (a and b) of the plate radiator are given in the same scale. Figures 17 and 18 show the respective histograms of the temperature distributions of the plate radiator taken without (a) and with (b) application of the DRM.
Table 6NU and IETD of the three investigated cameras at 100.0 ∘C before and after the application of the DRM.
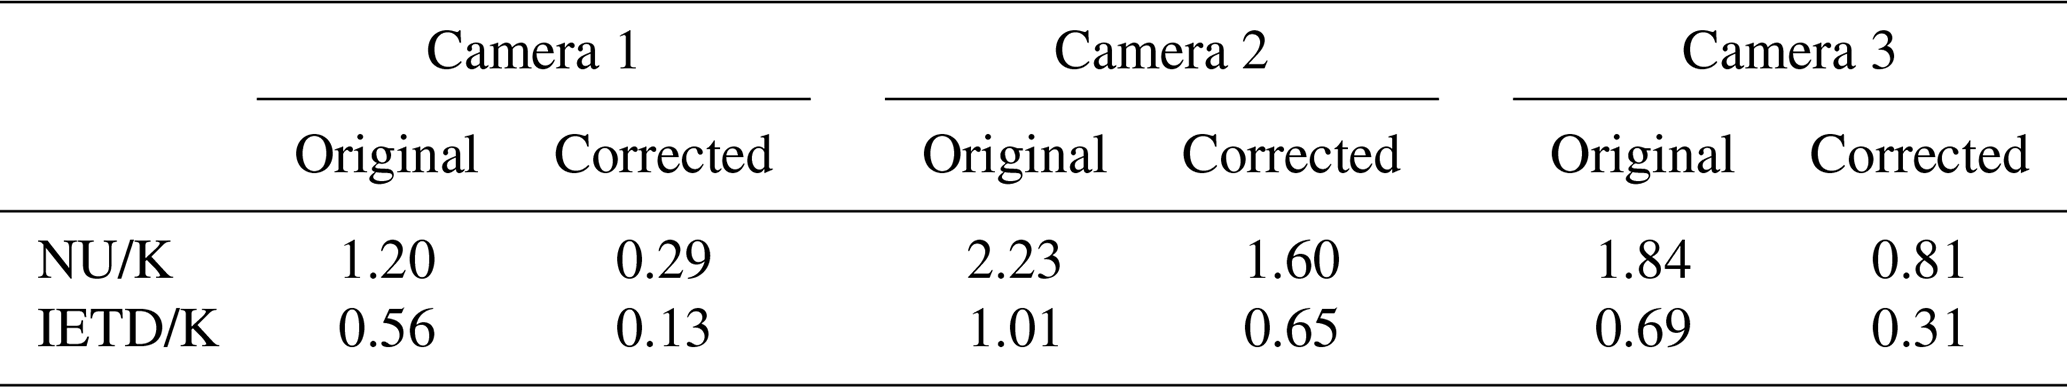
The DRM was performed with all three cameras. The results are summarized in Table 6. In each case the NU and the IETD of the three cameras could be considerably improved with the DRM.
5.1 Calibration
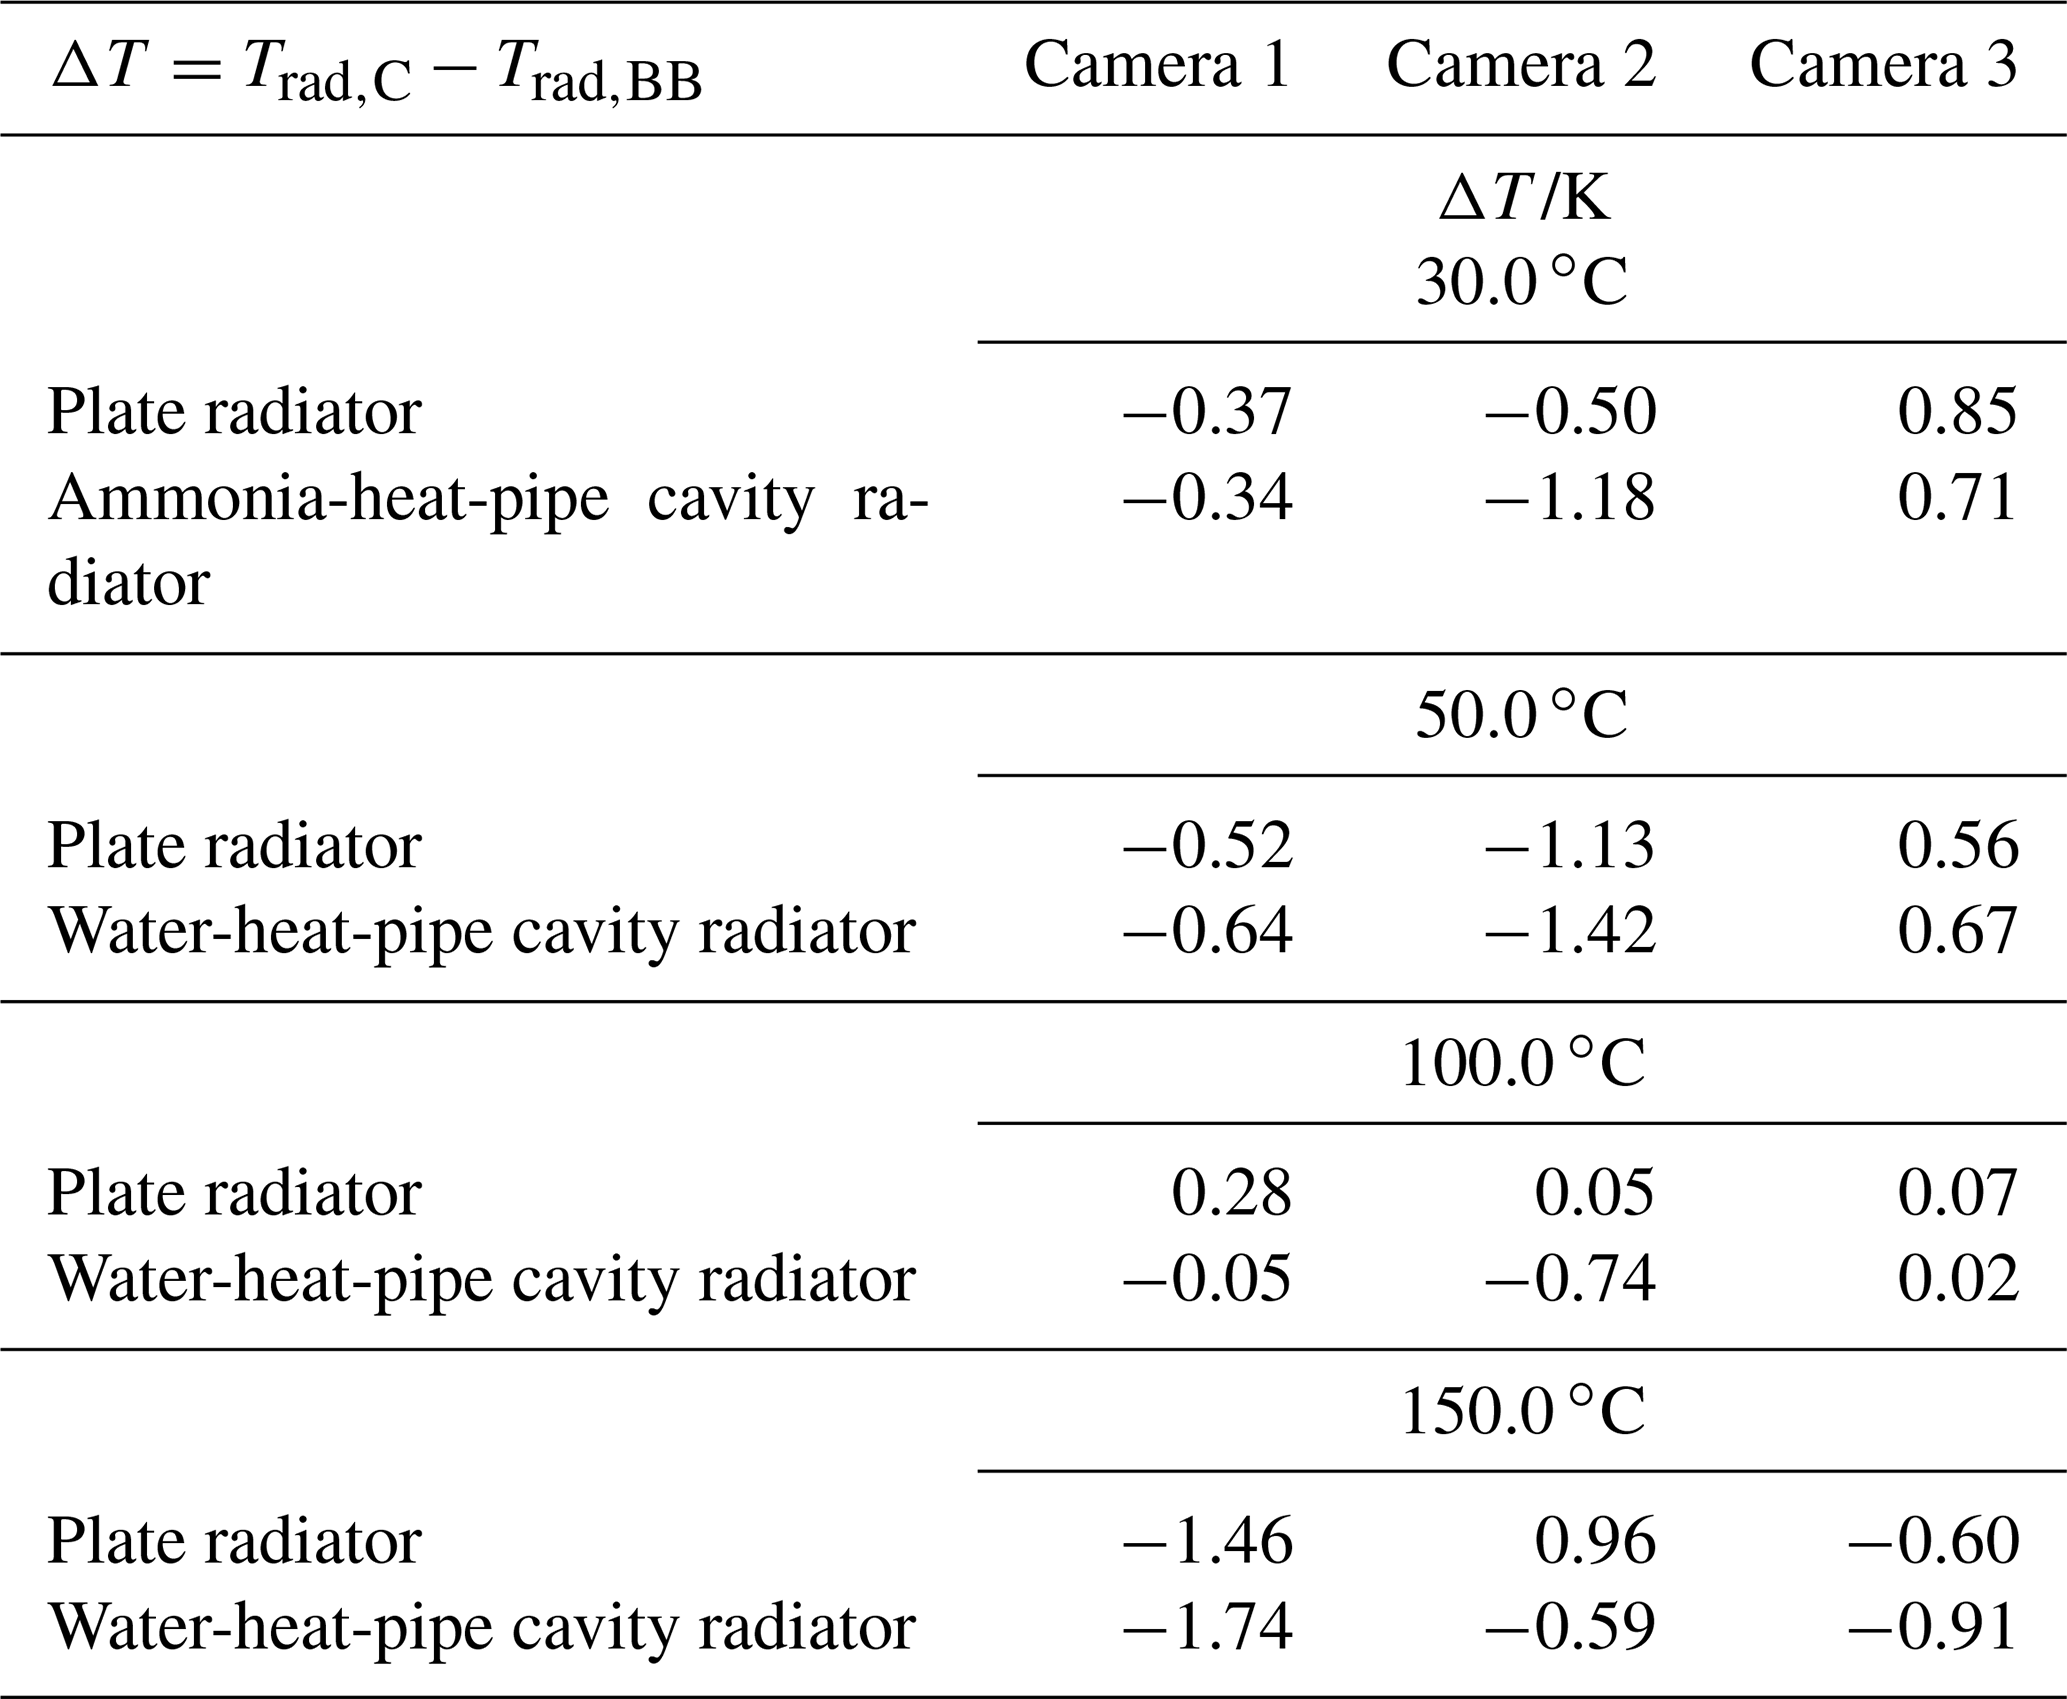
All three cameras were calibrated according to the three standardized procedures in VDI/VDE 5585 Part 2 (2020), shortly described in Sect. 3.2.2. The plate radiator, the water-heat-pipe cavity radiator, and the ammonia-heat-pipe cavity radiator were used for the calibration (Table 1). The radiance temperatures of the radiators were measured with a transfer radiation thermometer calibrated traceable to ITS-90. The transfer radiation thermometer operated in the spectral range from 8 to 14 µm. For the calibration the radiance temperatures of the plate radiator were 30.0, 50.0, 100.0, and 150.0 ∘C. The radiance temperatures of the heat-pipe cavity radiators were 30.00 (ammonia-heat-pipe) and 50.00 and 100.00 and 150.00 ∘C (water-heat-pipe). All temperatures were measured with the transfer radiation thermometer in the center of the aperture of the radiator.
Table 7Calibration results of the three cameras according to Calibration Procedure A.

For Calibration Procedure A (Fig. 4a) only the plate radiator was used. It irradiated the entire field of view of each camera. The calibration result of Procedure A is the mean deviation between the individual temperature readings of the detector elements and the respective radiance temperatures of the plate radiator according to Eq. (1). It is given as ΔT in Table 7. As in general, the measurement uncertainty is limited by the uncertainty of the knowledge of the temperature distribution of the plate radiator, the spatial temperature distribution of the plate radiator was precisely determined by means of the DRM. In addition to ΔT, the SD of ΔT is given in Table 7.

Table 9Calibration results of the three cameras in the five zones of the examined field of view according to Calibration Procedure B.

Calibration Procedure B (Fig. 4b) was performed with all cameras by applying the water-heat-pipe cavity radiator and the plate radiator at 100 ∘C. The five different zones in the field of view of the camera were irradiated step by step with the plate radiator in combination with an aperture of 60 mm in diameter and with the water-heat-pipe cavity radiator. The calibration of each zone was carried out by averaging over an ROI within the respective zone. The position of the five zones within the field of view of the camera were central, top left, bottom left, bottom right, and top right. Not knowing the exact position of the detector array in the respective camera, the decision was made to move the cameras in parallel to their optical axes for irradiating the five different zones. However, this leads to a distortion of the image of the radiator. The ROI was chosen in such a way that the distortion has no direct impact on the ROI. The relevant calibration parameters are summarized in Table 8. The calibration results are given in Table 9.
Table 10Calibration results of the three cameras according to Calibration Procedure C.
Calibration Procedure C (Fig. 4c) requires the least effort. Only the center of the field of view of the camera is irradiated and the average temperature of the ROI is recorded. This procedure was performed with the heat-pipe cavity radiators and the plate radiator. The results are summarized in Table 10.
With Calibration Procedure A all cameras are predominantly in agreement with the measurement uncertainties specified by the manufacturers. Camera 1 performs slightly better than Cameras 2 and 3. With Camera 1 it is noticeable that a larger ΔT occurs at 150.0 ∘C, but it stays within the manufacturer's specification. This increase in ΔT may be due to the fact that this temperature is at the edge of the selected measuring temperature range of Camera 1. Camera 2 is outside the manufacturer's specification at a calibration temperature of 150.0 ∘C. With Calibration Procedure B all cameras are clearly in agreement with the measurement uncertainties specified by the manufacturers for all five positions within their field of view. The best results are achieved in the central position of the field of view. When taking measurements in the corners of the FOV, the radiator is no longer exactly on the optical axis of the camera. This can have a negative effect on the measurement result. For Cameras 2 and 3 the determined temperature deviation ΔT with Calibration Procedure A is typically larger than with Procedure B. This can be attributed to the larger SSE of the two microbolometer cameras (Fig. 8). With Calibration Procedure C all cameras are clearly in agreement with the measurement uncertainties specified by the manufacturers. Again, Camera 1 shows a larger ΔT at a calibration temperature of 150.0 ∘C but stays within the specifications. As expected, the calibration results with Procedure C are very similar to the results of Procedure B for the central position.
In summary, it can be said that the calibration procedure should be made dependent on the subsequent application. Due to the strong influences of the SSE, a camera that considers a large-area heat source in later use should be calibrated according to Calibration Procedure A. Otherwise there may be deviations in the single-digit percentage range for an object temperature of 100 ∘C, for example.
5.2 Uncertainty budget
An estimation of the overall uncertainty budget of the ITS-90 traceable calibration for the three cameras was done according to the Guide of the Expression of Uncertainty (ISO, 1995). Table 11 lists the formula symbols used in this chapter. In the equations the index RT stands for the radiation thermometer and the index C symbolizes the camera used.
The radiance temperature of the radiator is measured using the radiation thermometer. For calibration, the radiance temperature of the same surface is measured with the camera and the difference between the two measurements is determined. The measurements contain uncertainties, which are explained below. The starting points are the model equations for the radiance temperature of the radiation thermometer (Eq. 3) and the cameras (Eq. 4):
The radiance temperature of the measuring field of the radiation thermometer is calculated on the basis of the displayed temperature of the radiation thermometer and the correction components according to Eq. (3). The radiance temperature measurement result for the thermographic camera is obtained analogously: it is determined using the temperature displayed by the camera and applying the corrections as given in Eq. (4). The uncertainty contributions are discussed theoretically below and then referenced to a sample camera. If the emissivity of the radiator ε is less than 1 and the radiation thermometer and the camera have different spectral responsivities, the radiance temperature reading of the radiation thermometer must be corrected to obtain a radiance temperature reading corresponding to the spectral responsivity of the camera.
Table 11Definition of symbols used in the section “Uncertainty budget”.
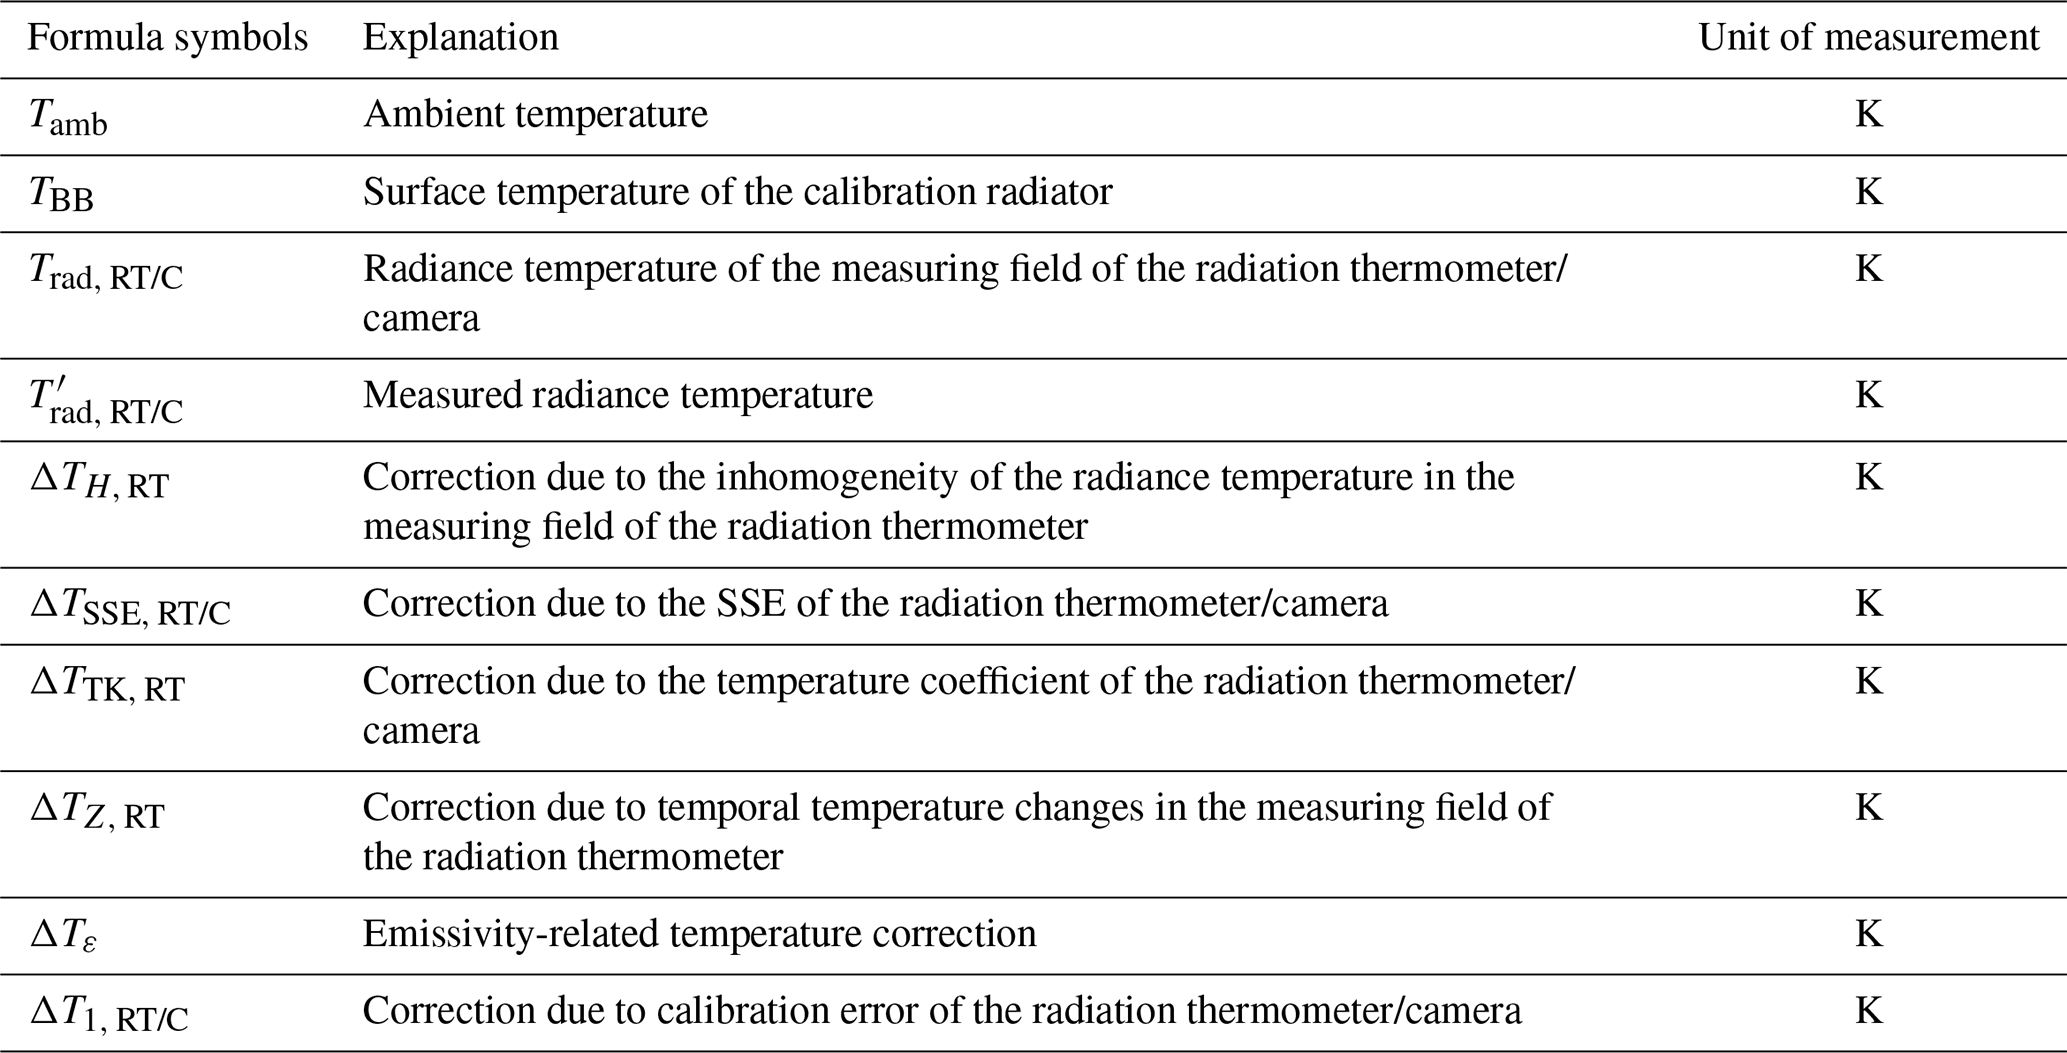
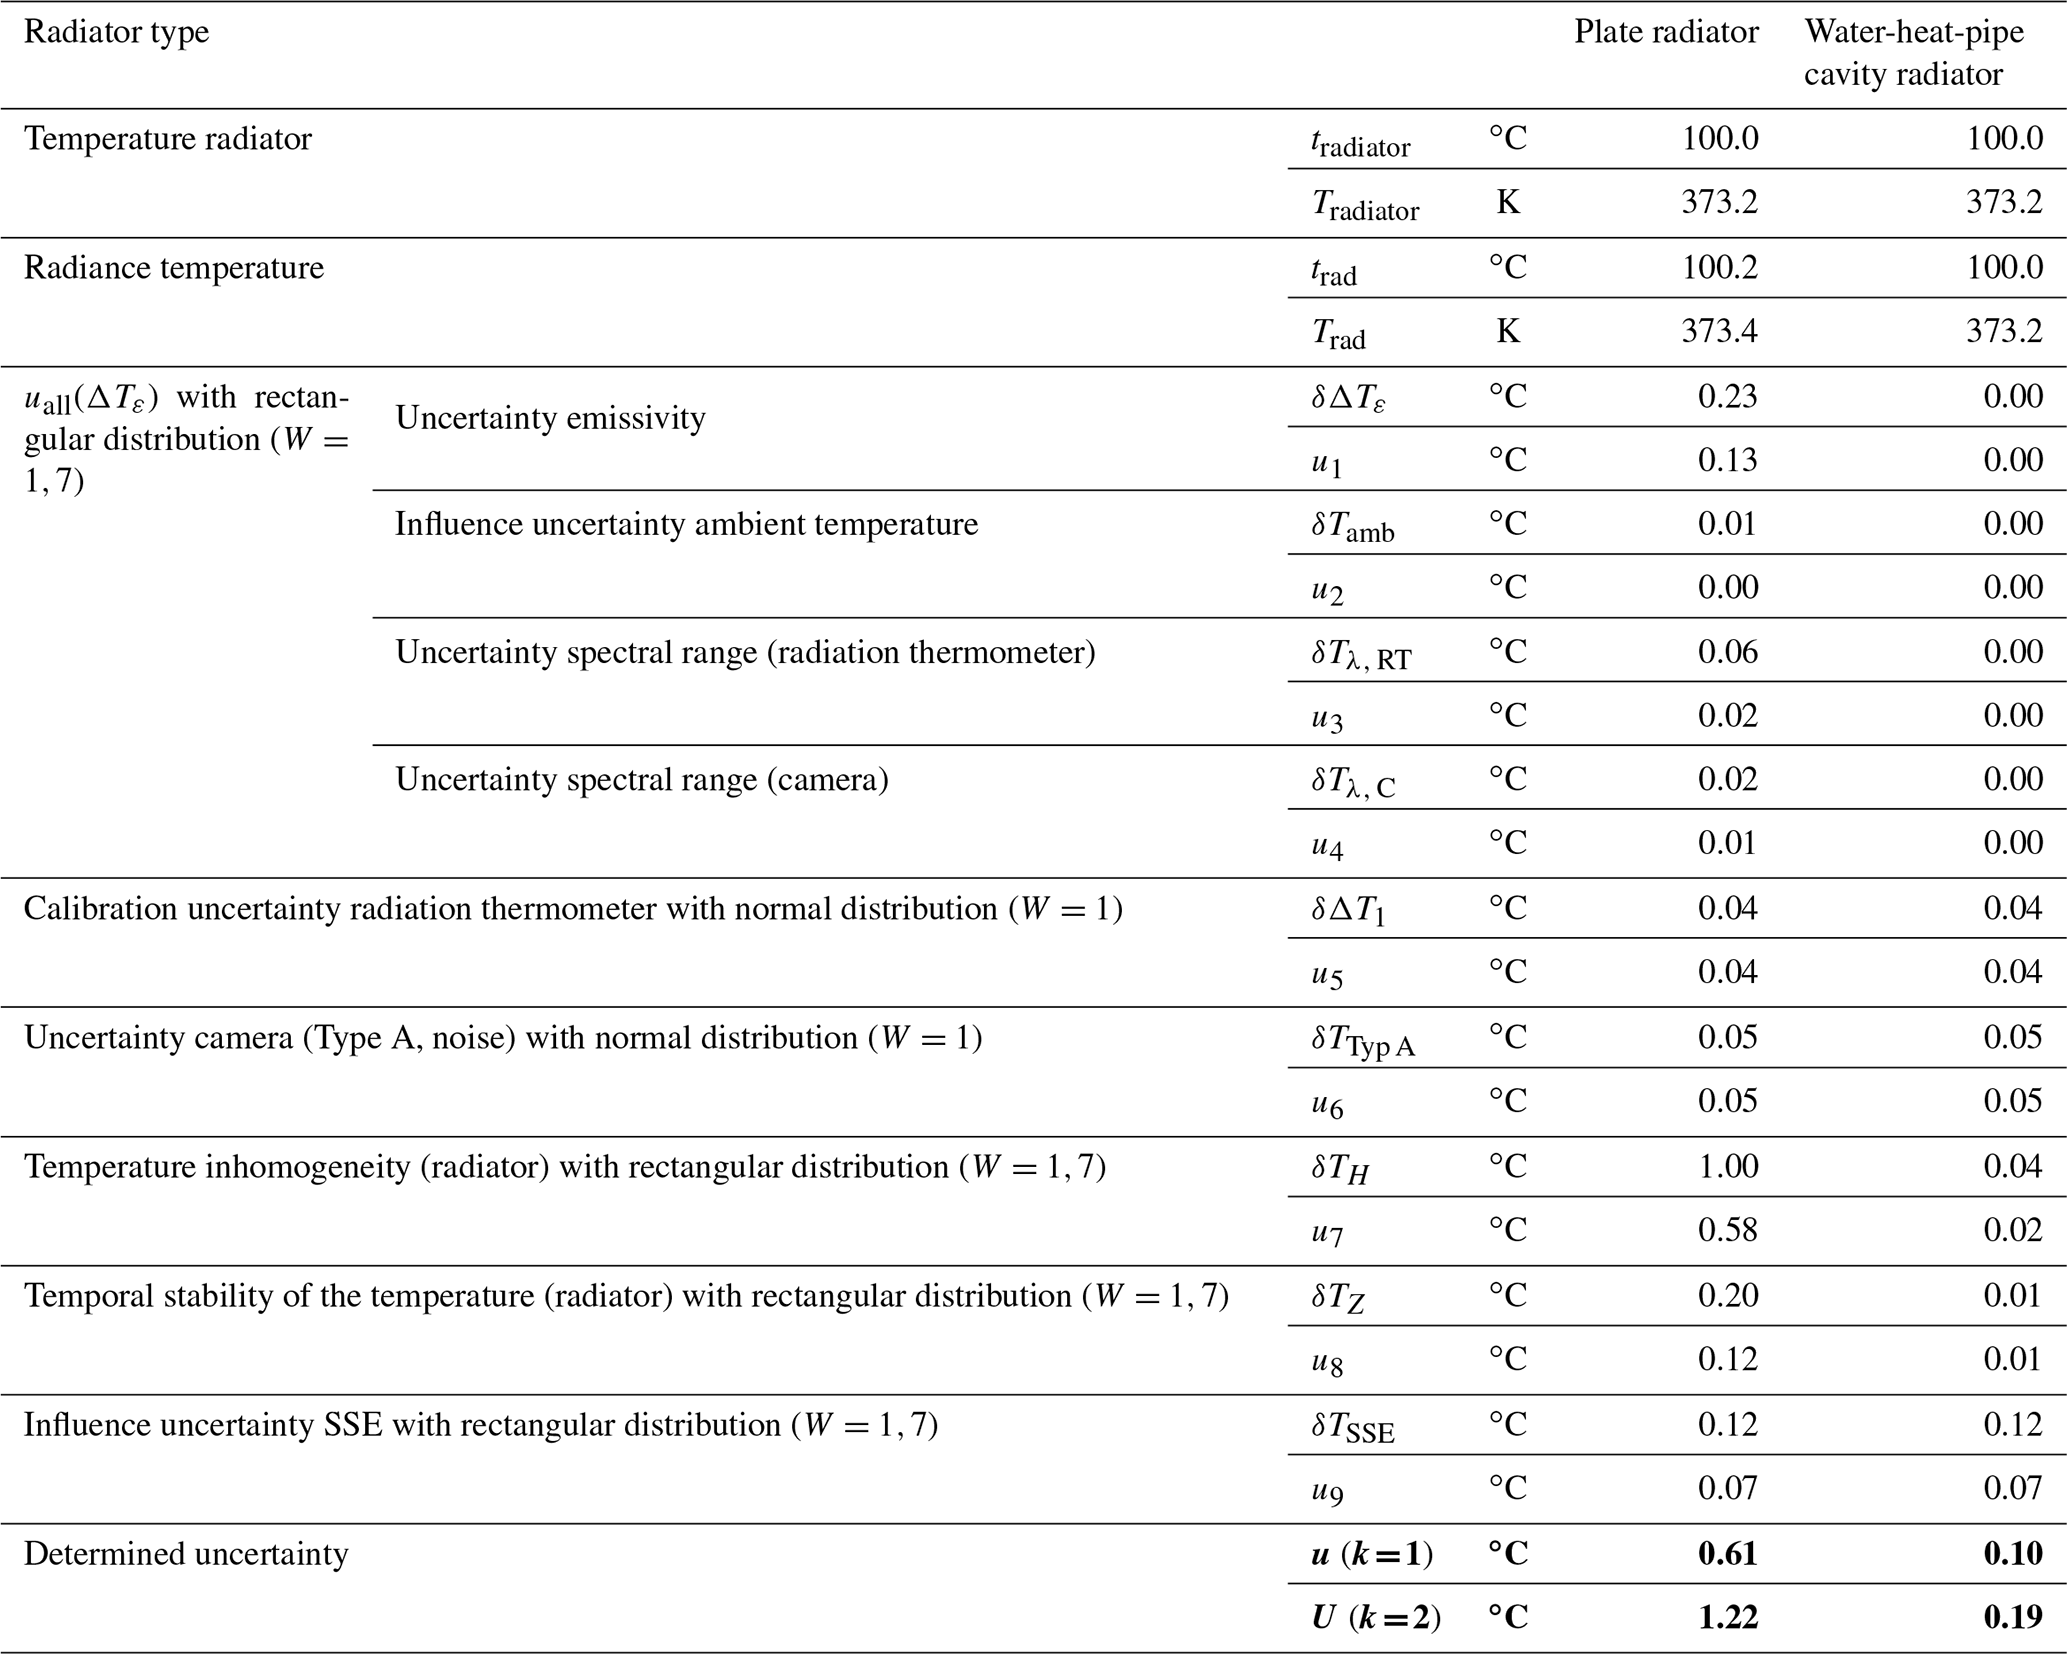
Table 12Estimation of the uncertainty budget of Camera 1 using a plate radiator and the water-heat-pipe cavity radiator at 100.0 ∘C in the return of the radiance temperature by means of a radiation thermometer.
The correction ΔTε can be determined as follows. In a first step, the surface temperature TBB of the radiator can be determined iteratively from the radiance temperature measured with the radiation thermometer if the emissivity of the radiator ε and the ambient temperature Tamb are known:
with
In a second step, the equivalent radiance temperature, corresponding to the spectral responsivity of the camera, measured by the radiation thermometer is then calculated using the calculated surface temperature of the radiator:
In a first-order approximation, the correction ΔTε is then equal to
The following uncertainty contributions are included in the calculation of the total uncertainty uall(ΔTε) of the correction ΔTε:
-
uncertainty contribution due to the uncertainty of the emissivity of the radiator: u(ε);
-
uncertainty contribution due to the uncertainty of the ambient temperature: u(Tamb);
-
uncertainty contributions due to the uncertainty of the spectral integration ranges of the radiation thermometer and the camera: , , , .
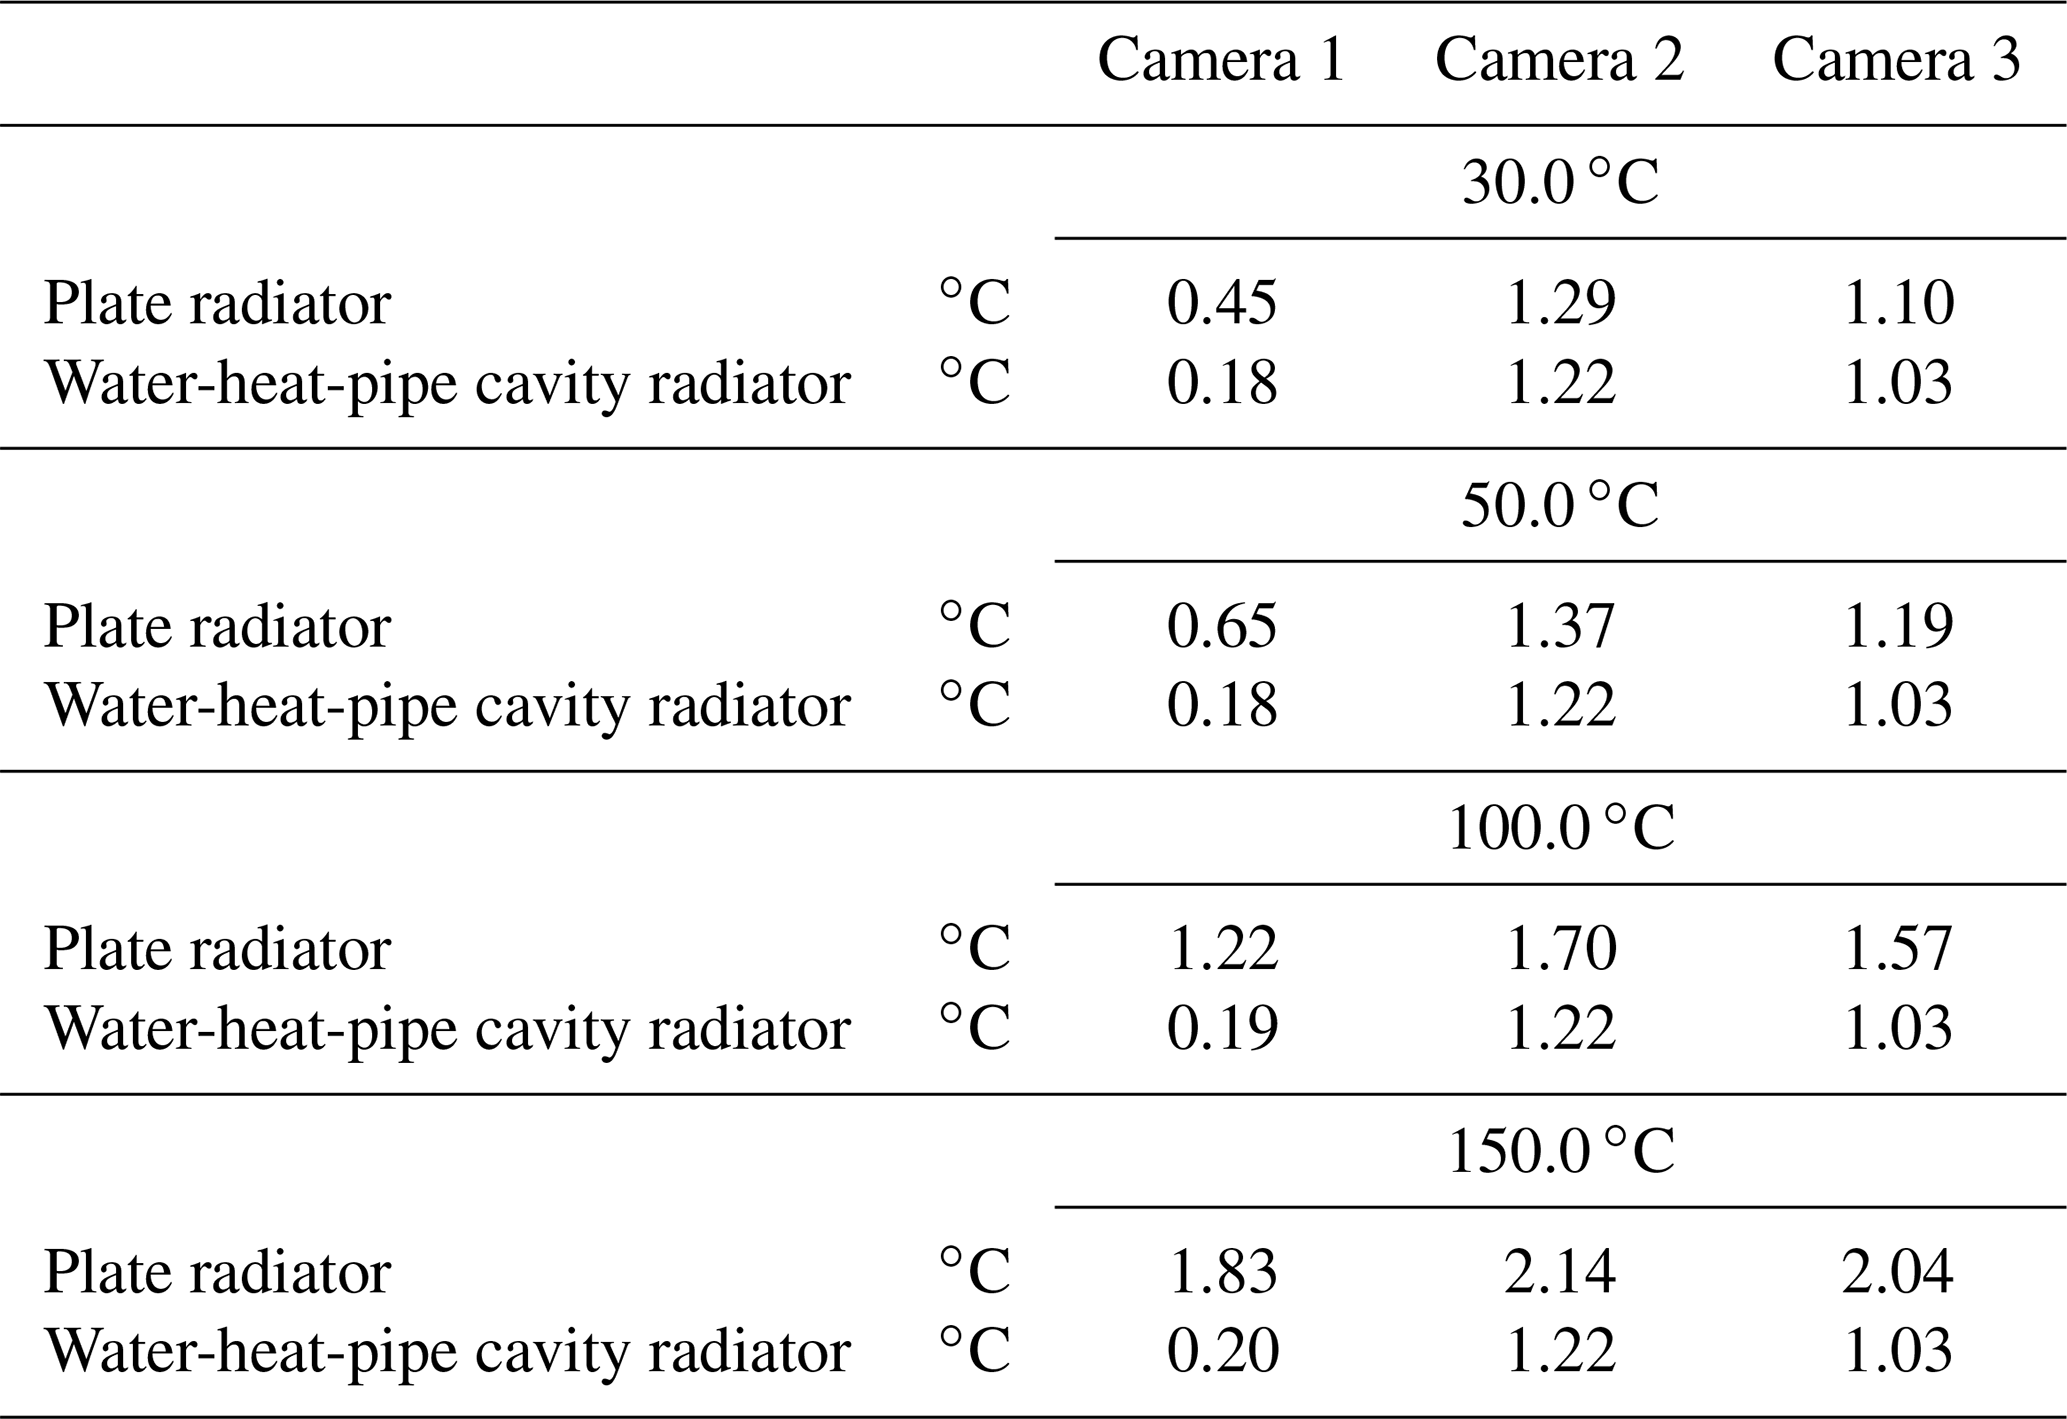
Table 13Estimated calibration uncertainties U (k=2) of the three cameras.
The correction ΔT1 includes the measurement uncertainty of the device used (radiation thermometer or camera) and must be assessed individually, e.g., from the calibration certificate of the radiation thermometer. Due to the time difference between the measurements, the temperature stability of the radiator over time must be summarized in a correction ΔTZ. The correction ΔTH describes the temperature difference due to the different measuring field size of the radiation thermometer and camera. For this purpose, the temperature homogeneity of the radiator used is estimated. The SSE has a strong impact on the measurement result, as was already extensively described in Sect. 4.1.4. The resulting correction is ΔTSSE. The temperature coefficient of the test object causes a negligible temperature difference in most cases. For the sake of completeness, this part is described with the correction ΔTTK. For the exemplarily calculated uncertainty budgets it was furthermore distinguished between the application of the plate radiator and cavity radiators as calibration radiation sources. The temperature was measured at both radiators in the center with a radiation thermometer and the emissivity setting of all devices was set to 1. For a calibration temperature of 100.0 ∘C, the detailed uncertainty budget for Camera 1 is given in Table 12, and the summary of the combined uncertainties for all three cameras is listed in Table 13. If not specified explicitly, normal probability distributions of the respective uncertainty contributions are assumed. The uncertainty component resulting from the emissivity of the respective calibration source is denoted u1. For the plate radiator an emissivity of 0.91 is assumed with an uncertainty of 0.05, whereas the water-heat-pipe cavity radiator has an emissivity of 0.9994 with an uncertainty of 0.0002. The calibration environment temperature was taken to be 23 ∘C with an uncertainty of ± 1 ∘C (rectangular probability distribution); the corresponding uncertainty is listed as u2.
According to the manufacturers' data sheet, the calibrated radiation thermometer operates in the nominal spectral range from 8 to 14 µm. Two of the examined cameras have slightly different nominal spectral ranges with respect to the radiation thermometer. To calculate the correction arising from this spectral shift by applying Eqs. (5), (7), and (8), rectangular distributions were assumed for the spectral responsivities of the radiation thermometer and the cameras. The uncertainty contribution due to this correction is given by the uncertainty of the respective lower and upper wavelength integration limits in Eqs. (5), (7), and (8) and was estimated by a slight wavelength variation of these limits. For the case of the radiation thermometer, the spectral responsivity was varied to be 7.5 to 13.5 µm, hence considering both a spectral shift and a spectral bandwidth change. The resulting uncertainty contribution is tabulated as u3. The equivalent uncertainty contributions u4 for the cameras were calculated in a similar procedure. As specified in Sect. 5.1, the radiation thermometer applied was calibrated traceable to the ITS-90, and the associated uncertainty according to its calibration certificate is listed as u5.
The type A uncertainty u6 was calculated as a time-dependent SD of the mean based on typically individual averaged ROI temperature measurements. The existing spatial temperature inhomogeneity of the radiator used for calibration requires a mandatory correction to be applied due to the different FOVs of the radiation thermometer and the camera. The corresponding uncertainty contribution for this correction, especially relevant for the application of plate radiators, is denoted as u7. The uncertainty contribution u8 results from the temporal stability of the respective calibration radiator; the timescale for the temporal stability uncertainty estimation was taken to be the time period between the measurement performed with the radiation thermometer and the subsequent measurement with the camera. The further uncertainty contribution u9 has its origin in the SSE of the camera, which was determined in accordance with VDI/VDE 5855, Part 1.
Under the same conditions, the uncertainties of all cameras were estimated. The results are listed in Table 13 for a calibration temperature of 100.0 ∘C.
The uncertainty budget for the calibration applying a high-quality cavity radiator such as the water-heat-pipe cavity radiator shows that the calibration combined uncertainty is dominated by the uncertainty contributions originating from the camera, especially by the SSE-associated uncertainty. Particularly for the microbolometer cameras, which have an SSE in the range of 1 ∘C, the uncertainty of the SSE determination is the dominant part of the uncertainty budget. When calibrated with a plate radiator, the comparative lower emissivity and the temperature inhomogeneity of the radiator are the most relevant radiation source-related uncertainty contributions. The calibration with a high-quality cavity radiator results in a lower uncertainty of the calibration. In the analysis shown, no uncertainty contributions were taken into account which may be caused by incorrect user inputs, for example, the air humidity.
The technical specifications of three different thermographic cameras were determined according to Technical Directive VDI/VDE 5585 Part 1. We show that these standardized procedures improve in practice the comparability and testability of metrologically relevant technical specifications of thermographic cameras. The NETD of all three cameras determined according to Technical Directive 5855 Part 1 was lower than that given by the manufacturers in the respective data sheets.
The NU and the IETD of all cameras were determined according to VDI/VDE 5585 Part 1 with and without applying the data reference method. We show that the data reference method significantly improves the NU and the IETD of all cameras.
Three different calibration procedures according to Technical Directive VDI/VDE 5585 Part 2 were applied for the calibration of the cameras traceable to the International Temperature Scale. The procedures differ in the irradiated area of the field of view of the camera. The procedures were carried out with a plate radiator, an ammonia-heat-pipe cavity radiator, and a water-heat-pipe cavity radiator. The associated calibration uncertainties were evaluated for the plate radiator and the cavity radiators. It has been found that the cameras stayed clearly within the specified measurement uncertainties of the manufacturers when Calibration Procedures B and C were applied. However, when the complete field of view of a camera is irradiated with Calibration Procedure A, the calibration results of cameras with a large SSE become worse, and for a particular temperature, the result of one camera was outside its specifications. A systematic determination of the overall calibration uncertainty budget shows that thermographic cameras can be calibrated with an expanded measurement uncertainty (k=2, confidence interval 95 %) of below 2 K for 100 ∘C if high-quality radiators and a high-quality transfer radiation thermometer traceable to the International Temperature Scale are used. For thermographic cameras with a small SSE, calibration uncertainties significantly below 1 ∘C can be achieved when applying a high-quality cavity radiator in combination with a transfer radiation thermometer. However, it has to be pointed out that, in this case, not the complete field of view of the camera is irradiated.
All relevant measurement results are shown in the publication. However, the underlying complete measurement data are not publicly available and can be requested from the authors, if required.
JH and RDT initiated the research project and the application for funding. SK performed the measurements and the data evaluation with support from BG and JH. The uncertainty budget was set by RDT with the support of SK. SK and JH wrote the paper with contributions from RDT.
The authors declare that they have no conflict of interest.
This work was funded by the program “TransMet” under the title “Application- and Instrument Specific Calibration Procedures of Thermographic Cameras”, project number FV-73042.
This open-access publication was funded
by the Physikalisch-Technische Bundesanstalt.
This paper was edited by Bernhard Jakoby and reviewed by three anonymous referees.
Budzier, H. and Gerlach, G.: Thermal infrared sensors: theory, optimisation and practice, John Wiley & Sons, USA, 2011.
Deutsches Patent- und Markenamt: Verfahren zum Ermitteln von Korrekturparametern zum Korrigieren von Messwerten von Bildpunkten, um die Ungleichheit des Übertragungsverhaltens einzelner oder aller Bildpunkte eines Bildaufnahmesystems zu korrigieren, Deutsches Patent- und Markenamt, Germany, 10 2014 018 340.8, 2014.
German standard DIN IEC/TS 62492-2: Industrial process control devices – Radiation thermometers – Determination of the technical data for radiation thermometers (IEC/TS 62492-2:2013), Berlin, 2014.
Gutschwager, B. and Hollandt, J.: Nonuniformity correction of imaging systems with a spatially nonhomogeneous radiation source, Appl. Optics, 54, 10599–10605, 2015.
Gutschwager, B. and Hollandt, J.: Nonuniformity correction of infrared cameras by reading radiance temperatures with a spatially nonhomogeneous radiation source, Meas. Sci. Technol., 28, 015401, https://doi.org/10.1088/1361-6501/28/1/015401, 2017.
Gutschwager, B., Gärtner, R., and Hollandt, J.: An infrared precision radiation thermometer for the calibration of remote sensing instrumentations under vacuum, Image and Signal Processing for Remote Sensing XV, Vol. 7477, International Society for Optics and Photonics, Berlin, 2009.
Gutschwager, B., Cárdenas-García, D., and Hollandt, J.: Determination of the responsivity non-uniformity of an infrared camera with regard to the measurement of radiance temperatures, Meas. Sci. Technol., 26, 115402, https://doi.org/10.1088/0957-0233/26/11/115402, 2015a.
Gutschwager, B., Taubert, D., and Hollandt, J.: Analysis of reference sources for the characterization and calibration of infrared cameras, Int. J. Thermophys., 36, 303–314, 2015b.
ISO, IEC, and BIPM OIML: Guide to the Expression of Uncertainty in Measurement, Geneva, Switzerland, 1995.
König, S., Gutschwager, B., and Hollandt, J.: Nonuniformity determination of infrared imagers by detecting radiance temperatures with the Data Reference Method, Image and Signal Processing for Remote Sensing XXIV, Vol. 10789, International Society for Optics and Photonics, Berlin, 2018.
Miklavec, A., Pušnik, I., Batagelj, V., and Drnovšek, J.: A large aperture blackbody bath for calibration of thermal imagers, Meas. Sci. Technol., 24, 025001, https://doi.org/10.1088/0957-0233/24/2/025001, 2012.
Milton, A. F., Barone, F. R., and Kruer, M. R.: Influence of nonuniformity on infrared focal plane array performance, Opt. Eng., 24, 245855, https://doi.org/10.1117/12.7973588, 1985.
Müller, I., Adibekyan, A., Gutschwager, B., Kononogova, E., König, S., Monte, C., Reiniger, M., and Hollandt, J.: Calibration capabilities at PTB for radiation thermometry, quantitative thermography and emissivity, in: 14th Quantitive InfraRed Thermography Conference, Tu. 2. C. 1-QIRT, Berlin, 2018.
Nelson, M. D., Johnson, J. F., and Lomheim, T. S.: General noise processes in hybrid infrared focal plane arrays, Opt. Eng., 30, 1682–1701, 1991.
Pušnik, I., Grgić, G., and Drnovšek, J.: Calculated uncertainty of temperature due to the size-of-source effect in commercial radiation thermometers, Int. J. Thermophys., 29, 322–329, 2008.
VDI/VDE 3511 Part 4.3: Temperature measurement in industry – Radiation thermometry – Standard test methods for radiation thermometers with one wavelength range, Verein Deutscher Ingenieure, Düsseldorf, 2005.
VDI/VDE 3511 Part 4.4: Temperature measurement in industry – Radiation thermometry – Calibration of radiation thermometers, Verein Deutscher Ingenieure, Düsseldorf, 2005.
VDI/VDE 5585 Part 1: Technical temperature measurement – Temperature measurement with thermographic cameras – Metrological characterization, Verein Deutscher Ingenieure, Düsseldorf, 2018.
VDI/VDE 5585 Part 2: Technical temperature measurement – Temperature measurement with thermographic cameras – Calibration, Verein Deutscher Ingenieure, Düsseldorf, 2020.
Vollmer, M. and Möllmann, K.-P.: Infrared thermal imaging: fundamentals, research and applications, John Wiley & Sons, Berlin, 2018.
Yoon, H. W., Allen, D. W., and Saunders, R. D.: Methods to reduce the size-of-source effect in radiometers, Metrologia, 42, 89, https://doi.org/10.1088/0026-1394/42/2/003, 2005.
- Abstract
- Introduction
- Instrumentation
- Standardized methods for characterization and calibration of thermographic cameras
- Metrological characterization
- Calibration and uncertainty
- Conclusions
- Data availability
- Author contributions
- Competing interests
- Acknowledgements
- Financial support
- Review statement
- References