the Creative Commons Attribution 4.0 License.
the Creative Commons Attribution 4.0 License.
 | 11 Feb 2020
A mobile nondestructive testing (NDT) system for fast detection of impact damage in fiber-reinforced plastics (FRP)
Johannes Rittmann
Markus Rahammer
Niels Holtmann
Marc Kreutzbruck
Impact damage in fiber-reinforced plastics, such as carbon-fiber-reinforced plastics (CFRP) and glass-fiber-reinforced plastics (GFRP), involves high challenges to nondestructive testing (NDT). The anisotropic material structure significantly complicates the interpretation of results in conventional testing. Resonant frequency sweep thermography (RFST) based on local defect resonance combined with well-known ultrasonic thermography enables the fast and simple detection of relevant impact damages. RFST utilizes frequency sweep excitation in the low- and mid-kilohertz range to activate defect resonances with low acoustical power of a few megawatts. Resonances of defects amplify the acoustic vibration amplitude by more than 1 order of magnitude and lead to a significant enhancement of the corresponding thermal signal. This is based on both crack friction and/or visco-elastic heating and can be detected at the part surface by an infrared camera. The defect detection threshold depends on excitation power and the distance between the defect and the ultrasonic source.
For this new NDT approach, a first prototype system in the form of a tripod with an integrated infrared (IR) camera and ultrasonic excitation was developed. It stands out due to its simple handling and flexible applications. Augmented reality assists the inspector to interpret the results and mark the defect by projecting the evaluated test result onto the part surface. In this article, the first results from a series of impact damages in CFRP of varying impact energies and crack sizes are presented.
- Article
(4678 KB) - Full-text XML
- BibTeX
- EndNote


1.1 Impact damage in fiber-reinforced plastics
Impact damage is a short-term point load perpendicular to the part surface. Fiber-reinforced plastics (FRP) are most susceptible to this load direction as this is not a principle fiber orientation. Often cited causes are tool drop, hail or bird strike. However, one of the most prevalent occurrences in aerospace is the so-called “ramp crash” with ground service vehicles (Kanki and Brasil, 2009). Depending on the impact energy matrix cracks, delaminations or even fiber cracks and penetration of the impactor may occur. Even small energies may produce delaminations that are (barely) visible from the outside (BVID). The stress distribution at impact load leads to increasing damage with increasing depth and is presented in Fig. 1. The specimen shown consists of unidirectional carbon fiber prepreg material with an eight-ply quasi-isotropic [45, 0, layup and an epoxy matrix. At impact loading, compressive and tensile stresses are greatest near the two surfaces, while shear stresses are greatest in the center, similar to a three-point-bending test. Shear stresses lead to matrix cracks (i), which accumulate to delaminations at the interfaces (ii). Due to rotational symmetry, additional matrix cracks parallel to the fiber direction occur within the bottom layers (iii).
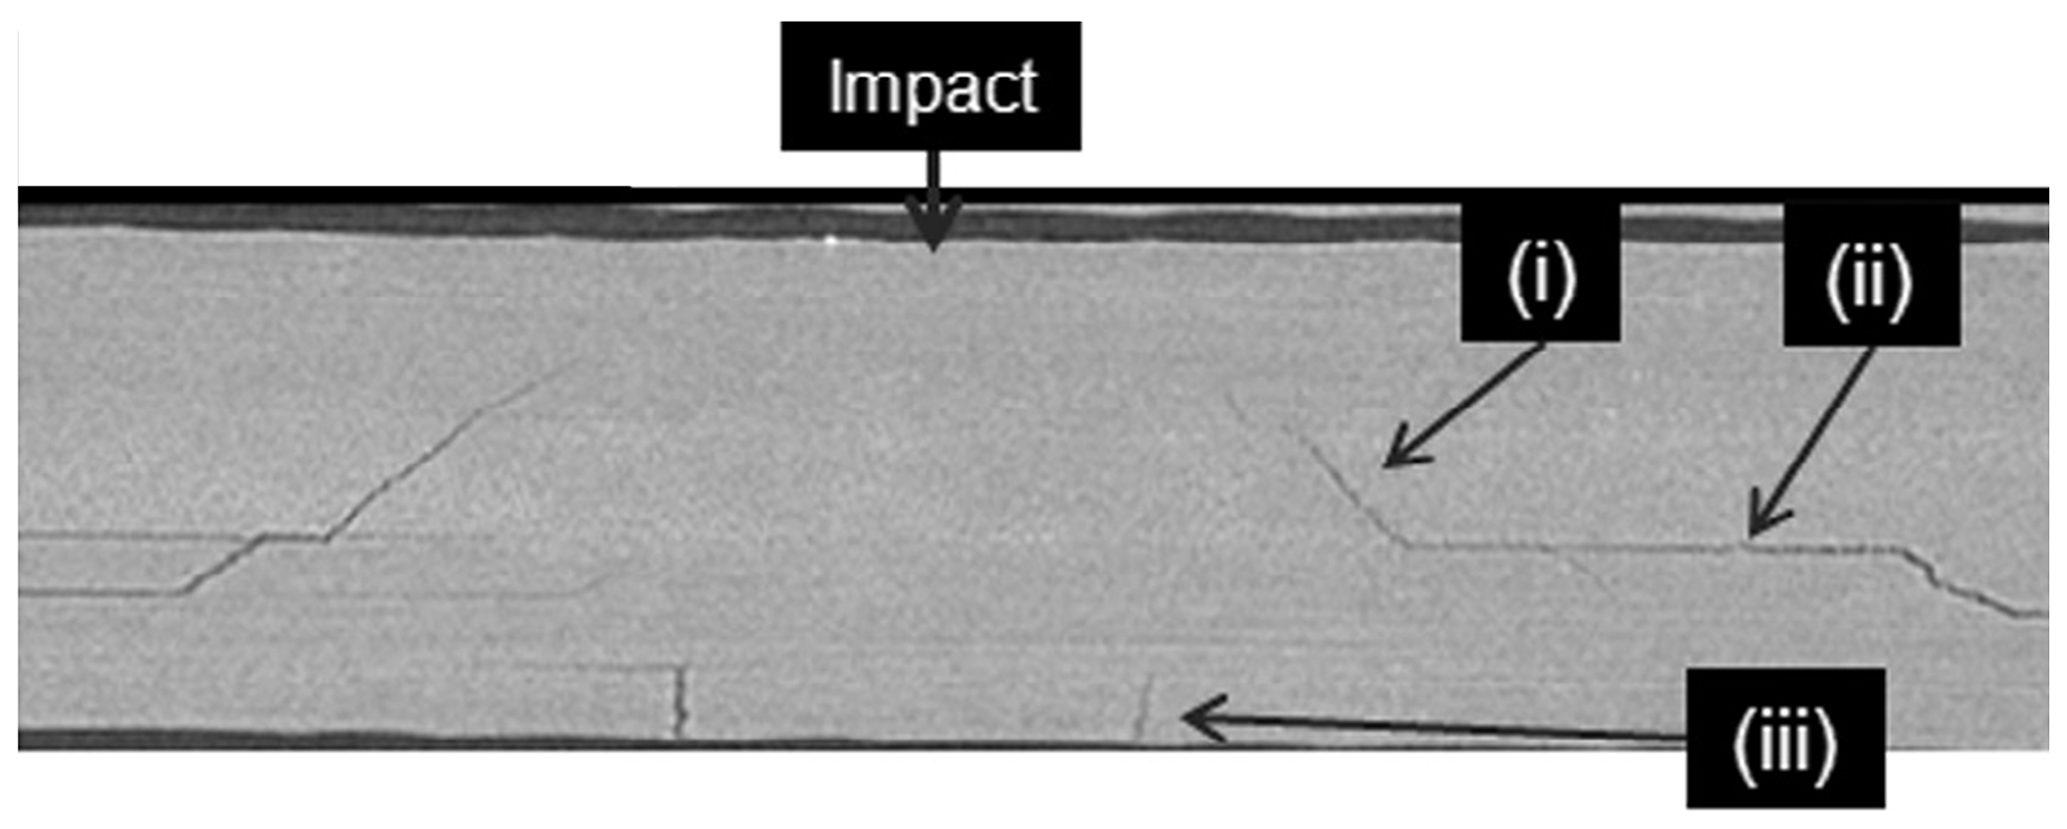
Figure 1Computer tomography of impact damage in CRFP (Bull et al., 2013).
1.2 NDT of impact damage
Ultrasonic testing is the most common technique used for this application. This technique became established in the FRP industry due to the high level of standardization and high reliability. Long testing times due to slow scanning process are therefore accepted even for very large structures. Computer tomography (CT) is usually only used as a reference technique during research and development due its high machine cost and time effort. Typical FRP production faults like pores, matrix clusters or delaminations can be found via CT due to its high resolution (Yang and Elhajjar, 2014).
Besides these standard techniques, thermographic nondestructive testing (NDT) is becoming more and more established. The main application of optically excited thermography testing (OTT) for FRP is fast NDT of large and thin surfaces as they are used in many aerospace or wind energy applications. Delaminations (e.g., due to impact) that prevent transverse heat flow are among the most commonly and reliably found defects (Avdelidis et al., 2003; Maierhofer et al., 2014).
Ultrasonic thermography (UTT) is, in contrast to most other NDT methods, a defect-selective technique or a so-called dark-field technique. This selectivity is due to several reasons. First, crack friction can only happen at cracks and crack-like defects. Secondly, stress peaks occur mainly in the proximity of damaged areas. Finally, flexural stiffness is locally reduced in damaged areas, resulting in increased vibration amplitudes at these locations. A common method to excite specimens is using ultrasonic welding sonotrodes with pneumatic fixture (Mignogna et al., 1981). Sometimes, redesigns allow for mobile, handheld applications as well (Thomas et al., 2003; Polimeno et al., 2014). The available electric power of these devices is typically 1–2 kW and can endanger the specimen. Welding sonotrodes are designed to work at fixed resonance frequencies (usually 20 or 40 kHz) in order to introduce maximum amplitude into the welding area. In contrast, Han et al. (2004) were the first to find an influence of the ultrasonic spectrum on the defect signal when exciting with an acoustic chaos. At that point they did not give an explanation. Afterwards, Zweschper et al. (2003) were the first to fairly improve the signal-to-noise ratio of the defect signal by means of frequency tuning. Eventually, Gleiter et al. (2007) found a correlation between the defect signal and the excitation frequency independently of the specimen resonances.
Due to much smaller dimensions – in comparison to the component – and the resulting smaller mass and stiffness of the local damaged area, resonance frequencies are 1 to 2 orders of magnitude greater than the natural resonances of the whole structure. The first mention and an analytical description of this effect were presented by Solodov et al. (2011, 2013). Due to the efficient vibration amplification this method is suitable for application in UTT. In numerous experiments, Solodov et al. (2015a, b) demonstrated the positive influence that local defect resonance (LDR) excitation can have on UTT. The local dissipation of mechanical energy affects the thermal response signal of the damaged area. For crack friction, the thermal energy ΔW is proportional to the amplitude and the friction coefficient; for viscoelastic damping, the thermal energy ΔW is proportional to the vibration frequency and to the amplitude in square.
On the basis of these discoveries, a completely new testing approach based on ultrasonic thermography was developed at the Institut für Kunststofftechnik (IKT), which has already been successfully turned into a first prototype.
After introducing impact damage in FRP and the methods used for investigation, the prototype system for the mobile RFST system is presented and explained.
2.1 Specimens
A total of eight similar specimens, two quartered 2 mm CFRP car roofs, were exposed to five impact damages each. The car roofs consist of four layers of CFRP fabric [0, 90] with a polysulfone (PES) matrix. The front and rear views of one of those quartered roofs are shown in Fig. 2 exemplarily.
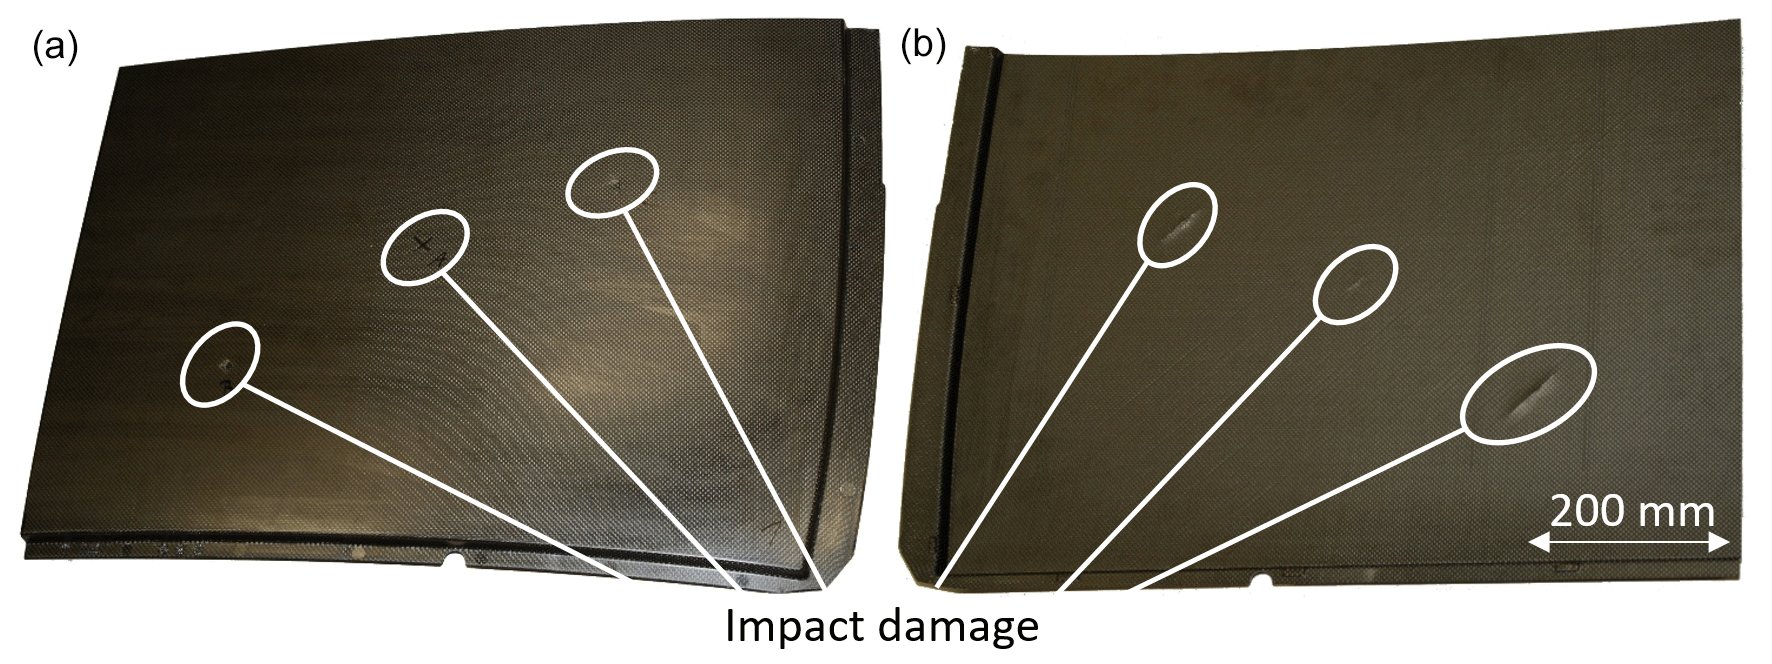
Figure 2Photographs of the front side with markings (a) and rear view with prominent delaminations (b) of a quartered CFRP roof with impact damage. White circles indicate damage areas.
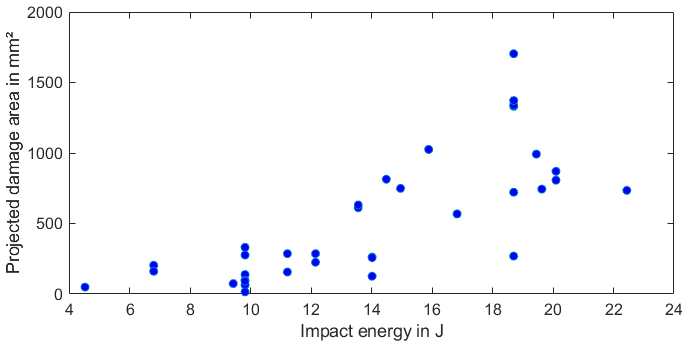
Based on empirical values with test specimens and correlation with X-ray as well as ultrasound studies, the defect size of the impact damage was determined by means of rear-sided optical thermography plus 20 % (Rahammer, 2018). The impact energies used and the resulting damage areas are in the range from 4.5 J and 15 mm2 to 22.4 J and 1704 mm2. They are plotted in Fig. 3. Damage was introduced with the goal of validating the technique for reliable detection of Ø 1′′ (506 mm2) damage as is required in the aerospace industry. The impact was performed on a self-made falling tower system with variable mass and drop height. The impactor has the geometry of a sphere with a radius of 10 mm. The variation in impact energies in combination with the complex specimen geometry lead to a large scatter in the resulting damage areas.
2.2 Design of a prototype for a mobile FST system
The prototype was designed for mobile testing on large-area structures. The basic requirements were easy handling, a low weight and packing dimensions that allow the prototype to be transported alone. Three legs were selected for easy adaptation to uneven surfaces. The core elements of the technique are the excitation source and the thermal imaging camera. For excitation, three vacuum-attached piezo-based transducers, which were specifically developed for this technique, are used. They are able to work with a vacuum pump as well as pressurized air in combination with a Venturi nozzle. Piezo-based transducers are most suited for ultrasonic thermography since they produce the highest amplitudes among known transducer technologies. The vacuum not only fixes the testing system onto the structure, but also presses the shaker onto it. The shakers are powered by an amplifier (isi-sys GmbH) that produces 60 V AC. Considering the piezo internal capacitance of approximately 280 nF, the total electric power is much lower than it used to be for welding sonotrode excitation. Thus, the necessary hardware can also be much simpler. As will be shown later, the combined system of an amplifier and shakers is most efficient in the frequency range of 18–25 kHz. This range is also advantageous regarding noise protection.
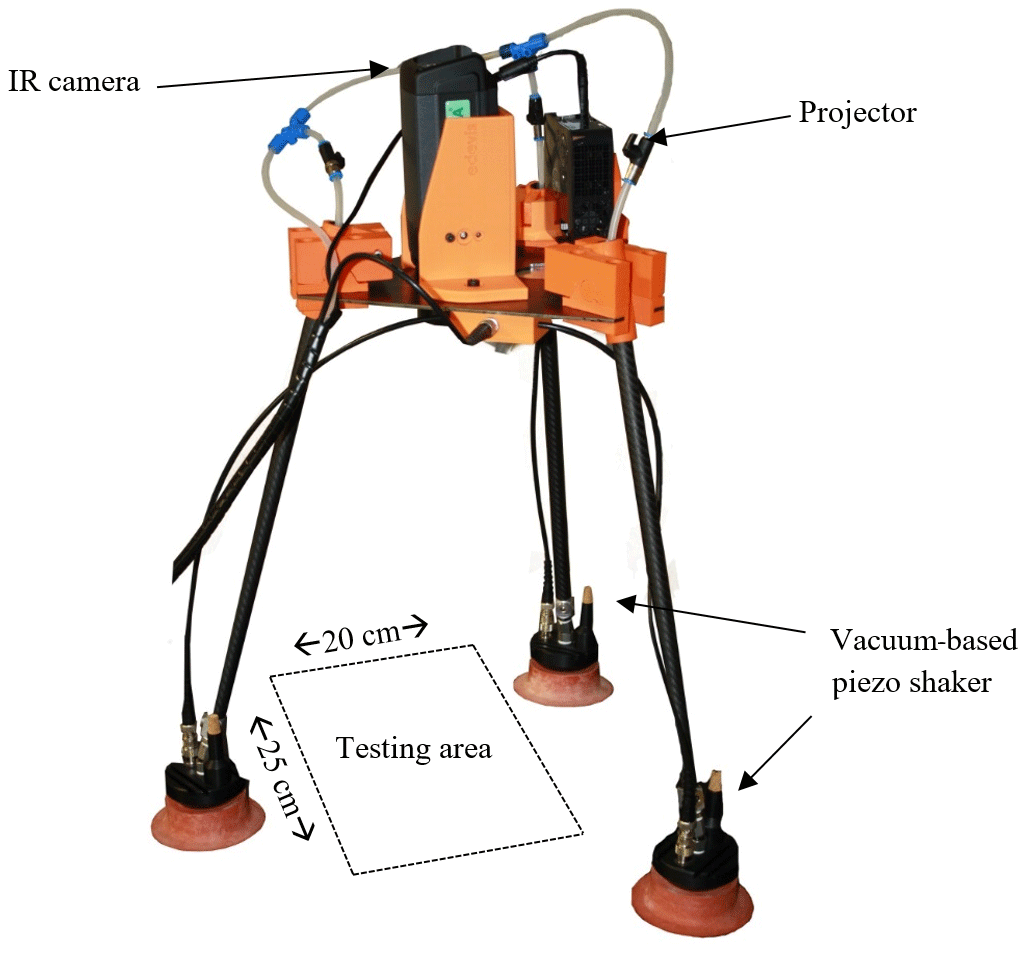
A micro-bolometer infrared camera is chosen for cost and weight reasons. Such systems provide noise-equivalent temperature difference (NETD) values under 30 mK as well as an image resolution of 640×512 pixels. The prototype presented here (Fig. 4) includes a FLIR A655sc that can record thermal images at a rate of 50 Hz.
Furthermore, the system incorporates an integrated miniature projector. Its purpose is to project the automatically analyzed testing result back onto the structure. This augmented reality application provides the user with a fast and easy way to interpret the result and precisely mark the defect location. For this, the fields of view of the camera and the projector are optically aligned. The excitation of the defect by three piezo transducers is done by a periodic repeated linear frequency sweep. Subsequently, a discrete Fourier transform (DFT) took place (Rahammer, 2018). For this purpose, the thermogram is taken at each individual pixel and a DFT is evaluated at the sweep duration of the known excitation period. The result is a phase and amplitude value at each pixel. Due to the uncertainty of phase values outside the defect area, the signal is evaluated in the amplitude image of DFT.
2.3 Determination of signal-to-noise ratio
Calculation of the signal-to-noise ratio (SNR) is a very common method in signal processing to quantify signal quality in contrast to background and/or system noise. Because there are many different types of signals, no norm for SNR calculation has been developed. Each industry and field defines signal and noise slightly differently and applies its own standards that are most suitable. In this article, the method presented by Hidalgo-Gato et al. (2013) will be used:
Here, σSNR is the standard deviation in the sound area, and Sarea and Narea are the mean values in the defect and sound area, respectively. The determination of defect and sound area sizes and locations was a subjective user decision due to the lack of automatic result analysis and does influence the final SNR slightly. In the following results only amplitude images are evaluated. Due to the defect-selective technique of ultrasonic thermography, phase images are inherently very noisy in the sound area.
The new testing system described was used to further investigate the RFST method and its crucial parameters. Finally, the results for the CRFP specimens described above are evaluated critically.
3.1 Influence of excitation frequency
The defect resonance frequencies of impact-induced damage vary in the range from 15 to 130 kHz or more. This depends strongly on the material itself and whether the damage consists of fully developed large delaminations or multiple small ones. The resonance frequencies of the latter are much higher due to inverse proportionality to the damage area (Solodov et al., 2011, 2013, 2015a, b). Frequencies above 50 or even 100 kHz cannot be excited with sufficient amplitude with conventional amplifiers and transducers. For this article, the impact damages investigated exhibit LDR frequencies in the range of 60 kHz or more.
However, there are further efficient frequencies available. For example, in Fig. 5, the electric power as well as the amplitude velocity for an attached specimen is shown. There, the hardware has a maximum efficiency at around 20.5 kHz, as is shown by the blue graph in Fig. 5. The piezo shakers also have natural resonance frequencies. At these frequencies the electric energy is converted into mechanical vibrations most efficiently. For the combination of the specimen and the shakers used these are 21.8, 23.7 and 25.4 kHz, as can be seen in the red curve in Fig. 5. A comparison of both graphs reveals that the combined optimum lies around 20 to 22 kHz. This not only ensures the efficient excitation of local defect resonances, but also ensures the efficient excitation of heat-generating effects such as Coulomb friction at crack tips.
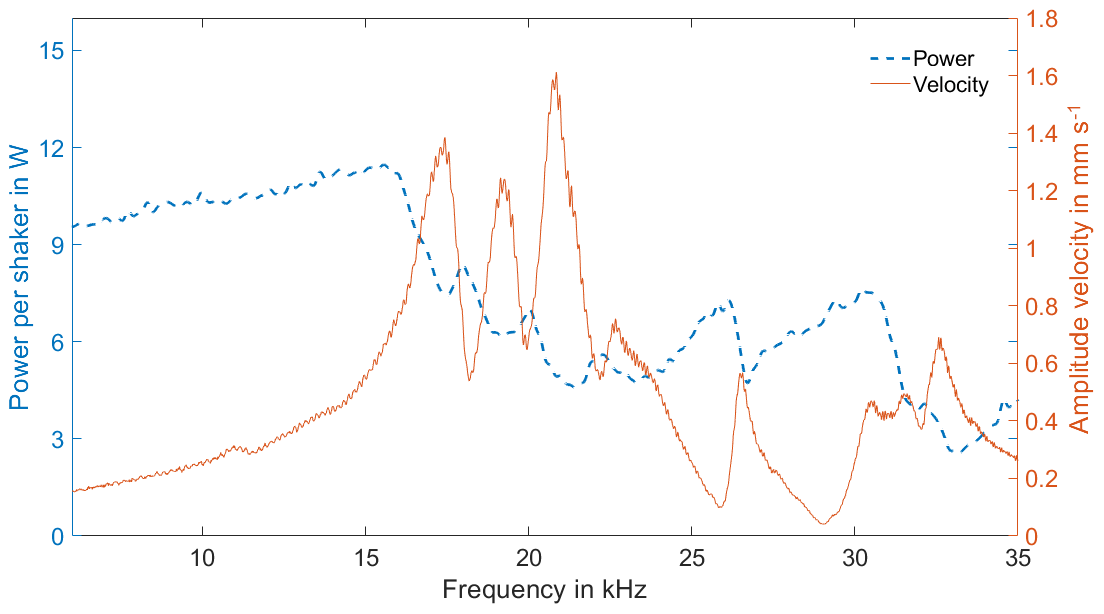
Figure 5Electric power of the amplifier (blue) and specimen amplitude velocity (red) dependent on the excitation frequency.
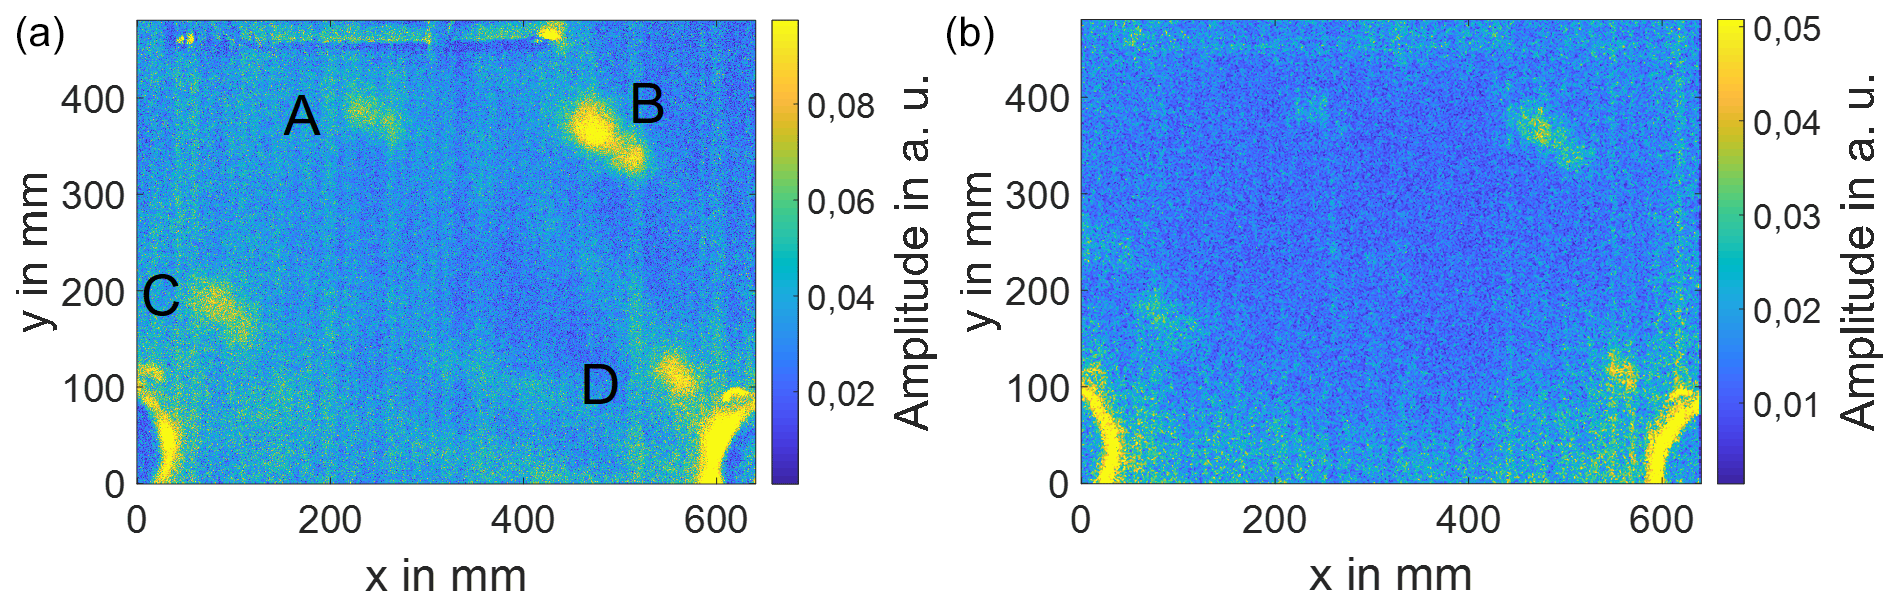
Figure 6RFST results on an impacted specimen at a 18–25 kHz frequency sweep (a) and 10–40 kHz frequency sweep (b). A–D indicate impact damage for a CFRP car roof. The two artifacts in the lower corners indicate the positions of piezo shakers.
This result is proven in the following test results (Fig. 6). They each show the result of a specimen with four impact damages in the camera field of view. Specifically, an amplitude image is evaluated according to the RFST method. For the case shown, a smaller bandwidth results in much higher SNR values at the defect locations. This is illustrated by looking at the vibration amplitudes of the CFRP car roof at position B in comparison to an undamaged position (Fig. 7). The shown amplitude vibrations are out-of-plane deformations and were measured using a scanning laser Doppler vibrometer (Polytec PSV-3001S, Waldbronn). The excitation took place via a piezo actuator and periodic chirp applied to the CFRP car roof. The eigenfrequencies of the component occur up to approximately 20 kHz, above which the local defect resonances of the impact damage are predominant. Using a sweep frequency range of 18–25 kHz (Fig. 6a), LDR frequencies in the defect are excited in a selective manner, resulting in a high visibility of the defect. A more broadband excitation with 10–40 kHz (Fig. 6b) and otherwise identical test conditions leads to a reduced visibility of the impact damage. In the example shown, the LDR frequencies of the impact damage lie within the optimum working area of the electrical system, which ensures the efficient excitation of the impact damage. Therefore, a smaller, but more selective, bandwidth results in a more efficient excitation and more reliable defect detection.
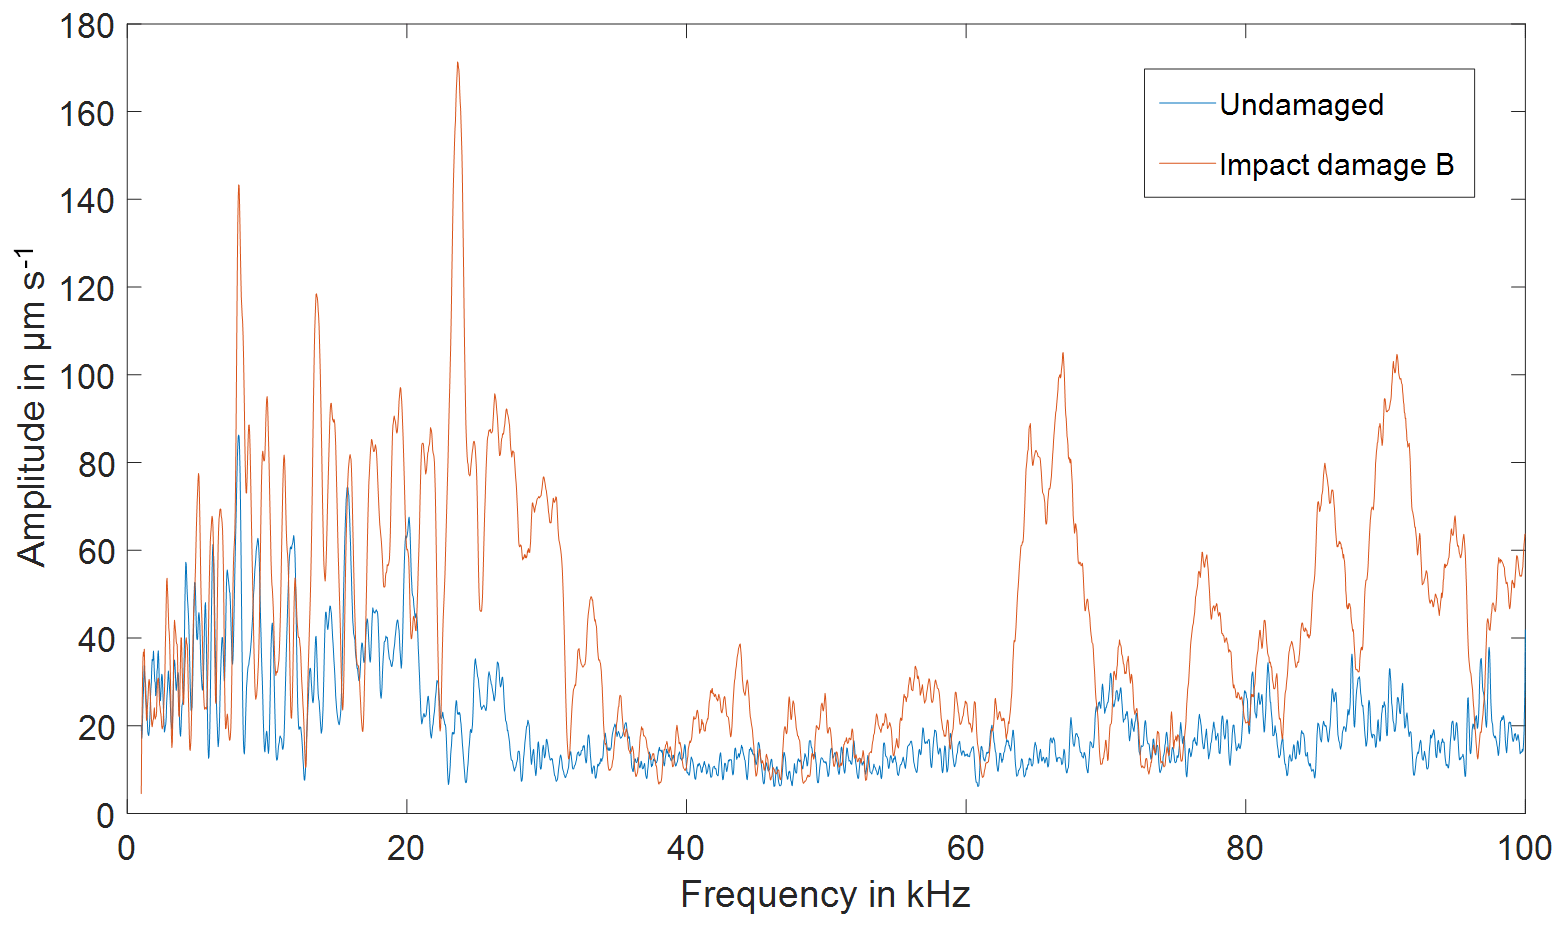
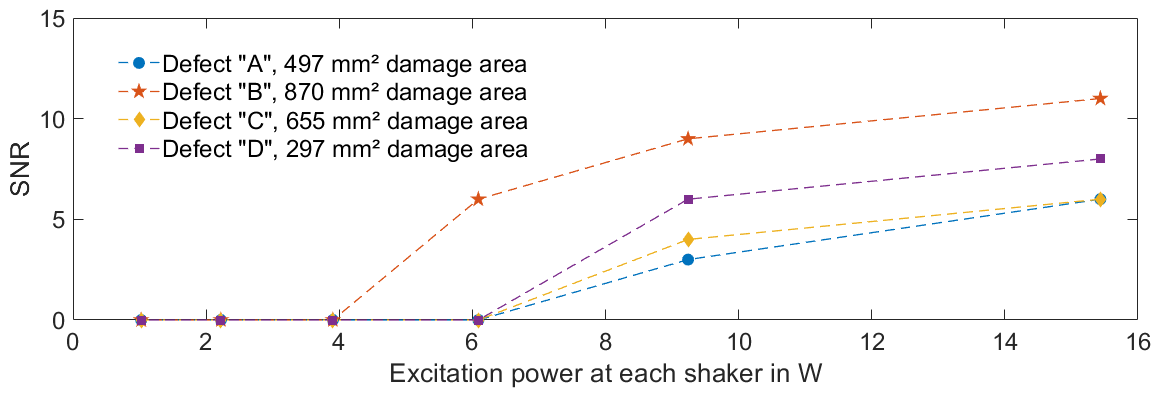
Figure 8Signal-to-noise ratio of the defect signal depending on the excitation power at a 18–25 kHz frequency sweep.
3.2 Influence of excitation power
Naturally, the defect detection rate scales directly with the heat produced at the defect, which in return increases with increasing ultrasonic amplitude. This well-known relation has always been a means to increase the UTT detection rate. A series of RFST measurements with variable excitation power is presented in Fig. 8.
All four defects (A–D) can be detected starting at a power of 8 W. It is interesting to note that the defect size has only a partial influence on the detection rate. A high SNR can also occur for defects of comparatively small size in the case that they are located very close to the excitation source; see Table 1. This is the case for defect D in this example.
Table 1Distance from the nearest piezo and defect area for an impacted specimen.
3.3 Results
Figure 9 presents the prototype testing system in action. It is able to test an area of approximately 200 mm × 300 mm. The user fixes it to the surface with the help of either pressurized air (Venturi principle) or a vacuum, depending on availability. The suction bases also press the shakers onto the surface for an optimal excitation of the ultrasound. Additionally, the flowing air is used to cool the piezo transducers, increasing their long life. Simultaneously with the excitation, the thermal camera records a thermogram sequence, which is online processed with FFT. Thus, the resulting amplitude image is immediately available at the end of the testing phase and is projected onto the surface. This provides the user with a means for the fast and easy interpretation of the results. In Fig. 9 one defect is visible and displayed with a false color representation.
Figure 11Testing result of a CFRP plate with two impact damages with 0 and 3 dB SNR, respectively.
All specimens presented earlier have been tested with the system described above using optimal parameters, such as bandwidth 18–25 kHz. Fourier-transform-based ultrasonic thermography was done according to Rahammer and Kreutzbruck (2017). During the testing time of 60 s the bandwidth was swept twice, resulting in a 30 s long periodic temperature signal and a Fourier frequency of 1∕30 Hz for FFT post-processing. Through the periodic excitation and Fourier transform, it is possible to evaluate thermal signals even smaller than the noise signal. This is due to the regularity of excitation and at the same time the arbitrariness of the noise signal. SNR values for all defects have been extracted from the amplitude images with the method described above and represent the detection quality for each defect. These values are plotted in Fig. 10. The graph also includes the target defect size of 506 mm2 (green dashed line), which is required by the aerospace industry.
The detection threshold, which resembles a sufficient SNR value for reliable defect identification and localization (here: 3 dB), has to be redefined for each NDT technique and each testing system. Furthermore, it has to be adjusted for each new application and depends not only on structure and material but also on the type of evaluation, either automatic or manual. For the present case, manual evaluation of the results was performed. Here, a threshold of 3 dB is reasonable, as is proven with the result in Fig. 11. The small defect with an SNR of 3 dB in the upper right corner is clearly visible to the human observer. A second defect that is within the same testing area does not produce enough heat. Its SNR is zero.
As is seen in Fig. 10, all defects from this study with a damage size greater than 506 mm2 (1 in2) can be detected reliably. An elaborate probability of detection (POD) study was omitted for time and cost reasons, but the reproducibility and reliability of RFST have been validated in an earlier publication (Rahammer and Kreutzbruck, 2018).
A new approach with an acousto-thermal nondestructive testing technique was developed and integrated into a mobile prototype NDT device. It is based on well-known ultrasonic thermography and uses hardware, specimen and local defect resonances for efficient excitation. It was specifically designed for fast and easy-to-interpret application in impact damage detection. Its handheld design allows for mobile usage at impact-injured FRP structures with a testing time of only 1 min. The result is imaged back onto the surface by a projector at the real position and thus allows defects to be directly assigned to the inspector.
An exemplary 2 mm thick CFRP component, a car roof with several induced impact damages, was used to demonstrate that a relevant damage size greater than 506 mm2 can be reliably detected. Basic investigations also indicate that the efficiency of the process in terms of testing time and detection rate can be significantly increased by optimizing the excitation hardware.
Due to the short inspection time, the system is suitable for the inspection of large surface areas such as wind turbine rotor blades and aircraft wings. The inherent dark-field method makes the test results easy to interpret even for untrained personnel, further increasing the flexibility of the system.
Future works will investigate the further optimization of the excitation hardware in order to excite the component efficiently even at higher frequencies. Thus, the defect resonances of defects are to be utilized even more efficiently. In a further step, the tripods of the prototype are to be equipped with actuators so that a large inspection area can be scanned automatically.
The data presented in this article are stored in an internal system according to the guidelines of the ZIM program.
JR, MR and NH are responsible for the sample preparation, the construction of the prototype and for the measurements. All authors contributed to the writing process. JR and MK approved the final paper.
The authors declare that they have no conflict of interest.
This article is part of the special issue “Sensors and Measurement Systems 2019”. It is a result of the “Sensoren und Messsysteme 2019, 20. ITG-/GMA-Fachtagung”, Nuremberg, Germany, 25–26 June 2019.
The underlying research project MULTI-FKV is funded within the ZIM program of the German Federal Ministry for Economic Affairs and Energy (BMWi) on the basis of a decision by the German Bundestag (AiF ZIM project no. ZF4041102EB5). The authors would like to express their gratitude for the funding.
This open-access publication was funded
by the University of Stuttgart.
This paper was edited by Eric Starke and reviewed by two anonymous referees.
Avdelidis, N. P., Hawtin, B. C., and Almond, D. P.: Transient thermography in the assessment of defects of aircraft composites, NDT & E Int., 36, 433–439, https://doi.org/10.1016/S0963-8695(03)00052-5, 2003.
Bull, D. J., Spearing, S. M., Sinclair, I., and Helfen, L.: Three-dimensional assessment of low velocity impact damage in particle toughened composite laminates using micro-focus X-ray computed tomography and synchrotron radiation laminography, Composit. Pt. A, 52, 62–69, https://doi.org/10.1016/j.compositesa.2013.05.003, 2013.
Gleiter, A., Spießberger, C., and Busse, G.: Improved ultrasound activated thermography using frequency analysis, Quant. InfraRed Thermogr. J., 4, 155–164, https://doi.org/10.3166/qirt.4.155-164, 2007.
Han, X., Zeng, Z., Li, W., Islam, M. S., Lu, J., Loggins, V., Yitamben, E., Favro, L. D., Newaz, G., and Thomas, R. L.: Acoustic chaos for enhanced detectability of cracks by sonic infrared imaging, J. Appl. Phys., 95, 3792–3797, 2004.
Hidalgo-Gato, R., Andrés, J. R., López-Higuera, J. M., and Madruga, F. J.: Quantification by Signal to Noise Ratio of Active Infrared Thermography Data Processing Techniques, Opt. Photon. J., 03, 20–26, https://doi.org/10.4236/opj.2013.34A004, 2013.
Kanki, B. G. and Brasil, C. L.: Analysis of ramp damage incidents and implications for future composite aircraft structure, NASA Technical Report, NASA Ames Research Center, Moffett Field, 2009.
Maierhofer, C., Myrach, P., Reischel, M., Steinfurth, H., Röllig, M., and Kunert, M.: Characterizing damage in CFRP structures using flash thermography in reflection and transmission configurations, Composit. Pt. B, 57, 35–46, https://doi.org/10.1016/j.compositesb.2013.09.036, 2014.
Mignogna, R. B., Green, R. E., Duke, J. C., Henneke, E. G., and Reifsnider, K. L.: Thermographic investigation of high-power ultrasonic heating in materials, Ultrasonics, 19, 159IN1161–160IN2163, 1981.
Polimeno, U., Almond, D. P., Weekes, B., and Chen, E. W. J.: A compact thermosonic inspection system for the inspection of composites, Composit. Pt. B, 59, 67–73, https://doi.org/10.1016/j.compositesb.2013.11.019, 2014.
Rahammer, M.: Nachweis von Impact-Schäden in Faserkunststoffverbunden mittels Resonanter Frequenzsweep Thermografie, PhD thesis, Institut für Kunststofftechnik, University of Stuttgart, Stuttgart, Germany, https://doi.org/10.18419/opus-10123, 2018.
Rahammer, M. and Kreutzbruck, M.: Fourier-transform vibrothermography with frequency sweep excitation utilizing local defect resonances, NDT & E Int., 86, 83–88, https://doi.org/10.1016/j.ndteint.2016.11.012, 2017.
Rahammer, M. and Kreutzbruck, M.: Validierung der Resonanten Frequenzsweep-Thermografie mittels einer POD-Analyse, Materials Testing, Materialprüfung, 60, 483–488, https://doi.org/10.3139/120.111179, 2018.
Solodov, I., Bai, J., Bekgulyan, S., and Busse, G.: A local defect resonance to enhance acoustic wave-defect interaction in ultrasonic nondestructive evaluation, Appl. Phys. Lett., 99, 211911, https://doi.org/10.1063/1.3663872, 2011.
Solodov, I., Bai, J., and Busse, G.: Resonant ultrasound spectroscopy of defects: Case study of flat-bottomed holes, J. Appl. Phys., 113, 223512, https://doi.org/10.1063/1.4810926, 2013.
Solodov, I., Rahammer, M., Derusova, D., and Busse, G.: Highly-efficient and noncontact vibro-thermography via local defect resonance, Quant. InfraRed Thermogr. J., 12, 98–111, 2015a.
Solodov, I., Derusova, D., and Rahammer, M.: Thermosonic Chladni figures for defect-selective imaging, Ultrasonics, 60, 1–5, 2015b.
Thomas, R. L., Favro, L. D., and Han, X.: Hand-held sound source gun for infrared imaging of sub-surface defects in materials, United States Patent 6593574, 2003.
Yang, P. and Elhajjar, R.: Porosity content evaluation in carbon-fiber/epoxy composites using X-ray computed tomography, Polymer-Plast. Technol. Eng., 53, 217–222, 2014.
Zweschper, T., Dillenz, A., Riegert, G., Scherling, D., and Busse, G.: Ultrasound excited thermography using frequency modulated elastic waves, Insight-Non-Destruct. Test. Condit. Monit., 45, 178–182, 2003.