the Creative Commons Attribution 4.0 License.
the Creative Commons Attribution 4.0 License.
 | 15 Jul 2021
Investigation of a metrological atomic force microscope system with a combined cantilever position, bending and torsion detection system
Yiting Wu
Elisa Wirthmann
Ute Klöpzig
Tino Hausotte
This article presents a new metrological atomic force microscope (MAFM) head with a new beam alignment and a combined one-beam detection of the cantilever deflection. An interferometric measurement system is used for the determination of the position of the cantilever, while a quadrant photodiode measures the bending and torsion of the cantilever. To improve the signal quality and reduce disturbing interferences, the optical design was revised in comparison to the systems of others (Dorozhovets et al., 2006; Balzer et al., 2011; Hausotte et al., 2012). The integration of the MAFM head in a nanomeasuring machine (NMM-1) offers the possibility of large-scale measurements over a range of mm with sub-nanometre resolution. A large number of measurements have been performed by this MAFM head in combination with the NMM-1. This paper presents examples of the measurements for the determination of step height and pitch and areal measurement.
- Article
(1940 KB) - Full-text XML
- BibTeX
- EndNote


Nowadays, decreasing structural sizes, feature miniaturization and, at the same time, increasing component dimensions characterize the measurement tasks for micro- and nanomeasuring systems. Since its invention in 1986 (Binning et al., 1986), the atomic force microscope (AFM) has been widely used in precision engineering and in micro- and nanotechnology. Different approaches have been developed to measure the deflection of the cantilever. Currently, optical beam deflection (OBD) systems are mainly applied to detect the bending and torsion of the cantilever (Yacoot and Koenders, 2011). In contrast to that, focus sensor detection systems and interferometric detection systems can be used to measure the position of the cantilever. A benefit of using the laser interferometer for measurements is the direct traceability to the metre definition by the laser wavelength.
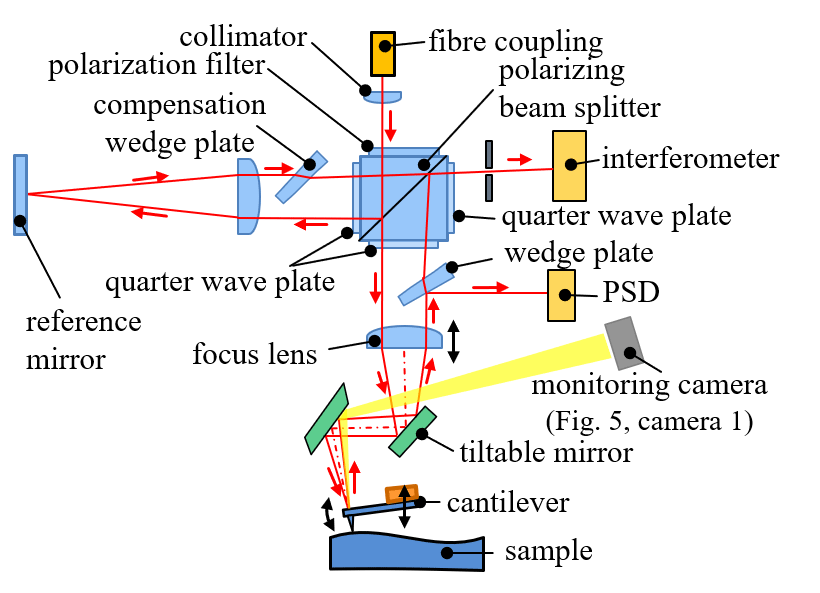
A new version of a metrological laser interferometer-based AFM head has been developed at the Institute of Manufacturing Metrology (FMT). The measuring head combines exact interferometric position measurement directly on the reflecting backside of a cantilever and simultaneous measurement of bending and torsion of the cantilever by a position-sensitive detector (PSD) with the same focused laser beam (Dorozhovets et al., 2006). Due to the optical design of the old system, disturbing interferences on the PSD appeared, which were caused by reflections on the quarter wave plate of the measuring arm (Balzer et al., 2011). For this reason, the optical system has been revised, and the AFM head has been newly designed and manufactured. During the measurement with an AFM, the cantilever is usually slightly tilted (in our system by 8∘) in order to avoid contact of the clamping chip with the surface of the measured object. In order to adapt our measuring system for AFM measurements, a focus lens and two tiltable plane mirrors are used to adjust the direction of the focused laser beam and the position of the focus. Consequently, the optical axis of the focus lens in the measuring arm can be set to be perpendicular to the reflecting backside of the cantilever. The tilt range and shift range of this adjustment unit also allow us to adapt the system after exchanging the cantilever or the complete cantilever unit. Typically, this adjustment process takes 5 to 10 min. For observation, one camera with an adjustable focal length (Fig. 5; camera 3) and two cameras with high magnification (Fig. 5; cameras 1 and 2) were integrated. Camera 1 serves to monitor the adjustment of the focus of the laser beam on the backside of the cantilever, while camera 2 is used to visualize the approach process during the measurement from the side. Camera 3 allows an overview of the sample and helps to observe the adjustment of the sample. The new system design is shown in Fig. 1.
The metrological atomic force microscope (MAFM) head has been integrated into the nanomeasuring machine (NMM-1) as a probe system. Therefore, a large area measurement within a range of mm and a resolution of less than 0.1 nm is feasible. This paper presents the design and the implementation of the MAFM, as well as measurements of step height and pitch and areal measurement.
The compact, small measuring head with total dimensions of about mm (including the reference arm) allows the simultaneous detection of position, bending and torsion of a reflecting surface with one focused laser beam (Balzer et al., 2011; Hausotte et al., 2012). The two wedge plates, where one serves as a beam splitter and the other one is needed for compensation, were integrated to minimize disturbing interferences on the PSD. Simulations of the functionality of our system were carried out using the optical design programme OpticStudio from Zemax. The peak-to-valley value of the coherent irradiance on the PSD of the previous system is about 0.05 W cm−2. The simulation result of the new system shows that the integration of two wedge plates with a wedge angle of 0.5∘ can reduce the disturbing interferences significantly (Fig. 2). The measurement results presented in Sect. 3 confirm the functionality.
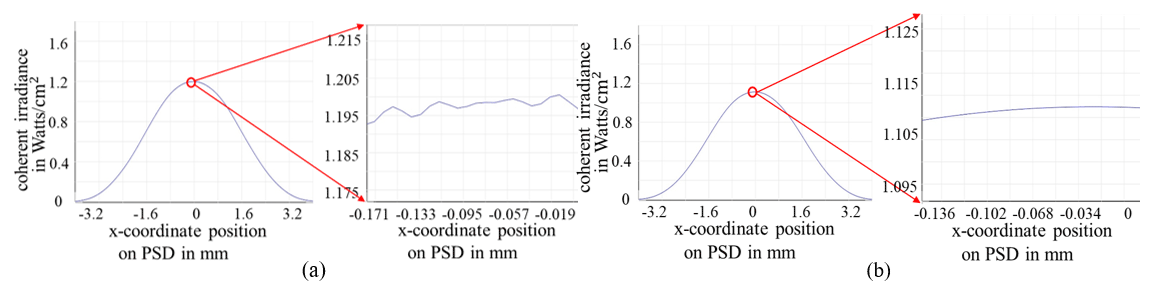
Figure 2Lateral distribution of the coherent irradiance on the PSD (one cross section) of the previous system (a) and the new system (b).
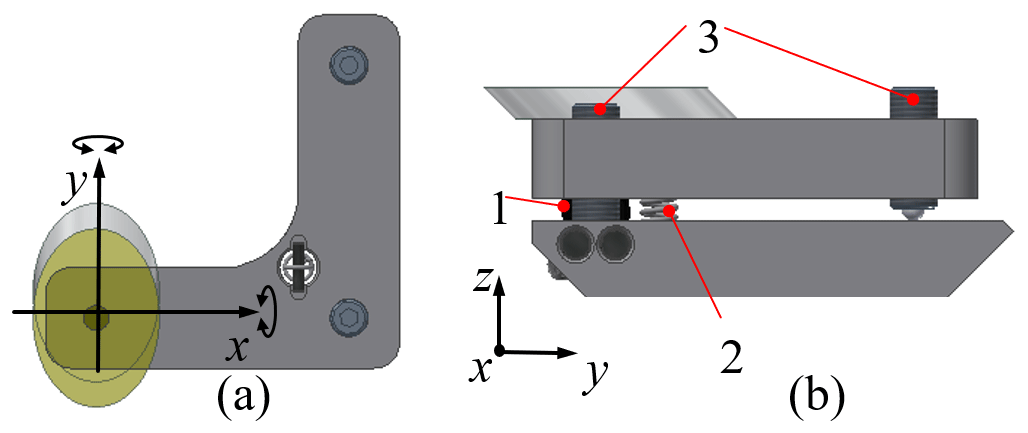
Figure 3Mirror adjustment unit in top view (a) and side view (b). Note: 1 – support ball; 2 – spring; 3 – fine adjustment screws.
In the measuring arm, the focus lens and the two tiltable plane mirrors are used to adjust the direction of the focused laser beam and the position of the focus on the backside of the cantilever. By turning only one or two fine adjustment screws at the same time, the mirror can be rotated around the x and y axis, respectively (Fig. 3). While one tiltable plane mirror is fixed, the other one can realize an adjustable angle of ±3∘. Accordingly, the adjustable lateral displacement is approximately 250–290 µm. In addition, the position of the focus lens and, thus, the axial displacement of the focus can be altered by rotating the lens holder in and out within the lens adjustment plate (Fig. 4).
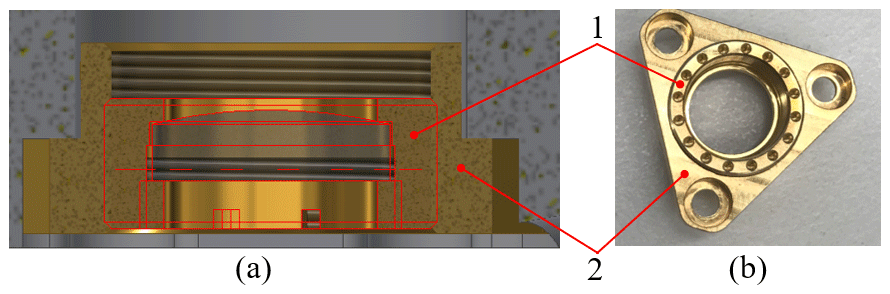
Figure 4Cross section (a) and bottom view (b) of the focus lens unit. Note: 1 – lens holder; 2 – lens adjustment plate.
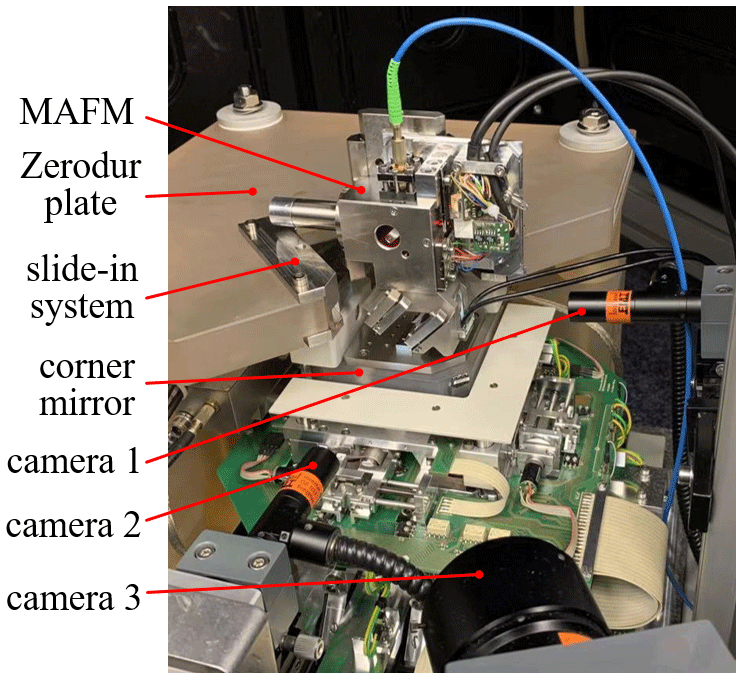
This MAFM head has been integrated into the NMM-1 (Fig. 5) as a probe system. The NMM-1 provides a slide-in system as a mechanical interface for different probe systems. Additional analogue inputs enable their electrical integration as well. The lateral scanning motion (with the fast scan direction along the y axis of the NMM-1) and the vertical motion (e.g. for the constant force, amplitude or frequency mode) are performed by the NMM-1, which moves the corner mirror carrying the sample under test. The three interferometers of the NMM-1 measure the position of the corner mirror in real time so that the positioning control loop can assure a movement resolution of less than 0.1 nm (Hausotte et al., 2009).
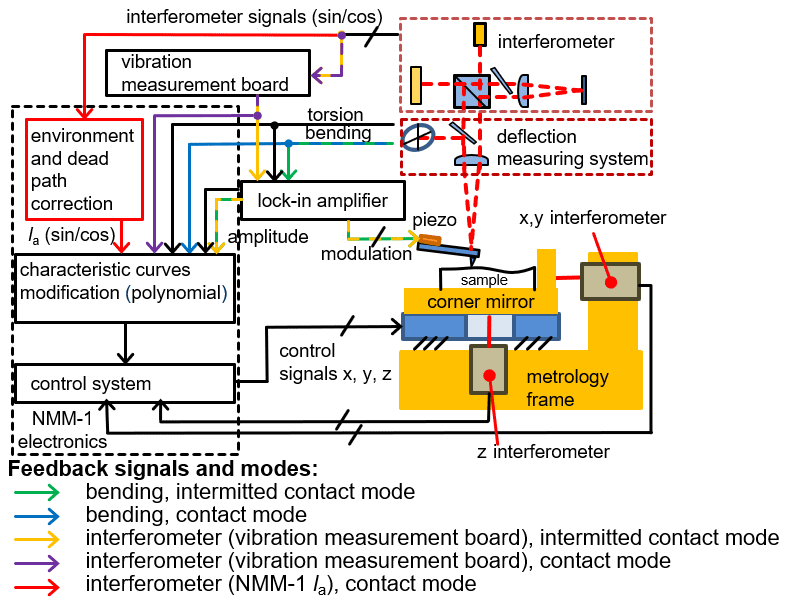
This new MAFM head is able to perform measurements in both contact mode (CM) and intermitted contact mode (IM). The tip position is measured traceably on the reflecting backside of the cantilever by an interferometer. Using the quadrature signals (sin/cos) of the interferometer, a vibration measurement board calculates a signal (violet and yellow arrows in Fig. 6) that is proportional to the analogue displacement of the cantilever in CM and to the amplitude of the cantilever in IM, respectively. In CM, the analogue signal is sampled by a 16 bit analogue-to-digital converter (ADC) of the digital signal processor (DSP) unit of the NMM-1. In IM the signal is processed by a lock-in amplifier (LIA; Zurich Instruments HF2LI). Alternatively, only in CM can the quadrature signals be applied to determine a displacement signal by the DSP unit of the NMM-1 and, thus, dead path and environmental influences can be corrected directly.
In CM the bending signal (blue arrow in Fig. 6) of the tilt measuring system is used to control the distance between the measured sample and the tip of the cantilever by a feedback loop. The NMM-1 also enables the recording of the quadrature signals (sin/cos; red arrow in Fig. 6) of the additional interferometer so that an offline ellipse correction and an incremental position measurement can be carried out. The position, the bending and the torsion (red, blue and black arrows in Fig. 6) in combination with the spring constant and the dimensions of the cantilever allow, in the CM mode, the determination of the components of the orthogonal force vector on the tip of the cantilever (Hausotte, 2011).
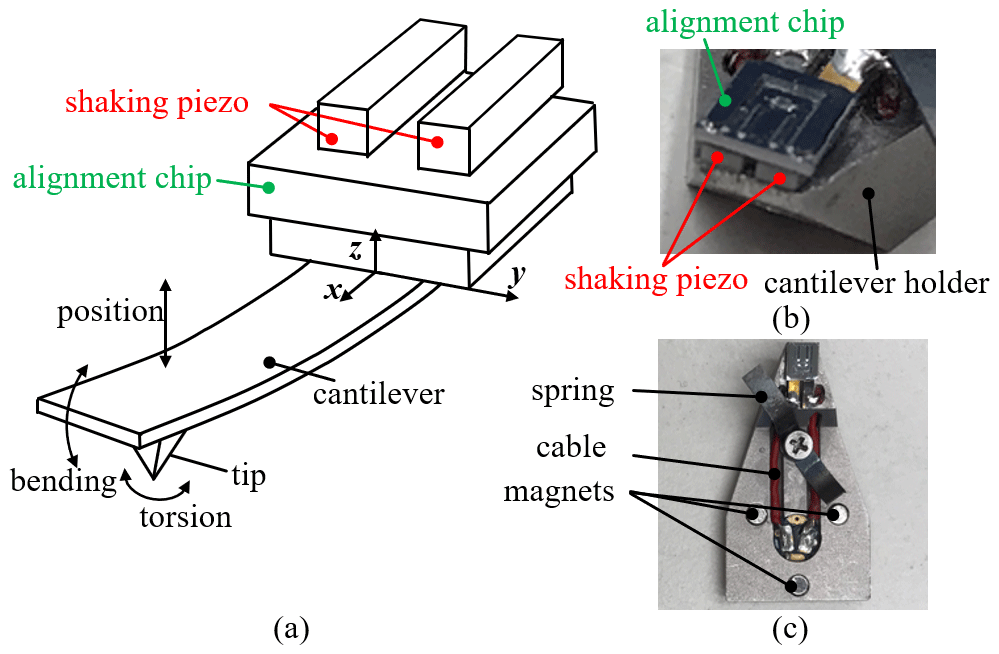
Figure 7Schematic functional principle of the AFM probe (a), the realized AFM probe (b) and the whole cantilever plug (c).
This newly developed MAFM head can work in vertical and torsional resonance modes. The cantilever chip is held back in the alignment chip by a spring. There are two shaking piezo actuators integrated between the alignment chip and the cantilever holder to oscillate the cantilever (Fig. 7). In vertical oscillation mode (IM; green–yellow arrows in Fig. 6), a pair of driving signals with the same phase at a frequency near the vertical resonance frequency are applied to the piezo actuators. In torsional resonance mode, the cantilever is driven by a pair of signals with a phase shift of 180∘ at a frequency near the torsional resonance frequency. Different demodulation techniques, such as for amplitude modulation (AM) or for frequency modulation (FM), can be used to analyse the vertical and torsional measurement signals with the help of a lock-in amplifier. The output signal of the LIA is passed on to the NMM-1 and used to control the oscillation amplitude and/or frequency of the cantilever, thereby controlling the distance between the measured sample and the tip of the cantilever. A constant amplitude and/or frequency is realized by a vertical motion of the corner mirror, which carries the sample.
In order to carry out measurements correctly, the MAFM head was calibrated with the NMM-1. Therefore, an object with a flat surface was positioned on the corner mirror of the NMM-1 underneath the tip of the cantilever. The corner mirror was then moved up and down vertically over a certain range with constant speed. The analogue signals of the MAFM (except the quadrature signals) were connected to and recorded by the 16 bit ADCs of the DSP unit of the NMM-1. The working range and set point, which are used for the force control in constant-force mode, can be determined from the approach and/or retract curve (Fig. 8). The coefficients of these curves (working range) can be used by the DSP unit of the NMM-1 to calculate the distance between the tip of the cantilever and the measured object. In our system, the saturation value of the bending signal at around 400 nm (Fig. 8) is caused by the PSD board used to process the signal.
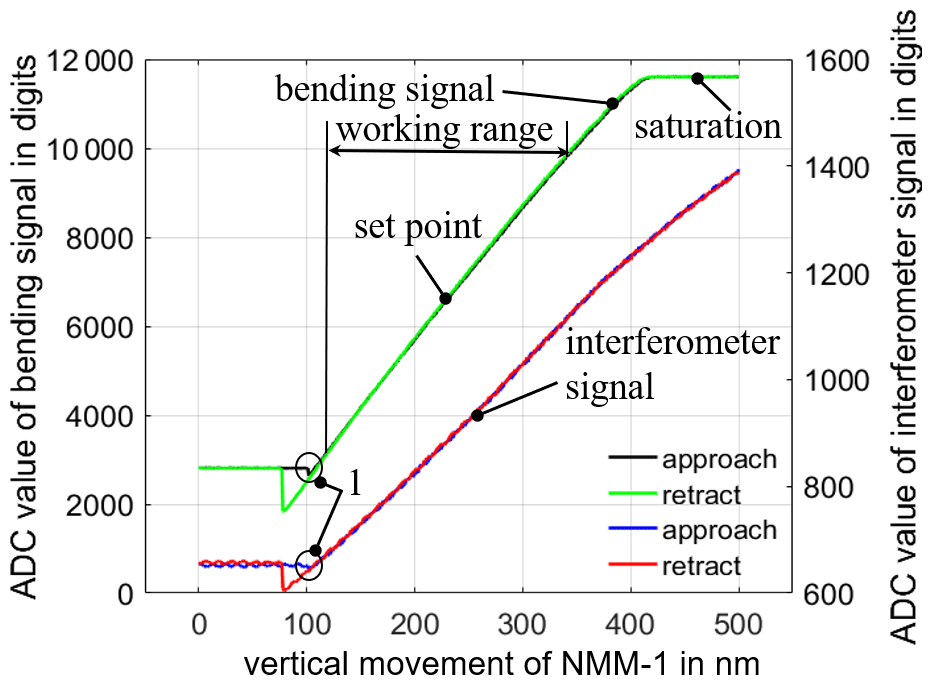
Figure 8Characteristic curves of the bending signal and the interferometer signal (see also blue and violet arrows/signals in Fig. 6). Note: 1 – contact point.
Different measurement tasks were carried out. In the following, exemplary measurements are illustrated, which were carried out in CM on the gratings TGZ1 and TGZ2, from the company NT-MDT (NT-MDT Co., 2019), with the cantilever PPP-CONTSCR, from the company NANOSENSORS (NanoWorld AG). The profile height (z direction) of the presented measurements in this paper is calculated as the difference between the calibrated AFM bending signal and the position data of the z axis of the NMM-1. All the expanded uncertainties of the measurement results given in this paper were calculated from the standard deviations of the respective measured mean values and the coverage factor k=2 (JCGM 100, 2008). The detailed uncertainty analysis of this MAFM of an exemplary measurement can be found in our previous publication (Wu et al., 2021).
3.1 Determination of step height
Step height standards are widely used to calibrate the vertical axis of AFMs. Figure 9 shows the measurement results of TGZ1 with a nominal step height of (21.4±1.5) nm.
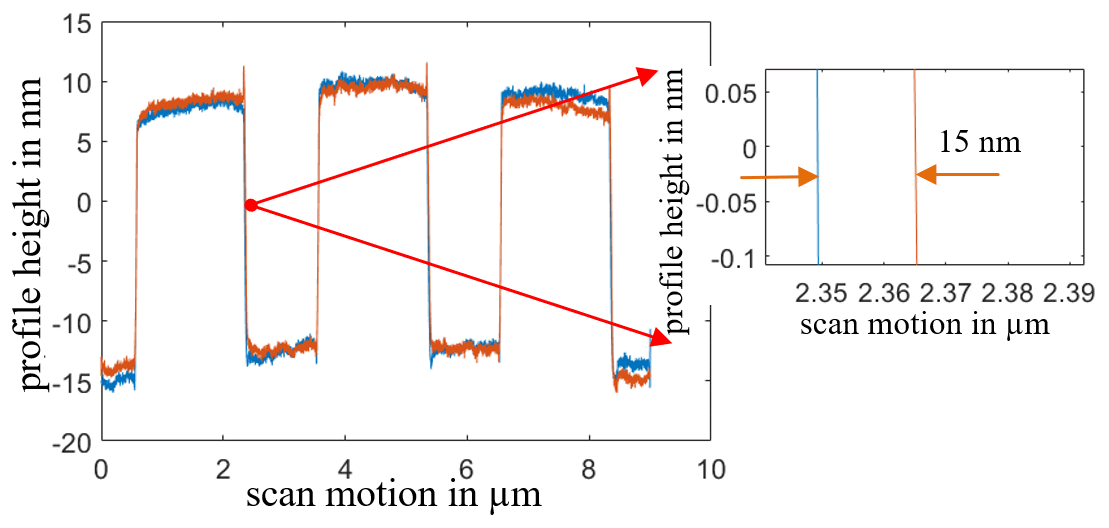
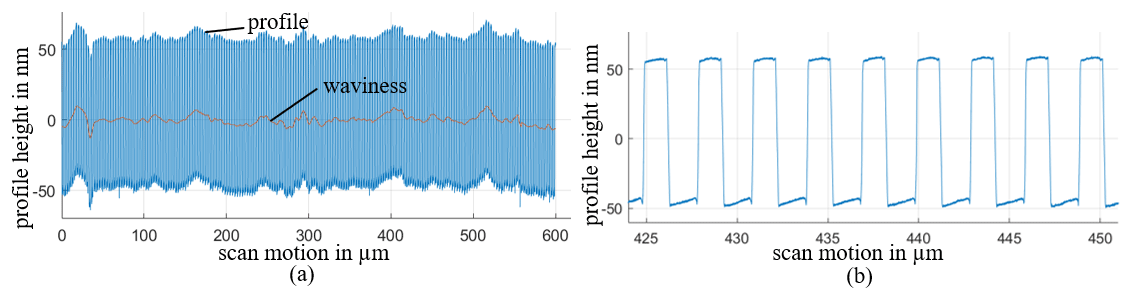
Figure 10Original measured grating profile (one scanned line) (a) and a section of the filtered profile (b).
With a scan speed of 1.5 µm s−1 and a point distance of 1 nm, the lateral mean mismatch between the forward and backward scan is about 15 nm. This is caused by the different latency times of the bending signal and the signals of the interferometers of the NMM-1. The step height was calculated according to DIN EN ISO 5436-1 of type A1 (DIN EN ISO 5436-1, 2000). The measured step height is 20.7 nm, with an expanded uncertainty of 3.6 nm (k=2). This result agrees with the nominal value given by the company NT-MDT.

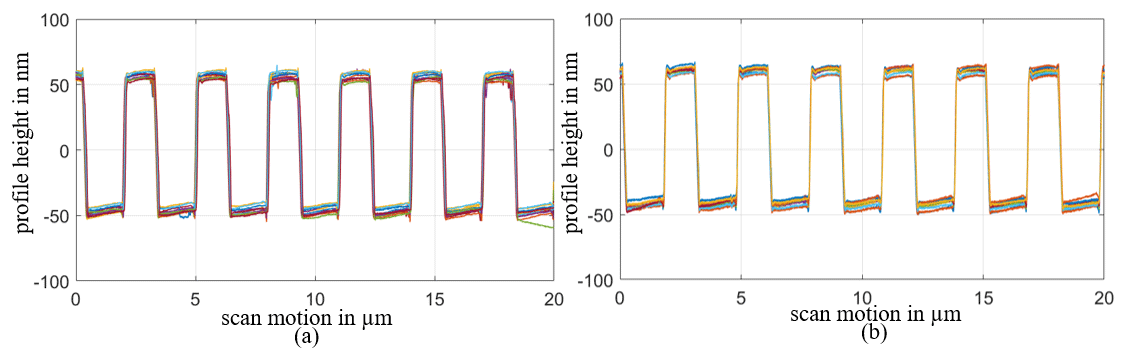
Figure 12Section of the scanned 14 lines (a) and repeatedly (10 times) scanned profile of one line (b).
3.2 Pitch determination
Lateral standards are used to calibrate AFMs and to characterize the image distortions of microscopes in lateral directions. In order to reduce the cosine error (Hausotte, 2011; Dai et al., 2005), the measurements are conducted perpendicular to the gratings of TGZ2 with a nominal step height of (108±2) nm and a nominal period or pitch of (3±0.01) µm. The long scan range, or, rather, measurement, over a large number of grating lines is important to obtain better statistical results of the mean pitch. A scan length of 600 µm was measured forwards and backwards. Such a long measuring distance is not achievable with commercially available AFMs. The measurement was repeated 10 times. The original measured profile (Fig. 10a) is coupled with waviness, which could be caused by the sample. A simple low-pass filter (Dai et al., 2005) has, therefore, been applied to detect and remove the waviness in order to avoid its influence on the evaluation accuracy. A section of the profile of the filtered signal is shown in Fig. 10b. The mean pitch was calculated using the Fourier transform method according to Dai et al. (2005). The determined mean pitch is 3.007254 µm, with an expanded uncertainty of 122 pm (k=2).
3.3 Measurement of an area
The scan range of commercial AFMs is usually limited to less than 200 µm. Due to the integration of the MAFM head in the NMM-1, a scan area in macroscopic range up to 25 mm×25 mm can be achieved. A 1 mm×70 µm area of TGZ2 was measured with 14 lines and 10 000 points per line. A section from the measured area is shown in Fig. 11.
The mean pitch and step height of the 14 scanned lines are 3.003273 µm, with an expanded uncertainty of 228 pm (k=2), and 102.95 nm, with an expanded uncertainty of 1.1 nm (k=2), respectively. These measurement results are not only influenced by the MAFM system itself but also by the local deviations of the standard. In contrast, the measured mean pitch and step height of the 10 repeatedly scanned profile of one different line, which was measured at a different position, are 3.000011 µm, with an expanded uncertainty of 34 pm (k=2), and 103.9 nm, with an expanded uncertainty 0.5 nm (k=2), respectively. A section of the scanned 14 lines is shown in Fig. 12a and b, respectively.
This paper presented a metrological atomic force microscope developed at the Institute of Manufacturing Metrology (FMT) of the Friedrich–Alexander University Erlangen–Nuremberg (FAU). The design of this new system and the realized MAFM head were shown. The investigation of the MAFM head in the NMM-1 for different high-precision and large-scale traceable measurement tasks was carried out. As examples, step height and pitch determination and measurement of an area were illustrated. Because of the integration into the NMM-1, this MAFM head can benefit from the large measuring range, high-precision and traceability of the NMM-1 for efficient measurements on different samples. The presented results show the realized macroscale measurements with sub-nanometre resolution.
The data will be made available upon request to the corresponding author.
YW contributed to the data curation, formal analysis, investigation, methodology, supervision, validation, visualization, writing of the original draft and editing and reviewing the paper. EW contributed to the validation and editing and reviewing the paper. UK contributed to the formal analysis and editing and reviewing the paper. TH contributed to the project administration and editing and reviewing the paper and was responsible for the conceptualization, methodology, construction process, funding acquisition and the idea for the new optical setup.
The authors declare that they have no conflict of interest.
Publisher's note: Copernicus Publications remains neutral with regard to jurisdictional claims in published maps and institutional affiliations.
This article is part of the special issue “Sensors and Measurement Science International SMSI 2020”. It is a result of the Sensor and Measurement Science International, Nuremberg, Germany, 22–25 June 2020.
The authors thank all those colleagues at the FAU for their contributions to these presented developments. The authors also thank the European Metrology Programme for Innovation and Research (EMPIR) for funding the project “Traceable three-dimensional nanometrology (3DNano)”. Last but not least, the authors want to thank Gaoliang Dai and Jens Flügge from Physikalisch-Technische Bundesanstalt (PTB) for their cooperation.
This paper was edited by Rainer Tutsch and reviewed by two anonymous referees.
Balzer, G. F., Hausotte, T., Dorozhovets, N., Manske, M., and Jäger, G.: Tactile 3D microprobe system with exchangeable styli, Meas. Sci. Technol., 22, 094018, https://doi.org/10.1088/0957-0233/22/9/094018, 2011.
Binning, G., Quate, C. F., and Gerber, C.: Atomic Force Microscope, Phys. Rev. Lett., 56, 930–933, https://doi.org/10.1103/PhysRevLett.56.930, 1986.
Dai, G., Koenders, L., Pohlenz, F., Dziomba, T., and Danzebrink, H. U.: Accurate and traceable calibration of one-dimensional gratings, Meas. Sci. Technol., 16, 1241–1249, https://doi.org/10.1088/0957-0233/16/6/001, 2005.
DIN: EN ISO 5436-1:2000-11, Geometrische Produktspezifikation (GPS) – Oberflächenbeschaffenheit: Tastschnittverfahren; Normale-Teil 1: Maßverkörperungen, ISO 5436-1:2000, Berlin, 2000.
Dorozhovets, N., Hausotte, T., Hofmann, N., Manske, E., and Jäger, G.: Development of the interferometrical scanning probe microscope, Proc. SPIE, Interferometry XIII: Applications, 6293, 629311, https://doi.org/10.1117/12.680692, 2006.
Hausotte, T.: Nanopositionier- und Nanomessmaschinen – Geräte für hochpräzise makro- bis nanoskalige Oberflächen- und Koordinatenmessungen, Ilmenau: Techn. Univ. Habilitationsschrift, Pro Business, available at: https://www.fmt.tf.fau.de/forschung/publikationen/habilitationsschriften/#collapse_0 (last access: 6 June 2021), 2011.
Hausotte, T., Balzer, F.-G., Vorbringer-Dorozhovets, N., and Manske, E.: Surface and coordinate measurements with nanomeasuring machines, International Journal of Nanomanufacturing, 8, 467–483, https://doi.org/10.1504/IJNM.2012.051110, 2012.
Hausotte, T., Percle, B., and Jäger, G.: Advanced three-dimensional scan methods in the nanopositioning and nanomeasuring machine, Meas. Sci. Technol., 20, 084004, https://doi.org/10.1088/0957-0233/20/8/084004, 2009.
JCGM 100: 2008 Evaluation of measurement data – Guide to the expression of uncertainty in measurement, available at: https://www.bipm.org/en/publications/guides, last access: 16 June 2021.
NT-MDT Co.: TGS1, available at: https://www.ntmdt-tips.com/products/view/tgs1 (last access: 25 March 2019), 2019.
Wu, Y., Wirthmann, E., Klöpzig, U., and Hausotte, T.: A metrological atomic force microscope system, Nano Express, 2, 010035, https://doi.org/10.1088/2632-959X/abed5e, 2021.
Yacoot, A. and Koenders, L.: Recent developments in dimensional nanometrology using AFMS, Meas. Sci. Technol., 22, 122001, https://doi.org/10.1088/0957-0233/22/12/122001, 2011.