the Creative Commons Attribution 4.0 License.
the Creative Commons Attribution 4.0 License.
 | 10 Dec 2021
Monitor and control test room for investigating thermal performance of panels incorporating phase-change material
Marwa Othmen
Radwen Bahri
Slaheddine Najar
Ahmed Hannachi
This article aims to present equipment designed and developed to study the effective thermal conductivity of composite panels. The composite panel used is a rigid polyurethane foam covered with a layer of aluminum on both sides. The panel is mounted in the test chamber equipped with several sensors and actuators connected via an Arduino platform. Tests have been carried out by applying heat to impose various interior temperatures. Sensors at different locations are used to monitor and record temperatures in and around the composite panel during heating and natural cooling. A model, based on the Fourier equations of thermal conduction and natural convection heat transfer for the steady state, was developed to assess the effective thermal conductivity. The performance of the system was confirmed using temperature signals through the panels for thermal characterization of composite materials. The determined effective thermal conductivity obtained was in agreement with the experimental values reported in the technical data sheets with relative deviations of less than 10 %.
- Article
(425 KB) - Full-text XML
- BibTeX
- EndNote


Nowadays, buildings consume approximately 40 % of the world's primary energy and are responsible for more than 30 % of greenhouse gas emissions (EC, 2019). Consumption will reach more than 50 % in the next decade due to the growth of the population and the progress of the human standard of living with the development of technology and urbanization (Pothitou et al., 2016). Hence, reducing the building's energy consumption and reducing CO2 emissions are essential for sustainability (Hirvonen et al., 2019).
In buildings, heating, ventilation, and air-conditioning (HVAC) equipment accounts for 50 %–60 % of total energy consumption (Nasruddin et al., 2019). There are two ways to improve energy efficiency (de Gracia and Cabeza, 2015). The first one is to optimize HVAC systems (Pérez-Lombard et al., 2011). This could be achieved by monitoring humidity and temperature conditions to improve thermal comfort (Földváry Ličina et al., 2018; Hazyuk et al., 2012). The quality of indoor air is systemically improved among other environmental parameters (Geng et al., 2019). Several studies focused on the development of low-cost monitoring platforms. For example, Shah and Mishra (2016) proposed a platform to monitor temperature, relative humidity, and light in buildings. Harfield and Rattanongphisat (2017) developed a monitoring platform controlling temperature, humidity, power, and occupancy information. Scarpa et al. (2017) constructed a platform to monitor the indoor environment and the building's energy consumption. Ramakrishnan et al. (2017) developed a thermal chamber to apply a temperature profile between 15–35 ∘C to simulate a typical summer day.
A different approach is to improve the thermal performance of walls in buildings. Insulation materials are used in buildings to drop heat losses, allowing for reducing heating/cooling duties (Papageorgiou et al., 2020) with improved indoor thermal comfort (Meng et al., 2018). Rigid polyurethane foam (RPU) has been widely used in the field of thermal insulation of buildings due to its low thermal conductivity, low density, and superior mechanical properties (Yang et al., 2015). The incorporation of phase-change materials (PCMs) allowed for a better reduction in heating and cooling loads (Serrano et al., 2016). The used composite materials need to be well characterized for optimization purposes. There are many analytical techniques available that can be used for these goals such as Fourier transform infrared spectroscopy (FTIR), differential scanning calorimeter (DSC), and scanning electron microscopy (SEM) (Uddin et al., 2002). However, these techniques only allow for microscale characterization. This is often performed with sophisticated systems integrating data acquisition and hardware and software processing. These systems are costly and lack flexibility and data integration (Jang et al., 2008).
Currently, monitoring platforms are seeking to minimize costs involving data collection for insulation materials (Singh et al., 2021; Yan et al., 2010). Borreguero et al. (2011) realized a homemade experimental setup to apply heat flux to gypsum wallboards in order to determine their thermal behavior. An innovative experimental apparatus was developed by Eddhahak-Ouni et al. (2013) to evaluate the thermal performance of wall panels by simulating different temperature profiles. In addition, new equipment has been studied by de Gracia et al. (2011) to verify the thermal response and heat capacity of different types of wall panels by monitoring heat flow and temperature distributions.
Therefore, the objective of this work is to evaluate an experimental setup for the characterization of the thermal properties of composite panels. The experimental setup consists of a test chamber equipped with a temperature regulation, measurement, and recording system. Several tests were carried out by imposing a set temperature or a temperature profile. Temperature sensors located at different points of the chamber and at the desired panel are used during the heating–cooling and cooling–heating cycles. A model has been developed, based on the equations of heat transfer by conduction and convection in the steady state, that allow the data to be used to determine the effective thermal properties.
2.1 Experimental setup
In this work, the experimental device was designed and developed at the “Process Engineering and Industrial Systems” laboratory of the “National School of Engineers of Gabes”. The purpose of this equipment is to obtain experimental data to design the thermal performance of composite panels, containing between 0 % and 50 % by weight of phase-change material, at the macroscopic scale. The homemade experimental setup consists of a cubic room, electronic components, production power, and a PC. The walls of the cubic chamber are made of rigid polyurethane foam covered with a layer of aluminum on both sides. The thermal conductivity of the sandwich wall used is 0.02 W/(m K). The dimensions of the interior space of the test room are cm. A lateral side of the presented test room is used to heat the composite panels under study. The panels are synthesized by incorporating the paraffin during the mixing of polyol and isocyanate, forming the rigid polyurethane foam. The test chamber is equipped with a 20 W halogen lamp supported by a monitoring system. Four digital sensors with maximum errors of 0.2 ∘C are installed at different points of the setup as shown in Fig. 1. And the last analog sensor is placed outside to measure the ambient temperature and relative humidity. All thermal sensors and actuators used in this setup are placed relative to the side panel. The sensors are supplied with programs to record temperature and relative humidity values during the test. The heating period and the imposed temperature in the test chamber are monitored by the operator. Sensors at different locations are used to monitor and record temperatures in and around the composite panel during heating and natural cooling. Using these signals, it is possible to quantify the stored energy amount, phase shift time, and thermal inertia.
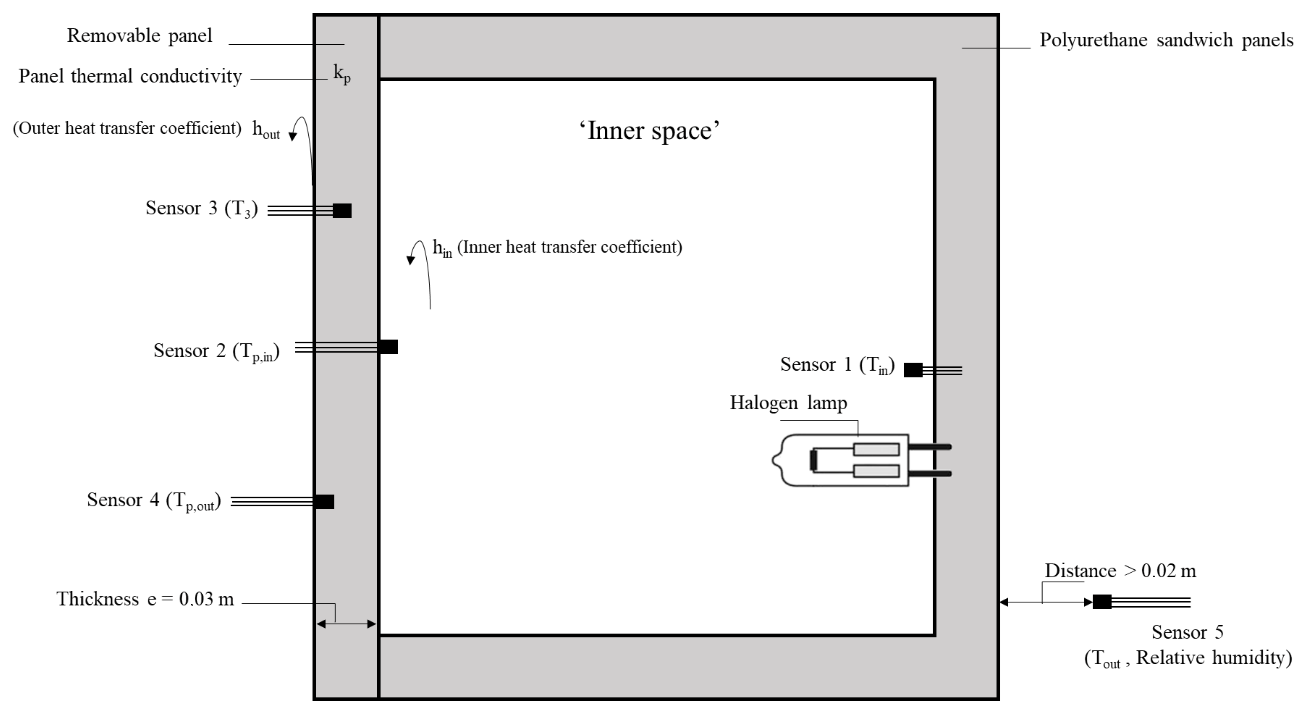
Figure 1Cross section of the experimental setup for studying the thermal behavior of panels.
2.2 Description of monitoring and control system
2.2.1 System requirements and architecture
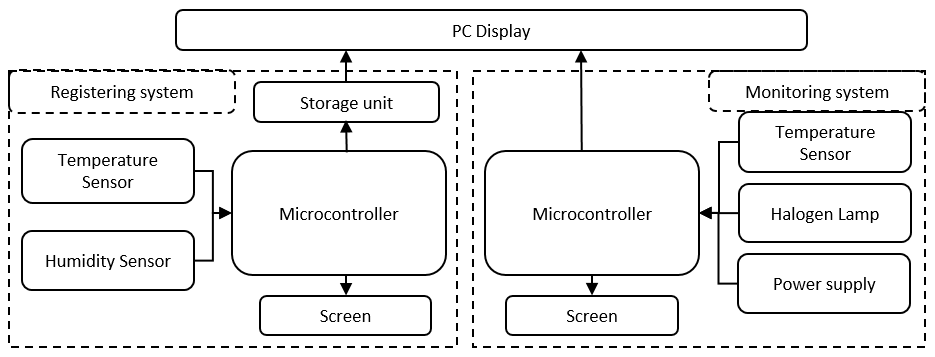
The proposed monitoring and control system is based on the Arduino platform. The selected materials are determined by the system requirements. Two developed systems are mounted in the experimental setup as shown in Fig. 2. The first operating system for the heating cycle consists of the following main parts:
-
a micro controller unit (Arduino mega),
-
an energy supply unit (voltage regulator),
-
a halogen lamp,
-
a temperature sensor (LM35),
-
a screen (LCD screen).
The second platform for recording temperature and relative humidity data consists of several sensors. A microcontroller Arduino Mega containing analog/digital inputs/outputs was selected to acquire temperature and relative humidity data from different points of the test room. Compared to the test room behavior, sensors and parameter recording system inertia is meaningless, allowing for performing measurements every 3 s for temperature and humidity. Data are saved in a MicroSD card. An LCD screen panel was linked to view the required data in real time.
2.2.2 Hardware selection
Table 1 shows the measured parameters of the test room, the model and number of components, the measuring range, the accuracy, and the type of output. The programming language used is C with assembly language integrated into the programming of the Arduino board (Teikari et al., 2012).

2.2.3 Data acquisition of monitoring system
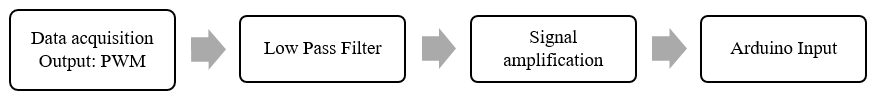
The goal of the monitor system is to vary the power supply with Python code to control the set temperature (Zhong et al., 2021). To connect the microcontroller to the practice model, signals must be conditioned. The hardware interface between microcontroller and the components must take into account the characteristics of the input and output levels of the microcontroller and the practice model. The input to the monitoring system, the reference signal, consists of a DC voltage signal in the 0–20 V range. However, at the output of the Arduino hardware, a pulse width modulation (PWM) signal is in the range of 0–5 V. To adapt the electronic signal, an experimental model was designed, containing a filter and an amplifier to adapt the voltage range, as shown in Fig. 3.
The DS18B20 temperature sensor is a three-pin electronic component that uses a one-wire protocol to communicate with the master device (the Arduino microcontroller). Each DS18B20 sensor has a unique 64 bit serial code, which allows multiple sensors to operate on the same one-wire bus and to be controlled with a master device.
2.3 Heat transfer modeling
Since all components are connected, controlled, and monitored with the software program, various tests can be performed in order to provide the thermal behavior of the removable side panel. This is performed by heating the test room and allowing it to cool naturally. The room is heated until reaching a steady state.
2.3.1 Test-room-imposed temperature variations
Tests were performed by applying a heating process from ambient temperature for 2 h until a steady state is reached. Then, the cooling process takes place by natural convection. The temperature at different points is recorded as a function of time as indicated in Fig. 1.
2.3.2 Determination of the effective thermal conductivity
Using temperature signals, it is possible to quantify the steady-state effective thermal conductivity of the sample (k) from Fourier law for the heating and cooling periods (Xu et al., 2019):
where ϕ is the steady-state heat flux density (W/m2). Tp,in and Tp,out are the inside and the outside surface temperatures of the insulation panel (∘C), respectively. e is the thickness of the panel (meters). kp is the thermal conductivity of the insulation panel (W/(m ∘C)). Newton's convection law allows for calculating the local heat flux density for steady state as follows (Quintela and Viegas, 1995):
where hin and hout are the inner and the outer, respectively, heat convective transfer coefficients (W/(m2 ∘C)). Tin and Tout are the air temperature (∘C) in the inner space and the external space, respectively (Fig. 1).
Therefore, two effective conductivities can be obtained from inner and outer heat transfer coefficients. At steady state, these conductivities should be equal:
The heat transfer coefficients can be obtained by the Nusselt number (Nu):
where L is the characteristic length confounded by the height of the panel (meters). k is the air thermal conductivity (W/(m ∘C)) obtained by fitting the data reported in the Applied Fluid Dynamics Handbook for temperatures ranging between 0 and 200 ∘C (Blevins, 1984):
where T is the air temperature (∘C).
The Nusselt number (Nu) is expressed as a function of Rayleigh number (Ra) and Prandtl number (Pr) for free convection as follows (Incropera et al., 2007):
where the Rayleigh number (Ra) is defined as the product of the Grashof number (Gr) and Prandtl number (Pr). The Grashof number Gr is given by Incropera et al. (2007) as follows:
where g is the acceleration due to the gravity (m/s2), β is the volumetric expansion coefficient (K−1), ΔT is the temperature difference between the surrounding surface of the sample and the inner air temperature (∘C). The air density ρ (kg/m3) and the air dynamic viscosity μ (kg/(m s)) are also derived by data fitting for the same reference as for Eq. (4) (Blevins, 1984):
The Prandtl number Pr for air is given by Li and Garimella (2001):
where Cp is the heat capacity of air (J/(kg ∘C)) derived by data fitting for the same reference as for Eq. (4) (Blevins, 1984):
The measurement period extends for 4 h, comprising a heating and natural cooling phases of equal times.
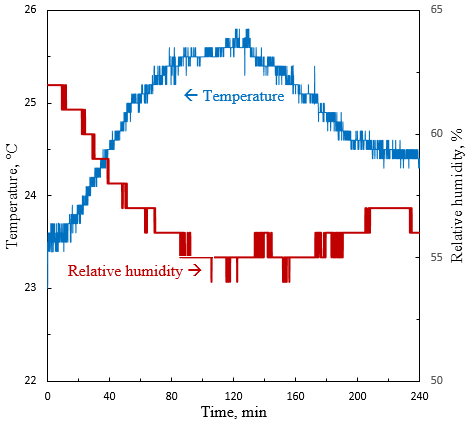
3.1 Ambient temperature and relative humidity evolution
A temperature and relative humidity sensor was put next to the test room to record ambient conditions. The readings were performed for 3 s during the process. It could be observed from Fig. 4 that the ambient temperature variation is slight with an average of 24.7 ± 2 ∘C. The relative humidity range decreases from 62 % to 54 %.
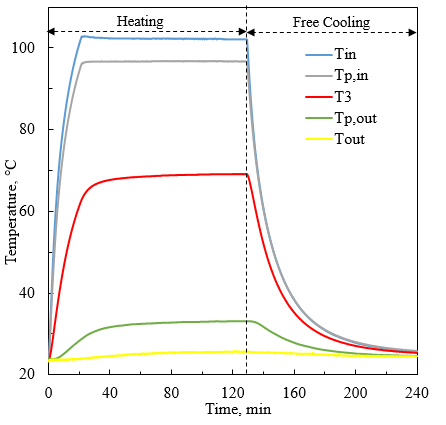
3.2 Thermal behavior in and around the insulating panel
Figure 5 presents temperature variation in different locations in the test room in addition to the inside and the outside surface of the investigated panel. As can be observed, during the heating, a steady state is reached after 45 min for all recorded temperatures, although the test room temperature reached a plateau after 30 min.
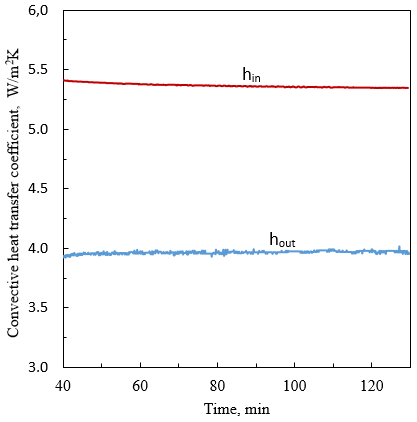
3.3 Determination of effective thermal conductivity of insulating panel
According to the theoretical development presented in Sect. 2.3.2, inner and outer heat transfer coefficients were calculated when steady state was prevailing. As shown in Fig. 6, the obtained values were 5.37 ± 0.05 and 3.96 ± 0.05 W/(m2 ∘C) for the inner and outer heat transfer coefficients, respectively.
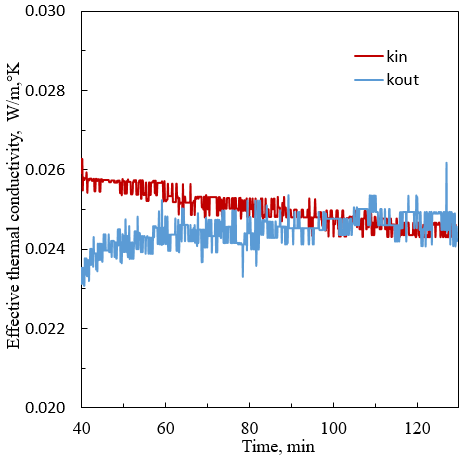

The effective thermal conductivity of the determined panel at steady state is shown in the Fig. 7. The panel thermal conductivity is 0.0247 ± 0.001 W/(m ∘C). This value is very close to the experimental value reported in the technical data sheet of RPU composite panel (0.0225 W/(m ∘C)) (Centre technique des matériaux de construction, de la céramique et du verre, 2014) with less than 10 % relative difference.
Table 2The quantity of energy exchanged determined according to the insertion rate of PCM.
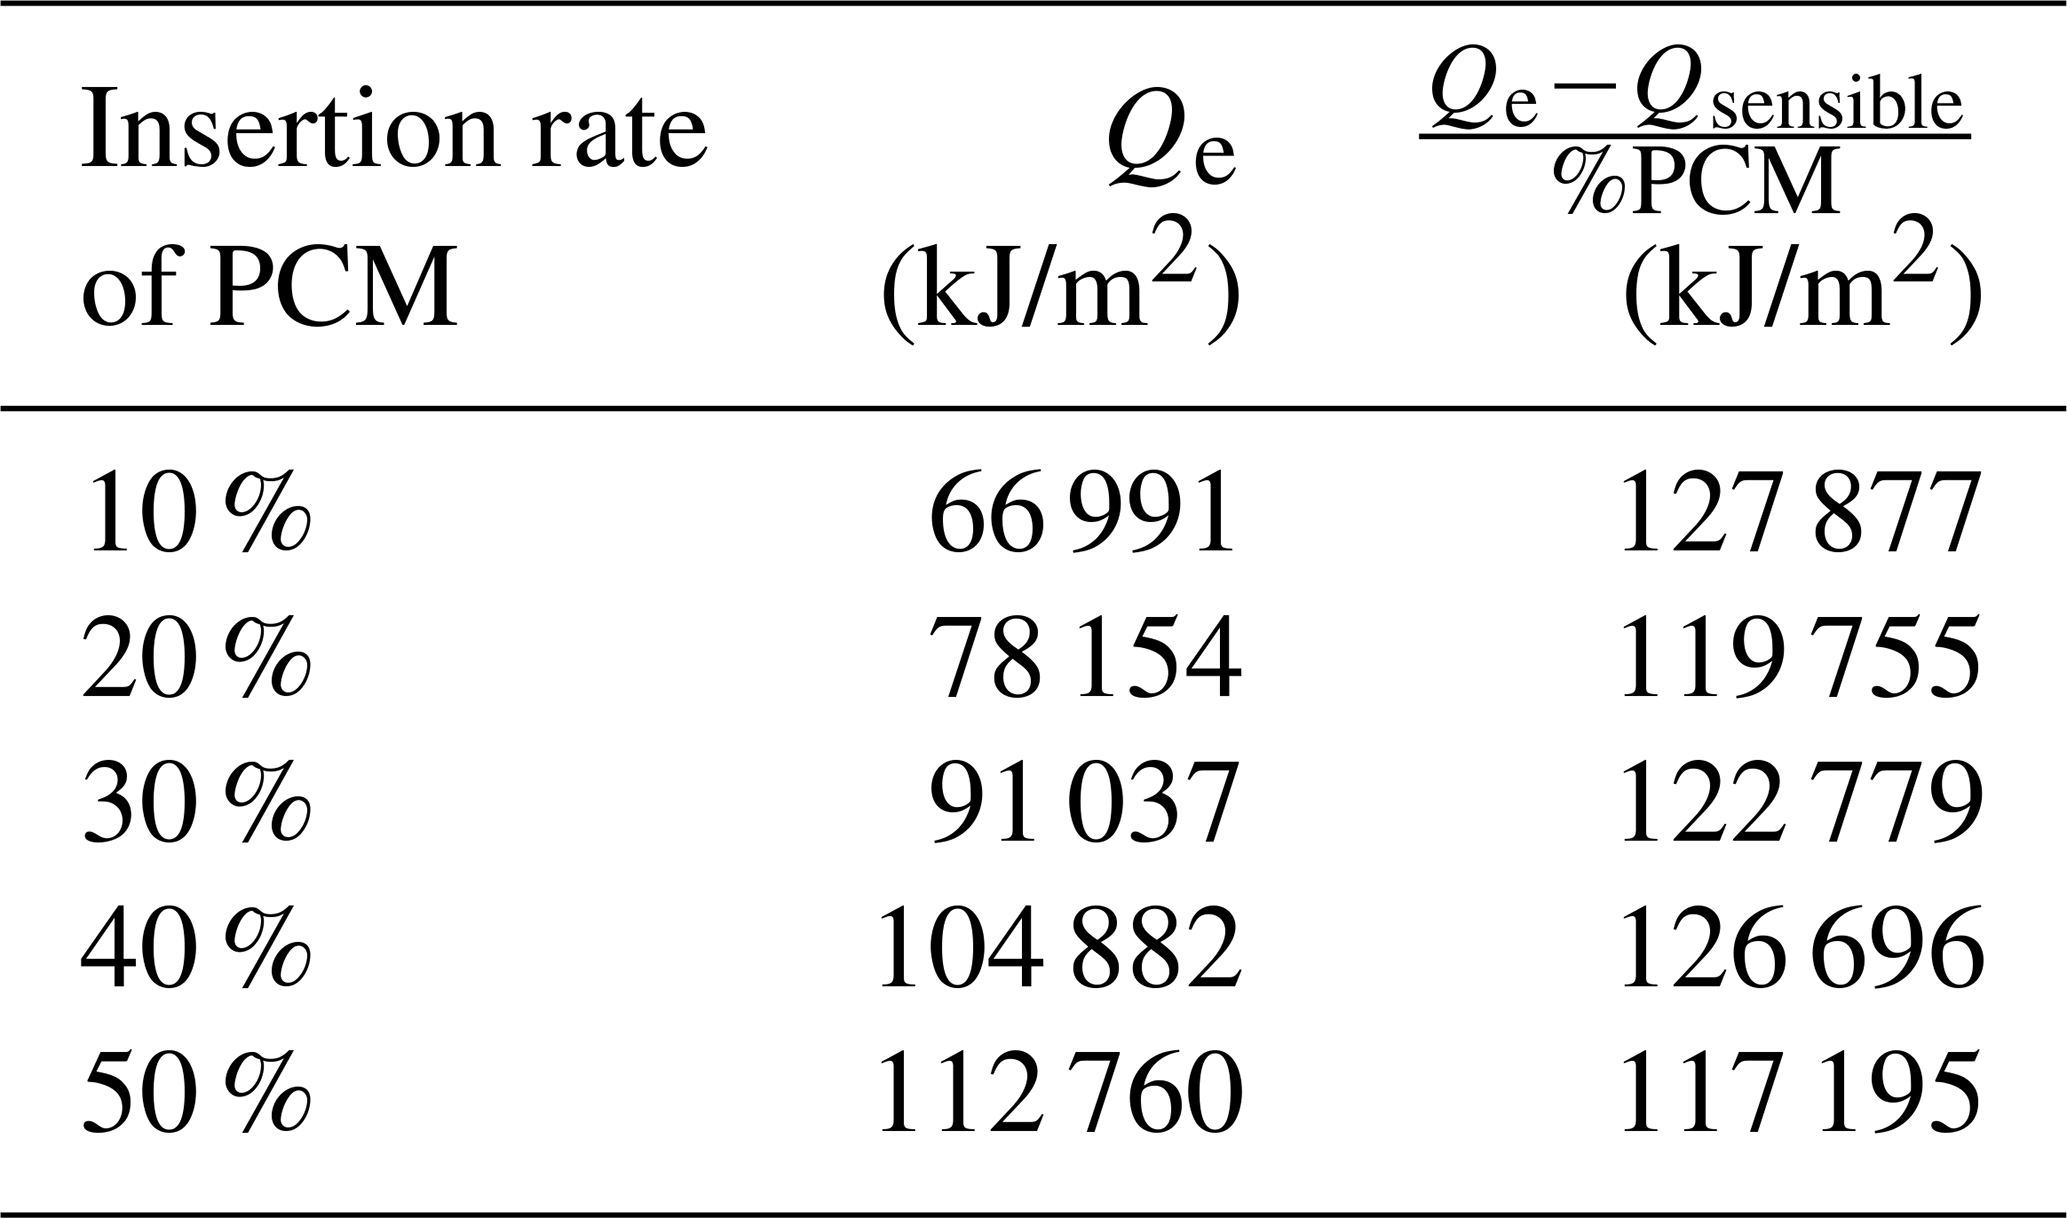
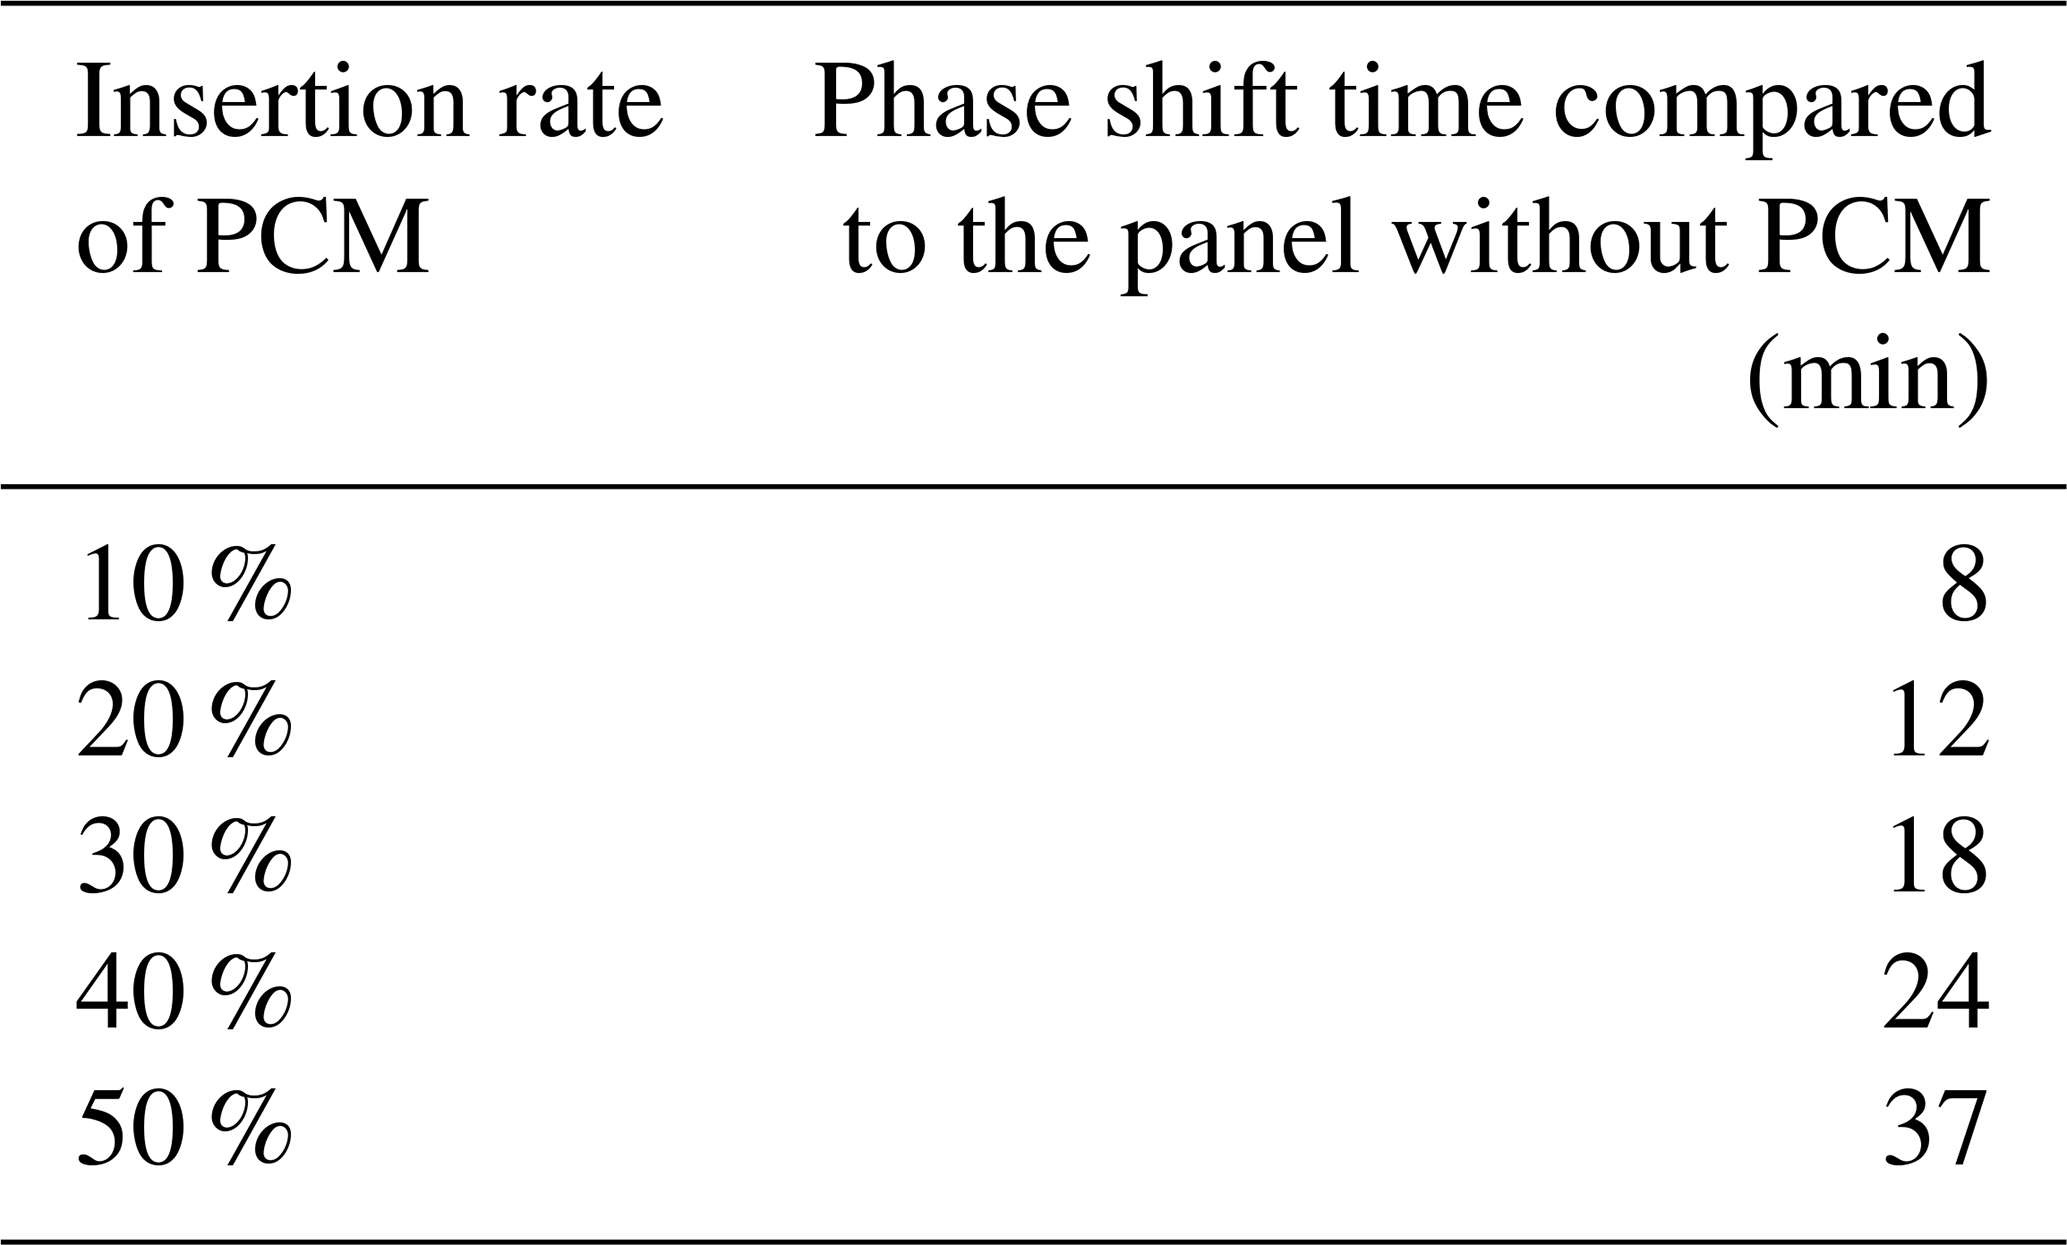
Table 3The evolution of the time shift as a function of the PCM rate for an average temperature deviation.
3.4 Determination of stored energy quantity and thermal inertia for panels incorporating different PCM
Figure 8 shows the evolution of the temperature difference (T-Tamb) during the heating–cooling cycle. During heating, a phase shift is clearly visible with the panels incorporating phase-change material (PCM). Thus, the thermal inertia by energy storage is highlighted. During cooling, an offset of about 0.5 h is reported for the panel of 50 % PCM compared to the panel without PCM for an average temperature deviation.
The quantity of thermal energy stored per unit area Qsensible is equal to the quantity of thermal energy exchanged per unit area Qe. This is equal to the integral of the product of the convective heat exchange coefficient and the temperature difference between the panel and the ambient temperature (Fig. 8). This amount of thermal energy is proportional to the rate of insertion of PCM with a relative deviation not exceeding 10 % (Table 2).
Table 3 presents the phase shift time during the cooling cycle of panels incorporating PCM in relation to a price insulating board as a reference. The phase shift time reaches 37 min for a temperature difference of 3 ∘C. PCM is characterized by high thermal inertia due to its storage of heat or cold in the form of latent heat.
An experimental setup was designed for this research to characterize the thermal behavior of composite materials. Several temperature and relative humidity sensors and actuators were used in the system, allowing us to monitor and record temperature values inside and around the composite panel containing between 0 % and 50 % by weight of phase-change material. Modeling steady-state heat transfer allowed for determining the effective thermal conductivity. A good agreement was obtained between the determined values of insulation panel and those reported by the technical data sheets. In addition, the developed test system is used for the characterization of various composite material panels. This amount of thermal energy is proportional to the rate of insertion of PCM with a relative deviation not exceeding 10 %. The phase shift time reaches 37 min during the cooling cycle of panels incorporating 50 % of PCM compared to panels without PCM.
The software code used in the registration system and recording system is a basic code presented in the online library of the Arduino software.
The data used in the registration system and recording system are in the online library of the Arduino software.
The article was written by MO and AH. RB and SN were co-investigators. This article is known to all writers, and they have accepted its publication. All authors have read and accepted the published version of the article.
The contact author has declared that neither they nor their co-authors have any competing interests.
Publisher’s note: Copernicus Publications remains neutral with regard to jurisdictional claims in published maps and institutional affiliations.
This project is carried out under the MOBIDOC (Mobilisation de chercheurs au profit du monde socio-économique) scheme, funded by the EU through the EMORI (Education, la MObilité, la Recherche et l’Innovation) program and managed by the ANPR (Agence Nationale de la Promotion de la Recherche Scientifique).
Marwa Othmen received Mobidoc funding for part of their PhD research between 2018 and 2020.
This paper was edited by Rosario Morello and reviewed by two anonymous referees.
Blevins, R. D.: Applied fluid dynamics handbook, N. Y. Van Nostrand Reinhold Co., 568 pp., 1984.
Borreguero, A. M., Luz Sánchez, M., Valverde, J. L., Carmona, M., and Rodríguez, J. F.: Thermal testing and numerical simulation of gypsum wallboards incorporated with different PCMs content, Appl. Energ., 88, 930–937, 2011.
Centre technique des matériaux de construction, de la céramique et du verre: SOFRIBAT30AP, Technical data Report SOFRIBAT30AP, Centre technique des matériaux de construction, de la céramique et du verre, Tunisia, 2014.
EC: Communication from the commission to the European Parliament, the European Council, the Council, the European Economic and SO – 55 cial committee and the committee of the region, available at: https://op.europa.eu/en/publication-detail/-/publication/b828d165-1c22-11ea-8c1f-01aa75ed71a1/language-en (last access: 27 July 2021), 2019
Eddhahak-Ouni, A., Colin, J., and Bruneau, D.: On an experimental innovative setup for the macro scale thermal analysis of materials: Application to the Phase Change Material (PCM) wallboards, Energy Build., 64, 231–238, 2013.
Földváry Ličina, V., Cheung, T., Zhang, H., de Dear, R., Parkinson, T., Arens, E., Chun, C., Schiavon, S., Luo, M., Brager, G., Li, P., Kaam, S., Adebamowo, M. A., Andamon, M. M., Babich, F., Bouden, C., Bukovianska, H., Candido, C., Cao, B., Carlucci, S., Cheong, D. K. W., Choi, J.-H., Cook, M., Cropper, P., Deuble, M., Heidari, S., Indraganti, M., Jin, Q., Kim, H., Kim, J., Konis, K., Singh, M. K., Kwok, A., Lamberts, R., Loveday, D., Langevin, J., Manu, S., Moosmann, C., Nicol, F., Ooka, R., Oseland, N. A., Pagliano, L., Petráš, D., Rawal, R., Romero, R., Rijal, H. B., Sekhar, C., Schweiker, M., Tartarini, F., Tanabe, S., Tham, K. W., Teli, D., Toftum, J., Toledo, L., Tsuzuki, K., De Vecchi, R., Wagner, A., Wang, Z., Wallbaum, H., Webb, L., Yang, L., Zhu, Y., Zhai, Y., Zhang, Y., and Zhou, X: Development of the ASHRAE Global Thermal Comfort Database II, Build. Environ., 142, 502–512, 2018.
Geng, Y., Ji, W., Wang, Z., Lin, B., and Zhu, Y.: A review of operating performance in green buildings: Energy use, indoor environmental quality and occupant satisfaction, Energy Build., 183, 500–514, 2019.
de Gracia, A. and Cabeza, L. F.: Phase change materials and thermal energy storage for buildings, Energy Build., 103, 414–419, 2015.
de Gracia, A., Barreneche, C., Farid, M. M., and Cabeza, L. F.: New equipment for testing steady and transient thermal performance of multilayered building envelopes with PCM, Energy Build., 43, 3704–3709, 2011.
Harfield, A. and Rattanongphisat, W.: Towards an open monitoring platform for improving energy efficiency and thermal comfort in public buildings, in: 2017 9th International Conference on Knowledge and Smart Technology (KST), Frankfurt, Germany, 16–18 March 2016, 150–155, 2017.
Hazyuk, I., Ghiaus, C., and Penhouet, D.: Optimal temperature control of intermittently heated buildings using Model Predictive Control: Part II – Control algorithm, Build. Environ., 51, 388–394, 2012.
Hirvonen, J., Jokisalo, J., Heljo, J., and Kosonen, R.: Towards the EU emissions targets of 2050: optimal energy renovation measures of Finnish apartment buildings, Int. J. Sustain. Energy, 38, 649–672, 2019.
Incropera, F. P., DeWitt, D. P., Bergman, T. L., and Lavine, A. S.: Fundamentals of heat and mass transfer, Book, Wiley, Hoboken, NJ, 2007.
Jang, W.-S., Healy, W. M., and Skibniewski, M. J.: Wireless sensor networks as part of a web-based building environmental monitoring system, Autom. Constr. 17, 729–736, 2008.
Li, C.-Y. and Garimella, S. V.: Prandtl-number effects and generalized correlations for confined and submerged jet impingement, Int. J. Heat Mass Tran., 44, 3471–3480, 2001.
Meng, X., Huang, Y., Cao, Y., Gao, Y., Hou, C., Zhang, L., and Shen, Q.: Optimization of the wall thermal insulation characteristics based on the intermittent heating operation, Case Stud. Constr. Mater., 9, e00188, https://doi.org/10.1016/j.cscm.2018.e00188, 2018.
Nasruddin, Sholahudin, Satrio, P., Mahlia, T. M. I., Giannetti, N., and Saito, K.: Optimization of HVAC system energy consumption in a building using artificial neural network and multi-objective genetic algorithm, Sustain. Energy Technol. Assess., 35, 48–57, 2019.
Papageorgiou, G., Efstathiades, A., Poullou, M., and Ness, A. N.: Managing household electricity consumption: a correlational, regression analysis, Int. J. Sustain. Energy, 39, 486–496, 2020.
Pérez-Lombard, L., Ortiz, J., Coronel, J. F., and Maestre, I. R.: A review of HVAC systems requirements in building energy regulations, Energy Build., 43, 255–268, 2011.
Pothitou, M., Kolios, A. J., Varga, L., and Gu, S.: A framework for targeting household energy savings through habitual behavioural change, Int. J. Sustain. Energy, 35, 686–700, 2016.
Quintela, D. A. and Viegas, D. X.: Convective Heat Losses from Buildings, in: Wind Climate in Cities, edited by: Cermak, J. E., Davenport, A. G., Plate, E. J., and Viegas, D. X., Springer Netherlands, Dordrecht, 503–522, 1995.
Ramakrishnan, S., Wang, X., Sanjayan, J., Petinakis, E., and Wilson, J.: Development of thermal energy storage cementitious composites (TESC) containing a novel paraffin/hydrophobic expanded perlite composite phase change material, Sol. Energy, 158, 626–635, 2017.
Scarpa, M., Ravagnin, R., Schibuola, L., and Tambani, C.: Development and testing of a platform aimed at pervasive monitoring of indoor environment and building energy, Energy Proced., 126, 282–288, 2017.
Serrano, A., Borreguero, A. M., Garrido, I., Rodríguez, J. F., and Carmona, M.: Reducing heat loss through the building envelope by using polyurethane foams containing thermoregulating microcapsules, Appl. Therm. Eng., 103, 226–232, 2016.
Shah, J. and Mishra, B.: Customized IoT Enabled Wireless Sensing and Monitoring Platform for Smart Buildings, Proc. Tech., 23, 256–263, 2016.
Singh, R., Amrr, S. M., and Jamil Asghar, M. S.: Supervisory control strategy for the effective solar energy utilization in a residential microgrid system using a cost-effective controller, Int. J. Elec. Power, 132, 107170, https://doi.org/10.1016/j.ijepes.2021.107170, 2021.
Teikari, P., Najjar, R. P., Malkki, H., Knoblauch, K., Dumortier, D., Gronfier, C., and Cooper, H. M.: An inexpensive Arduino-based LED stimulator system for vision research, J. Neurosci. Meth., 211, 227–236, 2012.
Uddin, M. S., Zhu, H. J., and Hawlader, M. N. A.: Effects of cyclic operation on the characteristics of a microencapsulated PCM storage material, Int. J. Sol. Energy, 22, 105–114, 2002.
Xu, H. J., Xing, Z. B., Wang, F. Q., and Cheng, Z. M.: Review on heat conduction, heat convection, thermal radiation and phase change heat transfer of nanofluids in porous media: Fundamentals and applications, Chem. Eng. Sci., 195, 462–483, 2019.
Yan, Q., Li, L., and Shen, D.: Thermal properties of shape-stabilized paraffin used for wallboard, Int. J. Sustain. Energy, 29, 87–95, 2010.
Yang, C., Fischer, L., Maranda, S., and Worlitschek, J.: Rigid polyurethane foams incorporated with phase change materials: A state-of-the-art review and future research pathways, Energy Build., 87, 25–36, 2015.
Zhong, C., Zhou, Y., and Yan, G.: Power reserve control with real-time iterative estimation for PV system participation in frequency regulation, Int. J. Electr. Power Energy Syst., 124, 106367, https://doi.org/10.1109/TSTE.2017.2674693, 2021.