the Creative Commons Attribution 4.0 License.
the Creative Commons Attribution 4.0 License.
 | 07 Apr 2022
Adjustment concept for compensating for stiffness and tilt sensitivity of a novel monolithic electromagnetic force compensation (EMFC) weighing cell
Maximilian Darnieder
René Theska
Thomas Fröhlich
This paper describes the new adjustment concept of novel planar, monolithic, high-precision electromagnetic force compensation weighing cells. The concept allows the stiffness and the tilt sensitivity of the compliant mechanisms that are dependent on the nominal load on the weighing pan to be adjusted to an optimum. The new mechanism is set up and adjusted according to the developed mechanical model. For evaluation of the concept the system is tested on a high-precision tilt table and under high vacuum conditions in the environment of a commercially available mass comparator.
- Article
(3935 KB) - Full-text XML
- BibTeX
- EndNote


In 2019 the système international d'unités (SI) was redefined by the use of fundamental physical and atomic constants (Stock et al., 2019). The definition of the kilogram by the international prototype kilogram (IPK) (Quinn, 1991) was replaced by the definition through the Plank constant h (BIPM, 2019). The revised SI ensures an invariable definition of the kilogram. Nevertheless, there are uncertainty issues.
Mass comparators are commonly used for the determination of mass. The counterweight principle allows many uncertainty sources to be shortcut and the resolution of the mass determination to be significantly increased. For example, a mass comparison at a specific site in a finite period of time is nearly independent of the well-known spatial variation in gravitational acceleration.
The main component of the highly sensitive devices is an electromagnetic force compensation (EMFC) weighing cell. They are essential for recent research concerning the new definition of the kilogram (Hilbrunner et al., 2018; Fröhlich et al., 2020; Rogge and Fröhlich, 2021). Nevertheless the sensitivity of the weighing cells S is dependent on mechanical stiffness C. A large contribution to uncertainties of the measurements with EMFC weighing cells is due to the weighing cell's sensitivity to tilt D. In the following, a concept to improve the performance of EMFC weighing cells based on mechanical adjustment is presented. The concept maximizes the sensor sensitivity from Eq. (1) by reducing the stiffness C→0, and at the same time, it minimizes the tilt sensitivity D→0, which results in a reduction of measurement uncertainties.
Monolithic EMFC weighing cells consist of a parallelogram guide structure realized by the upper (3) and the lower lever (2), connected to the base (1) by flexure hinges (A) and (B) and to the load carrier (4) by flexure hinges (C) and (D), as seen in Fig. 1. An upper weighing pan (6) and a lower weighing pan (5) are connected to the load carrier (4), for different applications. Usually only one of the weighing pans is used at the same time. The coupling element (7) connects the load carrier (4) with the transmission lever (8). The transmission lever (8) transmits the force of the counterweight and the electromagnetic compensation force FEMFC according to the lever ratio Γ from Eq. (2) of the point of force application and lHG in the x direction to compensate for the forces or . Similarly, deflections Δz are transmitted to the position sensor (PS).
The position sensor consists of an infrared-light-emitting diode and a differential photo diode, mounted face to face to the base, and a slit aperture mounted to the transmission lever. The components need to be fixed to the mechanism in its initial manufactured position, hereafter called the zero position. In the zero position, the differential photo diode and the infrared-light-emitting diode are adjusted in their position to the slit aperture at the lever until the differential voltage UPS is zero. The differential voltage is obtained by transmitting the two photo currents from the differential photo diode by a transimpedance amplifier to a voltage signal. In this way the position of the lever can be detected by voltage measurements in further experiments.
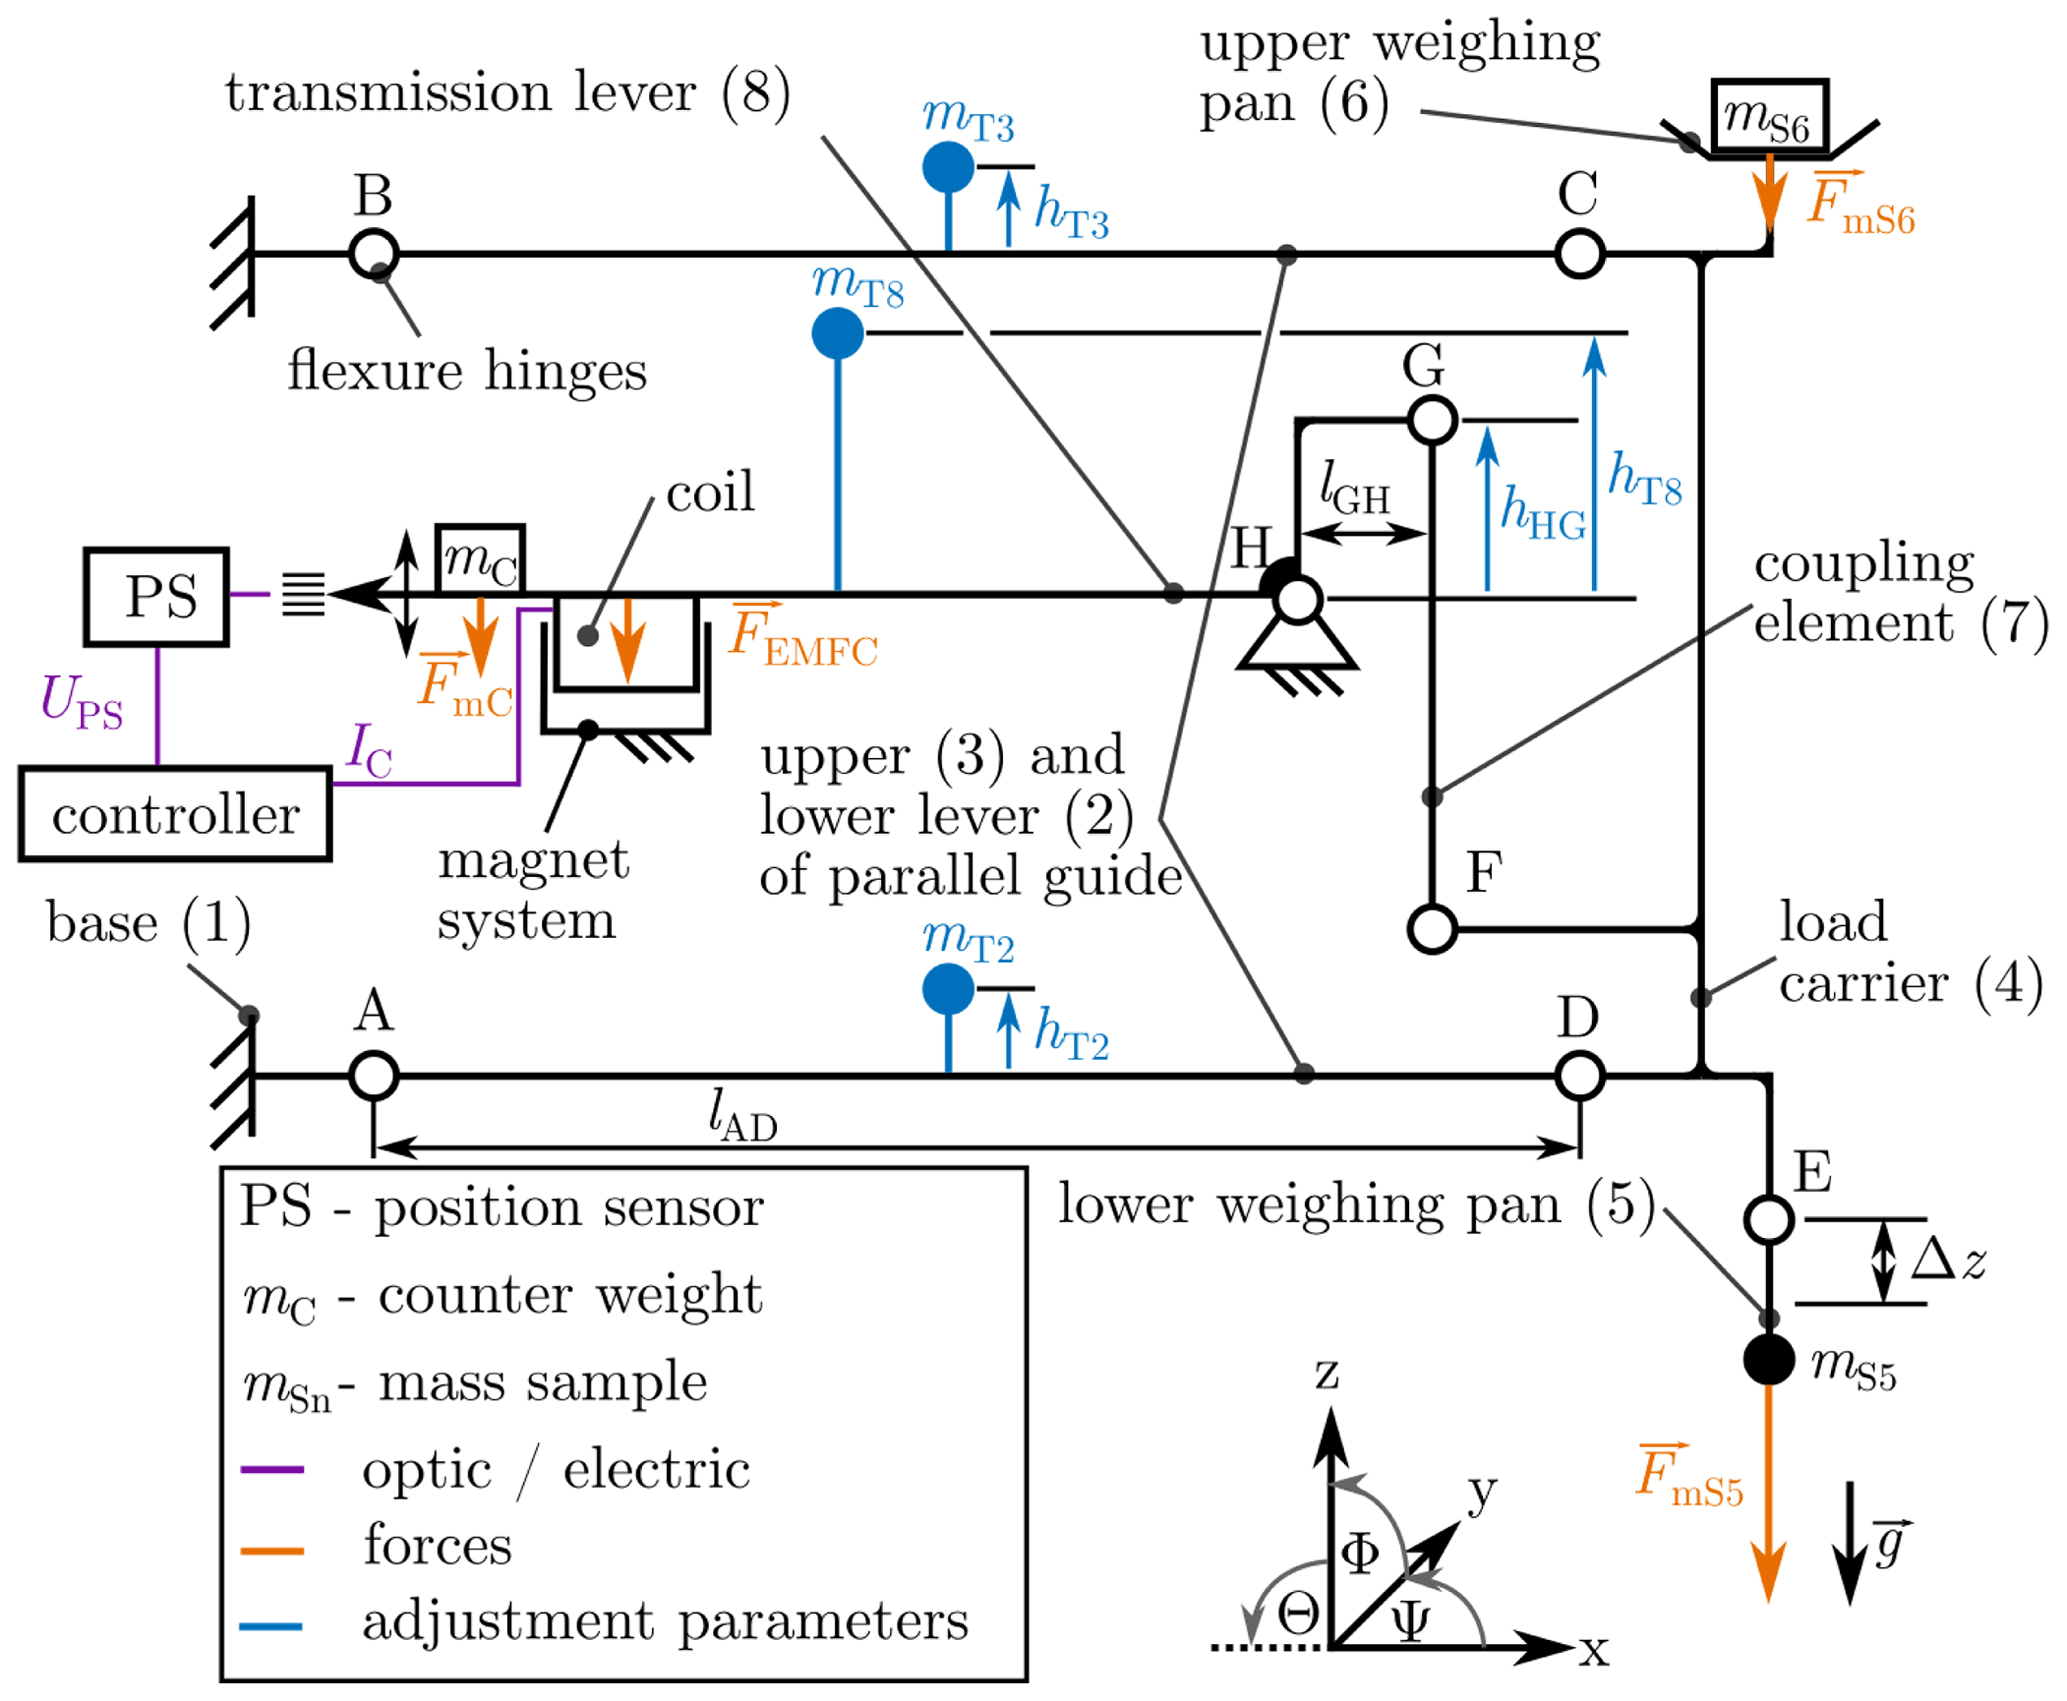
Figure 1Operating principle of the prototype planar monolithic EMFC weighing cell with adjustment facilities (blue).
In a perfect, theoretical equilibrium state, the counterweight mC counteracts the exact mass on one of the weighing pans (mS5 or mS6), and the weighing cell is in its zero position. In practical operation, the equilibrium state can only be reached by the application of an additional force FEMFC from Eq. (3). It is a Lorentz force generated by a current carrying coil with a wire length of l in a magnetic field B. Assuming that the windings of the coil are orthogonal to the magnetic field (B⟂l), the coil current IC is proportional to the generated Lorentz force (Eq. 3). With the detected deviation from the zero position by the position sensor, the coil current is driven by a PID controller to obtain the zero position.
Since the mechanism shown in Fig. 1 is designed in a monolithic form, all joints (A–H) are flexure hinges. Each flexure hinge has a mechanical stiffness CA–H due to its geometry, thickness and material properties (Weisbord and Paros, 1965). The total mechanical stiffness of the mechanism, with all flexure hinges, is further expressed as Cinit from Eq. (4). It describes the correlation between a differential mass Δm on one of the weighing pans in addition to mass on the weighing pan (mS5 or mS6) and the resulting deflection Δz of the weighing pans. For further equations, it is assumed that g∥z axis from Fig. 1.
The calculation of the initial stiffness of the mechanism Cinit.FEM can be performed using finite element method (FEM) simulations or analytically Cinit.model with good confidence in the nominal geometry (Torres Melgarejo et al., 2018; Henning and Zentner, 2021). Deviations from the measured stiffness of prototypes are prone to manufacturing uncertainties. Even small deviations of the thickness of the hinges in the range of micrometers are critical. One way to measure Cinit is to control the weighing cell in its zero position. Once this is achieved, the coil current IC is kept constant, the mass mS6 is increased by Δm and the position Δz of the weighing pan is measured with an interferometer pointed at the weighing pan. With the mass difference Δm, the gravitational acceleration g and the deflection Δz, the stiffness can be calculated as presented in Eq. (4). The deflection at the weighing pan Δz, measured with the interferometer, is also used for the calibration of the differential voltage output of the position sensor. Once the calibration factor KU has been determined (Eq. 5), small deflections can be measured by means of the position sensor. There is no further need for the interferometric measurement.
Similar to the determination of the calibration factor KU for the representation of Δz at the weighing pan, a calibration factor for the current to force correlation KI is determined. With the controller set point for the zero position, a calibration mass Δm is placed at the weighing pan, in addition to the mass samples (mS5 or mS6), while the coil current IC is logged. The calculation of the calibration factor, representing the unknown parameters of the magnet system (B⋅l) and the approximate lever ratio (Γ), is presented in Eq. (6).
The set point of the controller can be above or below the zero position, measured with the position sensor. With the mass on the weighing pan (mS5 or mS6) kept constant while changing the set point of the controller, the stiffness can be calculated with the mass difference generated by the difference in the coil current ΔIC, as described in Eq. (7).
A tilt of the base changes the direction of the force at the points of force application regarding the z axis and g. The tilt sensitivity D of EMFC weighing cells is the factor of influence by tilt to the measured mass deviation Δmtilt. In the following, the tilt sensitivity is described as DΘ for the tilt influences due to tilt around the y axis and DΦ for the tilt sensitivity around the x axis (see Eqs. 8 and 9).
The adjustment of the EMFC weighing cell can go beyond the compensation of manufacturing and mounting deviations: it can be used to tune the mechanical properties of the weighing cell to highest sensitivity while minimizing the tilt sensitivity D.
3.1 The auto-static state
This favorable adjustment state can be achieved by a combination of well-established adjustment methods for precision weighing systems: one method is the manipulation of trim masses mTn on bodies subject to rotary motion, e.g., the transmission lever of the weighing cell. The other measure is the introduction of a vertical distance hHG between joint (H) and (G) (Darnieder et al., 2018). A perpendicular shift of a trim mass with respect to the gravitational acceleration vector g influences the static equilibrium of the balance, whereas the shift in direction of g alters stiffness and tilt sensitivity (Picard, 2004). With the stiffness, the period of free oscillations of the mechanical system is changing. In Conrady (1922), a value for the period of free oscillations was found experimentally, at which the balance is insensitive to tilt angles of its base relative to the g vector, the auto-static state. In this state, the tilt sensitivity is close to zero. Small tilts of the base, e.g., due to tidal movements of the earth's crust, do not affect the indication of the balance. Without further measures, the auto-static state of the weighing system corresponds to a certain period of free oscillations or stiffness. Consequently, the adjustment represents a trade-off between measuring sensitivity and tilt sensitivity, where the auto-static state is commonly sacrificed for a gain in measuring sensitivity (Picard, 2004).
For the typical EMFC weighing cells, this limitation can be overcome by the introduction of additional trim masses on the levers of the parallelogram guide (upper and lower lever in Fig. 1) (see also Darnieder et al., 2018, and Marangoni et al., 2017). The vertical positions of these trim masses with respect to the respective center of rotation are parametrized by hT2 and hT3. In combination with the trim mass on the transmission lever hT8, the weighing cell can be adjusted to highest sensitivity (C≈0) while maintaining zero tilt sensitivity (D≈0; auto-static state). The auto-static state is now independent of the sensitivity of the weighing cell.
3.2 Reduction of initial stiffness Cinit by hHG
Even though theoretically possible, the compensation of the entire stiffness of the weighing cell mechanism by trim masses is impractical. Either large trim masses are required, or the adjustment measures become bulky. To compensate for the biggest part of the initial stiffness, a geometry change within the mechanism can be used. Here, the relevant parameter is denoted hHG – the vertical distance between the effective rotational centers of joint (H) and joint (G). The effect on the stiffness is proportional to the force flow through the coupling element (7) (Darnieder et al., 2018). In other words, the mass on the weighing pan can effectively be used as a trim mass. This advantage is a disadvantage at the same time since the sensitivity of the weighing cell becomes load-dependent. However, this is not a limiting factor for the use in a mass comparator.
To reduce the measures and masses required for the adjustment, the initial stiffness Cinit is compensated for by hHG by manufacturing according to Eq. (10). The value for the initial stiffness was calculated according to Torres Melgarejo et al. (2018) and was estimated at Cinit.model=55.9 N m−1. To compensate for the initial stiffness, the adjustment parameter hHG was chosen to be 3.15 mm, which is slightly less than the calculated value for hHG(C0=0), in order to avoid the possibility of a negative stiffness (inverted pendulum). The pre-adjusted stiffness C0 should be close to zero but in a positive range. With hHG=3.15 mm, the calculation according to Eq. (10) results in a stiffness of N m−1. The parameter mG is the sum of all masses suspended at joint G.
3.3 Compensation of C0 by fine-adjusting parameters
With the restriction of small rotations, applicable to EMFC weighing cells, the property variation due to an adjustment of the parameters hT2, hT3 (further summarized as hT2/T3) and hT8 can be described linearly as shown in Fig. 2. A deflection of the mechanism by Δz as well as a tilt of the base of the weighing cell will generate momentum by the trim masses mTn and the measures hTn. Depending on the sign of the measures hTn, introduced momentum MTn can compensate for the tilt sensitivity as well as the stiffness. The usage of a trim mass hT8 on the transmission lever and the manufactured adjustment parameter hHG is state-of-the-art. The introduction of the measures and trim masses on the parallel guide is new, more precisely at the upper (3) and lower lever (2). Technically, the trim masses and measures at the lower and the upper lever have the same effect, but for the assembly it is useful to use the lower lever if hT2/T3<0 and the upper lever if hT2/T3>0.

Figure 2Linearized model equations for the adjustment of the properties stiffness C and tilt sensitivity D.
Ideally, one adjustment parameter is uniquely interrelated with one device property. As Fig. 2 shows, this is not the case. Every adjustment parameter changes both properties of interest (ΔC,ΔD). A mathematical model of the adjustment process enables a targeted adjustment. The linearized and simplified equations for both stiffness and tilt sensitivity yield (Darnieder et al., 2018)
The values of the parameter C0 and D0 in Eqs. (11) and (12) need to be measured according to the measurement procedure described later in this paper with all adjustment parameters set to zero, except the manufactured hHG. Given that every parameter is known except for the adjustment parameters, the equation system has one solution with mT3=0. The required adjustment parameters can be estimated according to Eqs. (13) and (14):
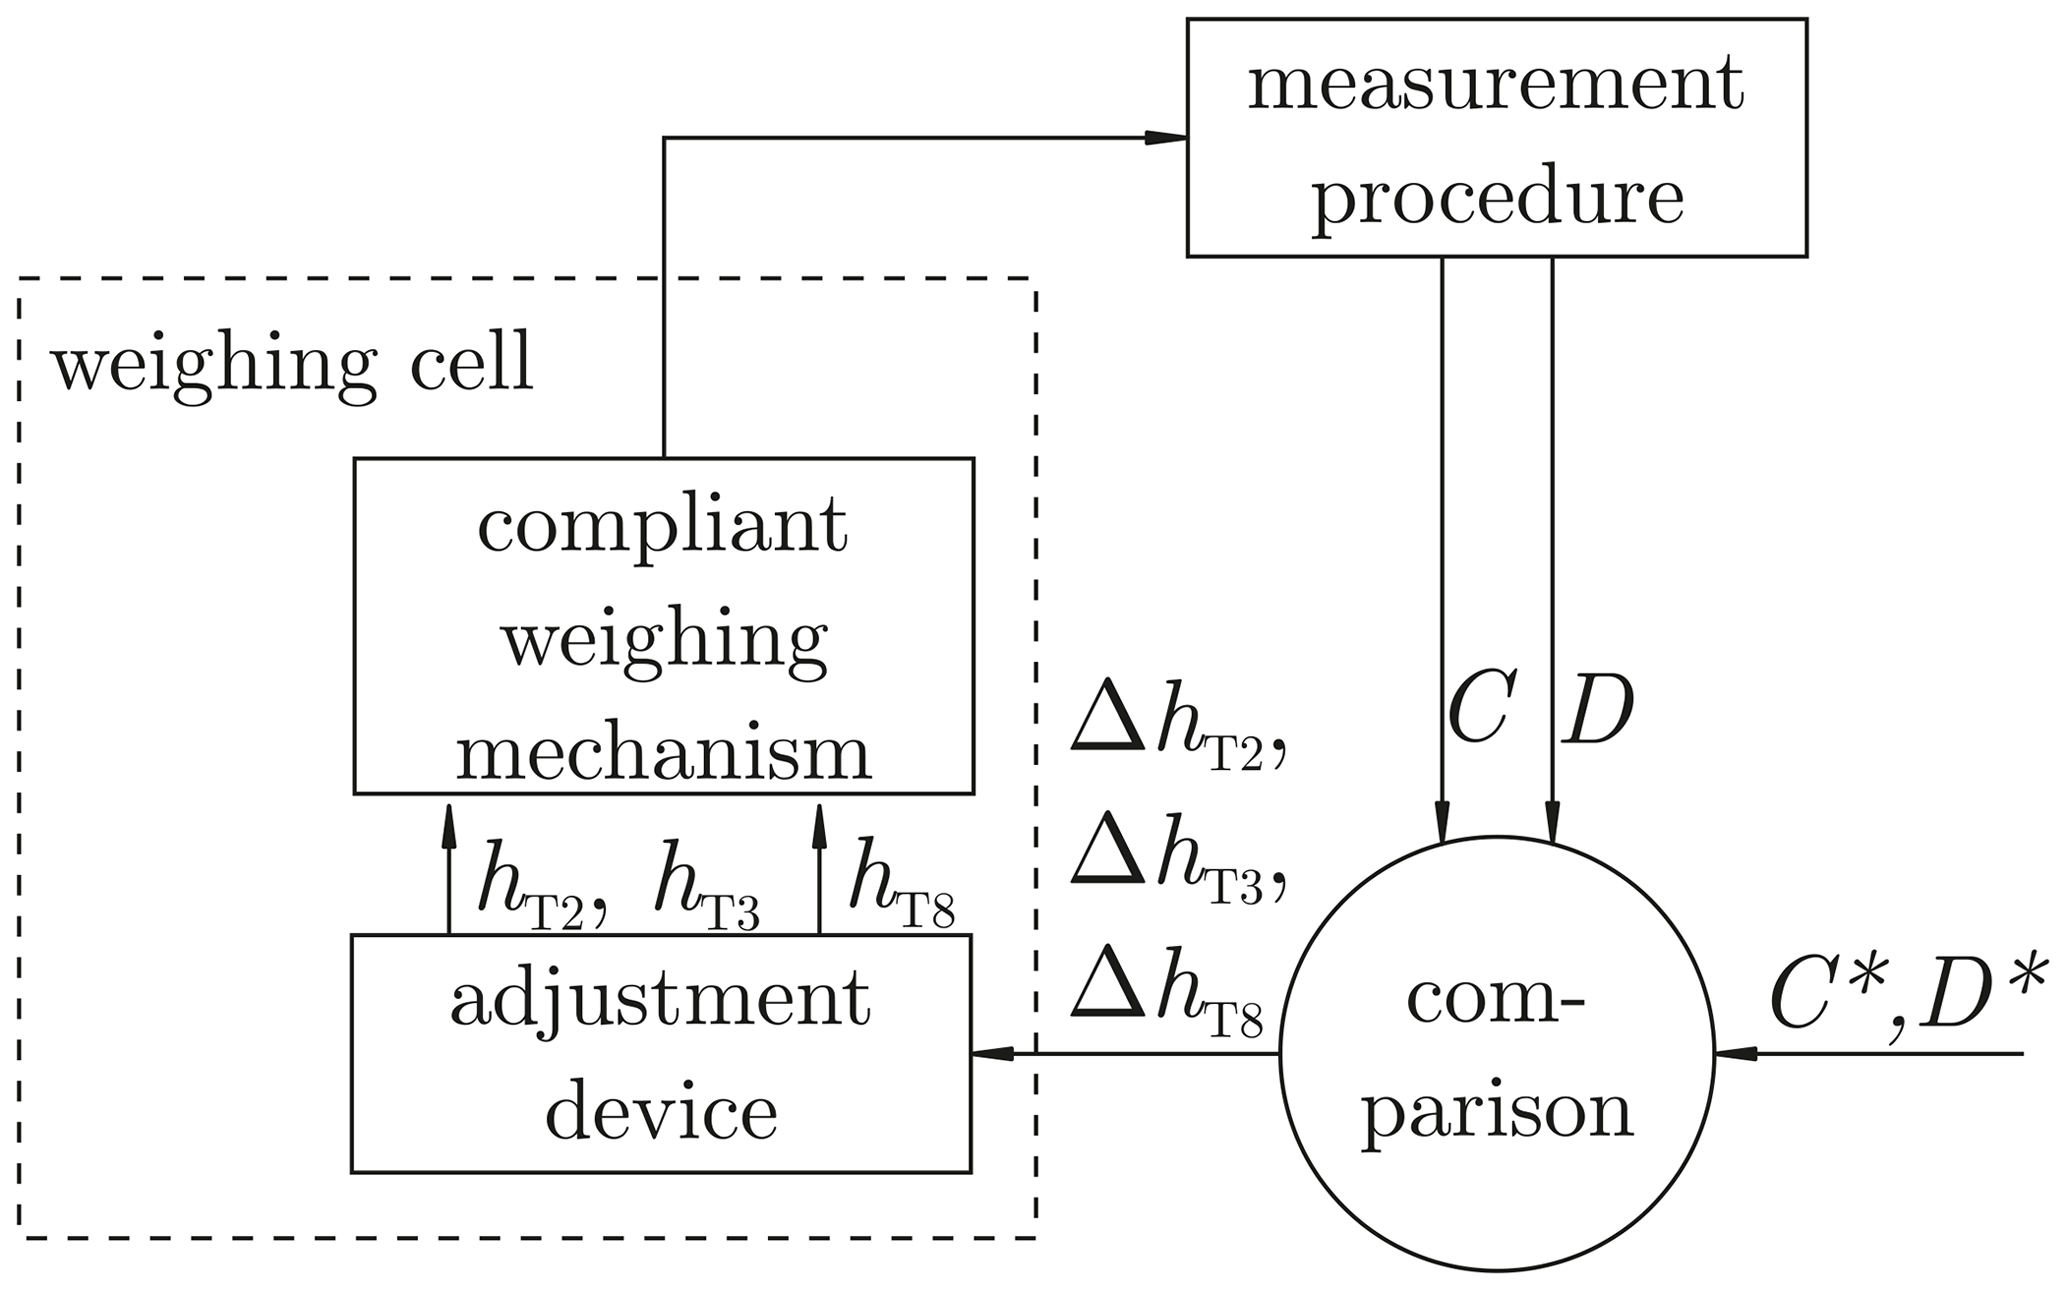
Figure 3Adjustment process for the EMFC weighing cell. The compliant weighing mechanism and the adjustment device are part of the weighing cell.
In order to realize the adjustment process described in Fig. 3, an automatized measurement routine is needed which delivers data about the stiffness and the tilt sensitivities. Therefore the weighing cell is placed on the high-precision tilt stage (Fig. 6), described in Rivero et al. (2014). It offers a tilt repeatability of less than 0.4 µrad in two axes (see also Yan et al., 2018, 2019). The control of the weighing cell is realized by a digital PID controller with programmable set point for the stiffness measurements. The analog electronics basically consist of a constant current supply for the infrared-light-emitting diode (IIR) and a transimpedance amplifier to transform the photo currents (IA1 and IA2) of the differential photo diode to a voltage UPS (also see Fig. 4). The voltage is measured by the multimeter Agilent 3458A, which forwards the information to the computer with the digital PID controller. With the differential voltage as input, the PID controller calculates the output in terms of the coil current (IC) which is output by the power source Agilent 3245A, connected to the coil. The control cycle reaches a frequency of 20 Hz, which is sufficient for the inert mechanical system.
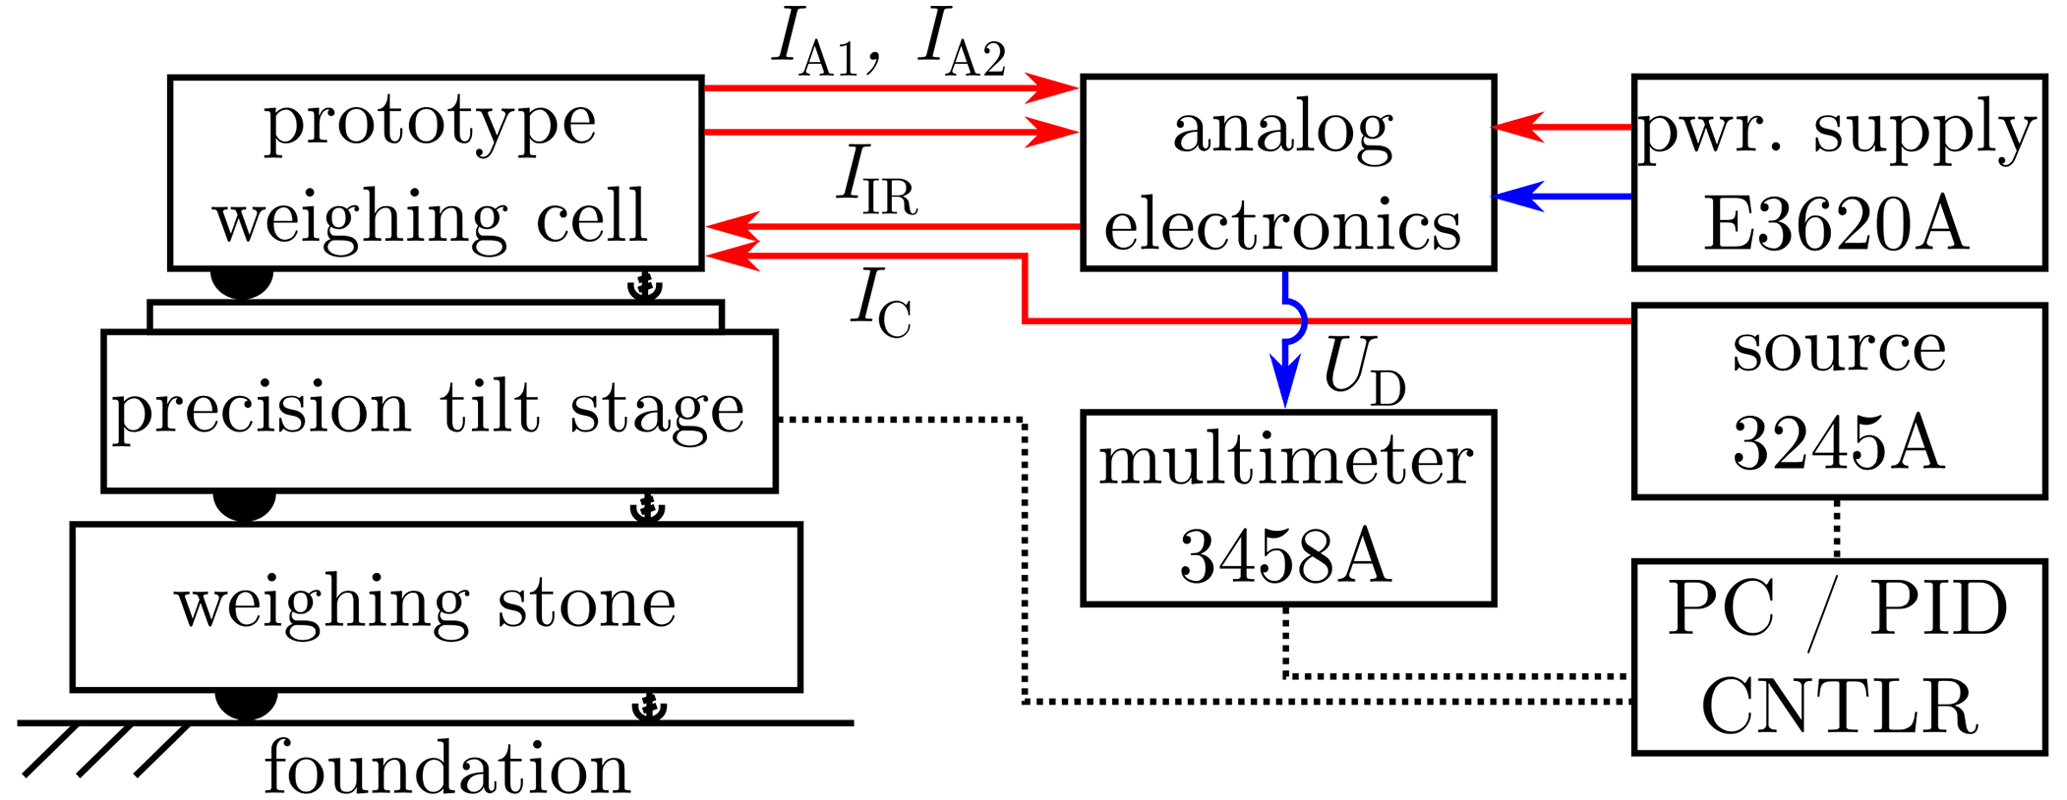

Figure 5Information combination structure (CS – controller set point; PID CTRL – proportional integral derivative controller; PC – personal computer).
During the automatized measurement routine, the tilt stage tilts the base of the weighing cell according to predefined settings. For this procedure, 27 combinations of angles of mrad and mrad were predefined. In order to counteract drifts in the signal, the position was set at the beginning (step 1), in the middle (step 13) and at the end (step 27) of each measurement routine. At each position, the offset current IC and the stiffness were measured after a defined settling time. At the end of the measurement routine, a 3D data matrix can be processed and evaluated for the stiffness, for tilt sensitivities in each axis (DΘ and DΦ) and for tilt sensitivities of the stiffness itself (CΘ and CΦ). The obtained results can be retraced in the information combination structure in Fig. 5. The whole measurement routine has to be repeated after changing one of the adjustment parameters (mTn or hTn) or the weight on one of the weighing pans mSn, in order to investigate the influences and success of the adjustment.
For the experimental investigation, the weighing cell is set up on the precision tilt stage protected by an enclosure and a windshield to reduce the influence of air movement as shown in Fig. 6. A hood made from polystyrene covered the weighing cell during measurements to minimize the influence of temperature fluctuations. The measuring concept described above was used as the method to investigate the influences of the adjustment parameters (hT2, hT3, hT8) in combination with the adjustment masses (mT2, mT3, mT8) on the properties of the weighing cell concerning the stiffness and tilt sensitivities. The experiments were repeated for different loads (mS6) on the weighing pan to gather information about the load dependency of the adjustment result. The momentum, MTn, described in Sect. 3, is an effective way to describe the combination of the adjustment parameters mTn with the adjustment measure hTn when divided by the gravitational acceleration, as described in Eq. (15):
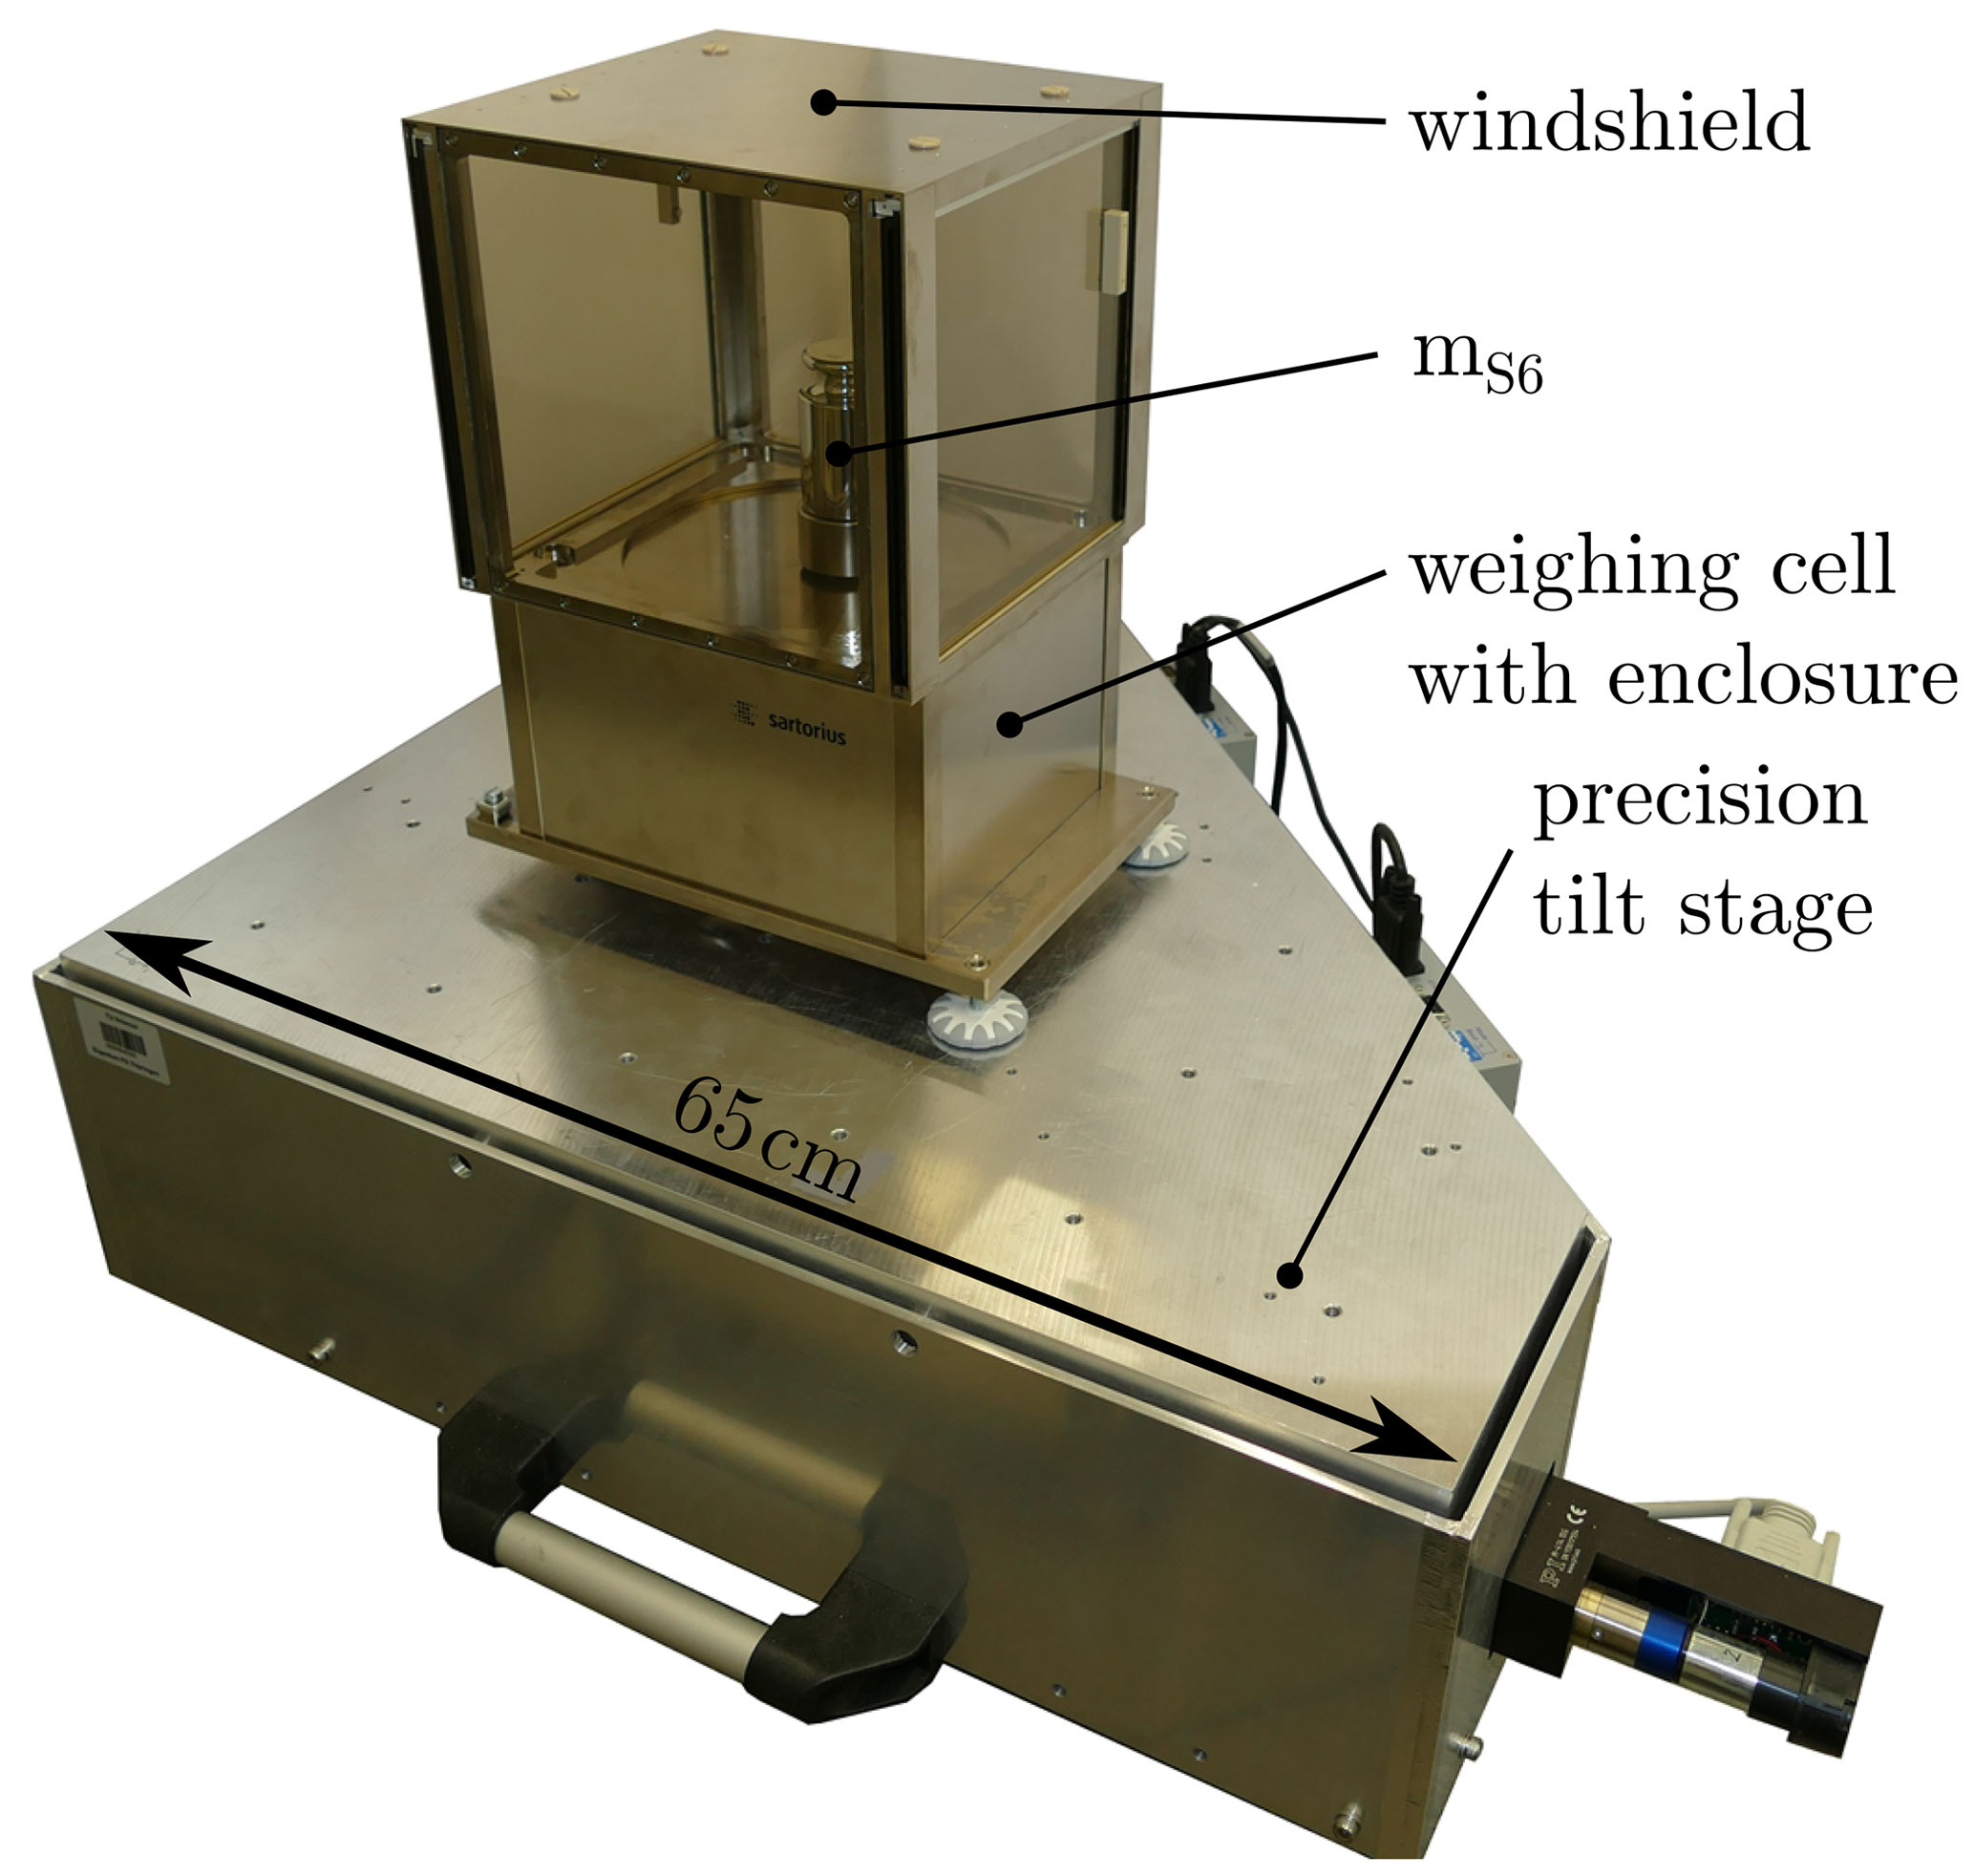
Figure 6Prototype weighing cell in enclosure on precision tilt stage.
For each load, tilt sensitivities and stiffness in dependence on the adjustment state were measured. For the expression of the adjustment success AS, the results were combined by normalizing and adding the absolute values according to Eq. (16). Since we want to compensate for the stiffness as well as the tilt sensitivity to zero, the optimum point of adjustment is at AS=0. The maximum values measured during the investigation of adjustment states with the same load of mS6 were used for Cmax and DΘ,max. The tilt sensitivity orthogonal to the measurement direction (DΦ) was not important for the adjustment success. It can not be influenced by the adjustment but delivers information about the parallelism of the axes of the tilt stage with the axes of the weighing cell.
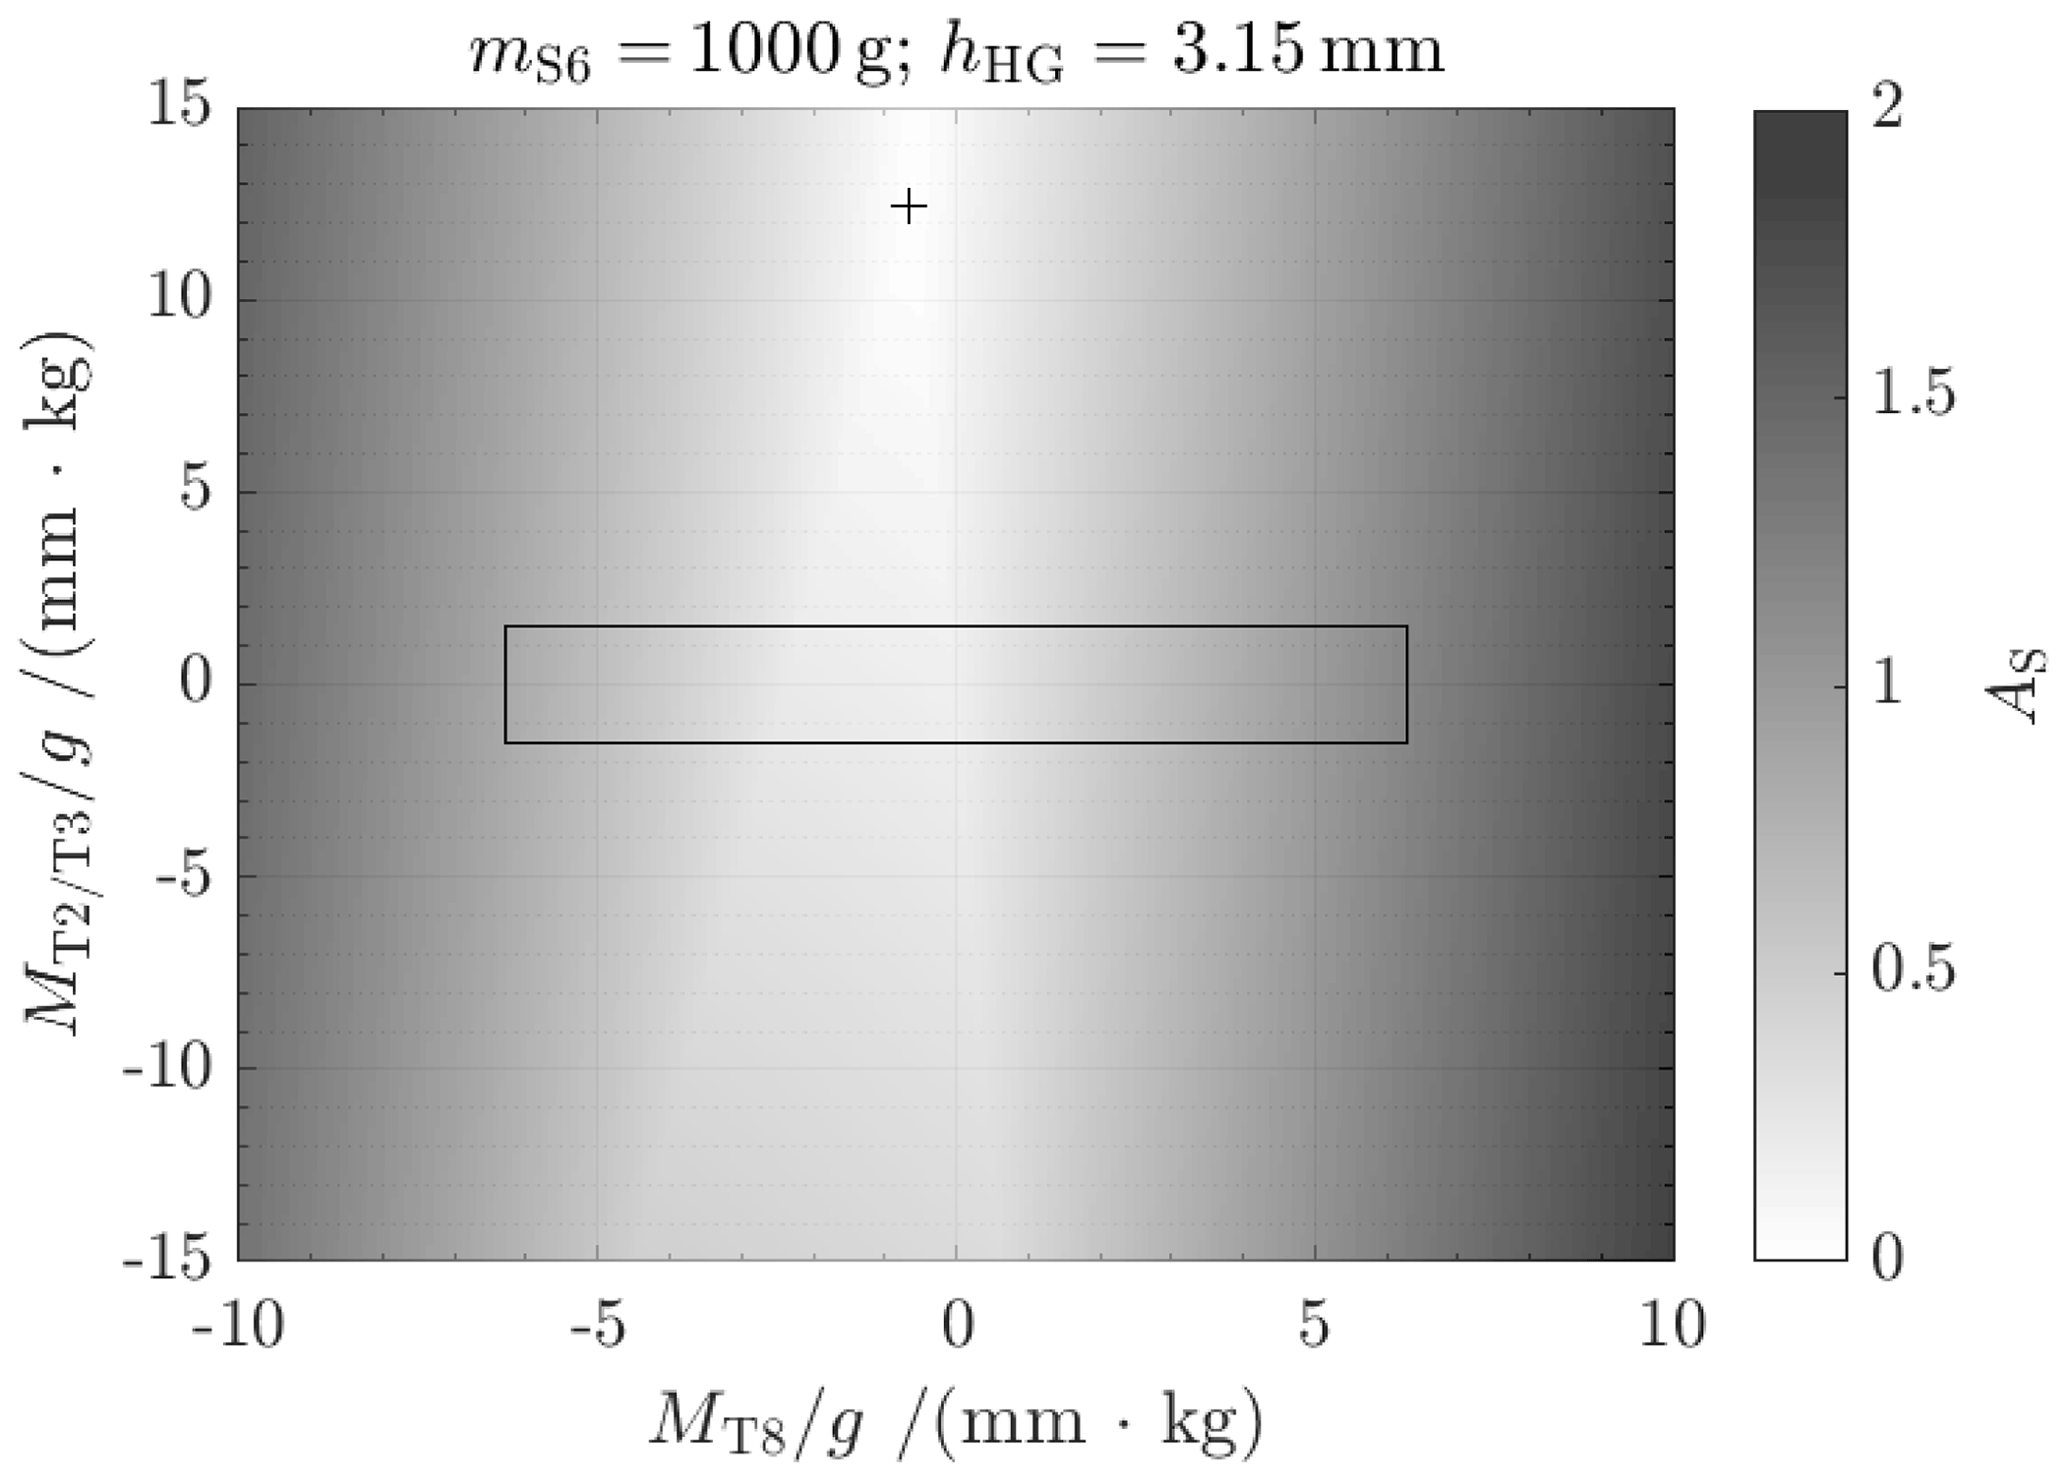
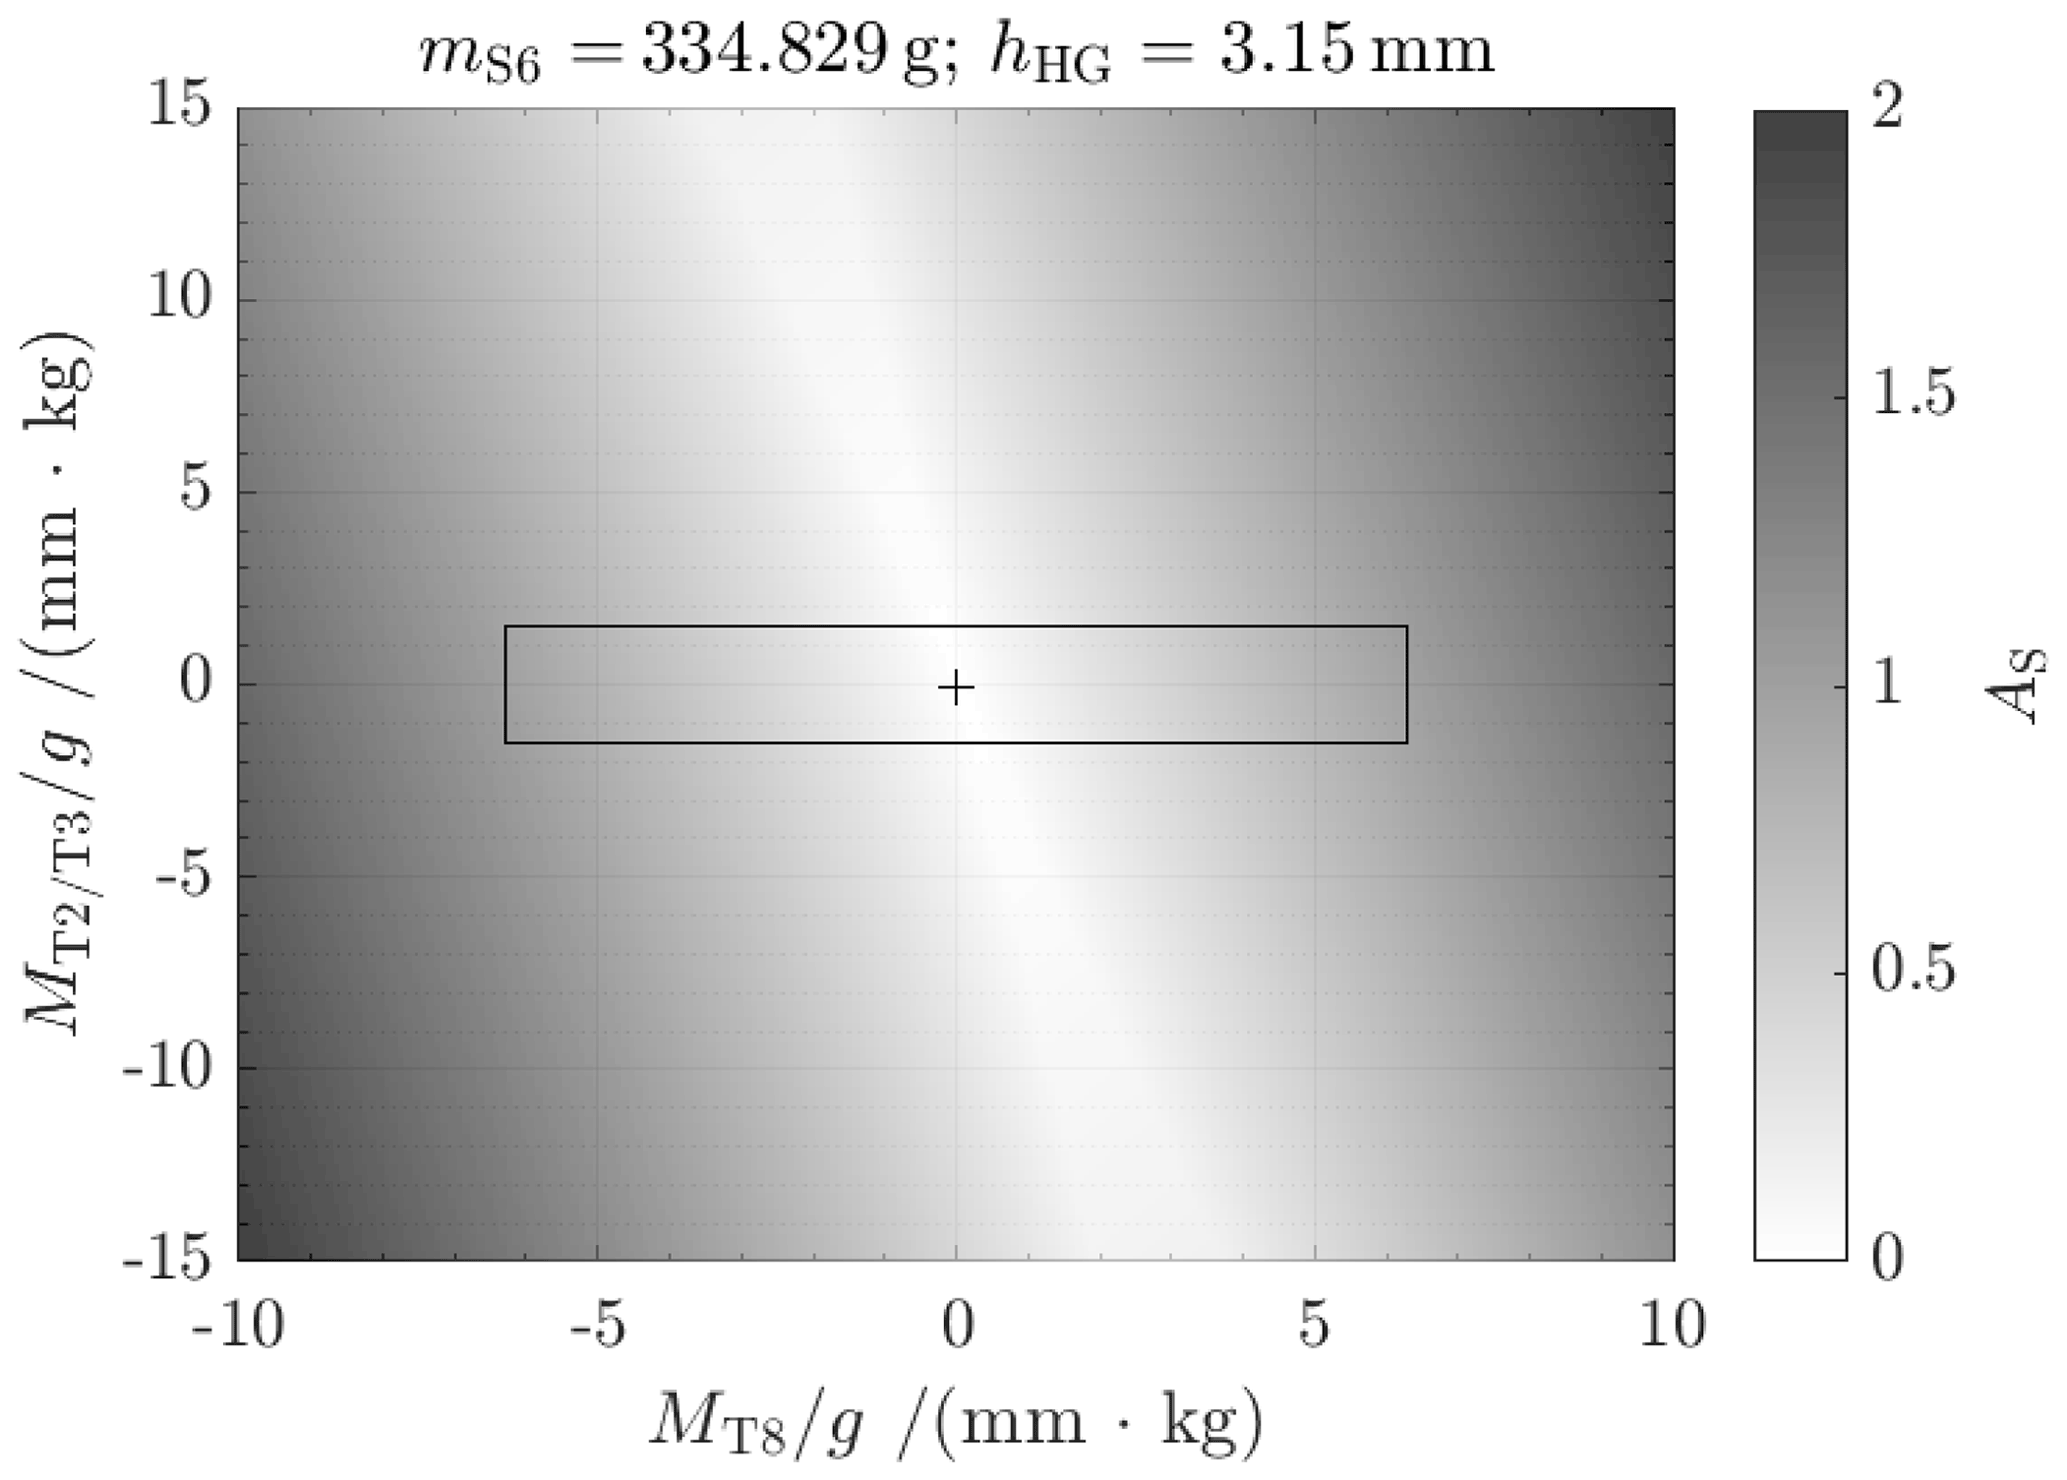
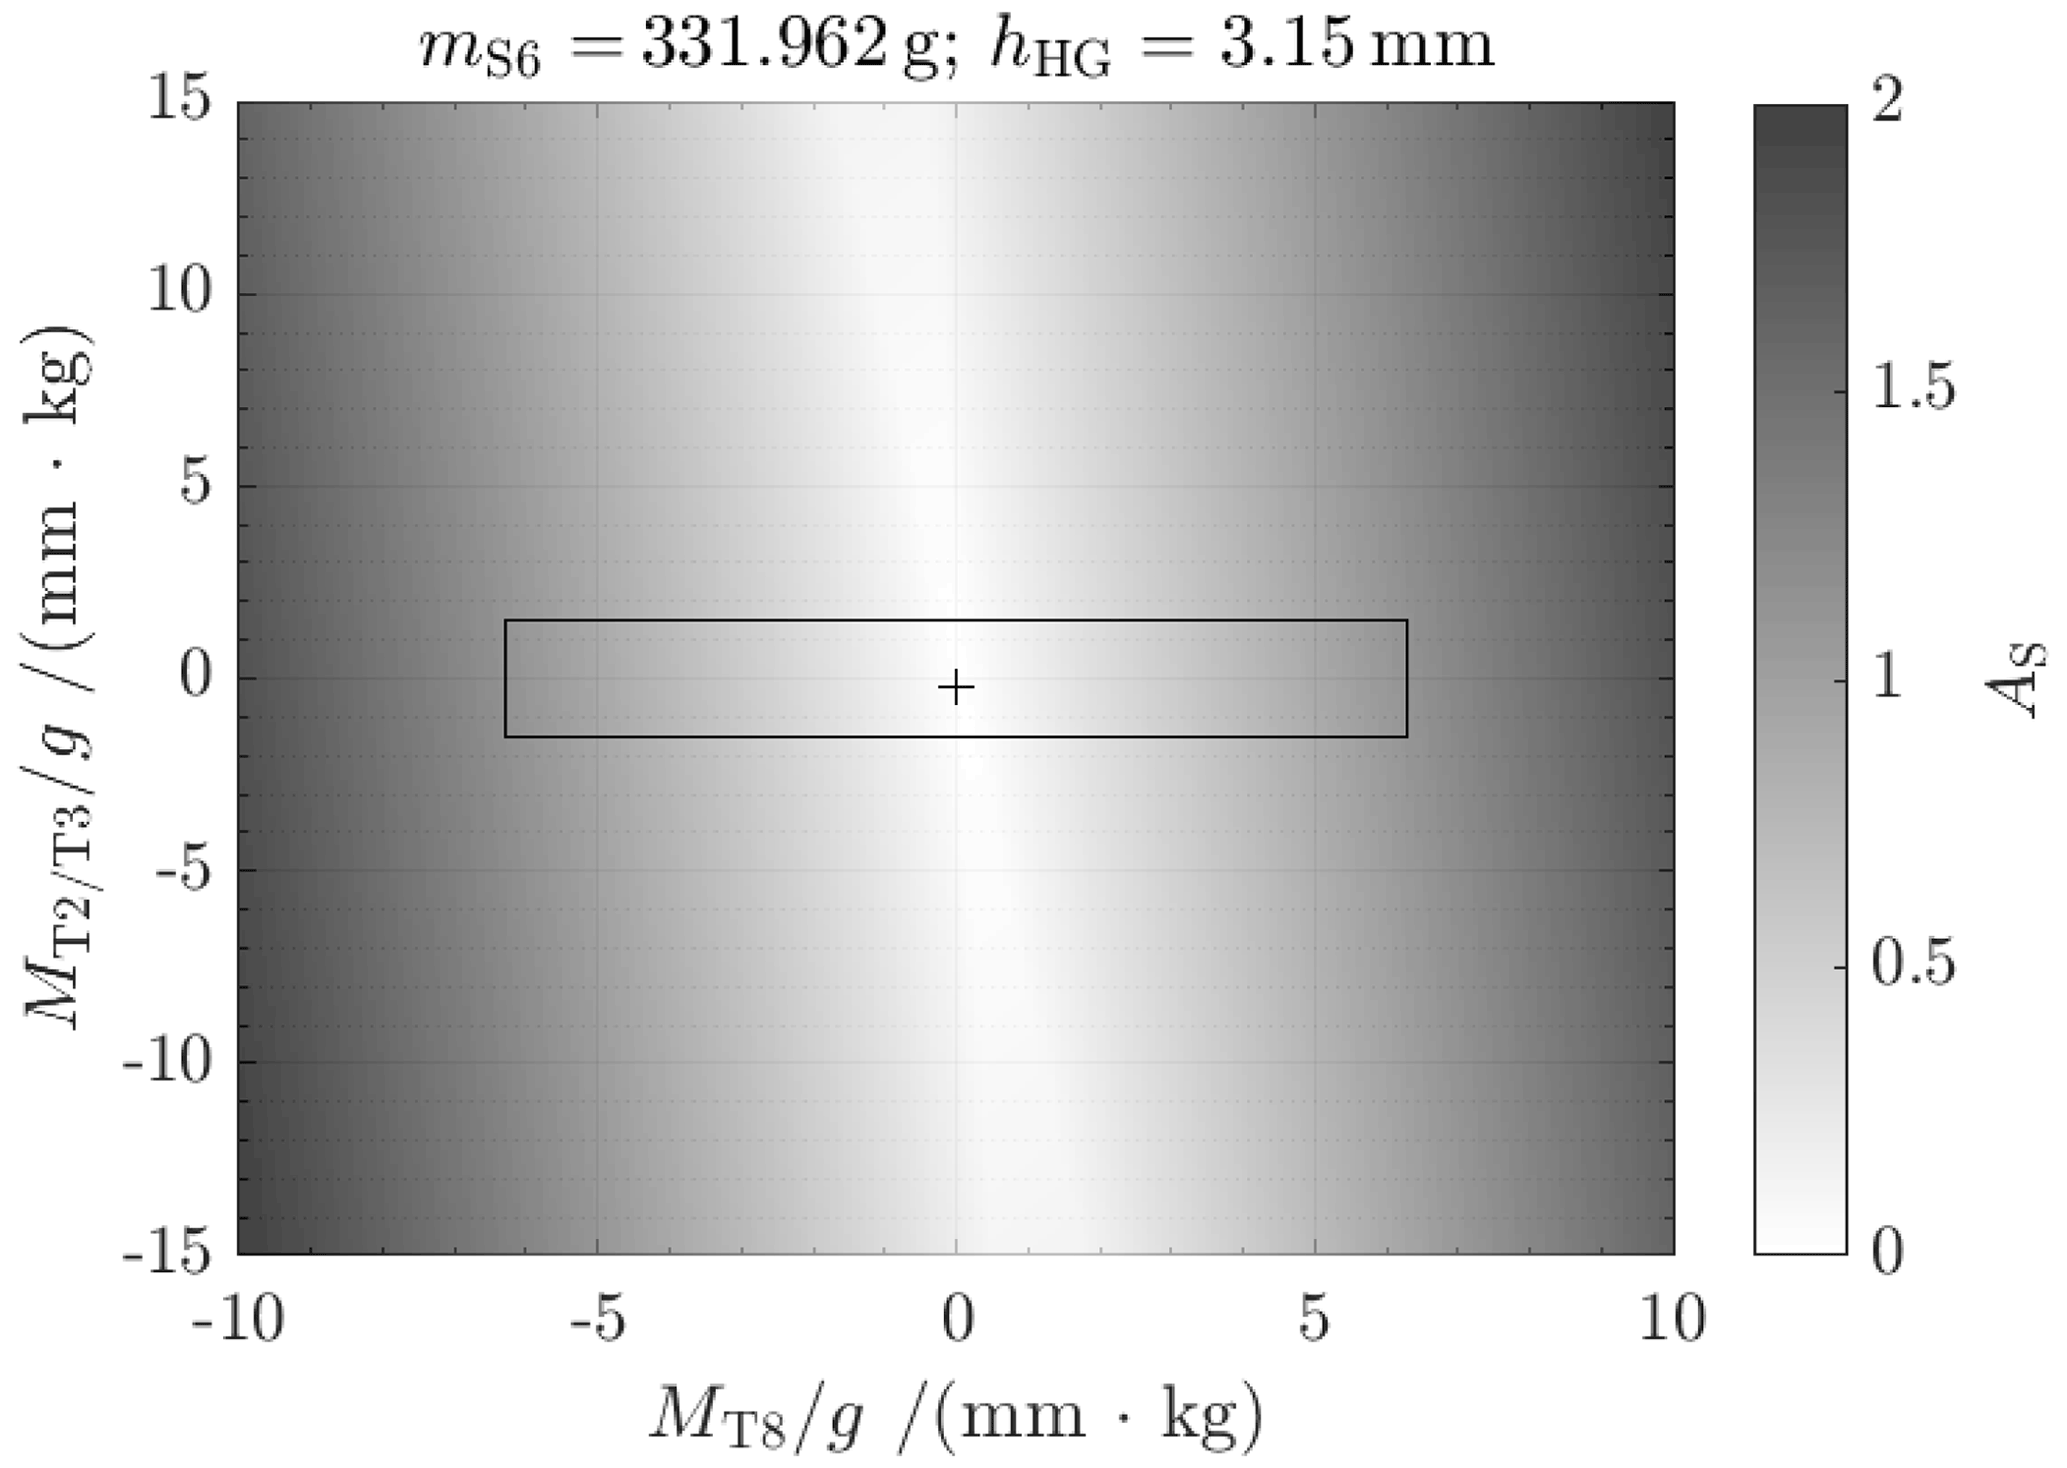
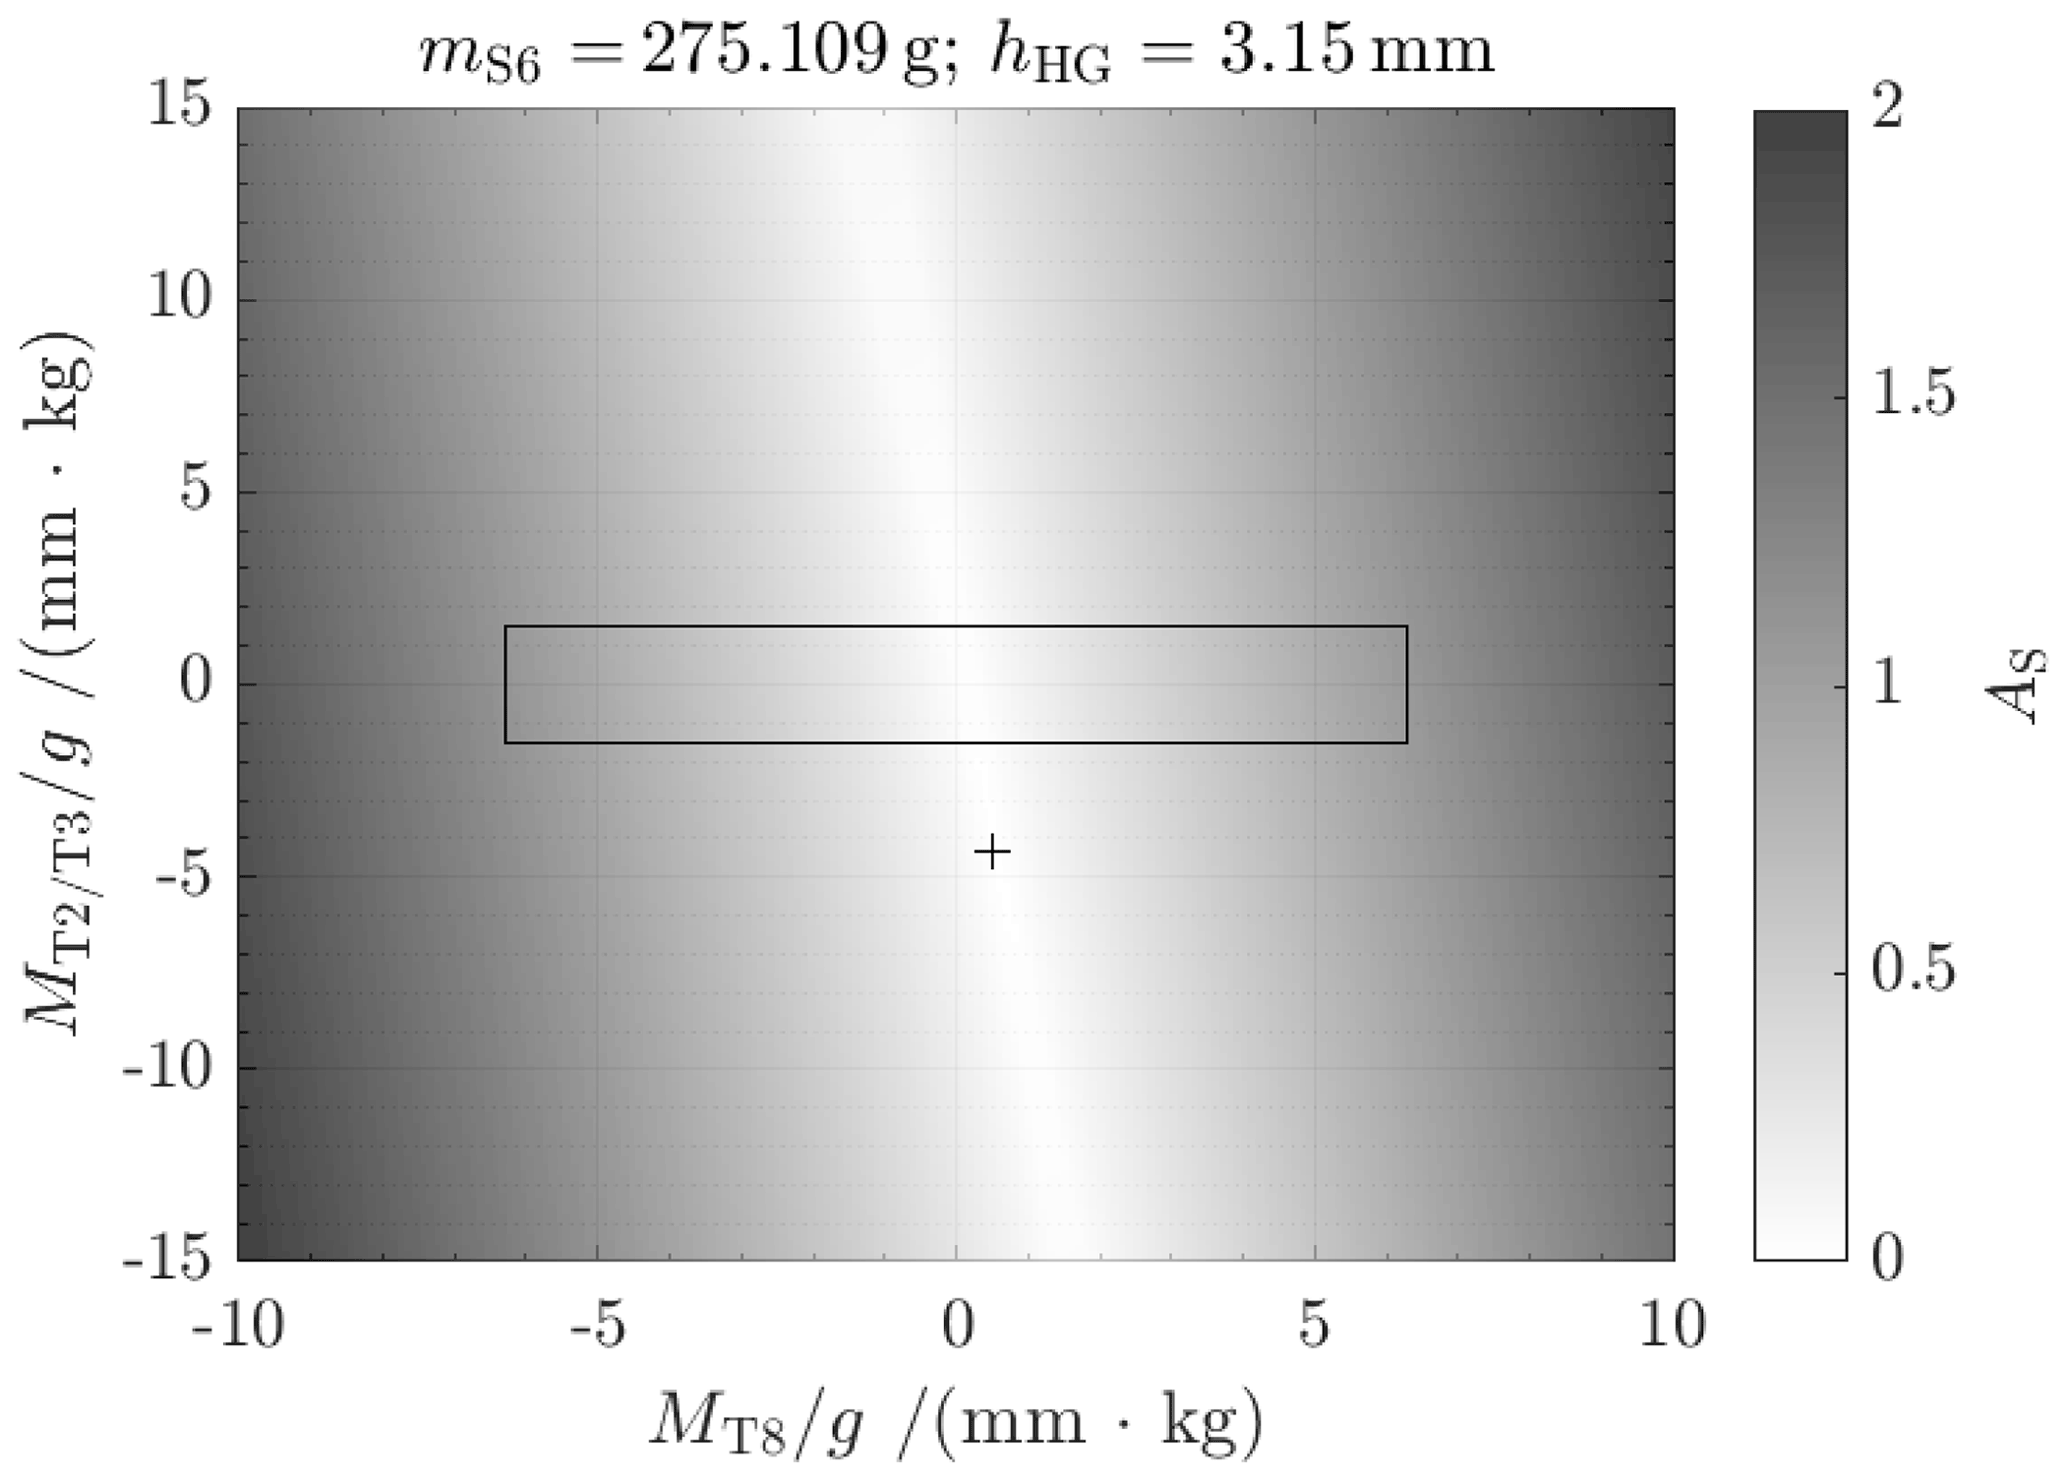
In Figs. 7–10, the results, in terms of adjustment success, from several measurement routines for each load (mS6) are presented. The black cross shows the adjustment state for the actual load, calculated from the measurement results. The black rectangle represents the area of adjustability, limited by the installation space. All combinations inside of the rectangle allow for adjustment.
Originally, the load cell was designed with hHG=3.15 mm for a stiffness slightly above zero. But after initial measurements with all adjustment parameters set to zero, the measured stiffness was N m−1 for mS6=1 kg. The most likely reason for this is a deviation of thickness of the flexure hinges. The thin areas are difficult to manufacture, and deviations of only a few micrometers result in significant deviations (for more information on the calculation of stiffness of flexure hinges, see Torres Melgarejo et al., 2018). According to Fig. 7, the adjustment measures for hT2/T3 could not be reached in this case. Nevertheless, in order to provide basic evidence for the correctness of the adjustment approach, the mass of the sample on the weighing pan was reduced to about 335 g (Fig. 8). For this, a stiffness close to zero and a tilt sensitivity in the range of adjustability are achieved. This state is further called the pre-adjusted state. Several measurements were performed with varying values for hT8 and hT2/T3, while the trim weights mT8 and mT2/T3 were kept constant. With the measurement results, the adjustment measures were calculated for the fine-adjusted state: mm and hT8=0.006 mm.
Table 1Adjustment success for stiffness.
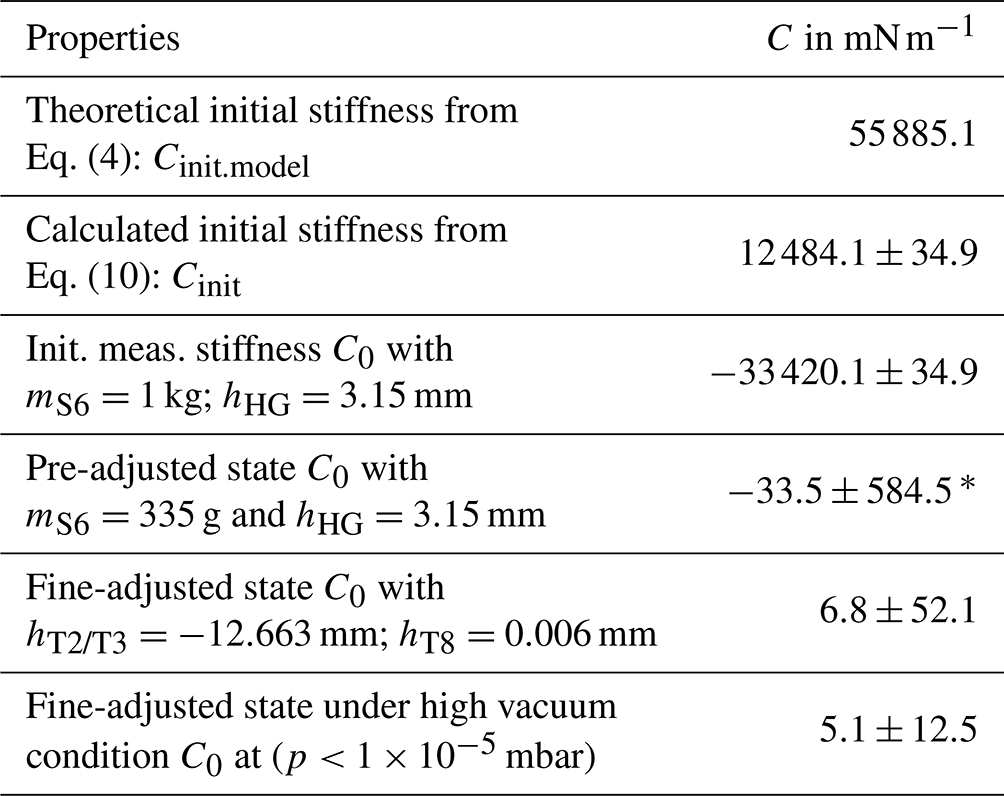
Standard deviations k=1. * High standard deviation is caused by the instable condition of the weighing cell with negative stiffness (inverted pendulum).
Table 2Adjustment success for tilt sensitivity.
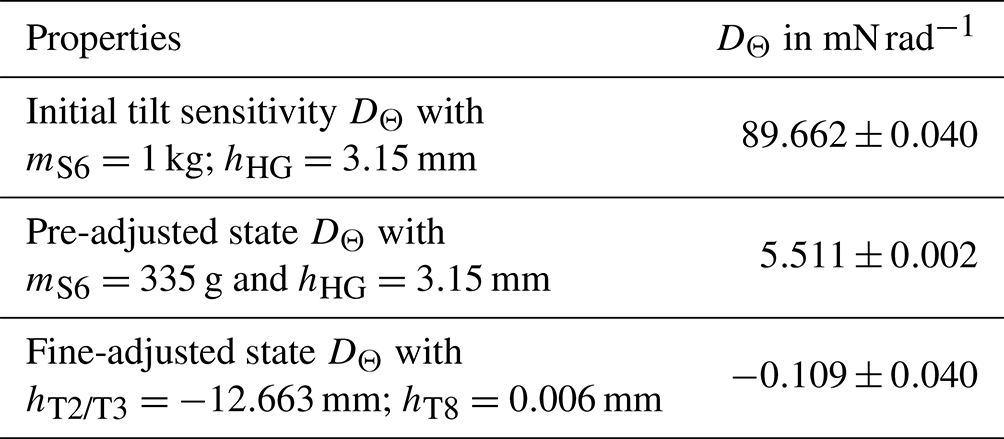
Standard deviations k=1.
With the adjustment measures set to the weighing cell, the measurement procedure was repeated several times to obtain information about the repeatability. The results are presented in Tables 1 and 2 (fine-adjusted state). For the proof of vacuum compatibility, the measurements of the stiffness were repeated under high vacuum conditions ( mbar) in the environment of a high vacuum mass comparator. The results of the repeated stiffness measurements under high vacuum conditions are presented in Table 1, and the results of the milestones during the adjustment procedure are presented in Tables 1 and 2.
A novel planar monolithic electromagnetic force compensation weighing cell was manufactured and investigated. The mechanical properties of the new weighing cell can be adjusted, which allows the stiffness and the tilt sensitivity to be compensated for in a more sophisticated way.
The verification of the adjustment approach was confirmed experimentally. The initially measured stiffness was compensated for to <1.1 ‰ in the pre-adjusted state and further reduced by in the fine adjusted state. The tilt sensitivity was compensated for to <1.3 ‰ compared to the initial measured tilt sensitivity or <2 % compared to the pre-adjusted state. The vacuum compatibility of the new mechanism was confirmed for further investigations in the environment of a vacuum mass comparator. Here, the performance of the system will be determined and compared to other systems. The knowledge about the manufacturing deviations in the weighing cell will be used for further investigation and the design of the next prototype. A further improvement can be achieved by the integration of an adjustment of the parameter hHG in the mechanical structure. Thereby the influence of the load as trim mass itself can be counteracted, and the weighing cell can be adapted to a wide range of loads.
The underlying measurement data and software codes are not publicly available and can be requested from the authors if required.
MP and MD wrote the initial draft of the paper. MD was mainly involved in the modeling of the operating principle and the adjustment concept. MP was responsible for the measurement strategy, including operation of the measurements and data evaluation. RT and TF were in charge of the research concept, raised the funds and were involved in reviewing and editing of the paper.
At least one of the (co-)authors is a member of the editorial board of Journal of Sensors and Sensor Systems. The peer-review process was guided by an independent editor, and the authors also have no other competing interests to declare.
Publisher's note: Copernicus Publications remains neutral with regard to jurisdictional claims in published maps and institutional affiliations.
This article is part of the special issue “Sensors and Measurement Science International SMSI 2021”. It is a result of the Sensor and Measurement Science International, 3–6 May 2021.
The authors would like to thank the German Research Foundation (DFG) for the financial support of the project.
This research has been supported by the Deutsche Forschungsgemeinschaft (grant nos. TH845/7-2 and FR2779/6-2).
This paper was edited by Andreas König and reviewed by three anonymous referees.
BIPM: Le Système international d'unités/The International System of Units (“The SI Brochure”), Bureau international des poids et mesures, 9th edn., http://www.bipm.org/en/si/si_brochure/ (last access: 29 March 2022), 2019. a
Conrady, A.: A study of the balance, P. R. Soc. Lond. A-Conta., 101, 211–224, 1922. a
Darnieder, M., Pabst, M., Wenig, R., Zentner, L., Theska, R., and Fröhlich, T.: Static behavior of weighing cells, J. Sens. Sens. Syst., 7, 587–600, https://doi.org/10.5194/jsss-7-587-2018, 2018. a, b, c, d
Fröhlich, T., Rogge, N., Vasilyan, S., Rothleitner, C., Günther, L., Lin, S., Hilbrunner, F., Knopf, D., Härtig, F., and Marangoni, R.: Neue Wege zur Kalibrierung von E2-Massenormalen und Darstellung von Kräften bis 10 N, tm-Technisches Messen, 87, 280–293, https://doi.org/10.1515/teme-2019-0143, 2020. a
Henning, S. and Zentner, L.: Analysis of planar compliant mechanisms based on non-linear analytical modeling including shear and lateral contraction, Mech. Mach. Theory, 164, 104397, https://doi.org/10.1016/j.mechmachtheory.2021.104397, 2021. a
Hilbrunner, F., Rahneberg, I., and Fröhlich, T.: Wattwaage mit Hebelübersetzung auf Basis eines kommerziellen EMK-Wägesystems, tm-Technisches Messen, 85, 658–679, https://doi.org/10.1515/teme-2017-0065, 2018. a
Marangoni, R. R., Rahneberg, I., Hilbrunner, F., Theska, R., and Fröhlich, T.: Analysis of weighing cells based on the principle of electromagnetic force compensation, Meas. Sci. Technol., 28, 075101, https://doi.org/10.1088/1361-6501/aa6bcd, 2017. a
Picard, A.: The BIPM flexure-strip balance FB-2, Metrologia, 41, 319, 2004. a, b
Quinn, T.: The kilogram: the present state of our knowledge, IEEE T. Instrum. Meas., 40, 81–85, https://doi.org/10.1109/tim.1990.1032888, 1991. a
Rivero, M., Kühnel, M., and Fröhlich, T.: High precision dual axis tilt stage, in: Proceedings of the 58th Ilmenau Scientific Colloquium, Ilmenau, 8–12 September 2014, urn:nbn:gbv:ilm1-2014iwk:3, 2014. a
Rogge, N. and Fröhlich, T.: Nutzung eines kommerziellen EMK-Systems als Bestandteil einer Kibble-Waage, tm-Technisches Messen, 88, s8–s13, https://doi.org/10.1515/teme-2021-0053, 2021. a
Stock, M., Davis, R., de Mirandés, E., and Milton, M. J. T.: The revision of the SI – the result of three decades of progress in metrology, Metrologia, 56, 022001, https://doi.org/10.1088/1681-7575/ab0013, 2019. a
Torres Melgarejo, M. A., Darnieder, M., Linß, S., Zentner, L., Fröhlich, T., and Theska, R.: On Modeling the Bending Stiffness of Thin Semi-Circular Flexure Hinges for Precision Applications, Actuators, 7, 86, https://doi.org/10.3390/act7040086, 2018. a, b, c
Weisbord, L. and Paros, J.: How to design flexure hinges, Mach. Des., 27, 151–157, 1965. a
Yan, N., Kühnel, M., Vasilyan, S., and Fröhlich, T.: Torsion balance-based system for high-precision force measurement in horizontal plane: part I. Development concept, Meas. Sci. Technol., 29, 084001, https://doi.org/10.1088/1361-6501/AABA1F, 2018. a
Yan, N., Vasilyan, S., and Fröhlich, T.: Torsion balance-based system for high-precision force measurement in horizontal plane: part II. Static and dynamic improvement, Meas. Sci. Technol., 30, 055104, https://doi.org/10.1088/1361-6501/AB05AA, 2019. a
- Abstract
- Introduction
- Operating principle of EMFC weighing cells
- Adjustment concept
- Measuring concept
- Experimental investigations and results
- Conclusions
- Code and data availability
- Author contributions
- Competing interests
- Disclaimer
- Special issue statement
- Acknowledgements
- Financial support
- Review statement
- References