the Creative Commons Attribution 4.0 License.
the Creative Commons Attribution 4.0 License.
 | 29 Jun 2022
Near-infrared LED system to recognize road surface conditions for autonomous vehicles
Hongyi Zhang
Shéhérazade Azouigui
Rabia Sehab
Moussa Boukhnifer
The driving safety of autonomous vehicles will strongly depend on their ability to recognize road surface conditions such as dry, wet, snowy and icy road. Currently, the existing investigations to detect road surface conditions still have limitations in daytime and nighttime conditions. The objective of this paper is to propose and develop a new system with three near-infrared (NIR) LED sources. This choice is based on the advantages of LED sources over laser diodes. They are less sensitive to temperature and have lower costs. Considering these advantages, the feasibility of the LED system to recognize road surface conditions is investigated. For this, the appropriate wavelengths of the LED tri-wavelength source are first computed from experimental data taking into account the specific LED spectral shape. In addition, the effect of the spectral bandwidth of the LED sources on the system performance is theoretically studied. Finally, the NIR LED system with the LED sources at 970, 1450 and 1550 nm is experimentally tested and validated with an incident angle from 78.7 to 86.2∘. According to the results of the experiments, the accuracy of the classification of snow, wet and water can reach 97 %, while the accuracy of the dry and wet road surface conditions is respectively 73 % and 68 %.
- Article
(11019 KB) - Full-text XML
- BibTeX
- EndNote


In recent years, autonomous driving technology has developed rapidly (Anderson et al., 2014; Faisal et al., 2019). In order to ensure the passenger has a safe and comfortable experience in autonomous vehicles (AVs), advanced obstacle-detection systems have to be implemented. Current solutions for detecting obstacles in AVs have led to a relatively good performance. However, there is potential for improvement for increased safety of AVs on the road, both in daytime and nighttime conditions. In particular, the calculation of braking distance for AVs is currently based on road adhesion without taking into account the road surface conditions (Zhang et al., 2021). However, AVs in real life may encounter ice, snow or water puddles, which may be the cause of severe traffic accidents. Thus, the detection systems must enable the detection of changes in weather-induced road surface conditions to anticipate the vehicle reaction and/or deactivate the automated functions in the case of ice, snow and puddles with aquaplaning risk. Today, more and more information about the environment can be obtained by vehicles, especially AVs. If information about the road conditions could be classified, this information would be helpful for AVs but also for advanced driver-assistance systems (ADAS) in vehicles with a low automation level, to clarify the position of slippery parts and to plan the trajectory so as to avoid slippery roads or decrease the speed of the vehicle in advance. A key point is the detection range, since the autonomous system should have enough reaction time to make a decision. For a speed of 60 km h−1 and a reaction time of 2 s, the detection range should be over 33 m.
For several years, research has focused on new methods to detect road surface conditions in an attempt to decrease accidents caused by slippery roads. Today, many remote sensing techniques are investigated, among which some are based on polarization of light (Yamada et al., 2003; Colace et al., 2013). However, the main disadvantage of this technique is that specular reflection is required, which implies that the source and the sensor have to be implemented on the opposite sides of the road surface in order to be analyzed. Hence, the source and the sensor cannot both be implemented on the vehicles. In Shin et al. (2019), a visible lidar is used to distinguish dry, wet and icy road surface conditions. Experiments were conducted at a fixed distance from the lidar to the road sample. It was found that the intensity of the signal received for the wet condition was lower than the dry condition and that backscattering light for the icy condition was not detectable. However, the limitation is that the intensity could depend on the distance of detection, and thus the feasibility of the system for a varied distance needs to be proved.
A more promising technique for classification of road conditions exploits the intensity variation of the scattered near-infrared (NIR) light from the road surface. The scattering of light is indeed dependent on the roughness of the illuminated surface and the absorption of the illuminated material. For smooth surfaces, such as ice and water, the backscattering light also relies on the scattering taking place below the surface. The scattering hence results in a specific spectral response, which means that the amount of scattered light from the road material (i.e., asphalt) and from the material on the road (i.e., water, ice and snow) depends on the wavelength of the illumination source. As an example, the wavelength-dependent absorption coefficients for water and ice are shown in Fig. 1. It can be seen that in the 1450 nm band , water absorbs more light than ice, whereas at 1550 nm, ice absorbs more light.
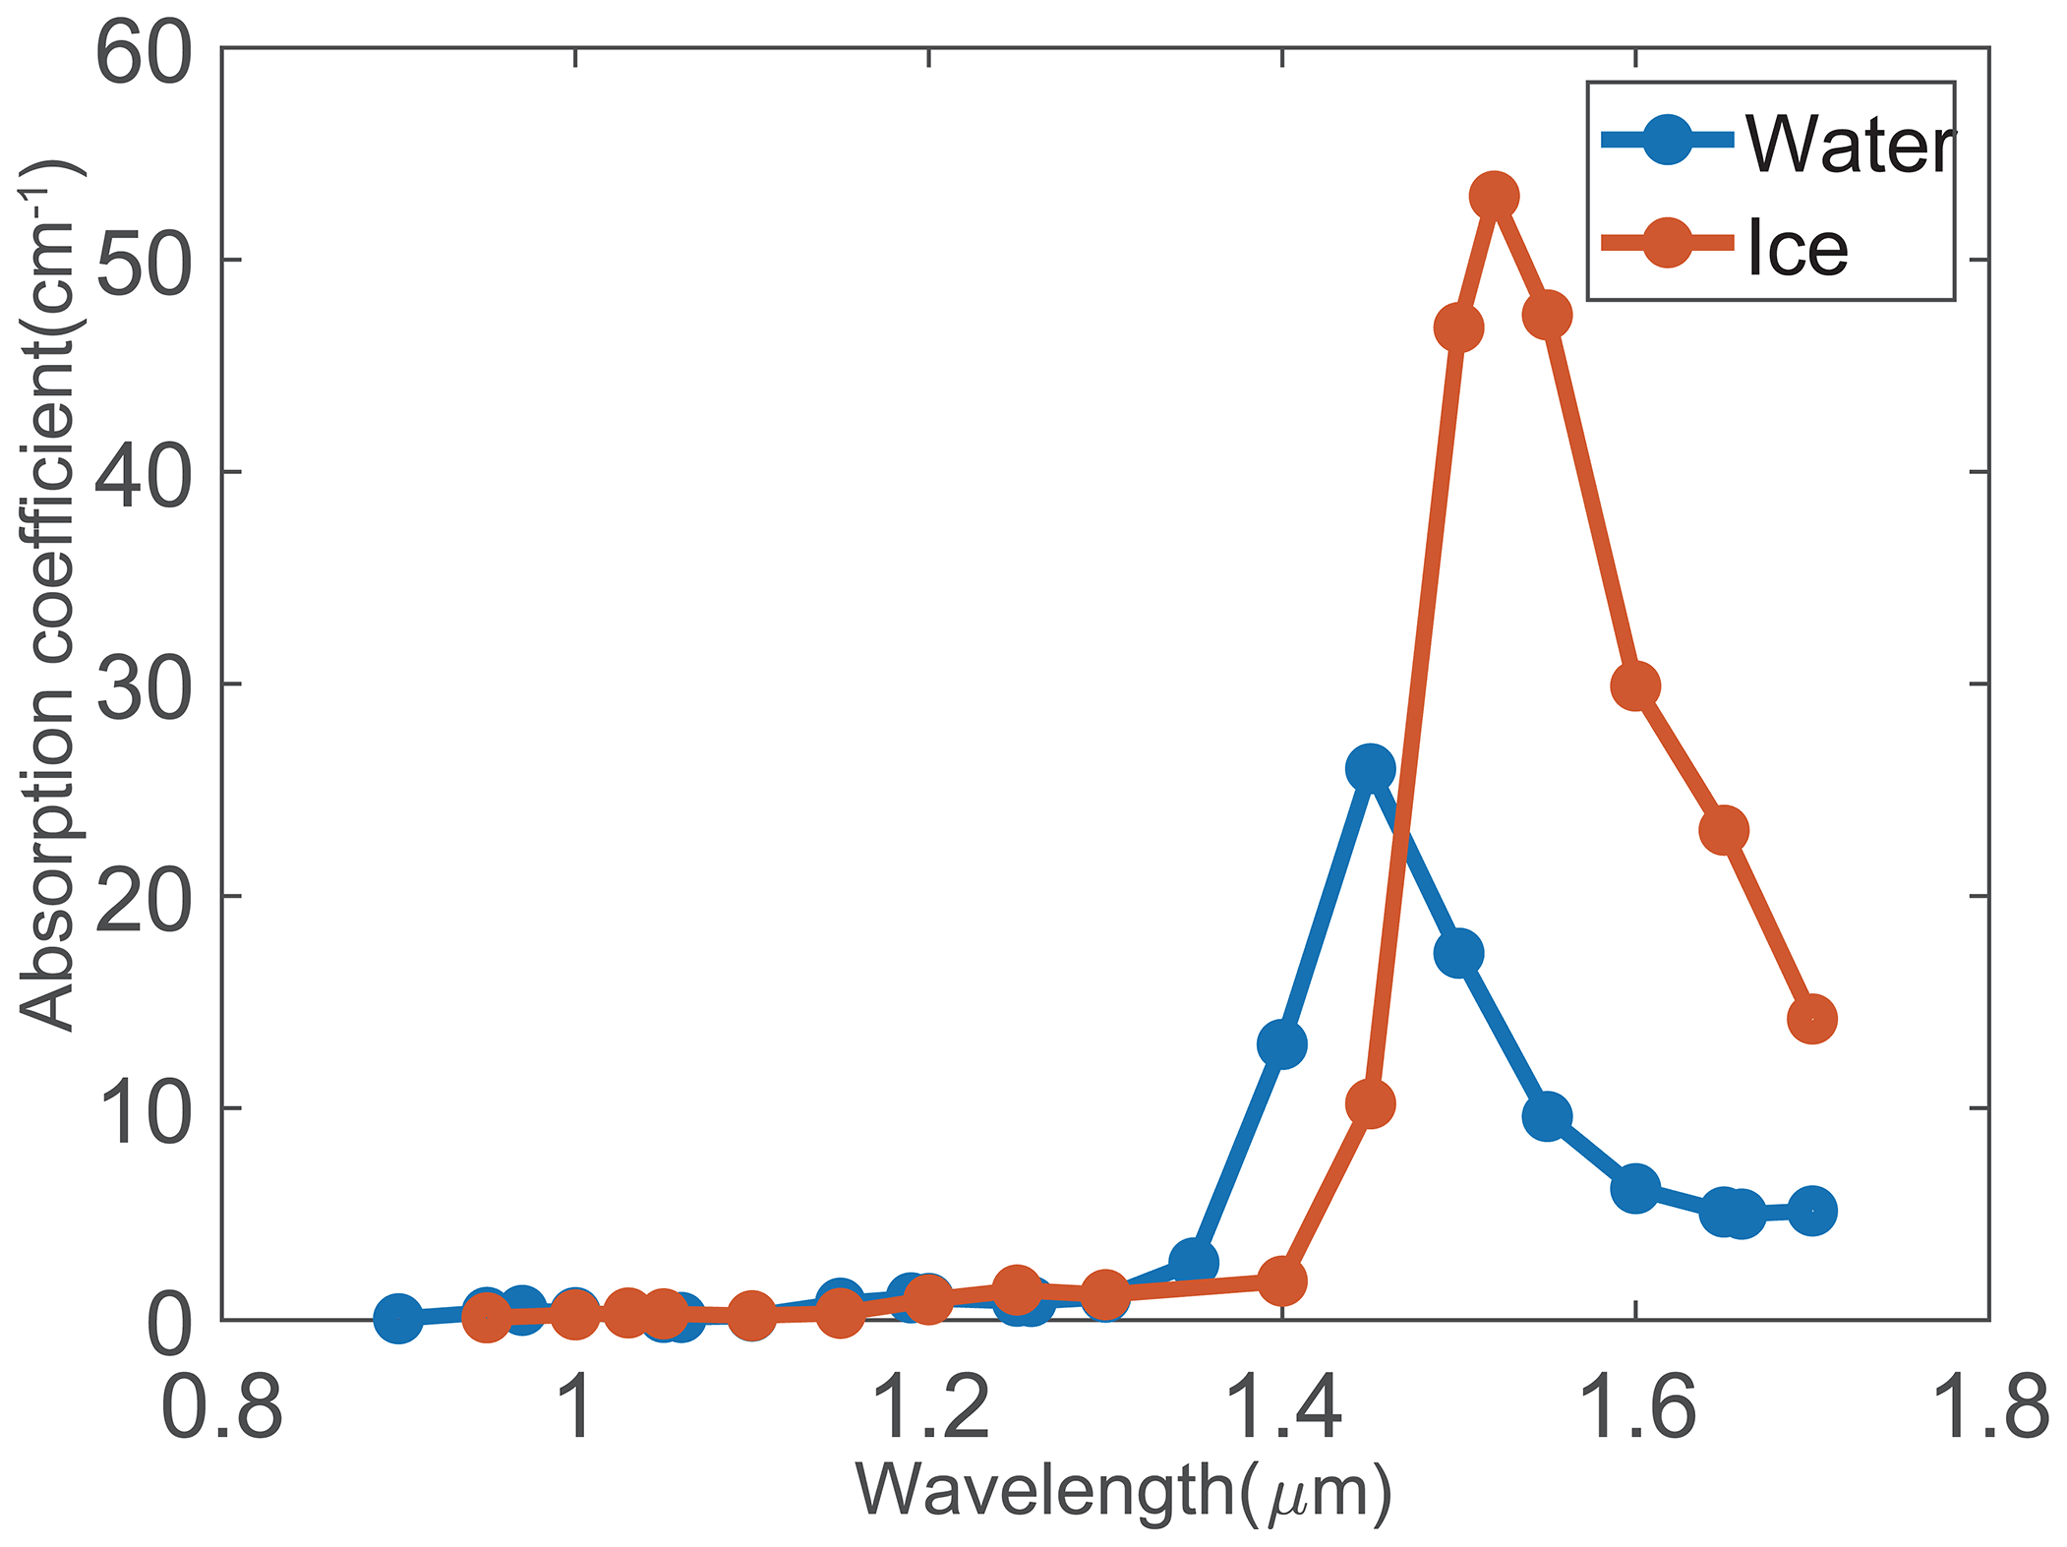
Figure 1Absorption coefficient of ice and water according to Irvine and Pollack (1968).
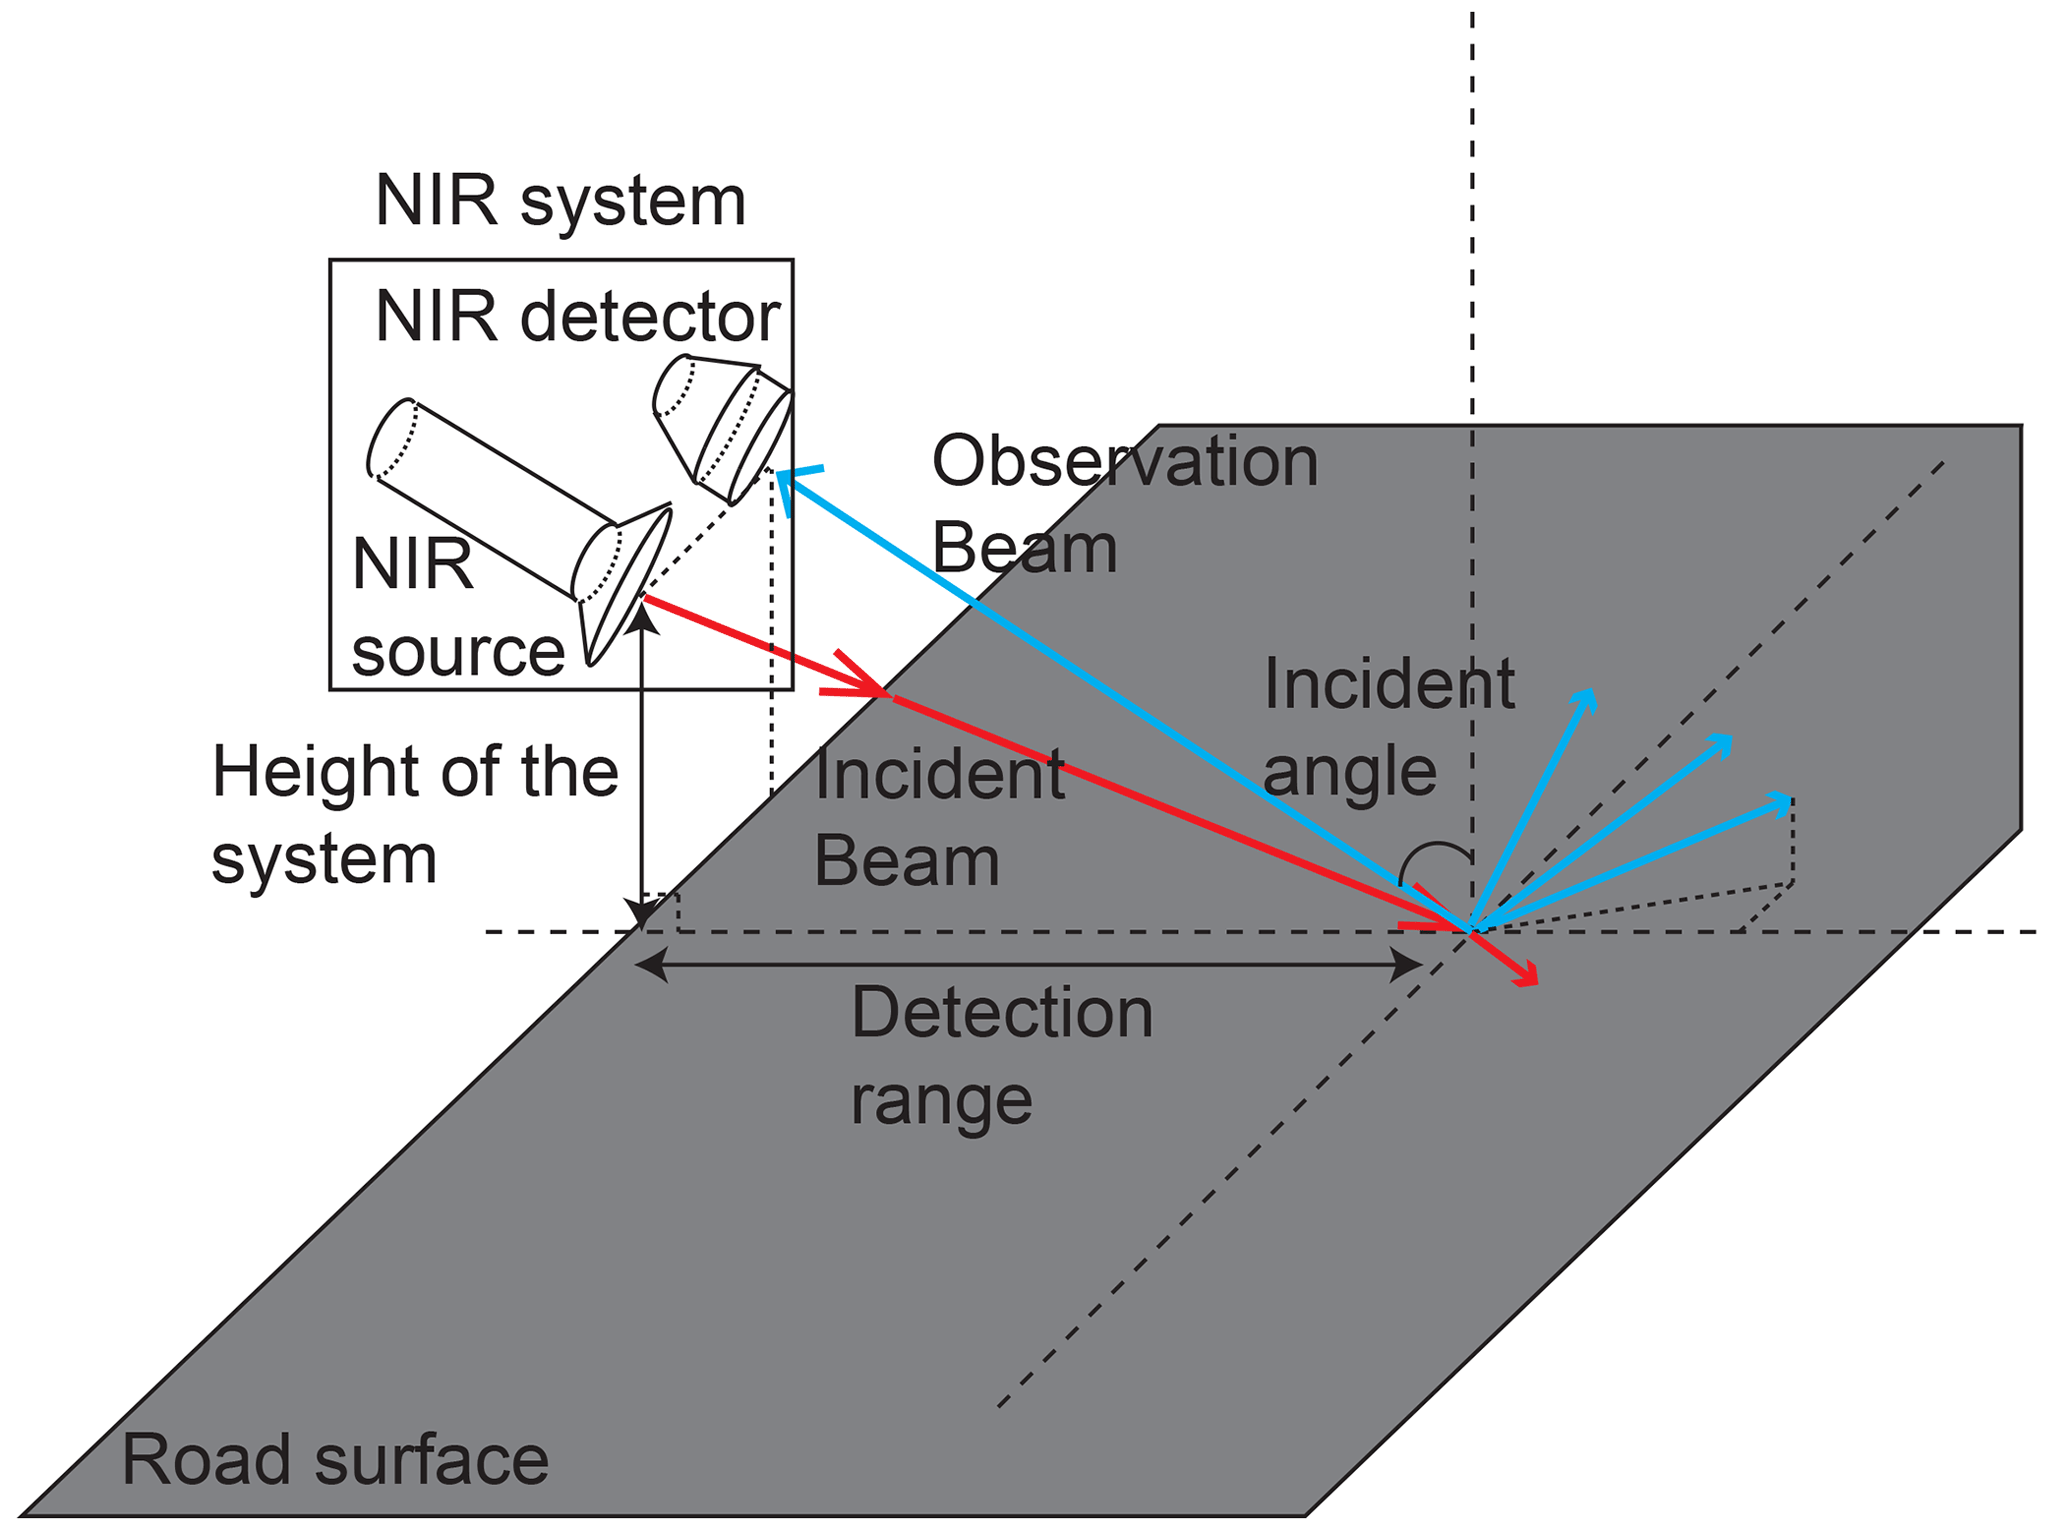
The general configuration of the NIR system dedicated to the recognition of road surface conditions is shown in Fig. 2. It is composed of an NIR source and an NIR detector. The source illuminates the surface for which the road condition has to be detected. In this work, the zenith angles of the incident and observation beams are the same.
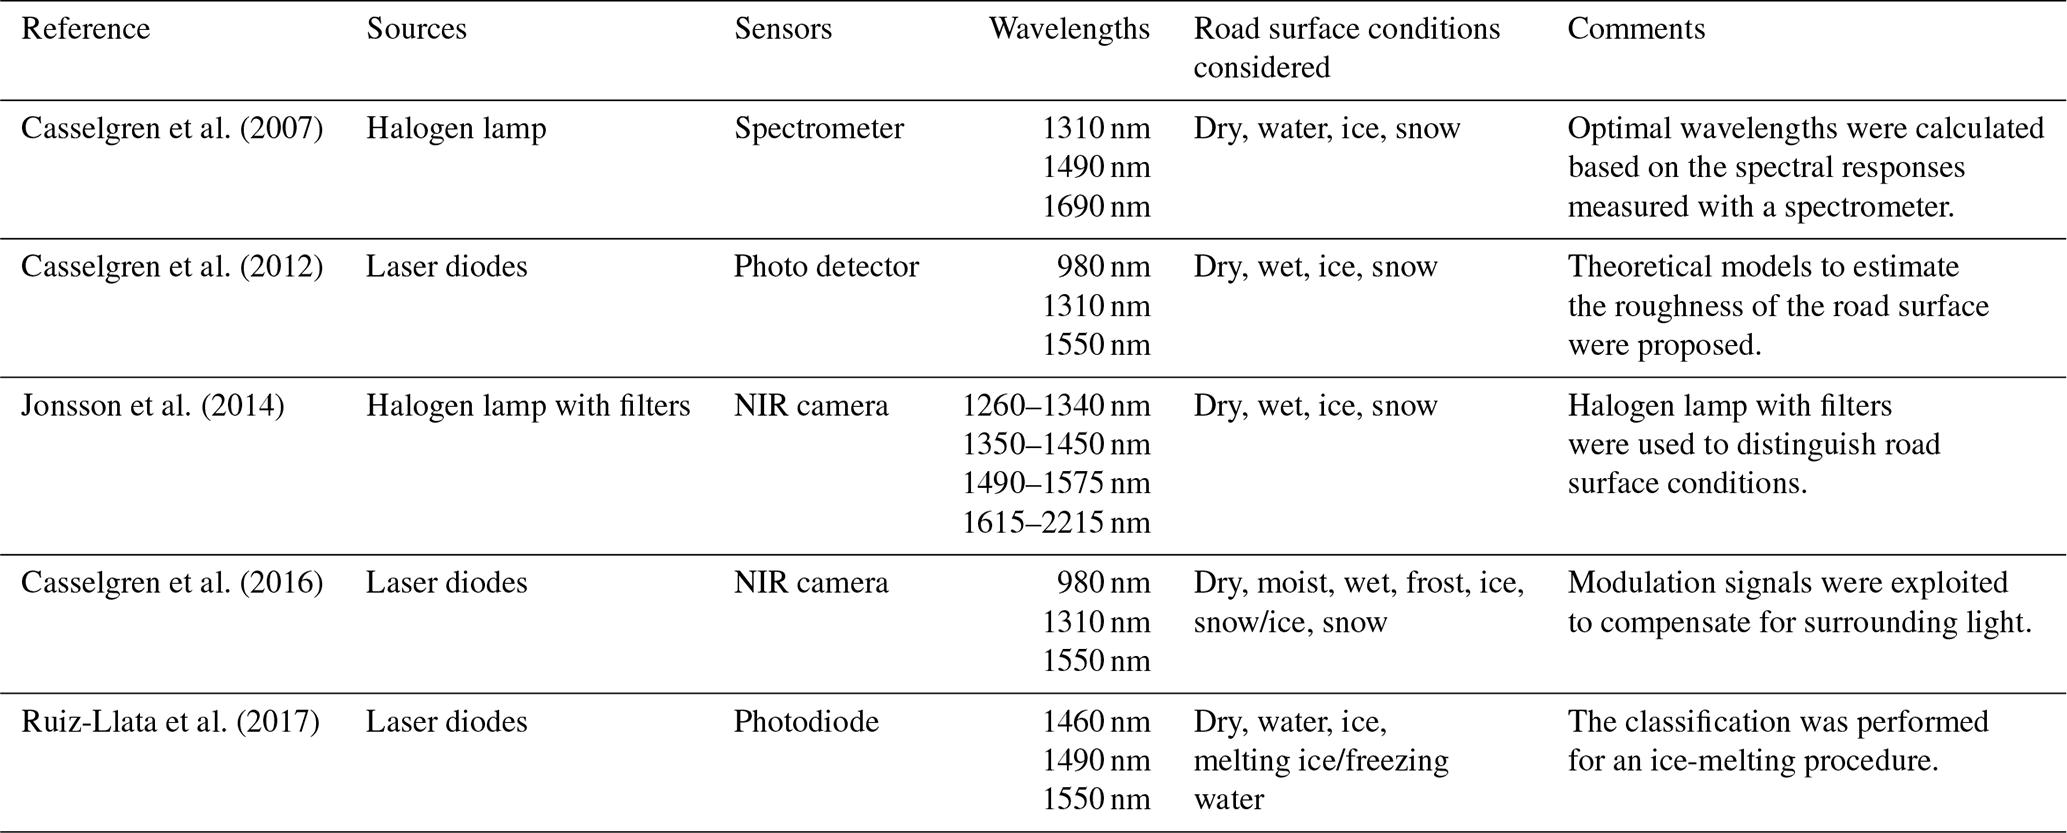
Hence, Casselgren et al. (2007, 2012, 2016), Jonsson et al. (2014) and Ruiz-Llata et al. (2017) demonstrated that by analyzing ratios based on the amplitude of backscattering signals at different wavelengths, different road surface conditions could be discriminated. Furthermore, it was shown by Casselgren et al. (2007) that at least three different wavelengths in the 900–1700 nm band are required. As can be seen in Table 1, the NIR recognition of different road surface conditions was successfully achieved using different wavelength combinations (Casselgren et al., 2007, 2012, 2016; Jonsson et al., 2014; Ruiz-Llata et al., 2017). For the best classification performance of dry, water, ice and snow conditions, the wavelengths of the NIR sources were calculated and found to be at 1310, 1490 and 1690 nm, in Casselgren et al. (2007).
Casselgren et al. (2007)Casselgren et al. (2012)Jonsson et al. (2014)Casselgren et al. (2016)Ruiz-Llata et al. (2017)Table 1Characteristics of the NIR systems described in the references.
To implement this NIR backscattering technique, laser diodes or halogen lamps with filters were used as the illumination sources and an NIR camera or NIR photodiodes were used as the detectors in previous works (Casselgren et al., 2012; Jonsson et al., 2014; Ruiz-Llata et al., 2017). Halogen lamps have the advantages of high power and low cost, but they have the disadvantages of short lifetime, low efficiency and generating large amounts of heat. Furthermore, a fatal point of halogen lamps in such systems is that they are not suitable for modulation because of the reduced lifetime (Cho and Kim, 2011). Yet, the modulation of the signals is necessary to compensate for the ambient light (Casselgren et al., 2016). Considering these limitations, the halogen lamp is not an appropriate source for this system. On the other hand, laser diodes have the advantages of high power and they can operate under very high modulation frequency. However, the cost of laser diodes should be taken into consideration for commercial AVs. In addition, according to Ott (1996), laser diodes are more sensitive to temperature compared with other light sources such as LEDs. Furthermore, the cases of large incident angles were not investigated in previous works. The incident angle of the NIR source is a core parameter that will determine the detection range. As far as we know, the maximum incident angle assessed in the literature is 70∘(Casselgren et al., 2007), which would correspond to a detection range of 0.9 m with an NIR system placed at a height of 0.7 m above the road surface, whereas a detection range of 40 m would correspond to an incident angle of 89∘ in such a configuration. Yet, in large incident angles, the amplitudes of the backscattering signals from the smooth surface and rough surface might differ greatly. According to Fresnel equations, the larger the incident angle, the larger the reflectance. Therefore, in large incident angles, specular reflection will dominate for smooth surfaces and the backscattering light will hence be greatly weakened, while the rough surface can still scatter light back.
With the development of LED sources, today LEDs are increasingly applied to vehicles. In this paper, we propose replacing laser diodes by LEDs in NIR backscattering systems dedicated to the recognition of road surface conditions to allow for a larger detection area. LEDs can indeed illuminate a larger area compared with laser diodes. However, the possible setback with LED sources compared with laser diodes could lie in the larger spectral bandwidth. Yet, as far as we know, the NIR backscattering technique has been investigated using a tri-wavelength source (three laser diodes), for which the appropriate wavelength combination was calculated using the monochromatic assumption of each of the three sources (Casselgren et al., 2007). We hence propose to investigate the effect of the spectral bandwidth of the LED sources and assess whether LED sources can be used in NIR backscattered light systems without impairing the performance of the recognition of the road surface conditions. To this end, we first investigate the spectral response of an asphalt sample under NIR illumination with five road surface conditions: dry, wet, water, snow and ice. Based on these spectral measurements, we propose a classification method to enable the recognition of the assessed road surface conditions. We then aim to determine the appropriate wavelength combination of the tri-wavelength LED source to address the best performance of the road surface conditions classification, by taking into account the specific spectra of the LEDs. Since the LED spectra are broader than those of laser diodes, we also investigate the influence of the spectral bandwidth on the classification performance. Furthermore, we test the designed system composed of a tri-wavelength LED source and an NIR camera under the different road surface conditions assessed in the laboratory. Additionally, in this work all experiments are conducted under large incident angles to assess the behavior of the system for a long detection range.
The paper is organized as follows. In the first part, the NIR system and its principle are described. Then, the results of NIR spectral measurements of an asphalt sample are given and a classification method is proposed. Third, the appropriate wavelength combination of the tri-wavelength LED source is determined using the results of spectral measurements. Fourth, the influence of the spectral bandwidth on the classification performance is investigated. Then, the designed system is tested with an NIR camera in the laboratory and results are presented on the feasibility of such a system to recognize the different road surface conditions under consideration here. Finally, the results of this work are discussed and conclusions are given.
In order to determine the wavelength combination, spectral measurements are first made. For the spectral measurements, the wavelength combination of three LED sources is then calculated and the full width at half maximum (FWHM) of the LEDs is investigated as a parameter in the selection of the wavelength combination.

Figure 3(a) Picture of the experimental setup. (b) Top view sketch of experimental setup. The square represents the position of the spectrometer detector. The circles represent the different positions of the halogen lamp which were tested. For example, the configuration of (a) is equivalent to the case for which the source is positioned on the red circle.
2.1 Spectral measurements
In the characterization of the spectral response of an asphalt sample under NIR illumination, measurements were conducted using a halogen lamp as an illumination source and an NIR spectrometer (NIRQuest512 Ocean Optics with a spectral range: 900–1700 nm) as a sensor. The black-body radiation of the halogen lamp allows us to benefit from the whole spectral range of the spectrometer. The experimental setup is presented in Fig. 3a. The spectrometer was connected to an extension lens with a numerical aperture of 0.15 in order to achieve a sufficient field of view. Measurements were conducted under several configurations to ensure that the system can adapt to as many configurations as possible. These configurations were obtained by varying the illumination angle and also, the lateral position of the source compared to the detector. For this purpose, eight different distance values between the spectrometer detector and the asphalt together with five different positions of the halogen lamp compared to the spectrometer were tested, as illustrated in Fig. 3b. The distance between the spectrometer detector and the asphalt sample was made to vary from 25 to 95 cm and the detector was placed at 6 cm height above the asphalt sample. This corresponds to an incident angle varying from 76.5∘ to 86.5∘. Five road surface conditions were investigated: dry asphalt, wet asphalt and asphalt covered with water, ice or snow (Fig. 4). A plastic box was used to contain the asphalt in order to create ice and water surface conditions. The depths of ice and water were around 1 cm. Snow was artificially made using a refrigerator. Since the snow melted quickly in the laboratory environment, the experiment was conducted for only three distance values to ensure that the asphalt could still be considered under snow condition. Therefore, for the snow condition, 15 configurations were tested, whereas 40 configurations were tested for the other road surface conditions. The experiment was conducted in a dark room so that no ambient light would influence the measurements. The only illumination source was the halogen lamp.

Figure 4Images of the asphalt samples under the different conditions tested.
The average backscattering spectra measured are presented in Fig. 5. It was found that the spectral shapes for dry and wet asphalt are very similar, which could make it difficult to distinguish dry and wet road surface conditions. Furthermore, the amplitude of the spectrum in the snow condition below 1200 nm is very high, whereas it is quite low when above 1450 nm. As for water, the data presented here were measured at a short distance (0.25–0.35 m). Indeed, above 0.4 m, only noise could be measured. Therefore, only 10 configurations are taken into account for the water condition in the following section. In addition, for short distances, one crucial point is that the backscattering light could only be detected by the spectrometer until 1350 nm, which may be caused by the absorption of the water as shown in Fig. 1.
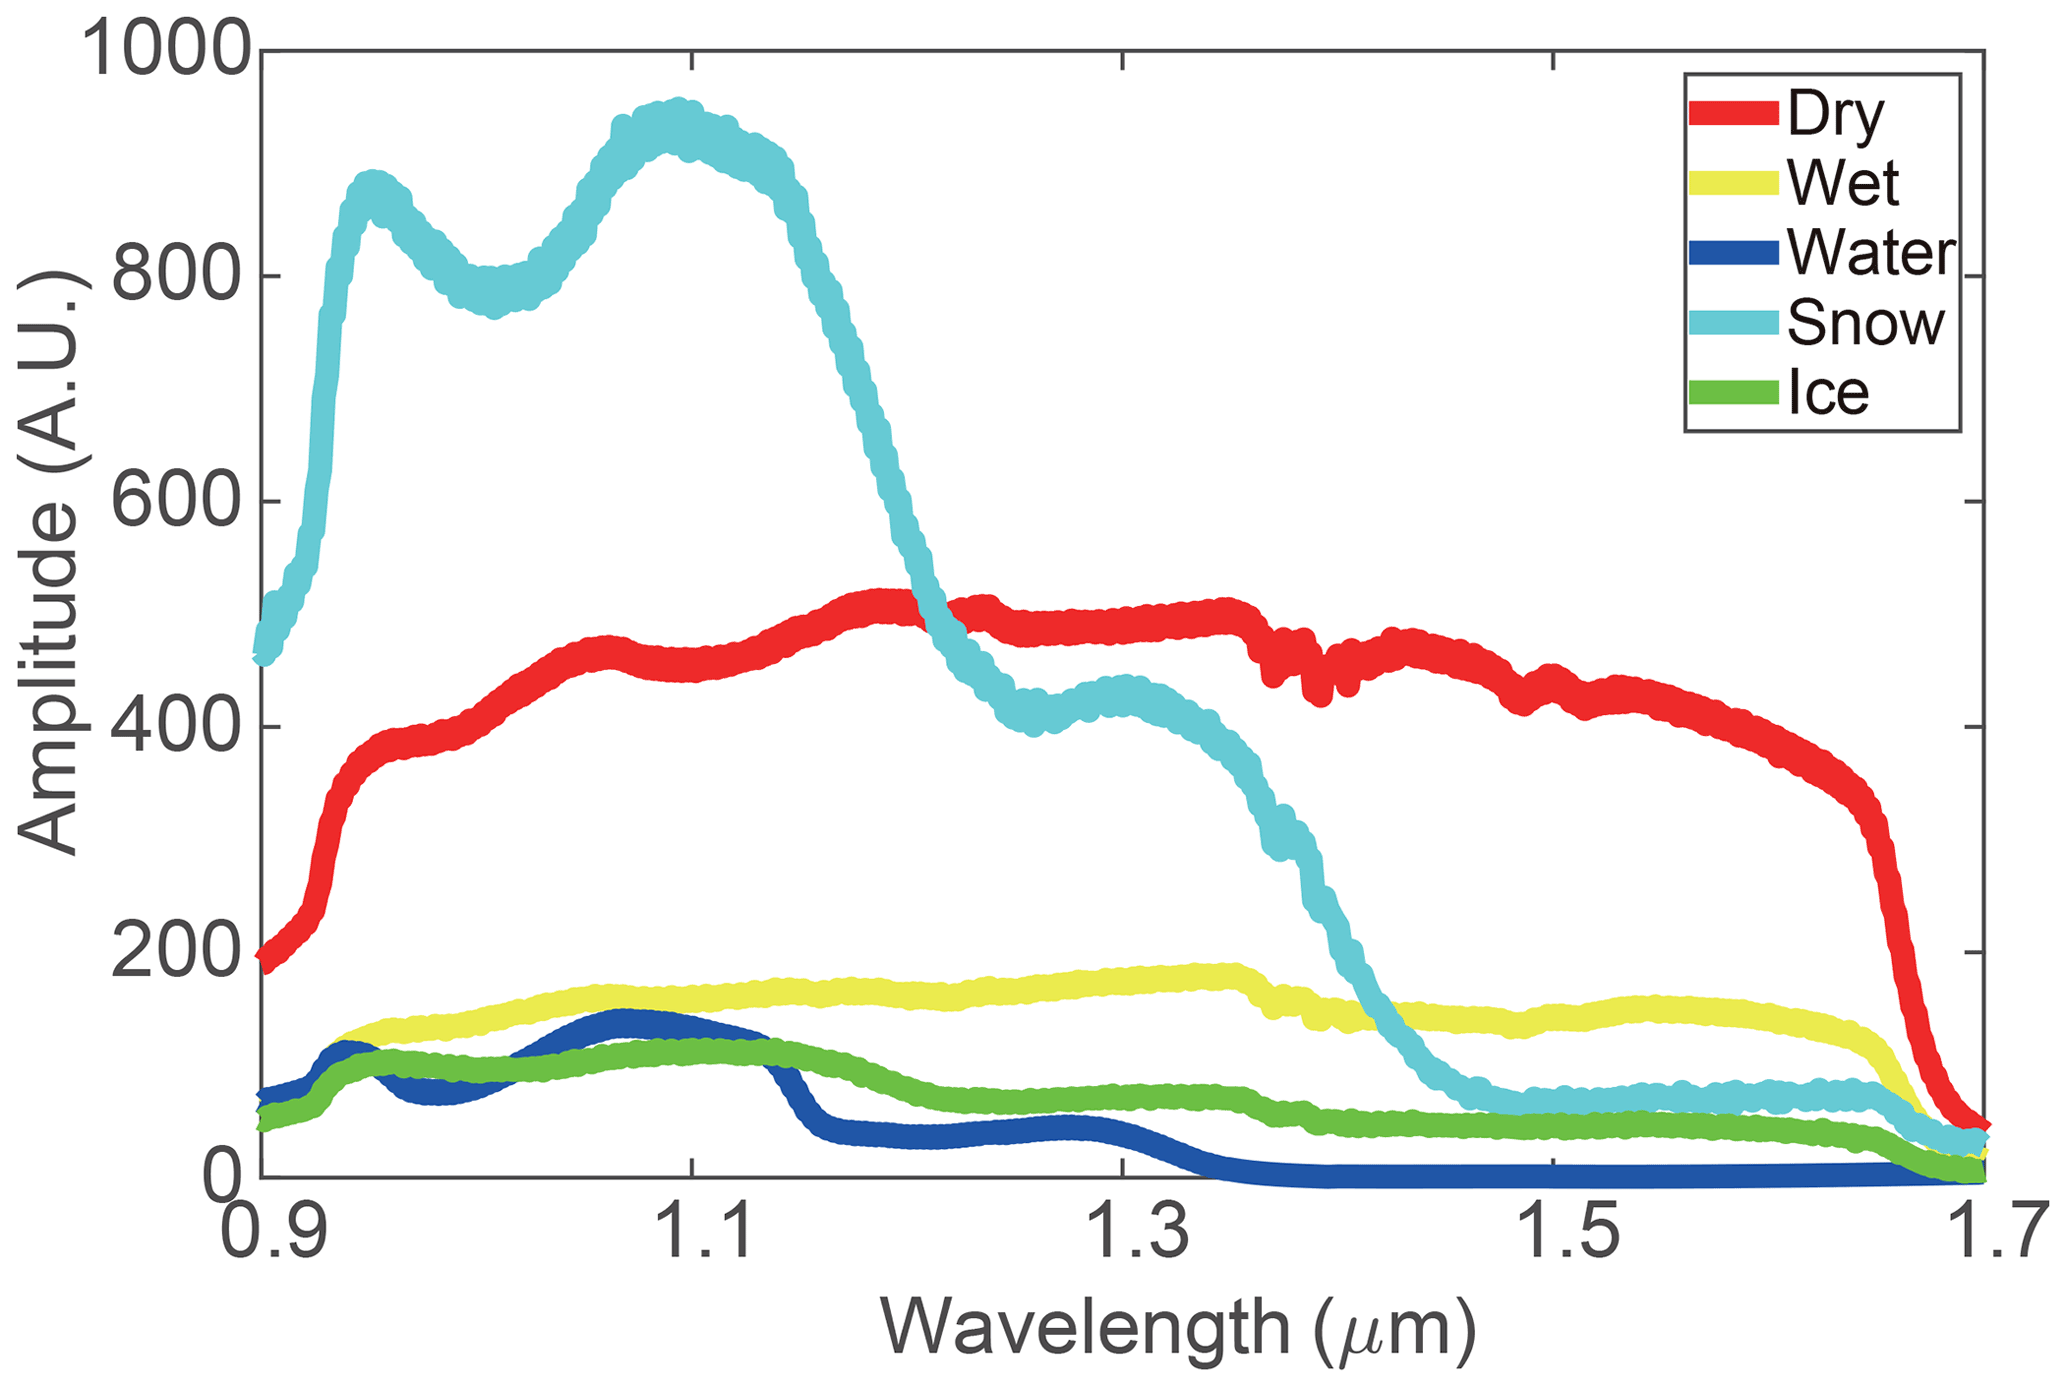
Figure 5Average backscattering spectra measured for different road surface conditions. The spectra were averaged over all tested configurations.
2.2 Classification method for the detection of road surface conditions
As already proposed by Casselgren et al. (2007), the best result of the classification is achieved by performing a two-step discrimination method. In their work, the authors first separate dry and snow from water and/or ice, and then they separate water from ice. Thus, in their work, the first step is used to separate three classes, {dry, snow, (water + ice)}, and the second step is used to separate {water, ice}.
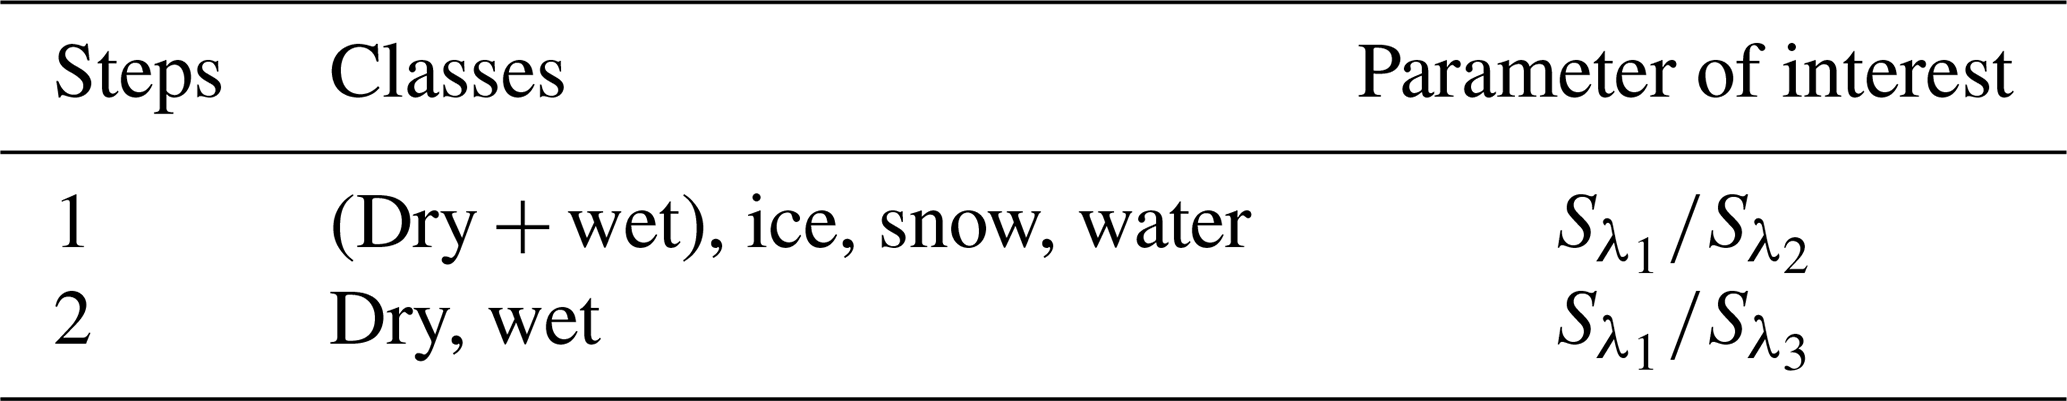
In this work, based on the measured spectra, several classification methods were tested. It was found that the best method to discriminate the five road surface conditions under consideration should rely on a two-step classification. In this two-step classification, we first have to separate ice, snow and water from dry and wet, and then to separate dry from wet, as shown in Table 2. Therefore, the classification method will consist in considering four classes in step 1, {(Dry + Wet), ice, snow, water}, and 2 classes in step 2, {dry, wet}. This result is consistent with the spectra measured for dry and wet asphalt, which were shown to be very similar in Fig. 5. In each step, the ratio of the amplitude of two backscattering signals at different wavelengths is used as the parameter to distinguish the road surface conditions, as proposed in Casselgren et al. (2007). In step 1, the ratio of interest is whereas the ratio of interest in step 2 is , where , and are respectively the amplitudes of detected signals at wavelengths λ1, λ2 and λ3. These ratios depend on the road surface conditions and thus by evaluating them and comparing them with a given threshold, the road condition can be determined.
Table 2Classification method for the detection of the road surface conditions.
2.3 Calculation of the wavelength combination of the three LED sources
As previously mentioned, the performance of the classification depends on the selected wavelengths λ1, λ2 and λ3 of the tri-wavelength source. These wavelengths to ensure the best classification of the road surface conditions of dry, ice, snow and water were calculated by Casselgren et al. (2007) using the monochromatic assumption. However, in our work, the LED sources cannot be considered as monochromatic sources. Thus, the spectral shape has to be taken into account and the spectral bandwidth will be considered as a parameter of the calculations, using the FWHM. The LED spectral shape will be modeled as a normal distribution with center wavelength varying from 900 to 1700 nm and with an FWHM of 80 nm. Considering the spectra of the LEDs, the backscattering signals , and which would be received by the NIR sensor can be calculated by the integration of the product of the spectral response measured with the spectrometer and the LED spectra:
where is the normalized emitted spectrum of the LED with central wavelength at λi, Sspectro is the measured spectral response of the asphalt, and is the signal which would be received by an NIR sensor under the illumination of the LED at a central wavelength of λi. The ratio is then calculated to be used in step 1 to distinguish {(dry + wet), water, ice, snow}, and the ratio is calculated to distinguish {dry, wet} in step 2.
For each road condition, we have a set of 40 values for and , except for the snow and water conditions for which only 15 and 10 configurations were respectively tested. The sets of values for are used for step 1 and are labeled as , , , , . The sets of values for are used for step 2 and are labeled as , .
In step 1, the data of interest Xstep1 are , , , with
In step 2, the data of interest Xstep2 are , .
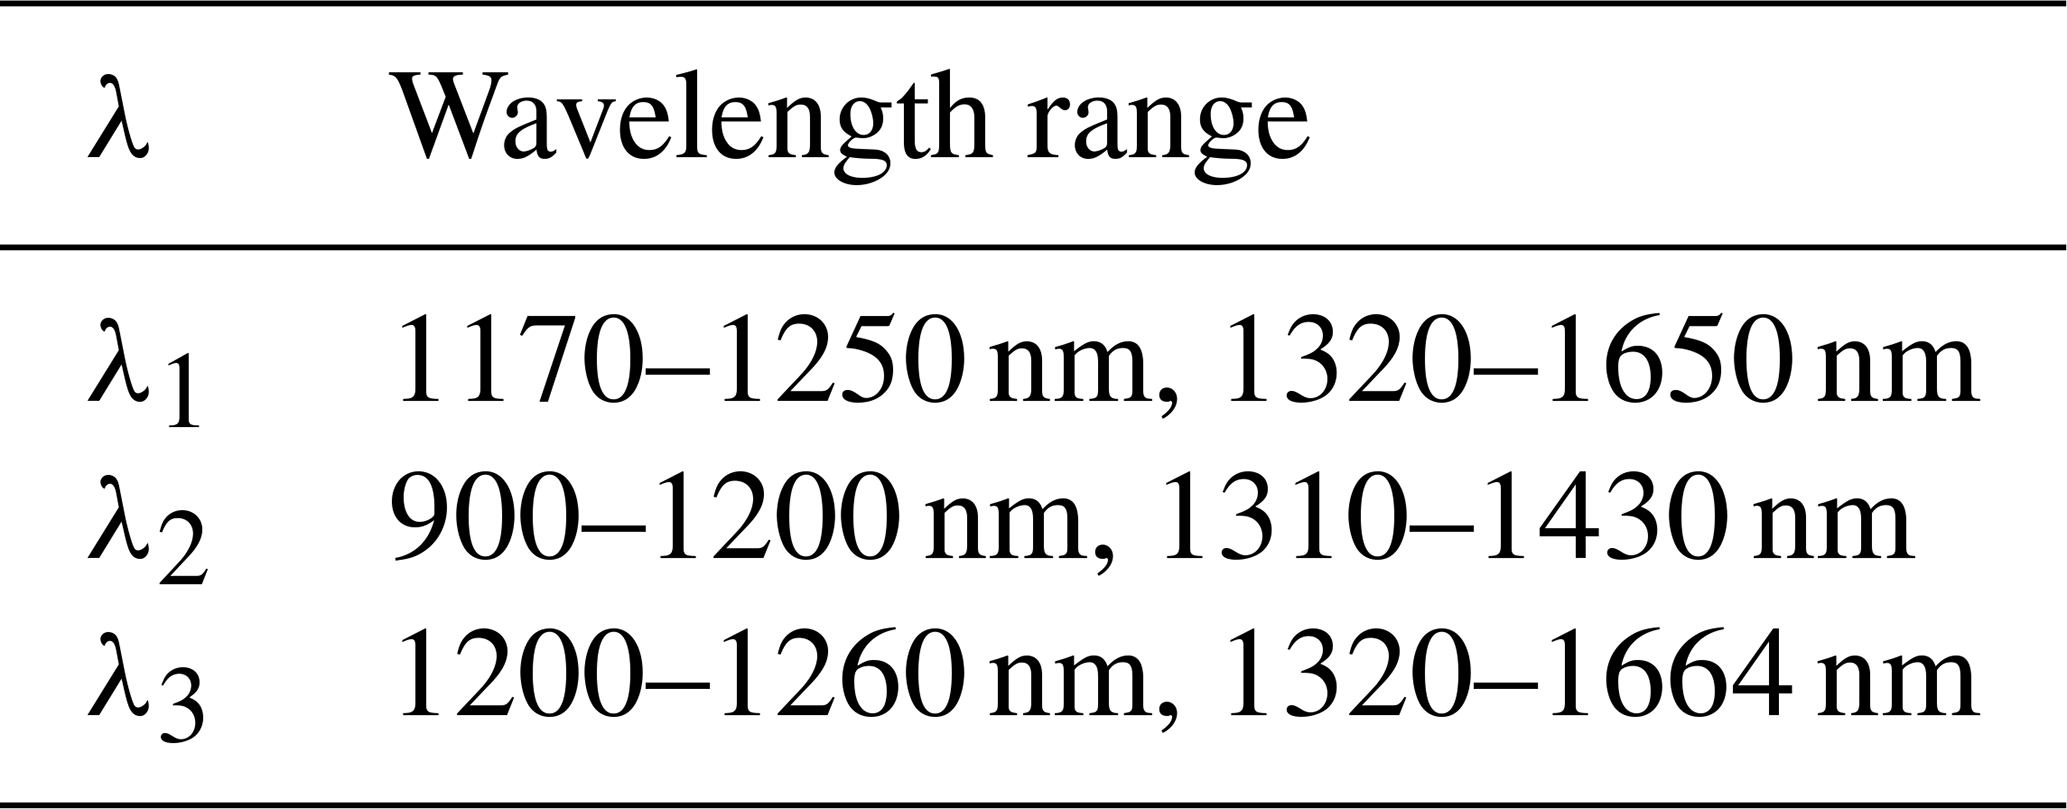
From Xstep1 (resp. Xstep2), one can build a distribution of the parameter (resp. ) for each road condition. Thus, λ1 and λ2 are searched in step 1 to make the distributions , , and have minimum overlap. In the same way, λ1 and λ3 are searched in step 2 to make the distributions and have minimum overlap. The algorithms for step 1 and step 2 to make the overlap minimum are developed and given respectively in Algorithm 1 and 2. Then intersection of the values of λ1 respectively obtained in step 1 and step 2 is computed. Finally, corresponding values of λ2 and λ3 are determined. Figure 6 shows all possible wavelength combinations for λ1, λ2 and λ3. Each wavelength combination found is marked with an “o”, which forms Fig. 6. Based on Fig. 6, the appropriate wavelength ranges enabling minimum overlaps are presented in Table 3.
Algorithm 1 for step 1
Algorithm 2 for step 2

Figure 6(a) Appropriate values of λ1 and λ2 for minimum overlap between the classes for step 1. (b) Appropriate values of λ1 and λ3 for minimum overlap between the classes for step 2.
In order to determine the center wavelengths of the LED sources among these ranges, the gaps values between the different classes are analyzed. In step 1, the gaps of interest are the gaps between the average values of , , , . In step 2, the gap of interest is the gap between the average value of and . To evaluate the classification performance, one parameter p is introduced. In each step, it is calculated for all possible wavelength combinations of Fig. 6 and is defined as the minimum value between the calculated gap values. In step 1, since four classes are distinguished, there are three gaps between the different distributions. Thus, the parameter pstep1 is the minimum value among these three gaps as Eq. (11) shows.
An illustration of the parameter p for step 1 is given in Fig. 7. In this example, dry and wet are regarded as one class. The average values of the distributions of different classes are presented as dashed lines. The parameter pstep1 is the gap between water and snow, since it is the minimum gap among the three gaps. In step 2, the case is simpler. Only two classes, dry and wet, are distinguished. The parameter pstep2 is hence considered as the gap between the two distributions of dry and wet as Eq. (12) shows.

Figure 7Illustration of the gaps between classes in step 1 and of the parameter pstep1. In this example, pstep1 takes the value of the gap between water and snow classes.
The calculated parameters pstep1 and pstep2 are presented in Fig. 8 for different wavelengths combinations. The value of pstep2 is much lower than that of pstep1, which implies that dry and wet are more difficult to be distinguished and matches our previous observations.
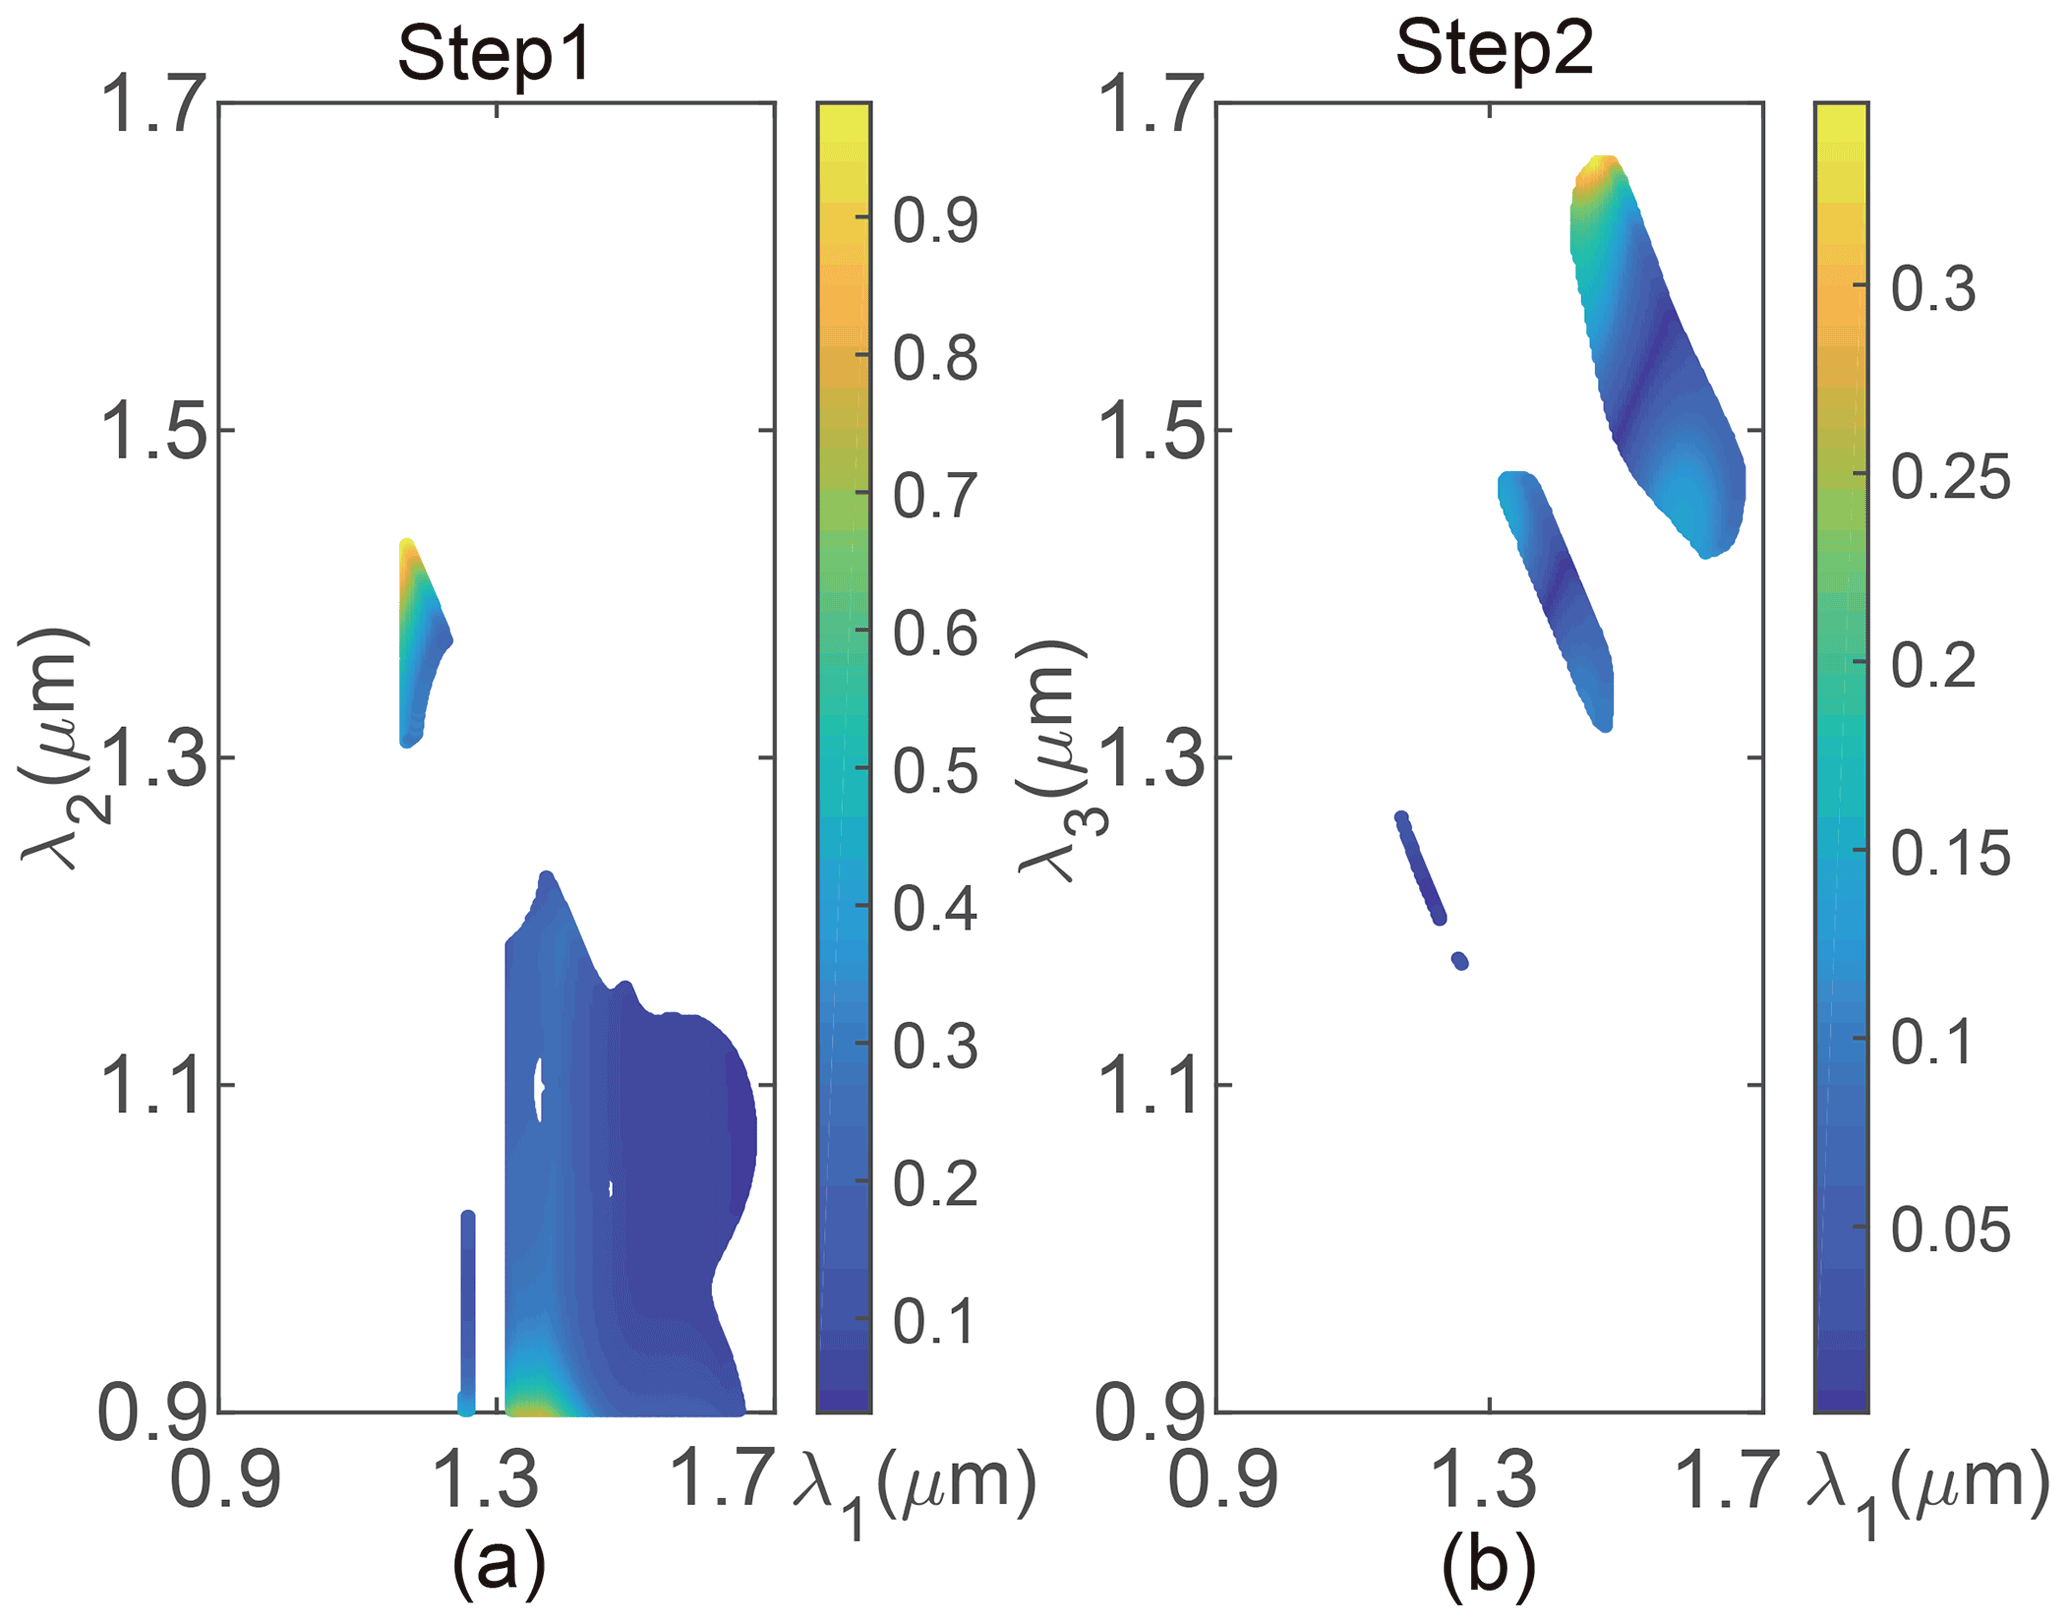
Figure 8(a) Values of parameter pstep1 as a function of λ1 and λ2. (b) Values of parameter pstep2 as a function of λ1 and λ3.
Since dry and wet are more difficult to be distinguished, λ1 and λ3 in step 2 will first be determined by maximizing parameter pstep2 in order to benefit from maximum discrimination. Then, λ2 will be determined in step 1, according to λ1. In step 2, the calculated parameter pstep2 reaches a maximum value when λ1=1457 nm and λ3=1664 nm. In order to determine λ2, λ1 is fixed at 1457 nm. It is hence found that the value of pstep1 reaches a maximum value at λ2 close to 900 nm. As a summary, the wavelengths calculated for LED sources with 80 nm FWHM are presented in Table 4.

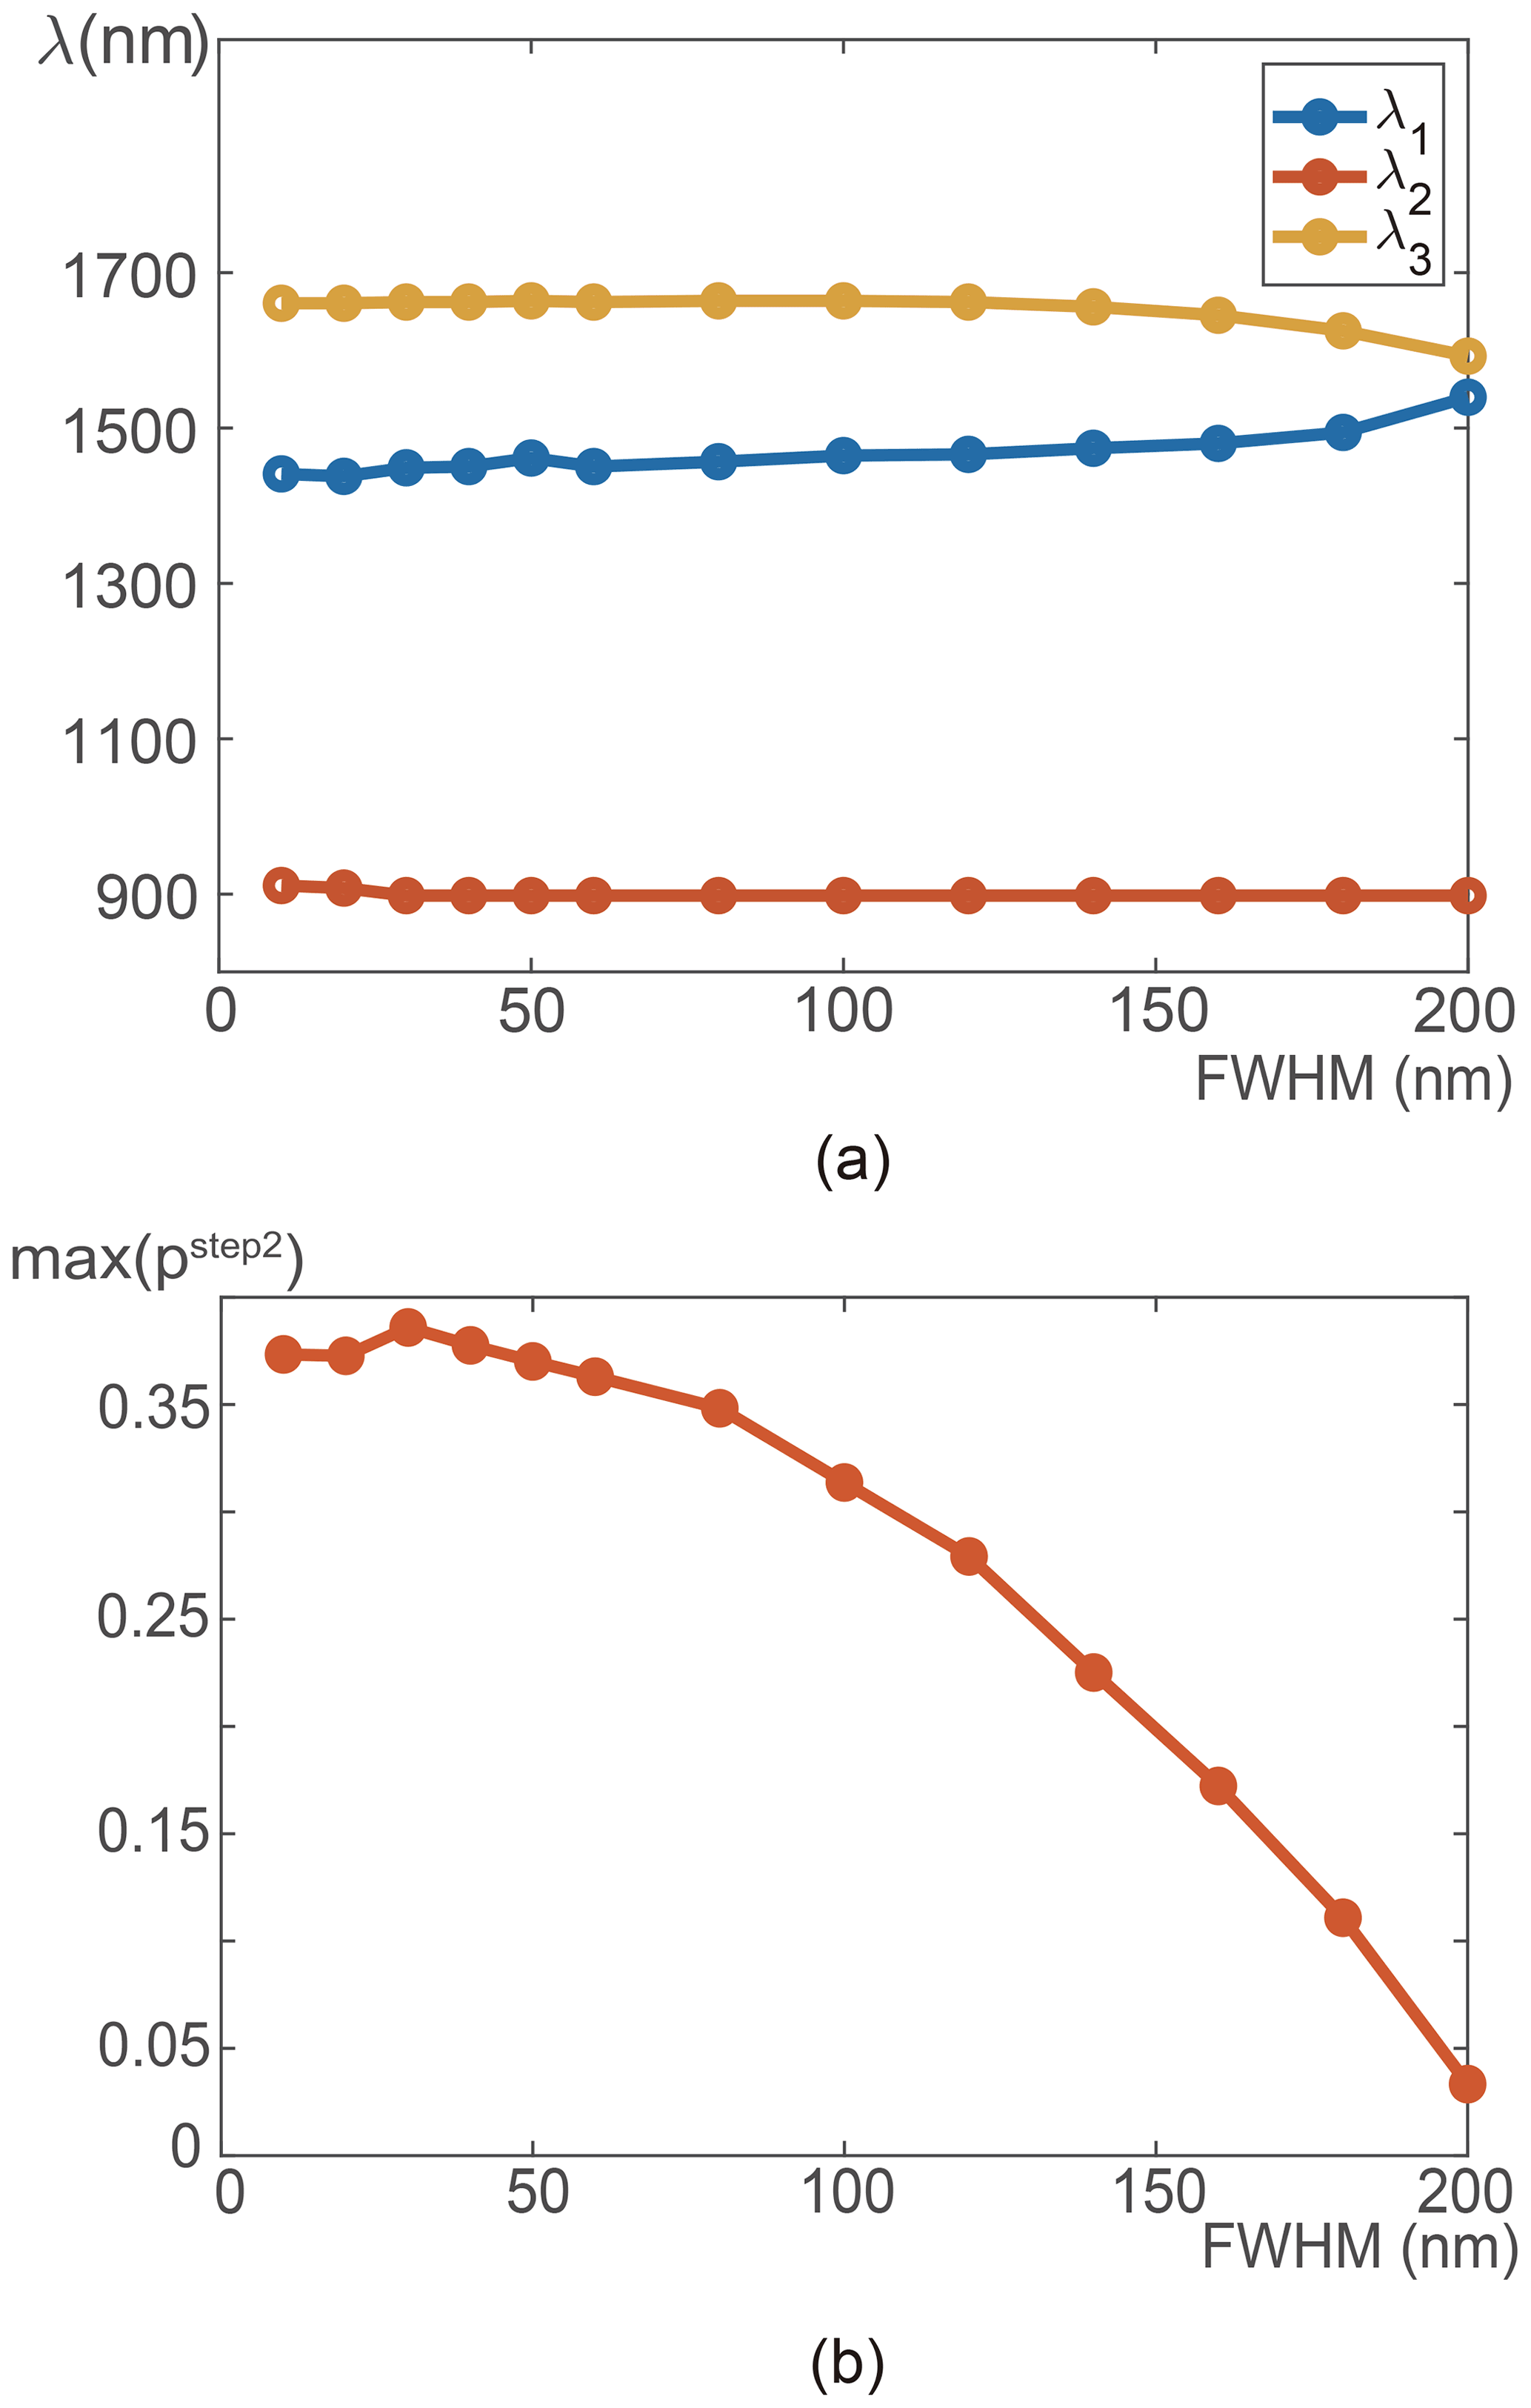
Figure 9(a) Calculated wavelengths as a function of FWHM. (b) Maximum value of pstep2 as a function of FWHM.
2.4 Influence of the bandwidth of the LED
The FWHM of the LED sources is another factor that may have an influence on the selected wavelength values and the classification result. In the previous section, the FWHM was fixed at 80 nm, which corresponds to the average FWHM of LEDs in the commercial market. In this section, the influence of the bandwidth of the LEDs is investigated. First, the selected wavelengths are calculated using different values of FWHM, in order to investigate the influence of the FWHM on the wavelength selection. Then the influence of the FWHM on the performance of the recognition is investigated based on the parameter p. Thus, through this investigation, the necessity of filters to narrow the bandwidth of LED sources is discussed.
The method to select the wavelengths is conducted as described in the previous section for a varied FWHM from 10 to 200 nm; 10 nm represents the FWHM of common laser diodes. The obtained wavelengths λ1, λ2, λ3 are presented as a function of the FWHM in Fig. 9a. One can see from the figure that below 180 nm, the values of calculated wavelengths do not fluctuate much. For a 10 nm FWHM, the wavelengths calculated are 911, 1441 and 1661 nm, which are very close to the wavelengths determined for an 80 nm FWHM. However, for a 200 nm FWHM, the shift of the wavelengths of λ1 and λ3 becomes larger. Indeed, for this FWHM value, the wavelengths are 900, 1540 and 1593 nm.
In order to further investigate the influence of the FWHM on the performance of the classification, the parameter p is exploited. Since the value of pstep2 is smaller than that of pstep1, it will be taken into consideration and the maximum value of pstep2 is taken as the critical parameter of interest and calculated as a function of the FWHM.
The maximum value for pstep2 is presented as a function of the FWHM from 10 to 200 nm in Fig. 9b. From this figure, one can see that the trend of max(pstep2) decreases with the increase of FWHM. When the FWHM is near 200 nm, the gap is almost non-existent, which will greatly impair the classification result. In addition, the maximum value of pstep2 decreases slowly at low FWHM and decreases faster after FWHM = 80 nm. This indicates that for an FWHM higher than 80 nm, the gap of the two classes is quickly narrowed, which will undermine the accuracy of the classification. It can be found that pstep2 at FWHM = 80 nm is comparable to pstep2 at FWHM = 10 nm. The classification performance at FWHM = 80 nm is thus comparable to that for FWHM = 10 nm. Since the FWHM of the commercial NIR LEDs (resp. laser diodes) is around 80 nm (resp. 10 nm), it can be expected that the classification performance with commercial LED sources is comparable to that with laser diodes. There is hence no need to add filters to narrow the spectral bandwidth of LEDs, and the use of LEDs instead of laser diodes can be feasible and the detection result will not be weakened.
Based on the calculation of the wavelength combinations, an experimental validation is carried out using three LED sources and an NIR camera. The data collected are then processed and the accuracy of the classification is given.
3.1 Description of the experimental setup
In Table 4, the selected wavelength combination for LED sources was shown to be at λ1=1457 nm, λ2=900 nm and λ3=1664 nm. However, considering the commercial market, LEDs at 1457 and 1664 nm are not available. As an alternative, a combination of LEDs at λ1=1450 nm, λ2=970 nm and λ3=1550 nm was used to set up the NIR system. First, histograms of and were calculated using spectral measurements to assess the capacity of this wavelength combination to achieve a good classification performance. The obtained histogram of for the five road surface conditions (step 1) is presented in Fig. 10a, whereas that of for dry and wet road surface conditions (step 2) is presented in Fig. 10b. As shown in these figures, there is sufficient gap between the different classes to enable the recognition of the different road surface conditions. Therefore, the road surface conditions can be distinguished well using this wavelength combination.
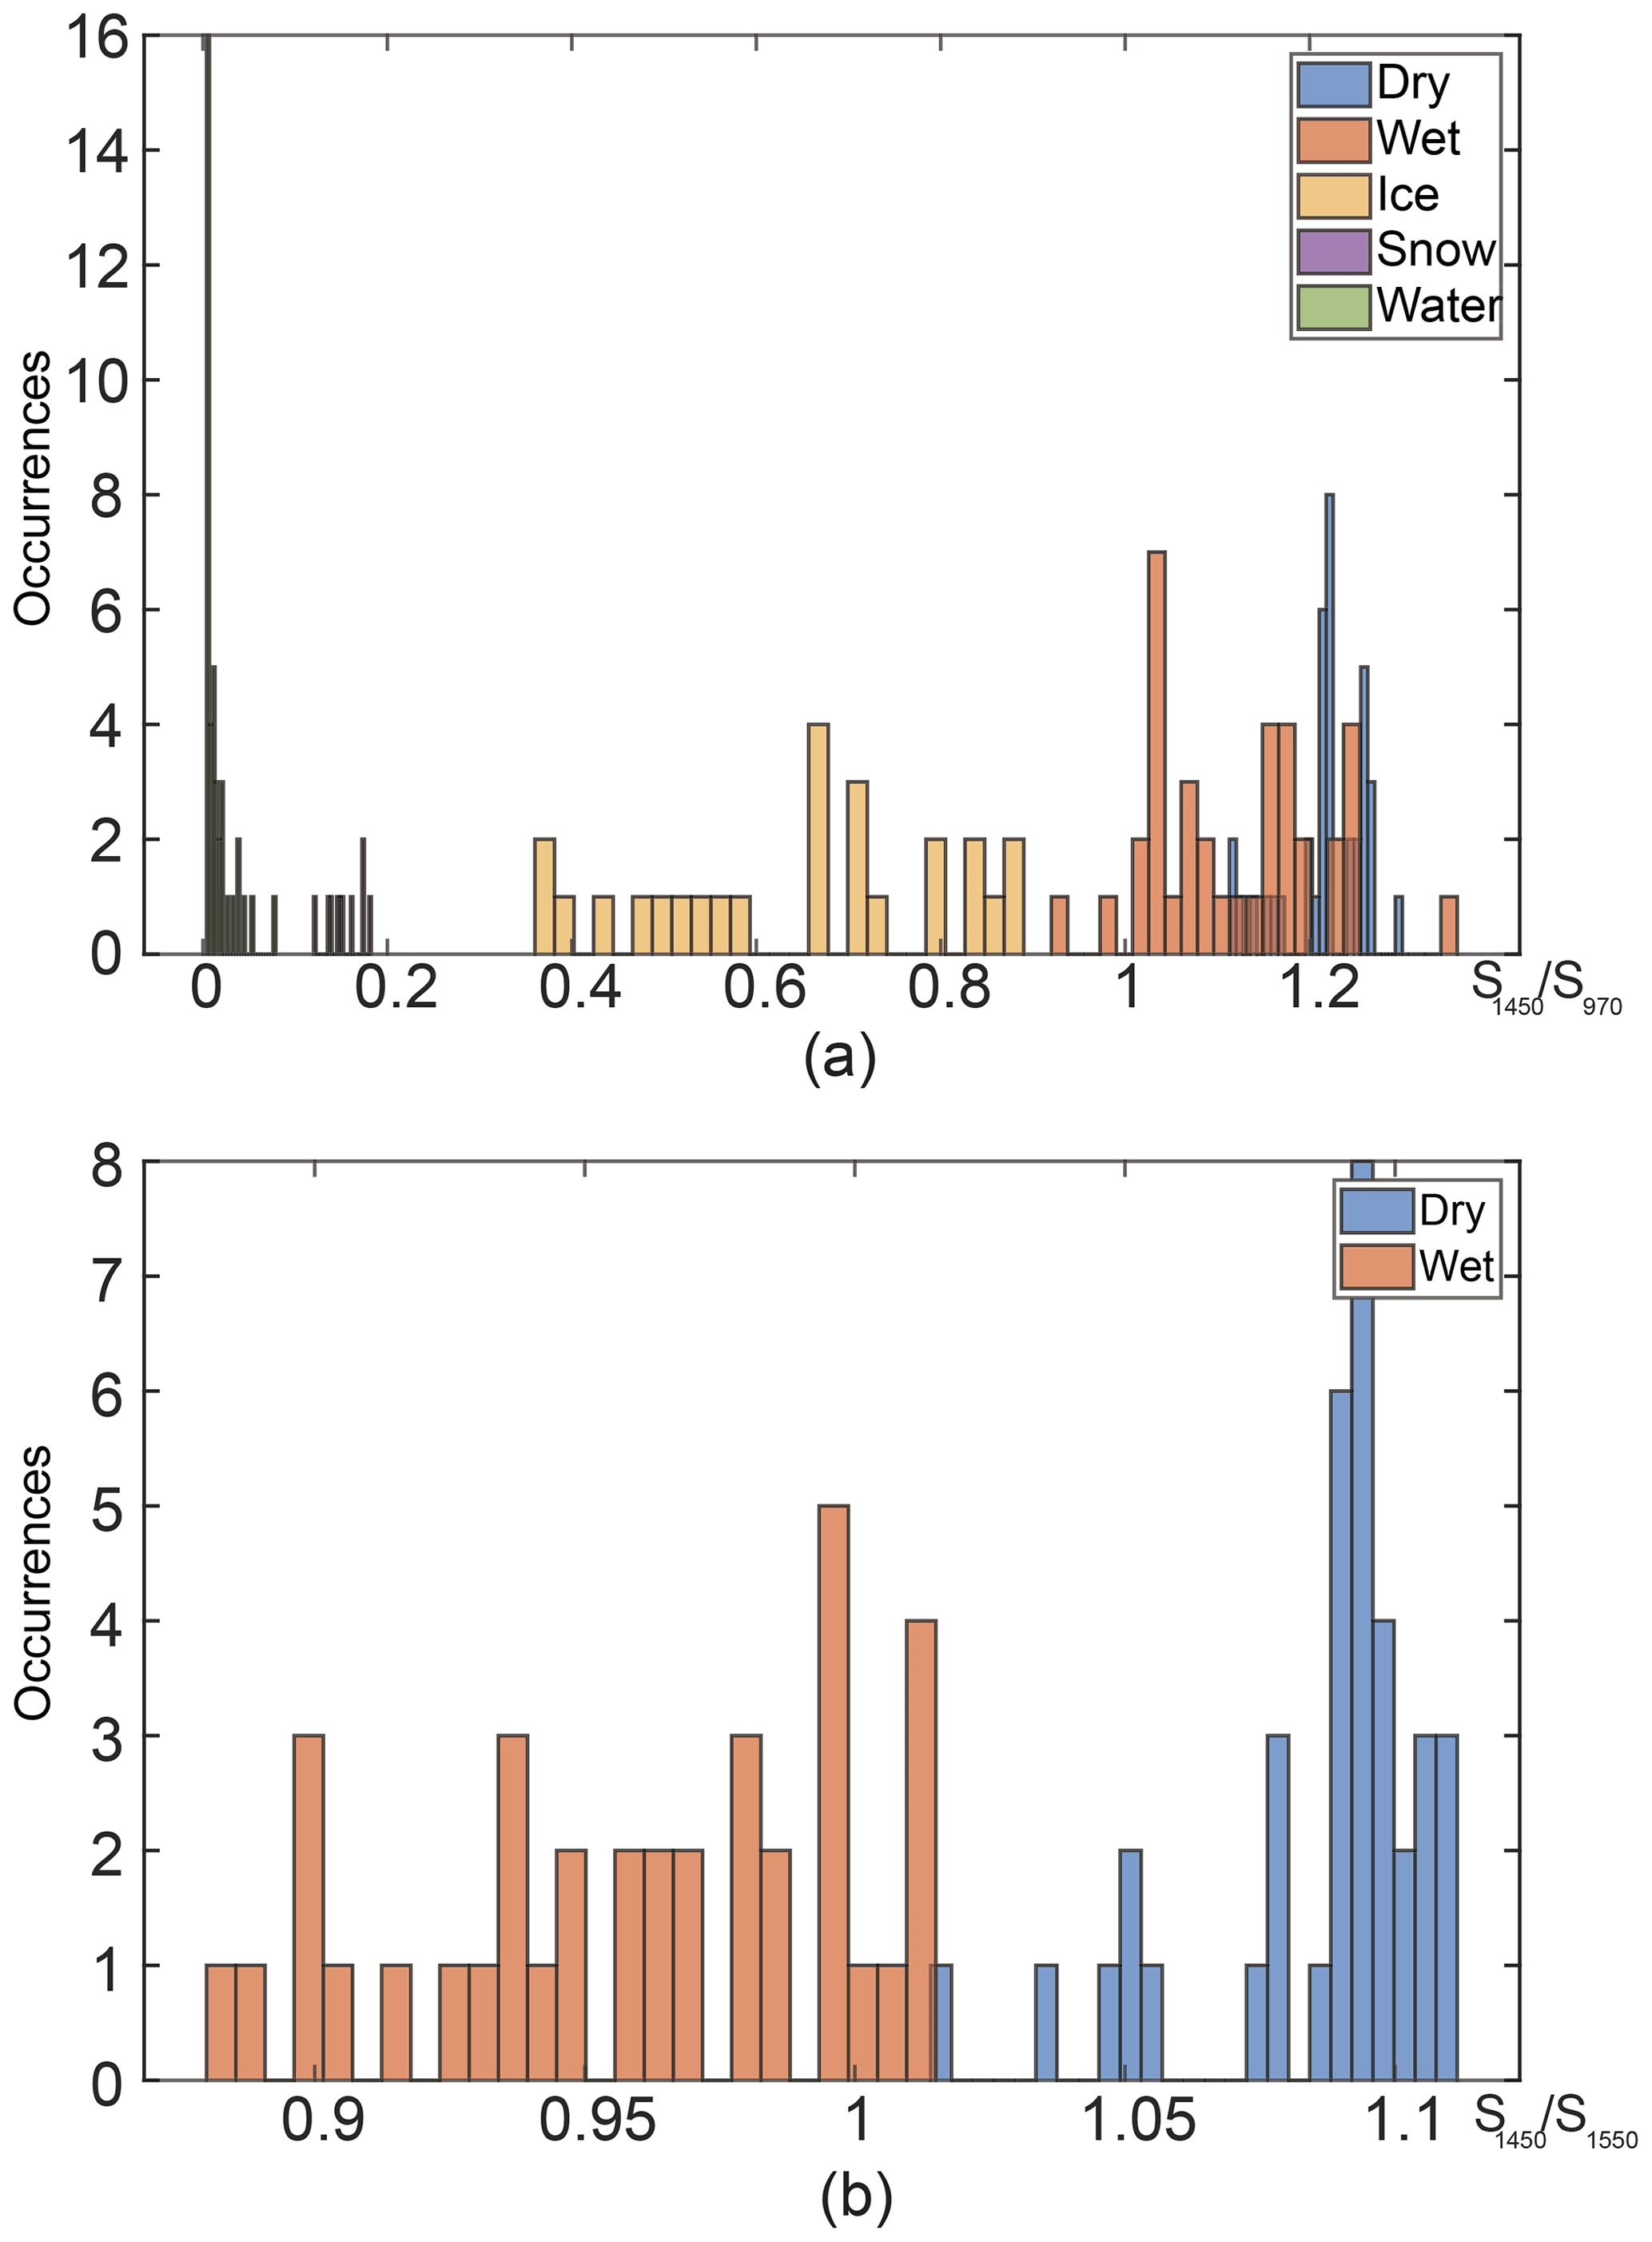
Figure 10(a) Histogram of of dry, wet, ice, snow and water conditions with λ1=1450 nm and λ2=970 nm. (b) Histogram of of dry and wet conditions with λ1=1450 nm and λ3=1550 nm.
The experimental setup to test the designed NIR system is presented in Fig. 11. The NIR source was built by using alternatively three LEDs at 970, 1450 and 1550 nm. As for the NIR sensor, a Raptor NIR camera was selected. The characteristics of this camera are shown in Table 5.
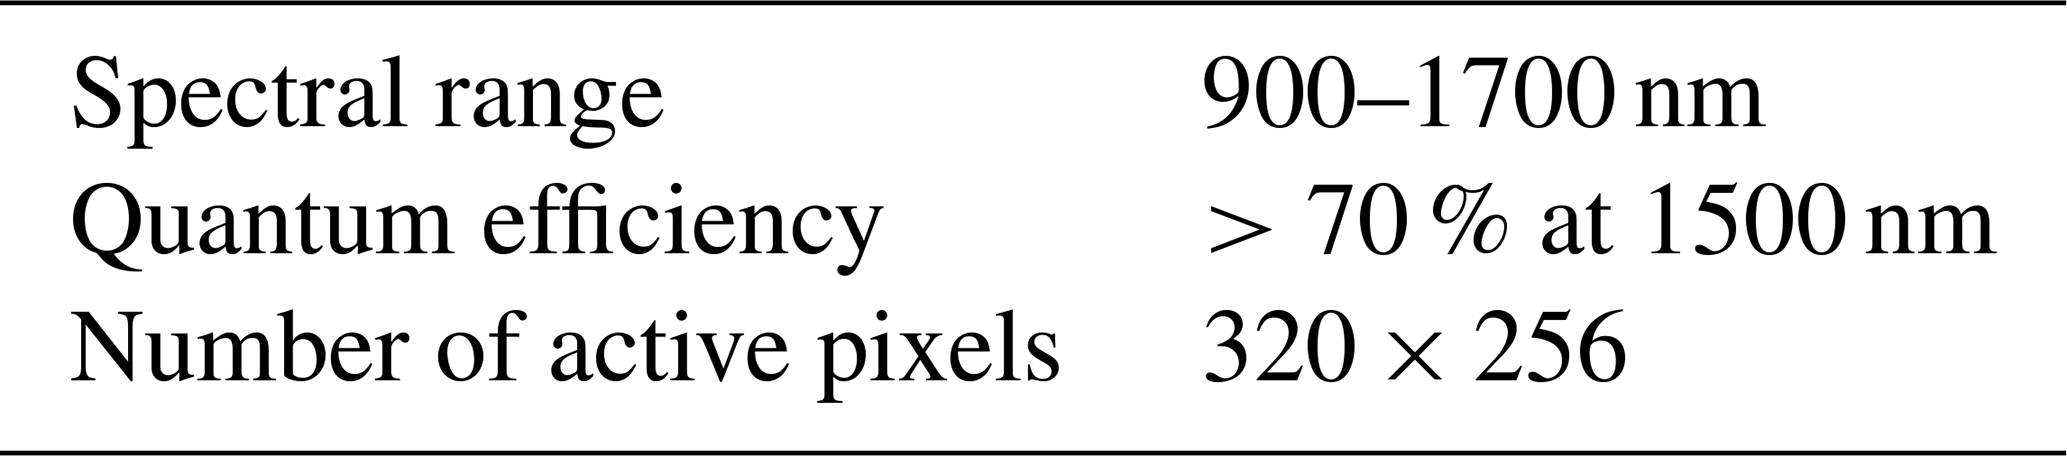
The experiments were conducted in the laboratory, in the dark, with no ambient light. A lens with a numerical aperture of 0.6 was mounted on the LEDs in order to collimate the light emitted from the LEDs. The camera was mounted with a lens with a numerical aperture of 0.33 to capture the images. The height of both LEDs and NIR camera above the asphalt was 6 cm. The measurements were performed for nine experimental configurations, achieved using three different positions of the source compared to the camera, together with three different distance values (30–90 cm) between the camera and the asphalt sample, as illustrated in Fig. 11b. These configurations correspond to an incident angle varying from 78.7 to 86.2∘. For each configuration tested and for each road surface condition tested, the experiment consisted in alternatively taking a picture of the asphalt sample with the NIR camera under three different illuminations: at 970, 1450 and 1550 nm. For one road surface condition, three pictures were hence taken for each configuration tested. In addition, for each tested position of the source, the three LEDs were alternatively placed at the same place and the illumination areas of the LEDs were carefully adjusted to be consistent. The LEDs were driven so as to achieve the same output power and to avoid saturation of the camera. Since the power of the 970 nm LED is much higher than for the 1450 and 1550 nm LEDs (see Table 6), the driving current of the 970 nm LED was reduced to reach the same output power level of the 1450 and 1550 nm LEDs.

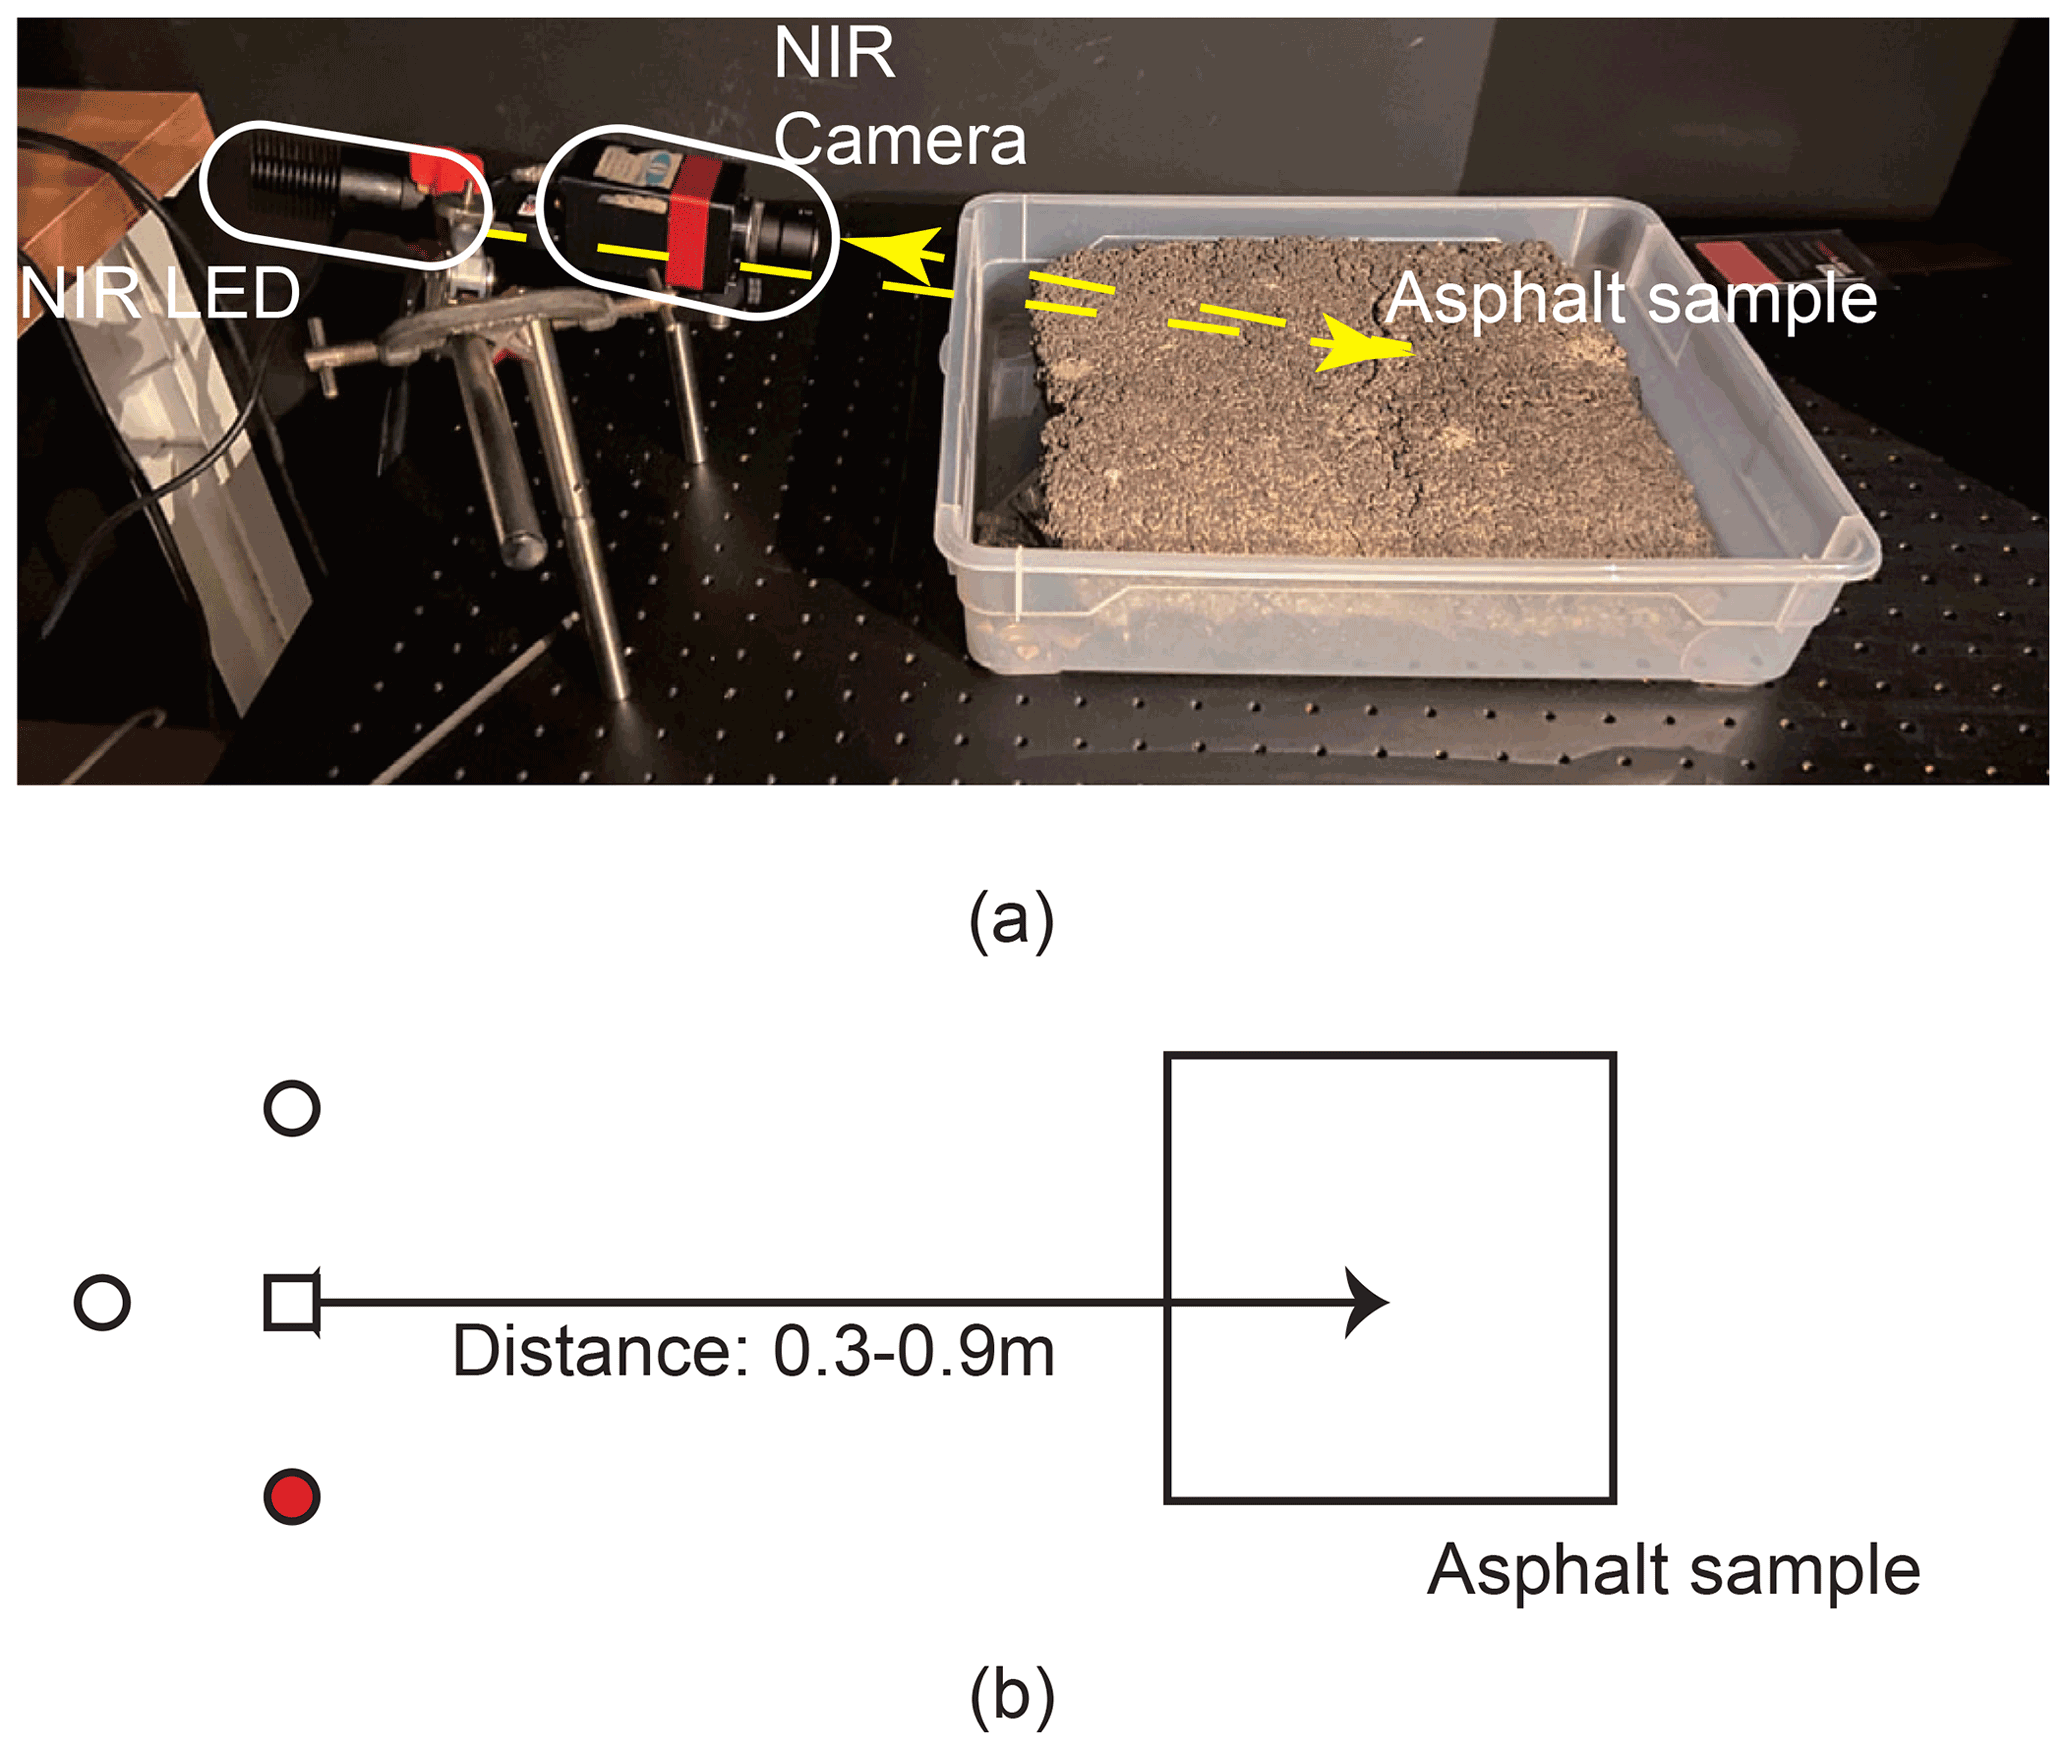
Figure 11(a) Picture of the experimental setup. (b) Top-view sketch of the experimental setup. The square represents the fixed position of the camera. The circles represent the different positions of the LED sources. For example, the configuration of (a) represents the case where the LED sources are positioned on the red circle.
3.2 Data processing and classification results
For dry, wet, snow and ice road surface conditions, the NIR signals could be detected for all tested configurations (3 different distance values × 3 different positions of LEDs), whereas for water, the signals could not be detected for distances above 30 cm between the camera and the asphalt sample, which is consistent with previous observations in Sect. 2.1. Therefore, in the following, nine configurations are taken into account for dry, wet, snow and ice conditions, whereas only three configurations are taken into consideration for water.
As there are areas which are not illuminated by the LEDs in the pictures, an area of interest (AOI) has to be defined. The AOI is manually selected as a polygon of the illuminated area as shown in Fig. 12. Each pixel in the AOI is regarded as a detection unit. Two ratios are computed for each detection unit. The first ratio corresponds to the ratio of the pixel's gray levels between pictures taken respectively under LED illumination at 1450 nm and 970 nm (). The second ratio corresponds to the ratio of the pixel's gray levels between pictures taken respectively under LED illumination at 1450 and 1550 nm (). Thresholds of the two ratios need to be determined to distinguish the road surface conditions. In order to find the appropriate threshold, the histograms of all ratios of and in the AOI are computed (Fig. 13). As shown in Fig. 13b, the peak of for wet asphalt is around 0.7, whereas the peak for dry asphalt is around 1. In the histogram, there is still an overlap between dry and wet road surface conditions, which indicates that it is difficult to set the threshold to distinguish dry and wet road surface conditions.
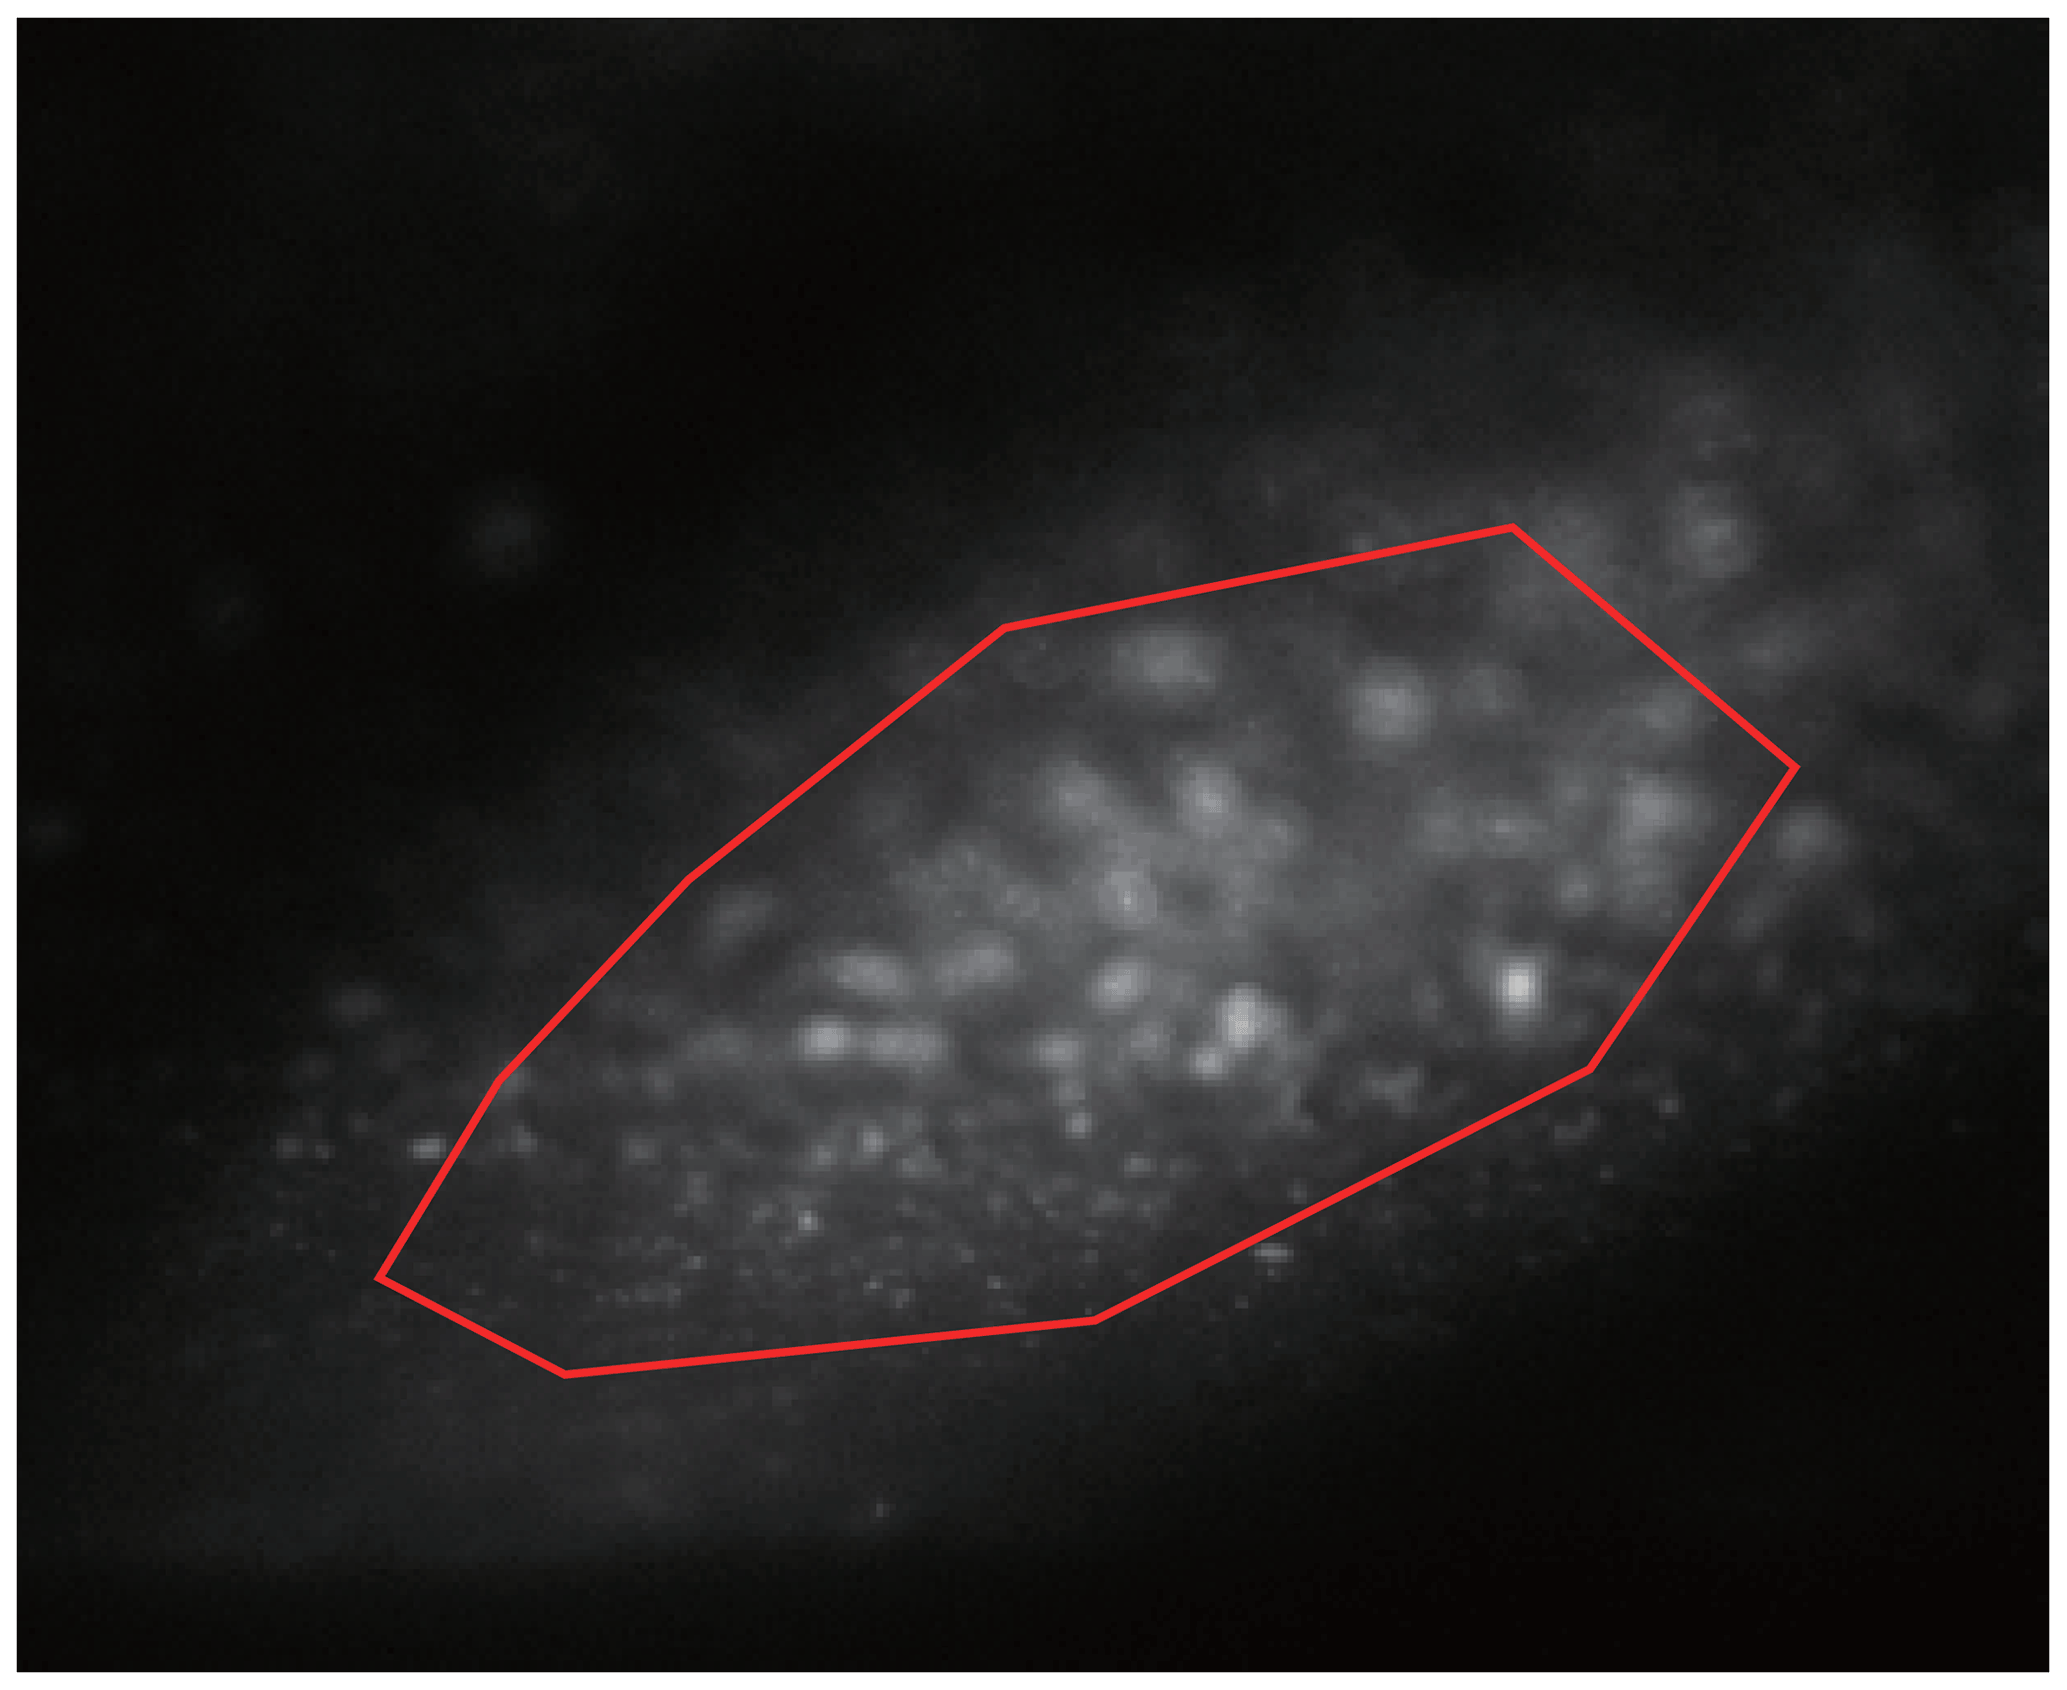
Figure 12Example of an area of interest (AOI). The AOI is the area inside the red line.
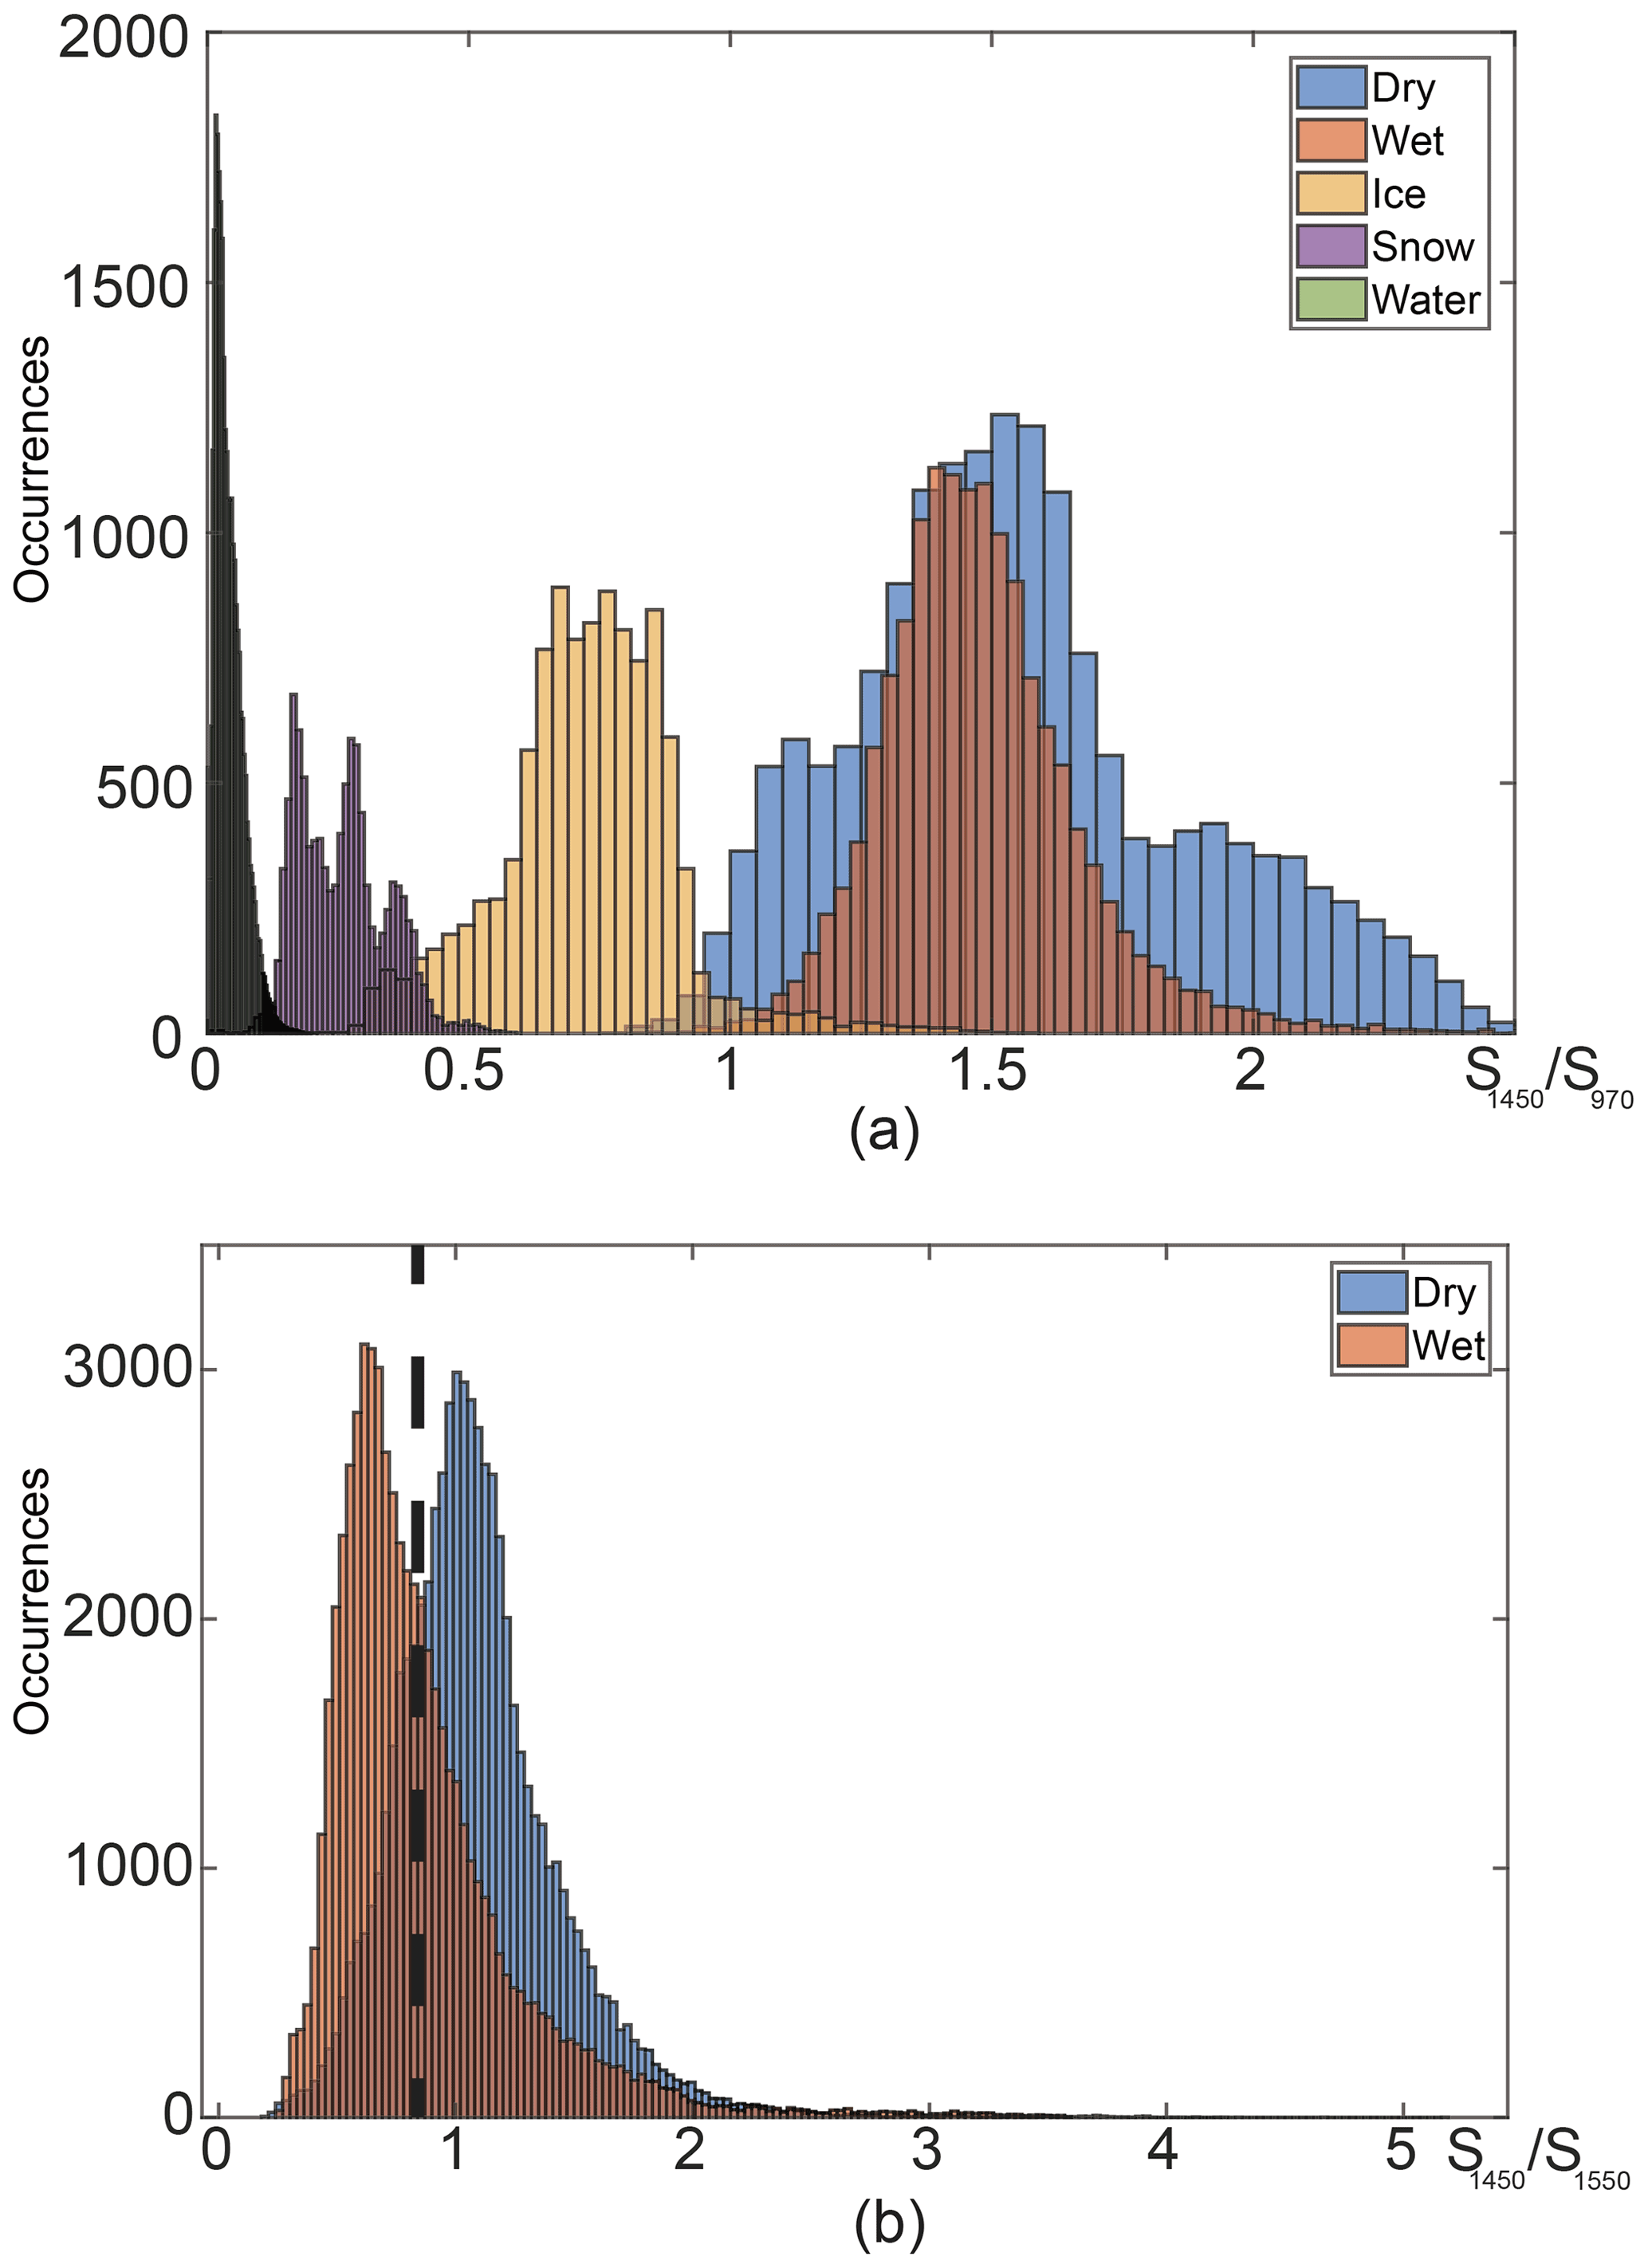
Figure 13(a) Histogram of . (b) Histogram of . Dashed line represents the threshold at the intersection point of the wet and dry distributions.
In order to distinguish the road surface conditions by these ratios, we first follow the two-step method described in Sect. 2.3. Then the result is compared with the Support Vector Machine (SVM) method, which in Jonsson et al. (2014) is proved to be a successful method with good performance in the classification, in order to see if there is any improvement. As for the two-step method, the threshold is set following Algorithms 1 and 2. The threshold is thus set at the intersection point (dashed lines in Fig. 13b). The ice, water and snow are distinguished using the ratio . They are easier to be distinguished than dry and wet, as shown in Fig. 13a. The thresholds are also placed at the intersection point between the distributions. The values of the ratios (Fig. 13) are slightly different from the values obtained by the calculation (Fig. 10), which may be due to the fact that the actual LED spectra are not a normal distribution and that the spectral sensitivity of the NIR camera is different from that of the spectrometer.
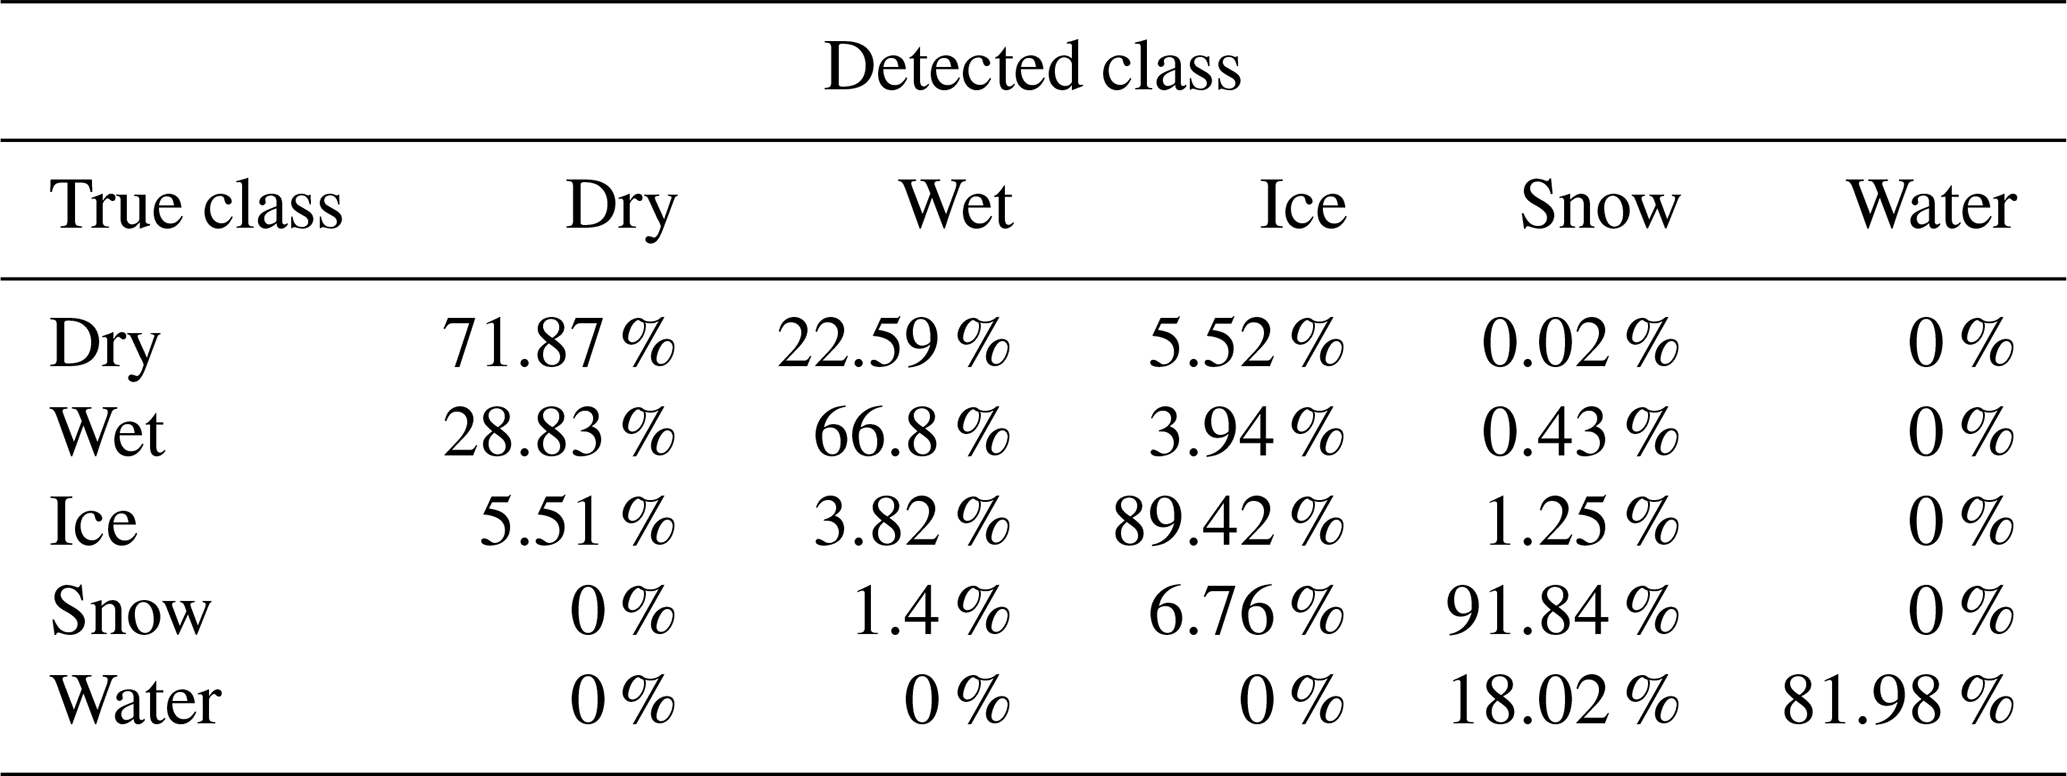
Based on the determined thresholds, data were processed and classified pixel by pixel. Examples of the classification results are given in Fig. 14. It can be noted that the dry and wet road surface conditions can be easily confused. In the image for the dry condition, some pixels are detected as wet, and in the image for the wet condition, some pixels are detected as dry. This is due to the overlap of Fig. 13a. For ice, water and snow conditions, they can mostly be correctly recognized. To summarize the classification performance of our algorithm, a confusion matrix was computed, taking into account all detection units and all configurations tested (see Table 7). In this matrix, percentages of correct and incorrect classification are summarized and broken down into each class; the diagonal values represent the accuracies of each class. It can hence be noted from Table 7 that the accuracies achieved are about 80 %–90 % for ice, snow and water conditions, whereas the accuracies for dry and wet conditions are about 66 %–70 %, resulting from the observed overlap of dry and wet classes.

Figure 14Examples of classification results with an NIR camera and NIR LEDs. The true classes are labeled under each image. The classification results are presented with colors.
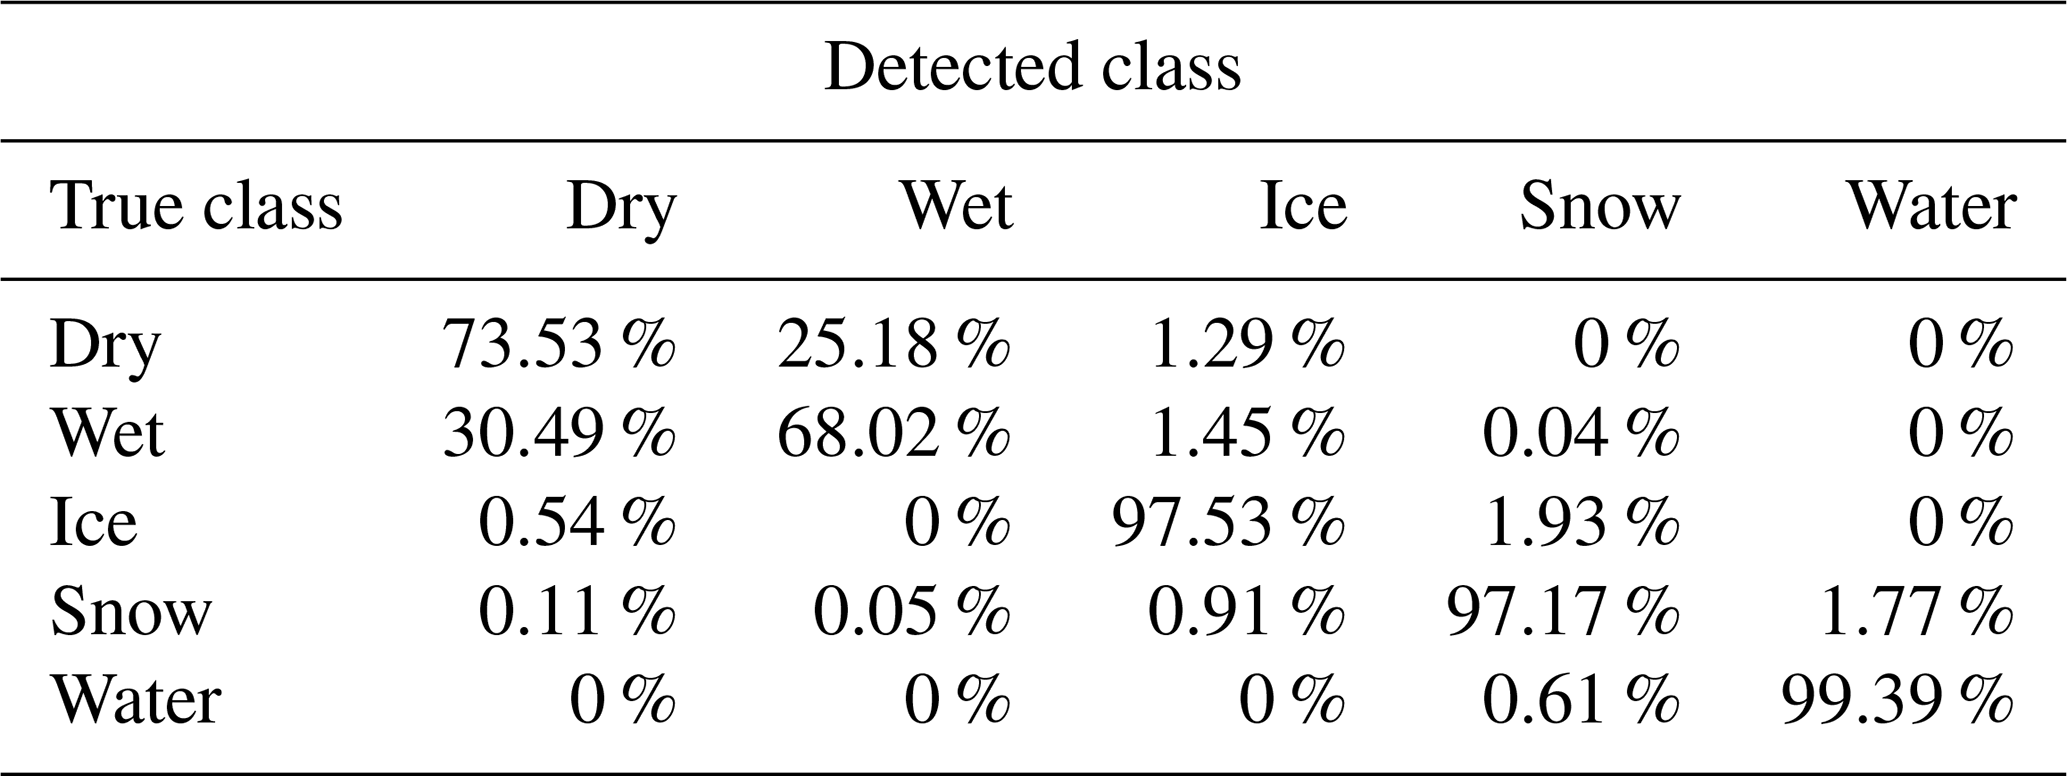
As for the SVM method, the ratios of , and are taken as the input. The core function is selected as a Gaussian function. The confusion matrix is presented in Table 8. Compared with the threshold methods, the SVM improves significantly the classification of ice, snow and water, while dry and wet conditions are still difficult to be distinguished.
As shown in the previous sections, dry and wet are the two classes which are more difficult to be distinguished in our work. However, in the theoretical calculations, no overlap was observed between the distributions of dry and wet road surface conditions, whereas the experiments in the laboratory showed an obvious overlap. Yet, the calculations were based on data obtained from spectral measurements using a spectrometer together with a lens to collect the backscattered light. Thus, the spectrometer collected the light backscattered from a larger area than that corresponding to one pixel of the NIR camera. Therefore, the measurement of the spectrometer may be equivalent to an integration of several pixels of the NIR camera, which could explain the observed difference between calculations and experiments. In addition, the asphalt sample is not homogeneous. The surface of the asphalt sample indeed consists of several grains. This may increase the random error and, since the gap between the dry and wet road surface conditions is small, an overlap of their histograms is hence possible. In a real field test at long distance and with the same incident angle, the effect of the asphalt inhomogeneity may be relatively weakened, since at long distance, one pixel of the camera would represent a larger area on the asphalt surface and would hence be an integration of several grains. Based on what was said previously, the discrimination of dry and wet may be better for measurements at long distance.
Another point to be discussed here is that the measurements in the water condition were limited to a distance of 0.3 m between the camera and the asphalt surface. It was indeed observed that above 0.3 m nearly no light scatters back for the three wavelengths and that at 0.3 m, only light backscattered at 970 nm could be detected, which is consistent with the spectral measurements (see Fig. 5). The reason may be that the water surface is much smoother than the other kinds of road surface conditions. Indeed, for smooth surfaces, specular reflection becomes higher than refraction at increasing incident angle and, as a consequence, the amount of backscattered light is very weakened. In addition, water greatly absorbs infrared light, which also contributes to the phenomenon. This may explain why light scattered back from asphalt in the water condition is not detectable under a large incident angle. However, since the water condition is the only condition that is affected by this phenomenon, this may constitute a supplementary discrimination criterion of the water condition for large incident angles. This criterion will be evaluated on a real road for a long distance.
For the ice condition, a backscattering signal was detected, even though an icy surface may also be considered a smooth surface. The reason might be that the ice as a solid cannot be as smooth as the water surface. Nevertheless, it was observed that when ice started to melt, the backscattering signal behaved like water: light above 1350 nm was undetectable, whereas backscattering light could be measured above 1350 nm for ice which does not melt.
In addition, compared to the literature, the wavelengths in this work (970, 1450 and 1550 nm) are different from the wavelengths found by Casselgren et al. (2007) (1310, 1490, 1690 nm). The reason might be that in our work, only backscattering signal is taken into consideration, while in the study by Casselgren et al. (2007), the scattering light from all directions is considered. Moreover, compared to our work, Casselgren et al. (2007) did not investigate the wet road condition as a condition to be distinguished.
Regarding the bandwidth of the NIR sources, Jonsson et al. (2014) already used NIR sources with broad spectra (a halogen lamp with filters) instead of laser diodes and discrimination was shown to be successfully achieved, although they did not investigate the influence of the broad spectra. According to our results, the good classification performance of their system can be explained by the fact that most of their filters had a bandwidth of 80–100 nm and by the fact that we showed that the performance of the classification is not significantly weakened for an FWHM less than 80 nm.
Last but not least, for a real system to be mounted on AVs, calibration should be performed in order to determine the values of the thresholds to be set in the classification algorithm. Indeed, these values depend on the LED characteristics, but also on the quantum efficiency of the NIR camera.
Furthermore, on a real road, ambient light can disturb the collected signal. Examples of such disturbing light sources could be headlights, street lights and sunlight. The surrounding light will increase the intensity level of the NIR light that the classification depends on. Due to different types of ambient light sources, the gain will not be constant. One possible solution was proposed by Casselgren et al. (2016) to eliminate the influence of the ambient light by using the modulation signal to pilot the NIR sources. Since LEDs can be driven by direct modulation, they are hence compatible with the method proposed by Casselgren et al. (2016) and, thus, the modulation of the LED sources can be used to compensate for surrounding light.
However, the limitation of the proposed system with LED sources lies in the power of NIR LEDs. As far as we know, the output power of NIR LEDs above 1000 nm on the commercial market today is less than 100 mW, which is too weak compared to the NIR radiation of the sun. Thus, the LED NIR system is not applicable for daytime and would be dedicated only to nighttime application. Today, with the development of the infrared imaging, investigations of NIR LEDs were conducted. In the work by Pichon et al. (2018), a high-power LED with a center wavelength at 1550 nm was designed, whose power can be up to 850 mW. Although it is not yet commercialized, the prospect of the utilization of the NIR LEDs could be interesting for future applications. In the meanwhile, a supplementary system based on machine learning to detect the road surface in the daytime is possible for solving the problem. In Roychowdhury et al. (2018); Zhao et al. (2017), road surface conditions in the daytime were shown to be well classified and the accuracy could reach 97 %. In addition, the experiments of this work were conducted in the laboratory with a short distance. On a real road, as a large area of the road surface is illuminated by the LEDs for a long distance, the power received by the camera will be greatly decreased. This, in turn, will lead to a decrease in the signal-to-noise ratio of the system. In this aspect, the power of LEDs used in the laboratory is not enough for the realistic case, especially for LEDs at 1450 and 1550 nm, whose power is about tens of milliwatts. According to our rough estimate, the required power of the LEDs for a long distance should be several watt, and this might be solved by using multi-LED chips.
An investigation of the NIR system for AVs using NIR LEDs combined with an NIR camera was conducted for the recognition of several road surface conditions, namely, dry, wet, water, ice and snow. Based on the NIR spectral measurements of the backscattered response under different road surface conditions, a classification method was developed and proposed. Then, the appropriate wavelengths of the LED sources for best classification performance were determined, taking into consideration the spectra of the LEDs. In addition, the influence of the LED spectral bandwidth on the appropriate wavelengths and on the classification performance was investigated. According to our calculations, the central wavelengths of the LED sources are relatively unchanged with the increase of the FWHM until 180 nm and the classification performance is relatively not impaired for an FWHM less than 80 nm compared to the case where the FWHM is that of usual laser diodes (10 nm). Therefore, commercial NIR LEDs whose average FWHM is 80 nm can be used in NIR systems to distinguish road surface conditions. Based on the calculations, an NIR system was set up, using three LEDs at 970, 1450 and 1550 nm and an NIR camera, and experiments were conducted in the laboratory. It was shown that it is feasible to distinguish the road surface conditions of dry, wet, ice and snow for an incident angle from 78.7 to 86.2∘. The water condition could be recognized for an incident angle of about 78.7∘. The accuracy of the classification of snow, wet and water conditions can reach 97 %, while the accuracy of the dry and wet road surface conditions is respectively 73 % and 68 %. Therefore, it can be concluded that the classification of different road surface conditions can be achieved using the proposed NIR system with LEDs as the NIR sources. In the future, the system is aimed to be tested on a real road at nighttime to evaluate its performance for a long detection distance.
The underlying coding and data are not publicly available due to the confidentiality of Renault and Valeo.
HZ designed and carried out the experiments. HZ developed the code to analyze the data. SA guided the experiments and the analysis. HZ wrote the manuscript draft. SA and RS reviewed and edited the manuscript. MB reviewed the manuscript.
The contact author has declared that neither they nor their co-authors have any competing interests.
Publisher's note: Copernicus Publications remains neutral with regard to jurisdictional claims in published maps and institutional affiliations.
The authors thank the companies Renault and Valeo for their support to the project.
This research was funded by ELS Embedded Lighting Systems Chair.
This paper was edited by Michael Kraft and reviewed by two anonymous referees.
Anderson, J. M., Nidhi, K., Stanley, K. D., Sorensen, P., Samaras, C., and Oluwatola, O. A.: Autonomous vehicle technology: A guide for policymakers, Rand Corporation, https://www.rand.org/pubs/research_reports/RR443-2.html (last access: October 2021), 2014. a
Casselgren, J., Sjödahl, M., and LeBlanc, J.: Angular spectral response from covered asphalt, Appl. Optics, 46, 4277–4288, 2007. a, b, c, d, e, f, g, h, i, j, k, l, m
Casselgren, J., Sjödahl, M., and LeBlanc, J. P.: Model-based winter road classification, Int. J. Vehic. Syst. Model. Test., 7, 268–284, 2012. a, b, c, d
Casselgren, J., Rosendahl, S., Sjödahl, M., and Jonsson, P.: Road condition analysis using NIR illumination and compensating for surrounding light, Opt. Laser. Eng., 77, 175–182, 2016. a, b, c, d, e, f
Cho, Y. and Kim, J.-J.: Lifetime decrease of halogen lamps for automotive by duty cycle stress, IEEE T. Reliabil., 60, 550–556, 2011. a
Colace, L., Santoni, F., and Assanto, G.: A near-infrared optoelectronic approach to detection of road conditions, Optics Laser. Eng., 51, 633–636, 2013. a
Faisal, A., Kamruzzaman, M., Yigitcanlar, T., and Currie, G.: Understanding autonomous vehicles, J. Transp. Land Use, 12, 45–72, 2019. a
Irvine, W. M. and Pollack, J. B.: Infrared optical properties of water and ice spheres, Icarus, 8, 324–360, 1968. a
Jonsson, P., Casselgren, J., and Thörnberg, B.: Road surface status classification using spectral analysis of NIR camera images, IEEE Sensor. J., 15, 1641–1656, 2014. a, b, c, d, e, f
Ott, M.: Capabilities and reliability of LEDs and laser diodes, Internal NASA Parts and Packaging Publication, https://photonics.gsfc.nasa.gov/tva/meldoc/sources1.pdf (last access: October 2021), 1996. a
Pichon, P., Blanchot, J.-P., Balembois, F., and Georges, P.: New LED-based high-brightness incoherent light source in the SWIR, Opt. Express, 26, 9353–9362, 2018. a
Roychowdhury, S., Zhao, M., Wallin, A., Ohlsson, N., and Jonasson, M.: Machine learning models for road surface and friction estimation using front-camera images, in: IEEE 2018 International Joint Conference on Neural Networks (IJCNN), 8–13 July 2018, Rio de Janeiro, Brazil, 18165571, https://doi.org/10.1109/IJCNN.2018.8489188, 2018. a
Ruiz-Llata, M., Rodríguez-Cortina, M., Martín-Mateos, P., Bonilla-Manrique, O. E., and López-Fernández, J. R.: LiDAR design for Road Condition Measurement ahead of a moving vehicle, in: IEEE 2017 IEEE Sensors, 29 October–1 November 2017, Glasgow, UK, 17452493, https://doi.org/10.1109/ICSENS.2017.8234230, 2017. a, b, c, d
Shin, J., Park, H., and Kim, T.: Characteristics of Laser Backscattering Intensity to Detect Frozen and Wet Surfaces on Roads, J. Sensors, 2019, 8973248, https://doi.org/10.1155/2019/8973248, 2019. a
Yamada, M., Oshima, T., Ueda, K., Horiba, I., and Yamamoto, S.: A study of the road surface condition detection technique for deployment on a vehicle, JSAE Rev., 24, 183–188, 2003. a
Zhang, H., Azouigui, S., Sehab, R., Boukhnifer, M., Balembois, F., Bedu, F., Cayol, O., Beev, K., and Planche, G.: Remote sensing techniques to recognize road surface conditions for autonomous vehicles, in: Proceedings of the SIA VISION, 17–18 March 2021, Paris, France, 179–184, https://www.sia.fr/publications/669-sia-vision-2021?lng=en, last access: March 2021. a
Zhao, J., Wu, H., and Chen, L.: Road surface state recognition based on SVM optimization and image segmentation processing, J. Adv. Transport., 2017, 6458495, https://doi.org/10.1155/2017/6458495, 2017. a
- Abstract
- Introduction
- Determination of the wavelength combination of the three LED sources
- Experimental validation of the selected LEDs
- Discussion
- Conclusions
- Code and data availability
- Author contributions
- Competing interests
- Disclaimer
- Acknowledgements
- Financial support
- Review statement
- References