the Creative Commons Attribution 4.0 License.
the Creative Commons Attribution 4.0 License.
 | 15 Nov 2022
Impact of electrode conductivity on mass sensitivity of piezoelectric resonators at high temperatures
Sebastian Schlack
Hendrik Wulfmeier
Holger Fritze
High-temperature stable piezoelectric Ca3TaGa3Si2O14 and La3Ga5SiO14 resonators with keyhole-shaped Pt electrodes are coated with metal oxide films such as TiO2−δ and SnO2 that overlap the Pt electrodes. The resonators are exposed to reducing atmospheres in order to increase the electrical conductivity of the oxide film and then act as extended oxide electrodes. The resulting increase in the effective electrode radius causes an increase in the mass sensitivity of the resonators and, thereby, resonance frequency shifts. In other words, the effective mass of the Pt electrode becomes higher. An electrical circuit model is presented to describe the increase in the effective electrode radius of the resonator, which is used to calculate the related resonance frequency shift. Additionally, an electromechanical model is presented, which subdivides the resonator into two coupled oscillators. One is representing the resonator volume underneath the Pt electrode and the other underneath the oxide electrode at increased electrical conductivity. The model reflects how the oxide electrodes affect the resonance frequency. Furthermore, the impact of increasing oxide electrode conductivity on the resonance frequency is discussed with respect to the application of oxide electrodes and for gas sensing.
- Article
(2017 KB) - Full-text XML
- BibTeX
- EndNote


High-temperature stable, piezoelectric resonators operated in thickness shear mode (TSM) are coated with noble metal electrodes and metal oxide films. Commonly, such TSM resonators are used as gravimetric sensors that reflect the mass change in the oxide films, thereby reaching a mass resolution of a few nanograms (Sauerbrey, 1959; Fritze, 2011a). Here, the operation of the resonator requires a constant electrode area which is defined by metal electrodes. The condition is fulfilled if the oxide film does not overlap the underlying metal electrode. In this study, however, a modified electrode layout is used where the oxide films overlap the metal electrodes. The aim is to evaluate the impact of an oxide electrode on the resonance frequency when the electrical conductivity of the oxide film increases. Furthermore, the mass changes in the oxide film occurring in any case are regarded.
A quite common example for TSM resonators is the quartz crystal microbalance (QCM), which was introduced by Günter Sauerbrey in the 1950s (Sauerbrey, 1959). Nevertheless, the application of quartz is limited to a maximum temperature of 450 ∘C due to strongly increasing acoustic loss (Cernosek et al., 1998; Fritze, 2011a). Alternatively, piezoelectric materials like langasite (La3Ga5SiO14, LGS) or catangasite (Ca3TaGa3Si2O14, CTGS) enable the operation at fairly high temperatures, even above 1000 ∘C (Yu et al., 2016; Zu et al., 2016; Shah and Saha, 2021; Fritze, 2011b; Suhak et al., 2018; Sauerbrey, 1964; Seh et al., 2007).
The operation of piezoelectric resonators at high temperatures is often limited by the degradation of the electrode material. Commonly, noble metal electrodes are applied, e.g. platinum. In particular thin-film electrodes suffer from degradation mechanisms like evaporation, agglomeration, and/or oxidation (Firebaugh et al., 1998). The stable operation of piezoelectric resonators could be further enhanced by using oxide electrodes such as strontium-doped LGS thin films with increased electrical conductivity (Wulfmeier et al., 2019, 2020). However, the electrical conductivity of such electrodes is strongly temperature and gas atmosphere dependent and affects, therefore, the resonance frequency of the piezoelectric device. To investigate the impact of an increasing oxide film conductivity on the resonance frequency of a CTGS resonator, a special electrode layout is used which consists of an underlying Pt electrode and an overlapping, well-defined oxide film. This arrangement can potentially be used as a high-temperature gas sensor.
CTGS and LGS y-cut plates are used as piezoelectric substrate material. They are operated as TSM resonators by applying an alternating current (a.c.) voltage in the vicinity of their mechanical resonance via keyhole-shaped Pt electrodes and oxide films. The resonance frequency fR can be described by Eq. (1), as follows:
with the resonator thickness dR, the piezoelectrically stiffened shear modulus cR (46 GPa at 25 ∘C; Suhak et al., 2018), and the density ρR (4.62 g cm−3 at room temperature; Sotnikov et al., 2013). The piezoelectric stiffened shear modulus is defined in Eq. (2) (Tiersten, 1969).
with the piezoelectric coefficient e26, dielectric constant ε22, and the shear modulus c66 of the piezoelectric material, here y-cut CTGS or LGS. Note that the eigenfrequency of the resonator without piezoelectric excitation follows from Eq. (1) with c66 instead of cR. Thereby, c66 is connected to the electromechanical coupling coefficient k2, which represents the conversion from electrical excitation to mechanical (vibration) energy (Ikeda, 1990). The origin of piezoelectric stiffening is the polarization within the crystal due to the external electrical excitation voltage (Johannsmann and Heim, 2006). For 5 MHz CTGS resonators, k2 is about 2 % between room temperature and 900 ∘C (Suhak et al., 2018, 2021). Furthermore, the coupling is impacted by the resonator geometry (IEEE, 1988). Therefore, an effective electromechanical coupling coefficient is defined. It can be calculated from measured values for the capacitances Cm and CB of the extended Butterworth–van Dyke equivalent circuit for TSM resonators (IEEE, 1988; Johannsmann, 2015). They reflect the area of the motional and electrical branches of the resonator (see Sect. 2.3). For the fundamental mode, Eq. (3) applies (IEEE, 1988; Johannsmann, 2015).
In this study, the series resonance frequency fR at the conductance maximum of the resonator is regarded (see Fritze et al., 2003, for details). For simplicity, this will be labelled as “resonance frequency fR” in the following sections. It can be determined by measuring the electrical impedance in the vicinity of the mechanical resonance and fitting a Lorentz function to its conductance peak (Bund and Schwitzgebel, 1998).
Besides, fR is strongly temperature dependent (Fritze, 2011a). The temperature coefficients of the CTGS and LGS resonators used in this study are about 200 to 250 Hz K−1 (Schulz et al., 2022). Therefore, temperature fluctuations disturb resonance frequency shifts in interest and need to be compensated. To suppress temperature-related resonance frequency shifts, a temperature-compensated resonance frequency fTC, according to Fritze (2011a), is determined. The approach is feasible in narrow temperature ranges, e.g. ±10 K around the nominal operation temperature, where a linear temperature coefficient αT can be applied.
As mentioned above, TSM resonators are commonly used as gravimetric sensors. According to Sauerbrey (1959), an accumulation or loss of mass shifts the resonance frequency fR and the mass change Δm can be calculated using the Sauerbrey (1959) equation (Eq. 4).
In Eq. (4), AR is the effective resonator area, ΔfTC is the temperature-compensated resonance frequency shift, and is the average mass sensitivity of a given resonator. AR takes the finite resonator area into account (Fritze, 2011a). is determined by the resonance frequency fR, the shear modulus (here cR because of the electrical excitation), and density ρR. Here, fTC is used for calculation of (see Eq. 5). Thereby, the definition of takes the finite resonator area into account as well (Fritze, 2011a).
The propagation of shear waves is essentially confined by the electrode radius. Due to the mass load of the electrode, the eigenfrequency underneath the electrode is lower than outside the electrode. As a consequence, the shear wave is mostly reflected at the electrode edges. This effect is called energy trapping (Shockley et al., 1967). However, it is observed that the shear wave exceeds the electrode area (Martin and Hager, 1989; Schmidtchen et al., 2013b). Non-oscillating edges of the resonator are useful because it allows one to mechanically clamp the resonator at its edges for electrical connections with only negligible disturbance or damping of the resonance (Fritze, 2011a). For radial symmetric electrodes, the amplitude distribution of the shear wave can be described by a Gaussian profile (Martin and Hager, 1989). As a consequence, the radial mass sensitivity distribution Sm(r) can be given by Eq. (6).
with the maximum sensitivity in the centre of the electrode Smax, the broadening of the Gaussian profile a, and the radius r (Martin and Hager, 1989). Note that the mass sensitivity is quadratically related to the amplitude of the shear wave u∼er (Sauerbrey, 1959; Cumpson and Seah, 1990).
Subsequently, the mass sensitivity Sm for the electrode area and related resonance frequency shifts are discussed. The propagation of the shear wave outside the Pt electrode is described in the following section.
For TSM resonators, the relative sensitivity at the edge of the electrode is nearly constant, e.g. , for operation in air (Martin and Hager, 1989). Using Eq. (6), the broadening can be calculated by Eq. (7), as follows:
The average mass sensitivity is given by Eq. (5). Then, Smax is found from the following:
Finally, the resonance frequency shift Δfm for varying mass m(r) can be calculated by the following (Fritze et al., 2005):
It is worth noting that an increasing effective electrode radius results in an increasing mass sensitivity and, thereby, the effective mass of the Pt electrode, which finally causes a resonance frequency decrease. The resonance frequency shift ΔfR for a given mass load distribution but different effective electrode radii ri is calculated by the following:
In Eqs. (9) and (10), rR and r0 correspond to the effective electrode radii under measurement and reference conditions. Here, rR is the effective electrode radius at increased oxide electrode conductivity. Reference conditions are specified by a reference temperature and atmosphere, which are mentioned in Sect. 3.2.3. ΔfR can be calculated by the numerical integration of Eq. (9). However, the resulting resonance frequency shift at an increased effective electrode radius is additionally influenced by the attenuation of the shear wave outside the effective electrode. It is worth noting that this effect becomes more pronounced for thick (heavy) electrodes.
2.1 Propagation of the shear wave outside the electrodes
The amplitude u outside the electrode edges can be described by an exponential decay in Eq. (11) (Shockley et al., 1967).
with the amplitude on the electrode edges u0, the distance from the electrode edges d, and the inverse attenuation coefficient δ, which can be expressed by the following:
for excitation at the resonance frequency fR. In Eq. (12), is the eigenfrequency of the resonator outside the electrodes. It is worth noting that the attenuation of the shear wave is independent of the propagation direction, and moreover, the inverse attenuation coefficient δ can take real and imaginary values (Shockley et al., 1967; Efimov et al., 2006).
The amplitude distribution of LGS resonators operated with an additional oxide electrode and broadening of the effective electrode radius at an increasing oxide electrode conductivity is observed with a laser Doppler vibrometer (Schmidtchen et al., 2013b). This effect is under investigation for CTGS samples with oxide electrodes and will be the subject of another publication. In addition, the absence and presence of piezoelectric stiffening must be taken into account (Yang and Kosinski, 2004). Mass loading and piezoelectric stiffening shift the resonance frequency in different directions. If equals fR, then the attenuation coefficient δ is not defined within the model. If fR approaches , then the shear amplitude u outside the electrode would be constant. However, the model is not developed for this situation. Material-related losses of the piezoelectric material must be taken into account. The effect is not considered in Eq. (12).
2.2 Mechanical and electrical equivalent circuits
The mechanical vibration of a TSM resonator can be described in a simplified way by a mechanical structure of a mass m, a spring with spring constant κ, and a damper with the damping coefficient ξ. The mechanical-equivalent circuit can be found elsewhere (e.g. Buttery and Ward, 1992). The quantities m, κ, and ξ can be calculated using the following equations (Johannsmann, 2008):
Thereby, the shear modulus c66 or the piezoelectric stiffened shear modulus cR can be used to calculate κ and ξ for resonances between and outside the electrodes, respectively.
To describe the electrical behaviour of a TSM resonator, the Butterworth–van Dyke equivalent circuit (BvD EC) is used (van Dyke, 1928). At high temperatures, a resistor RB must be added to consider the finite bulk conductivity of the resonator (Fritze, 2011a). The resulting extended BvD EC consists of a motional arm with the resistance Rm, the capacitance Cm, and the inductance Lm. In parallel, a bulk resistance RB and a bulk capacitance CB represent the static properties of the resonator. A detailed description of the BvD EC and the correlation between the lumped elements and material parameters can be found elsewhere (e.g. Fritze, 2011a).
2.3 Operation of TSM resonators with additional oxide electrode
In contrast to common TSM resonator layouts, where a thin film of interest is deposited on a larger electrode, here the oxide film overlaps the Pt electrode and is congruent with the large back electrode (see Fig. 1). As a result, the oxide film acts as an electrode, provided that oxide film conductivity is sufficiently high. An effective electrode radius rR results, depending on the electrical conductivity of the oxide electrode material, shifting the resonance frequency, as described in Sect. 2 and Eq. (10). Furthermore, the resonance frequency fR is affected by the effective electrode radius rR and, therefore, by the electrical conductivity σF of the oxide electrode (Fritze et al., 2005). It is worth noting that a thin and highly resistive oxide film has a negligible impact on energy trapping. In terms of mass, relevant for the energy trapping, the difference becomes even more significant due to the high Pt density (21.45 g cm−3; Lide, 2003), being of the order of magnitude of 10 µg (oxide) to 1000 µg (Pt). Prior characterization of comparable oxide films showed that these are compact and dense if grown under the applied conditions. Therefore, the oxide film density is expected to nearly equal those of bulk TiO2 (4.23 g cm−3) and SnO (6.45 g cm−3; Lide, 2003), respectively.
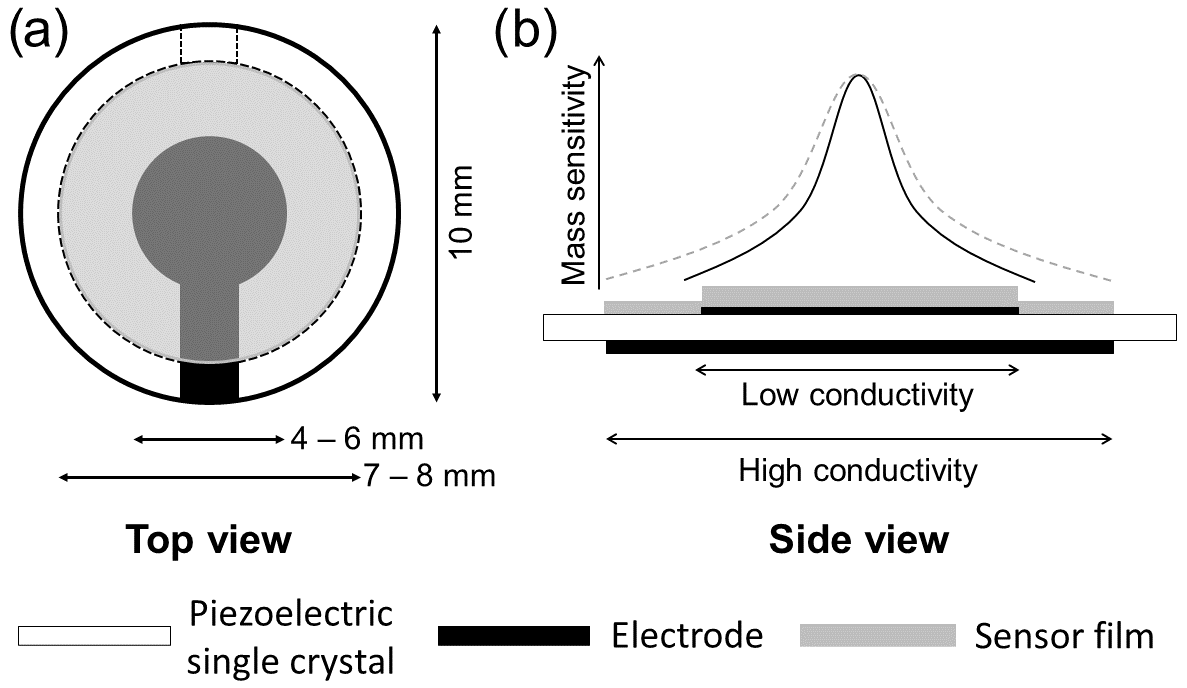
Figure 1(a) Top view of the resonator layout. (b) Side view of the resonator layout (lower part). At low oxide film conductivity, the electrode radius is determined by the top Pt electrode. At high conductivity, the metal oxide acts as an electrode, and the (effective) electrode radius is determined by the oxide film. This inflicts the mass sensitivity (upper part) as well. The maximum mass sensitivity in the centre of the resonator remains mainly unchanged, whereas the lateral distribution follows the larger (effective) electrode radius with increasing oxide film conductivity. For a nearly insulating oxide layer, the mass sensitivity distribution is mainly limited to the area of the smaller metal electrode (black solid line). If the oxide film becomes conducting, the mass sensitivity distribution broadens (dashed grey line) and covers the whole oxide electrode.
The resonance frequency fR shifts, in dependence of rR, could be caused by two effects. It is connected to the inhomogeneous mass distribution and broadening of mass sensitivity and to the propagation and additional excitation of shear waves outside the top Pt electrode when the conductivity of the oxide electrode and, thereby, the piezoelectric stiffening increases.
2.3.1 Effective electrode radius of TSM resonators operated at increased conductivity of the oxide electrode
To determine the voltage along the radius of the oxide electrode and, thereby, the extension of the electrically excited resonator volume, an electrical circuit (EC) model is presented (see Fig. 2). Thereby, the oxide electrode area is divided into rings with different width but the same area. The width of the rings ri–ri−1 varies. The average width is about 250 µm. Hereby, the inner ring coincidences with the top electrode radius. The total area of all rings sums up to the oxide electrode area. In order to keep the area of each ring the same, the width of the rings decreases with increasing radius. To determine the electrical excitation caused by a specific ring, the voltage drops in the lateral direction of the oxide electrodes are calculated. The electrical resistances RF in the lateral direction depend on the inner and outer radii of the ring, ri and ro, respectively, and can be calculated by Eq. (16) (Demtröder, 2009).
In Eq. (16), dF and σF are the oxide electrode thickness and conductivity, respectively. The resistance of the metal electrode material is set to zero because it is several orders of magnitude lower than that of the oxide electrode.

Figure 2Model for the calculation of effective resonator radius. (a) Distribution of the electrode sections. Only five sections (inner circular section and four rings) are shown to visualize the model. The inner sections reflect the Pt electrode, and the corresponding electrical resistances are set to zero. The other sections represent the oxide electrode area, and the resistance can be determined using Eq. (16). (b) Corresponding electrical circuit. Again, four electrode sections () are shown. To represent the vibrating volume of the piezoelectric resonator, five underlying sections (one inner circular section and four rings) are denoted as and .
The resistance of the resonator material RR, here CTGS or LGS, follows from their bulk and motional impedance. The latter depends on the excitation frequency and corresponds to the real part of the impedance (RZ), like RR=RZ, which can be approximated by RR≈RB far away from resonance and RR≈Rm in resonance, when Cm and Lm disappear together. Out of resonance, Cm and Lm have a high resistance. Consequently, the impedances of the resonator material underneath the metal (Pt) and oxide electrodes are different because the eigenfrequencies differ due to the appearance of piezoelectric stiffening and different film thicknesses or mass loading. Therefore, the resistances at the Pt and oxide electrodes are indicated as and , respectively.
Applying Kirchhoff's current and voltage laws, the EC provides a system of 2N+1 linear equations and 2N+1 variables, which are the currents I0, , , …, , , and , …, . The current I0 can be calculated by the electrical excitation voltage U0 and the overall resistance R. The resistance of a ring follows from the serial connection of the oxide electrode resistance and the resonator resistance RR. The corresponding system of linear equations is given in Eq. (17) in matrix notation. The solution provides the currents , , …, , which can be converted to excitation voltages , , …, , using Ohm's law in Eq. (18).
Then, the electrical excitation voltage UE of ring i is given by Eq. (19), as follows:
Figure 3 shows UE over the resonator radius for electrode conductivities ranging from 10−7 to 100 S cm−1, which matches the expected oxide electrode conductivities for the oxide materials (TiO2-δ and SnO2) and the experimental conditions of this study (film thickness 50–200 nm). Already for oxide electrode conductivities from 10−7 S cm−1, the electrical excitation starts to widen the area of the oxide electrode. Above about 10−3 S cm−1, the effect is strong. The effective electrode radius rR represents the effective area where the electrical voltage is sufficiently high to excite shear waves. It can be determined, using Fig. 3, provided that the minimum excitation voltage is known, where shear vibrations can still be observed.
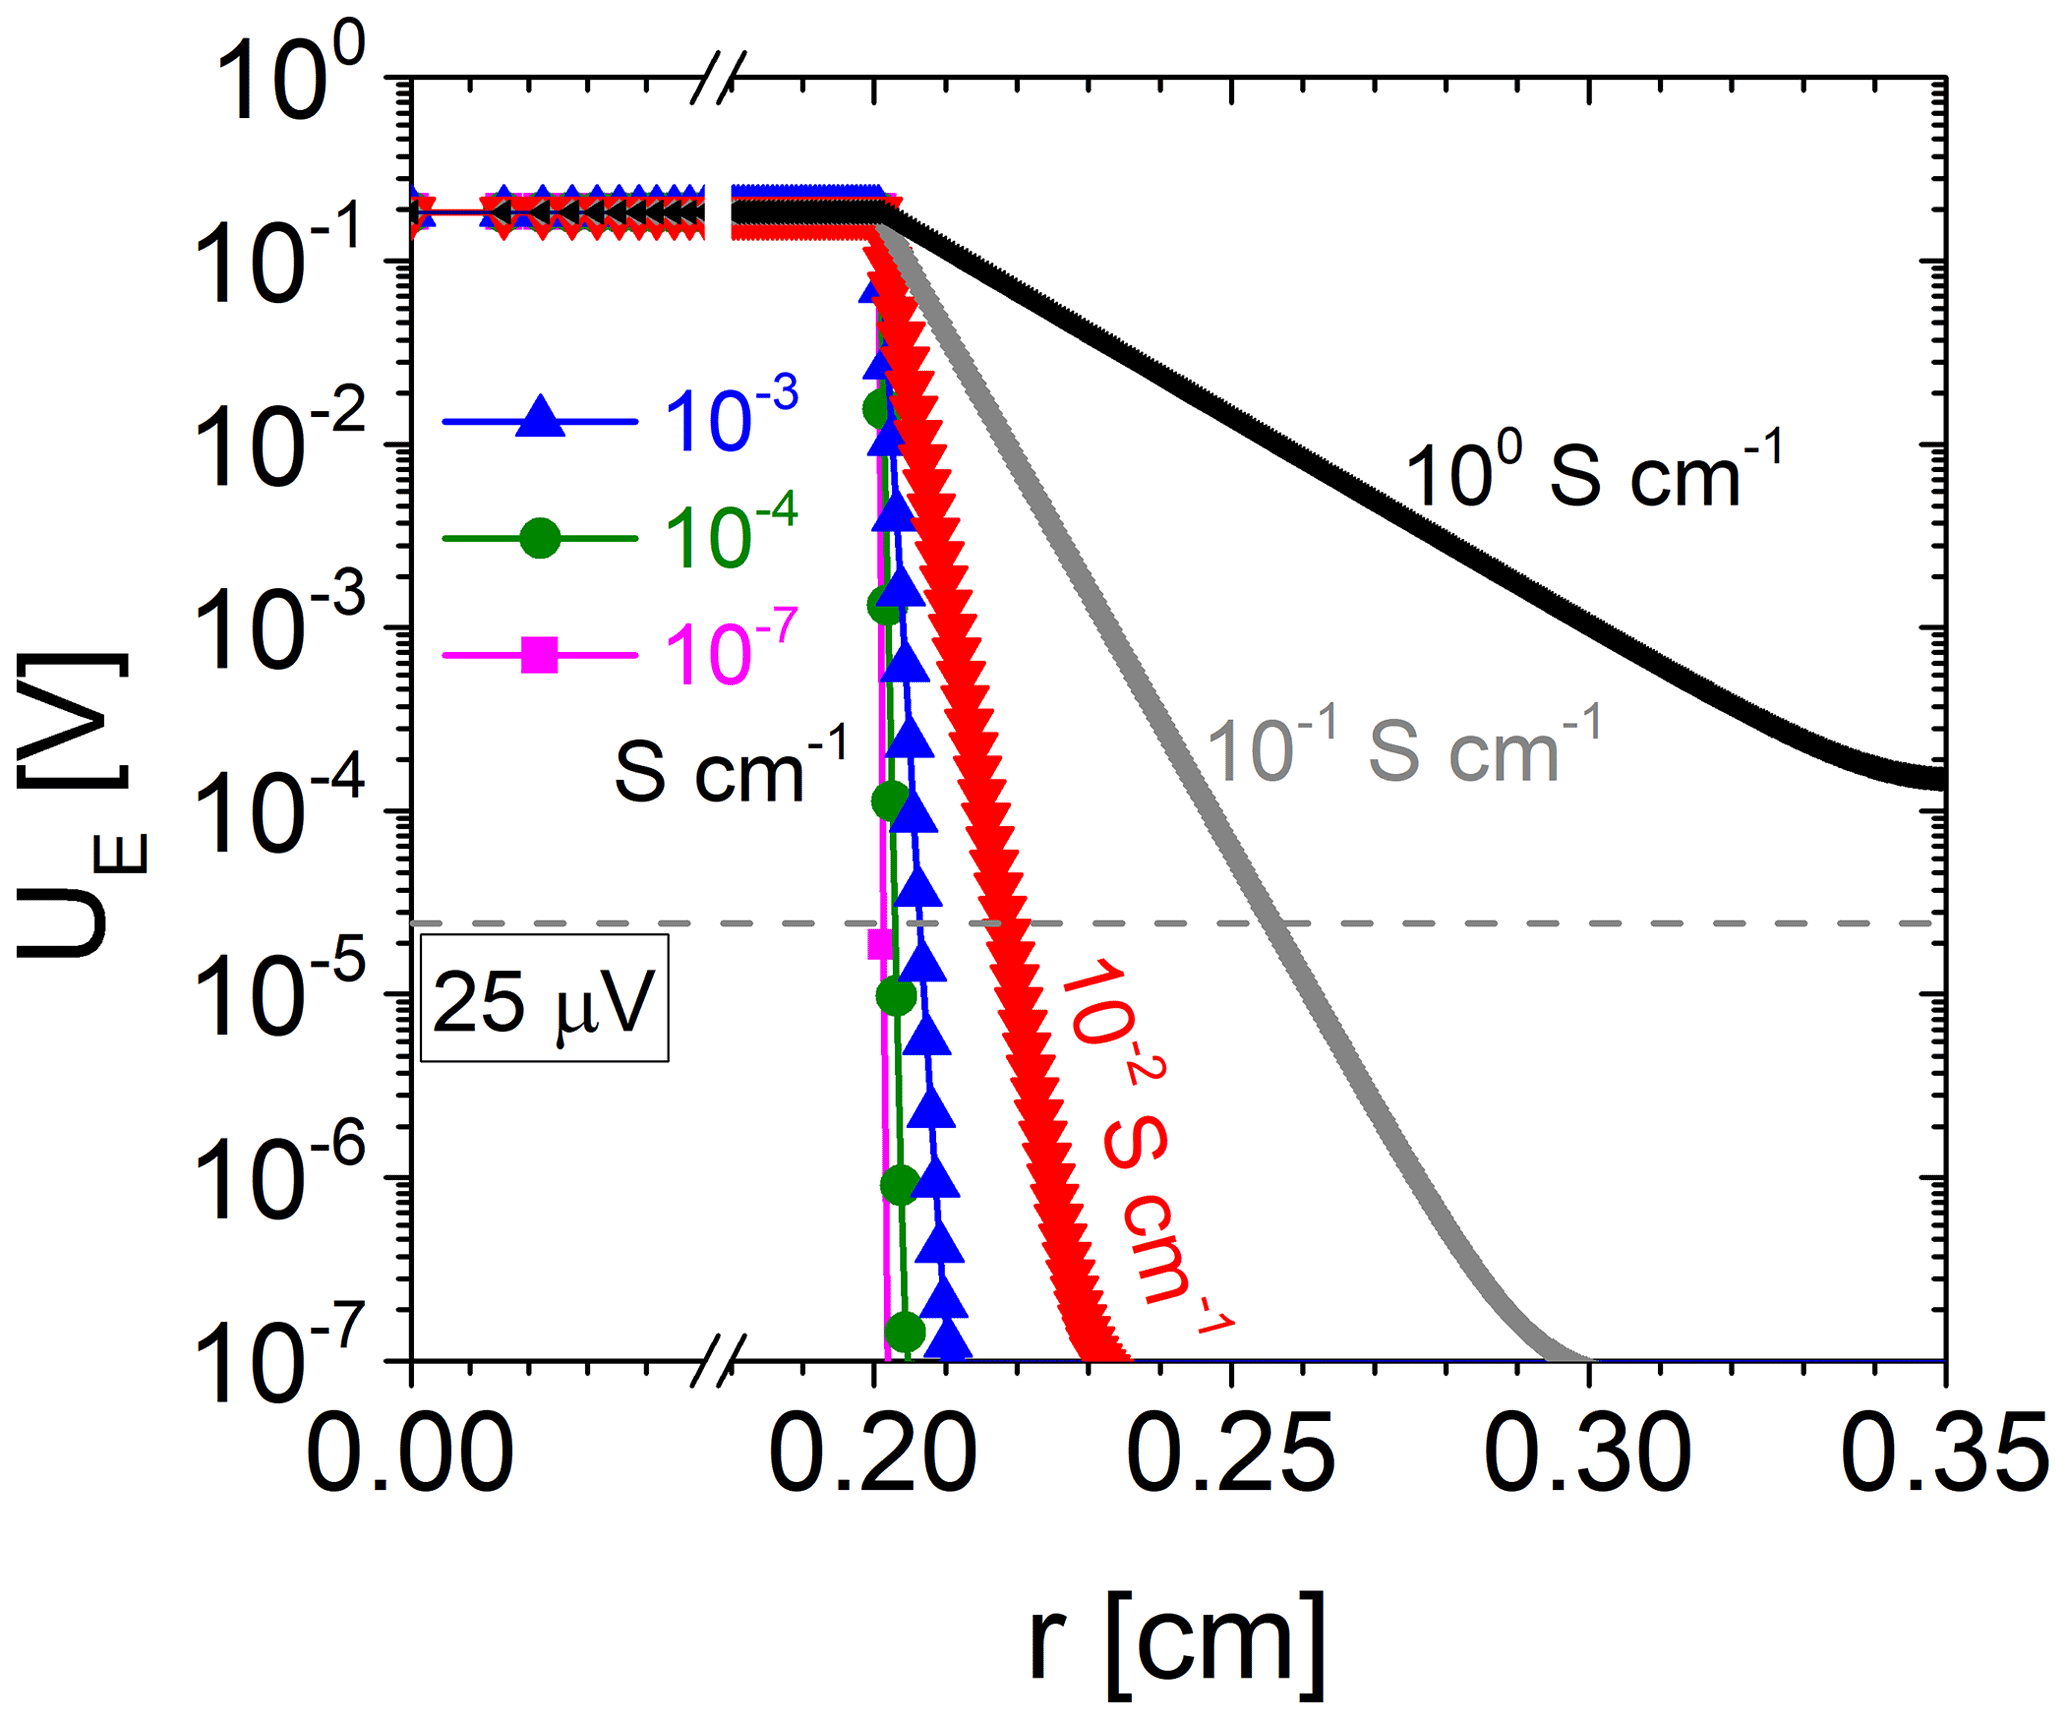
Figure 3Electrical excitation UE in dependence of the radius r. The Pt electrode radius is 0.2 cm.
2.3.2 Potential reasons for the resonance frequency shift
An increasing electrical excitation voltage due to increasing oxide electrode conductivity impacts the resonator in different ways. First and most obvious, it increases the effective electrode radius rR and influences the propagation of the shear wave outside the Pt electrode. Since the resonator volume underneath the oxide electrode starts to become electrically excited, piezoelectric stiffening occurs, and the eigenfrequency increases. Here, the eigenfrequency fE represents the free vibration of the resonators due to their material properties but without electrical connections. The upper indexes “F” and “Pt” denote the area underneath the oxide electrode and underneath the Pt electrode, respectively. The imaginary part of δ increases with increasing difference in and . The frequency shift corresponds to the coupling of the resonator areas underneath the metal and the oxide electrode. Accordingly, the inverse attenuation decreases or increases for the resonance frequency fR, which is lower or higher than , respectively.
Additionally, δ can take imaginary values. An increased effective electrode radius rR changes the radial distribution of the mass sensitivity Sm, as mentioned in Sect. 2. Given the inhomogeneous (radial) mass distribution due to the heavy Pt electrode, the resonance frequency fR shifts to lower values.
Second, the piezoelectric stiffening itself impacts the resonance frequency directly. The polarization of the piezoelectric crystal depends on the strength of the electric field. It is inhomogeneous at low oxide electrode conductivity due to the different radii of the front and back Pt electrode. With increasing oxide electrode conductivity, the electric field strength becomes more homogeneous over the total excited resonator volume. Therefore, the effect of piezoelectric stiffening might change because there is no piezoelectric stiffening of the shear modulus without an electrical field. The impact of piezoelectric stiffening on the resonance frequency is known for quartz resonators in contact with conductive liquids (Johannsmann et al., 2009; Shana and Josse, 1994).
Third, an increased electrical excitation outside the Pt electrode changes the electrode size of the resonator and, thereby, the effective piezoelectric coupling coefficient . Nevertheless, the (series) resonance frequency is neither affected by the electrode area nor by the bulk capacitance at a homogeneous mass distribution (Fritze, 2011a). Consequently, is not affected by . Furthermore, the increase in the oxide electrode conductivity increases the area of the bulk capacity CB (see Sect. 2), which affects the propagation of the shear wave outside the Pt electrode and the width of the electrical excitation because of energy trapping.
Fourth, since the resonator volume underneath the oxide electrode is excited to shear vibrations too, the resonator can be subdivided into two oscillators that show, in general, different properties leading to different frequencies. One represents the volume underneath the Pt electrode with the eigenfrequency and the other underneath the oxide electrode with the eigenfrequency . The resonance frequency fR of the coupled system lies between and . With increasing electrical excitation, the properties of the oscillator underneath the oxide electrode changes with respect to the excited area or the extent of piezoelectric stiffening. This increases the eigenfrequency and, consequently, the resonance frequency fR.
3.1 Sample preparation and characterization
The y-cut CTGS and LGS single crystals are purchased from Fomos Materials (Russia). They have a diameter of 10 mm and a thickness of about 230 to 290 µm, resulting in a resonance frequency of 4.8 o 6.0 MHz. Their surface roughness is of the order of few microns. Therefore, they are polished on both sides in four steps of 10 min each, using 15, 6, 3, and 1 µm diamond polishing paste (MetaDi II, Buehler, USA) and the corresponding lubricant (MetaDi Fluid, Buehler, USA). After polishing, the surface roughness is less than 5 nm.
As the electrical conductivity and resonance frequency of the CTGS single crystals drifts slightly at 1000 ∘C within the first 200 h (Suhak et al., 2016), the CTGS single crystals are thermally stabilized at 1100 ∘C for 264 h in ambient air.
Two different kinds of Pt electrodes are applied. First, screen-printed Pt electrodes are applied using lead-free Pt print ink (no. 6412 0410, Ferro Corporation, USA). They are fired at 1000 ∘C for 1 h in air. Second, thin Pt electrodes are prepared by pulsed laser deposition (PLD). The top and bottom electrodes of a resonator are always prepared by the same manufacturing process. The oxide electrodes are deposited via PLD. Electrode dimensions of the Pt and oxide electrode are determined using centred shadow masks, which have manufacturing tolerance of ca. 0.02 mm. Therefore, top and bottom electrodes are well aligned. Thus, influences of a potential misalignment on the resonance frequency shifts are negligible. For PLD, a krypton fluoride (KrF) excimer laser with a wavelength of 248 nm (COMPex 205, Coherent Inc., USA) is used. Depositions of Pt, TiO2-δ and SnO2 are performed in a vacuum at a pressure of mbar. The repetition rate is 30 Hz for Pt and 10 Hz for TiO2-δ and SnO2, respectively. The pulse energies are 350 and 200 mJ, respectively. PLD targets for the oxide electrodes are prepared by isostatic pressing of high-purity powder of SnO2 (99.90 %, Alfa Aesar, Germany) and TiO2 (99.99 %, Sigma-Aldrich, Germany) and sintering them in air. Thereby, the temperature is increased by 3 K min−1 up to 1100 ∘C and 1 K min−1 up to 1300 ∘C. Then, the temperature is decreased to room temperature with the same cooling rates and no dwell time. After the film deposition, resonators are heated up to 1000 ∘C in air to equilibrate the oxygen content in the oxides and to reduce thin-film stress.
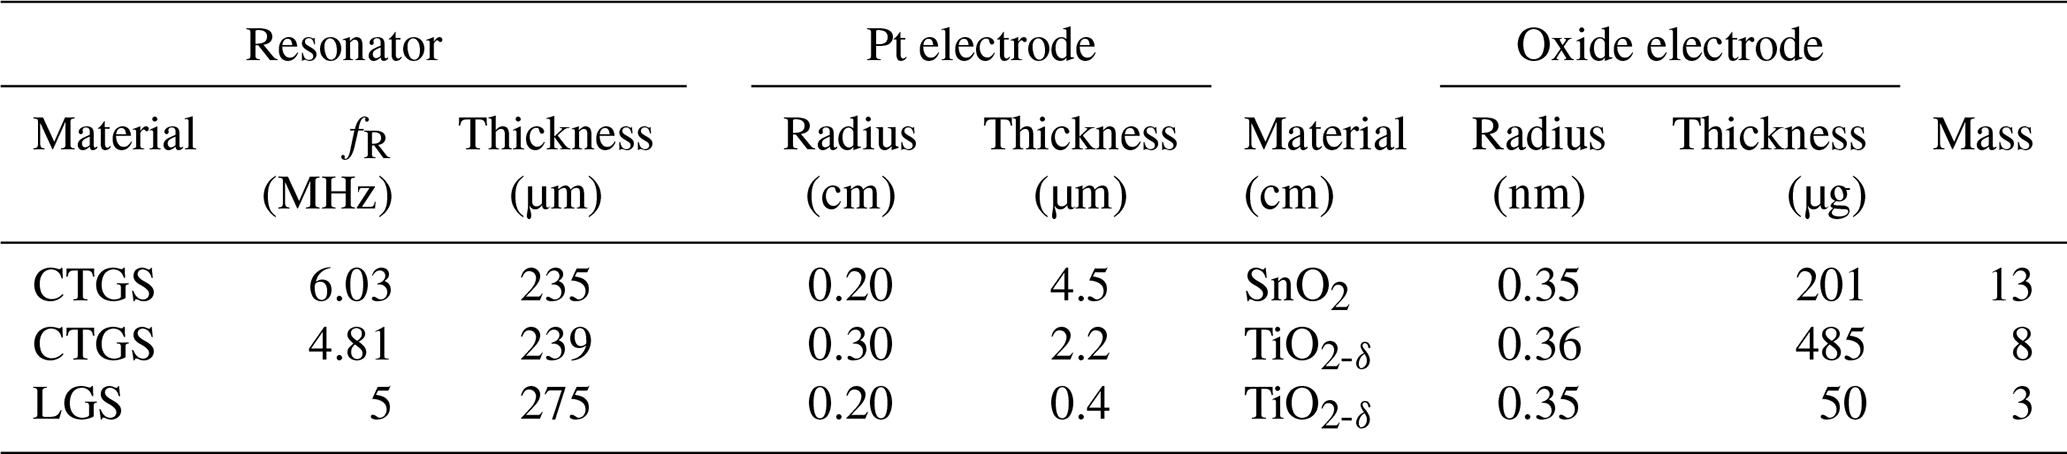
Film thicknesses are measured by profilometry using a tactile profilometer (XP-2, Ambios Technology Inc., USA). The film masses of the SnO2 and TiO2-δ oxide electrodes are calculated by determining the resonance frequency fR of the resonator prior to and after the film deposition and applying the Sauerbrey (1959) equation (see Eq. 4). The resonance frequency fR is determined by measuring the impedance using a high-speed network analyser (E5100A, Keysight Technologies, USA) and fitting a Lorentz function to the conductance peak. Table 1 summarizes the properties of the resonators used, including the metal and oxide electrode dimensions. The experimental data of the LGS resonator are already published in Fritze et al. (2005). However, they are used here for further interpretation using the models presented in the previous sections.
3.2 Experimental set-up
All measurements are performed in a gas-tight tube furnace. The samples are mounted in an aluminium holder, which is installed in a stainless-steel chamber containing gas-tight electrical feedthroughs. The electrical connections of the samples are realized by mechanically clamping the sample's electrodes to Pt sheets. The Pt sheets and electrical feedthroughs are connected with Pt wires. Up to six samples can be installed at once and measured simultaneously under virtually identical conditions. In addition, a thermocouple type S is installed in the vicinity of the samples and a Pt100 element at the electrical feedthroughs inside the chamber to monitor the temperature at the reference junction of the thermocouple. The thermoelectric voltage and resistance of the Pt100 are measured with a digital multimeter (DVM2000, Keithley Instruments, Tektronix, Inc., USA) and converted to a temperature using (inverse) temperature coefficients from National Institute of Standards and Technology (NIST; ITS-90 Thermocouple Database) for the thermocouple and DIN IEC 751 for the Pt100, respectively. The oxygen partial pressure () inside the furnace is measured using a lambda probe (flue gas probe, ZIROX – Sensoren und Elektronik GmbH, Germany), which is placed at a distance of approximately 0.5 cm to the samples. The measured potential UN is converted into using the Nernst equation in Eq. (20).
In Eq. (20), R, T, F, and are the universal gas constant, temperature (given in Kelvin), Faraday constant, and reference oxygen partial pressure, respectively. Here, the ambient air at 0.208 bar is used as a reference . Furthermore, control of the is done using an oxygen ion pump. Details are presented elsewhere (Schulz et al., 2012). The gas supply is realized using four mass flow controllers (MFCs, G-Series, MKS Instruments, USA). For control, a mixture of 0.5 % (purity of 99.996 %, Linde plc, Germany) is used.
Alternatively, the use of oxide electrodes for gas-sensing applications is investigated using CH4 containing atmospheres. Target gas concentrations of CH4 are adjusted by the subsequent dilution of the initial mixture of 5 % CH4 in Ar. Pure Ar (99.996 %) is used as diluent. Always, a total gas flow of 20 cm3 min−1 is maintained. Note that the complete exchange of the furnace atmosphere nominally takes 25 min if the furnace volume is divided by the gas flow rate. In practice, an advancing mixing and replacement of the gas in the furnace occurs, so that the complete gas exchange needs more than 25 min.
3.2.1 Minimum voltage to excite shear vibration of a 5 MHz CTGS resonator
The minimum required voltage to excite shear vibrations is tested at room temperature in air using a 5 MHz CTGS resonator operated without an oxide electrode. Measurements of the impedance in the vicinity of the mechanical resonance are performed using an impedance/gain-phase analyser (SI 1260, Solartron Analytical, UK) for excitation voltages between 1.5 µV and 16.6 mV. Figure 4 shows the electrical circuit of the experimental set-up. The resistance R1 is 1 MΩ. R2 is varied from 1 kΩ to 1 MΩ. The impedance spectra in the vicinity of the resonance are calibrated using a three-point calibration scheme (Keysight Technologies Inc., 2015), with an open and short circuit and a load resistance of 47.3 Ω.
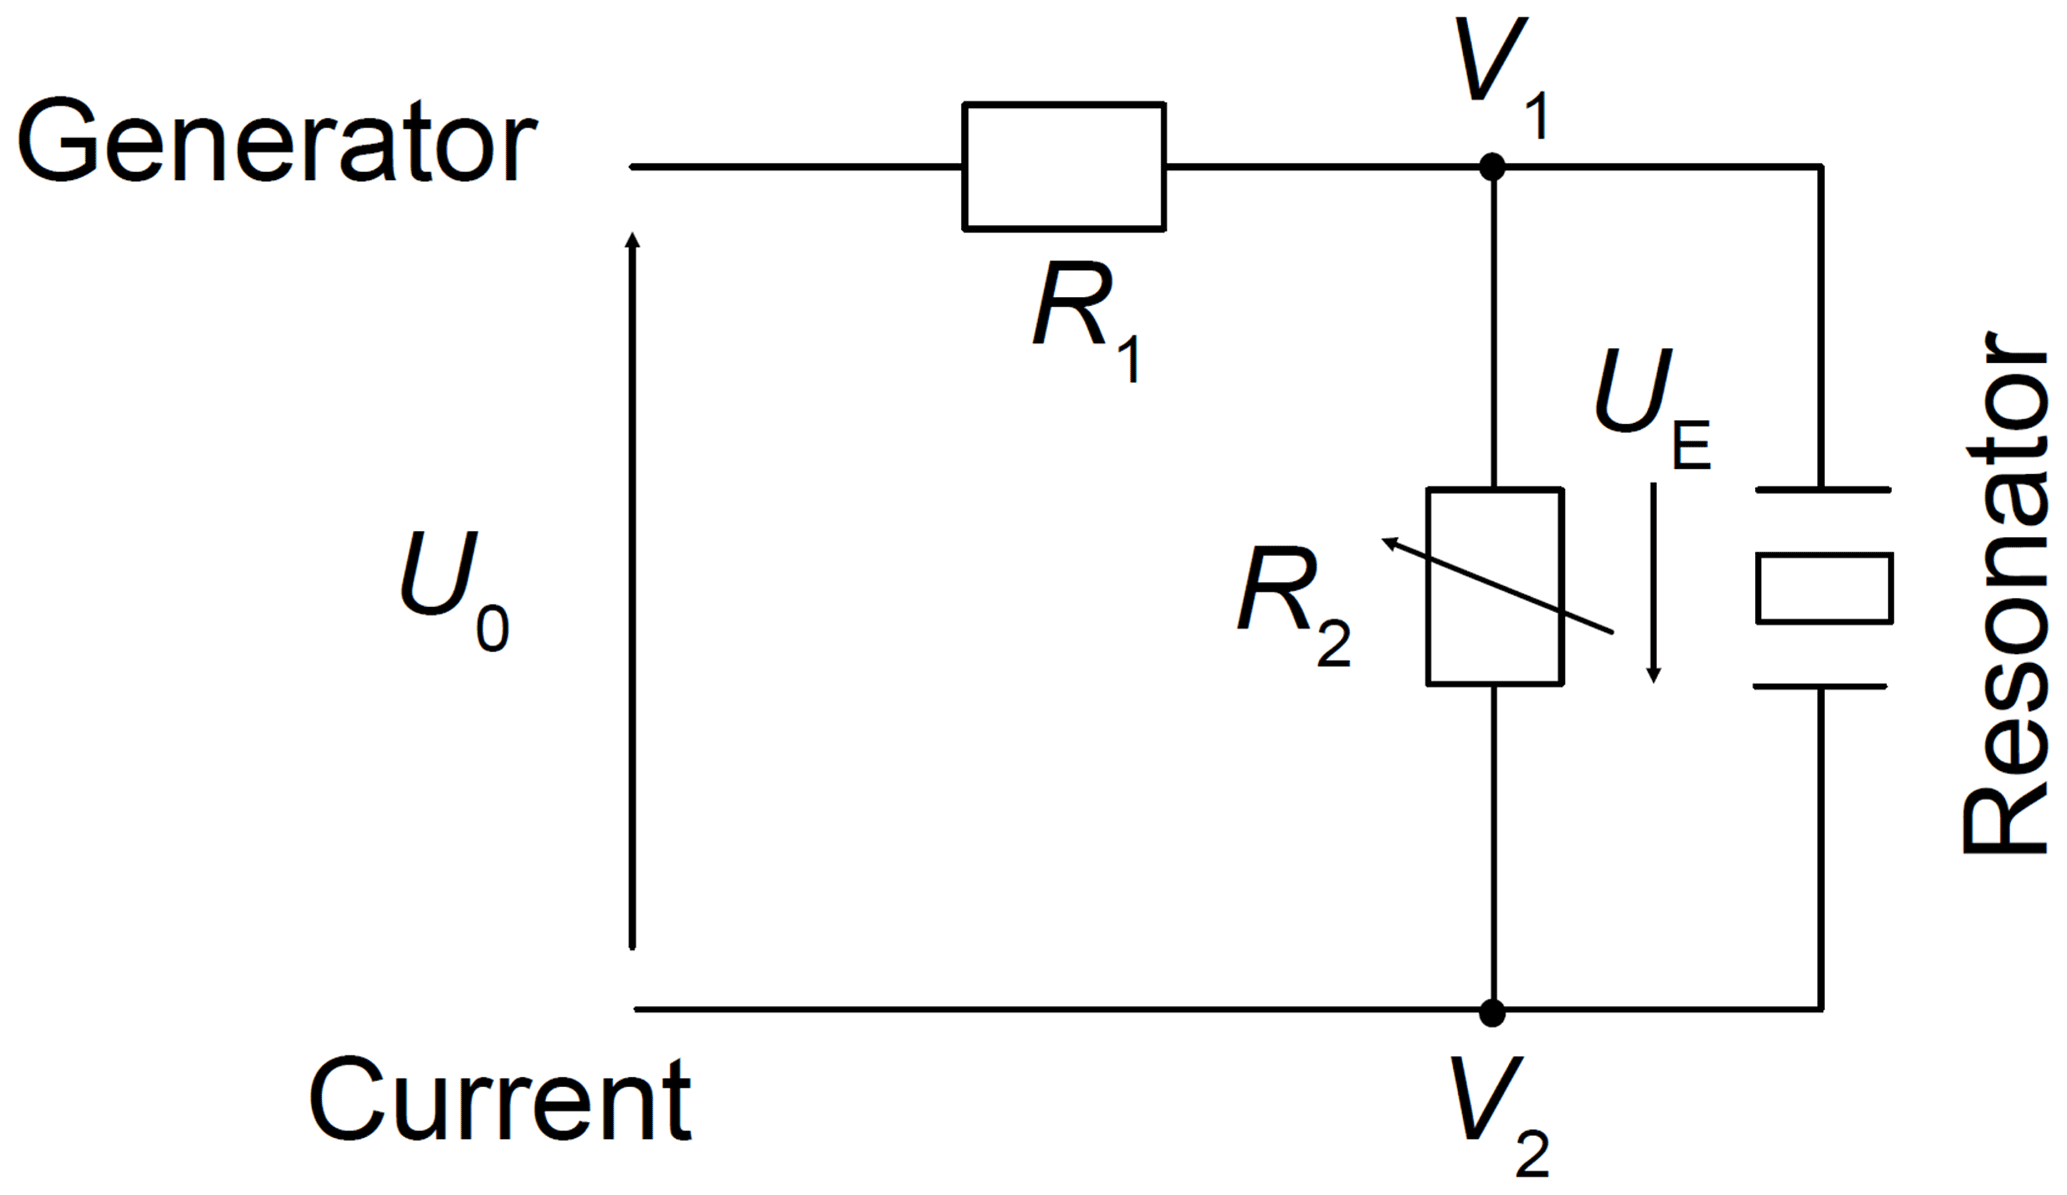
Figure 4Electrical circuit to excite TSM vibrations with low voltages (µV to mV) and to evaluate the impedance spectra in the vicinity of the resonance of a 5 MHz CTGS resonator. A Solartron SI 1260 impedance/gain-phase analyser is used for the electrical excitation and the impedance measurement.
3.2.2 Conductivity measurements of TiO2-δ thin films
About 5 µm thick TiO2-δ films are deposited via PLD on substrates consisting of screen-printed Pt electrodes on sapphire single crystals (SG-10x0.8, SITUS Technicals GmbH, Germany) and used to determine their electrical conductivity. Figure 5 shows the sample layout. The width b of the TiO2-δ thin film is about 6 mm. The distance of the electrodes l is about 3 mm. The sample is connected to an impedance/gain-phase analyser in combination with a dielectric interface (SI 1260 and SI 1296, both Solartron Analytical, UK) and heated to 850 ∘C. Impedance spectra are acquired in the frequency range from 10 Hz to 1 MHz and used to determine the electrical conductivity σ by fitting an electrical circuit (EC) model to the impedance data. The EC consists of the bulk resistance RB in parallel to constant-phase element (CPE). In addition, a lead resistance RL is connected in a series. Finally, Eq. (21) is used to convert the bulk resistance of the sample RB to σ.
In Eq. (21), dF is the thickness of the TiO2-δ thin film. The oxygen partial pressure is varied between 10−19 and 10−3 bar.
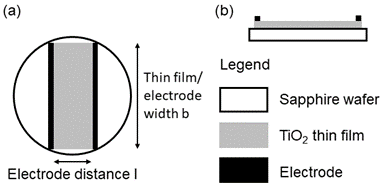
Figure 5Schematic of the samples used for conductivity measurements of TiO2 thin films. (a) Top view. (b) Side view.
3.2.3 Resonance frequency shift ΔfR in dependence of oxide film conductivity
Resonance frequency shifts ΔfTC are measured between 600 and 700 ∘C and oxygen partial pressures between 10−0.67 and 10−20 bar. The resonance frequency in an Ar atmosphere with is used as reference, and ΔfTC is defined by Eq. (22). Each atmosphere is maintained for at least 5 h so that equilibrium is expected to be approached.
4.1 Minimum excitation voltage
Figure 6 shows the conductance spectra in the vicinity of the resonance frequency of a ∼5.6 MHz CTGS resonator with Pt electrodes only. Three different excitation voltages are applied, i.e. 1.5 µV, 1.7 mV, and 16.6 mV. Obviously, the conductance shows no significant differences. Therefore, it can be concluded that a voltage of 1.5 µV is sufficient to excite shear vibrations, but the minimum excitation voltage could be lower than 1.5 µV. Furthermore, the resonance frequencies determined here significantly exceed the resonance frequency calculated with Eq. (1) using the shear modulus c66 by 131 kHz. Therefore, piezoelectric stiffening should occur, even for the lowest tested excitation voltage of 1.5 µV. However, the minimum excitation voltage depends on resonator parameters, e.g. the effective electromechanical coupling coefficient or the quality factor. Consequently, these observations are valid for the specific resonator tested here. For a 5 MHz CTGS resonator operated with an oxide electrode, a voltage of 25 µV is determined in a similar way and found to be sufficient for excitation of shear vibrations (not shown).
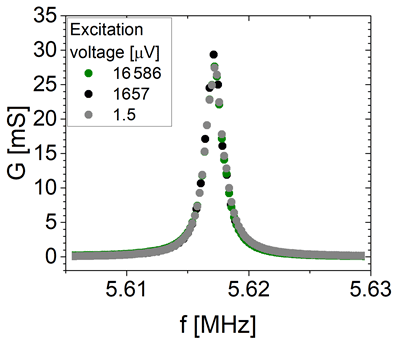
Figure 6Conductance G of a ∼5.6 MHz CTGS resonator in the vicinity of the resonance for different excitation voltages.
4.2 Conductivity of TiO2-δ thin films
The dependence of the electrical conductivity of TiO2-δ is shown in Fig. 7. For . In the log–log plot, a slope of (minus one-fourth) is observed. This is in agreement with the literature data and the predicted defect model for pure TiO2-δ (Balachandran and Eror, 1988; Nowotny et al., 2008). The increase in conductivity is due to a defect equilibrium between the titanium [] and the oxygen vacancy concentration [] (Nowotny et al., 2008). The charge neutrality is given by the following:
which is in Kröger–Vink notation and leads to the observed relationship . For , the defect equilibria changes and should result in a dependency of (Nowotny et al., 2008). In contrast, a slope of is tentatively found. The observation is based on two data points only, which makes the statement uncertain. However, at 850 ∘C, the transition to another defect equilibria with dominating electrons as charge carriers takes place in the range of (Balachandran and Eror, 1988). Therefore, the observed slope of in the intermediate range is reasonable.
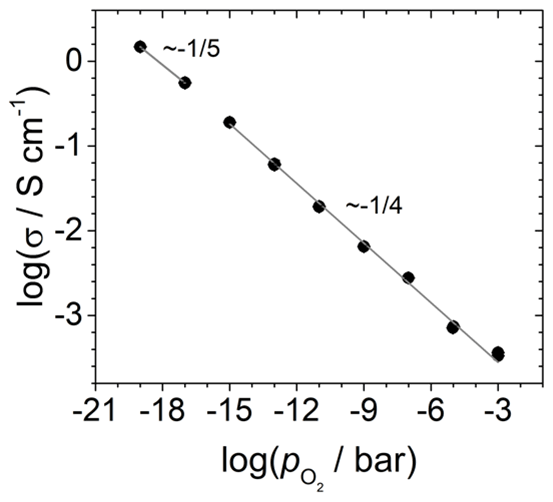
Figure 7Electrical conductivity of a TiO2-δ thin film at 850 ∘C in dependence of oxygen partial pressure.
4.3 Effective electrode radius and resonance frequency shift in the langasite resonator coated with thin electrodes and a TiO2-δ oxide electrode
In this section, impedance data related to atmosphere-induced resonance frequency shifts in the LGS resonator are considered using the electrical circuit model presented in this article. The measurement is performed at 600 ∘C. An electrical conductivity of 2.11 S cm−1 at is used for calculations of the electrical excitation. It is worth noting that the electrical conductivity of LGS at 600 ∘C can be considered independent of the down to 10−21 bar (Fritze, 2011b).
The extended BvD EC is fitted to the impedance data to calculate the resistances (Rm, RB), capacitances (Cm, CB), and inductance (Lm) as a function of . The values are correlated with the effective area for the individual lumped elements. Based on these results, the effective electrode radii and the resonance frequency shifts are calculated using Eqs. (5)–(10).
Data for Cm and CB are used to calculate the effective electromechanical coupling coefficient . To do this, Eq. (3) must be modified for TSM resonators with the electrode layout presented in Fig. 1. In particular, the areas of the capacitors Cm and CB are not equal at elevated temperatures. Therefore, the effective electromechanical coupling coefficient is assumed to be as follows:
which includes the areas related to the capacitances Ci. The fit data for Cm and CB and the corresponding radii are used to calculate the areas and via the relation and, finally, . There is an obvious dependence of defined here on the and, therefore, on the electrical conductivity of the TiO2-δ oxide electrode. The results are shown in Fig. 8. The change in starts below about 10−15 bar, which coincides with the observed resonance frequency shift (Fritze et al., 2005).
Table 2Material constants to calculate κi, ξi and mi for the mechanical model of the TSM resonator operated in conductivity mode. The effective thicknesses are calculated using and the properties of the electrode (el) or TiO2-δ sensor film (F).
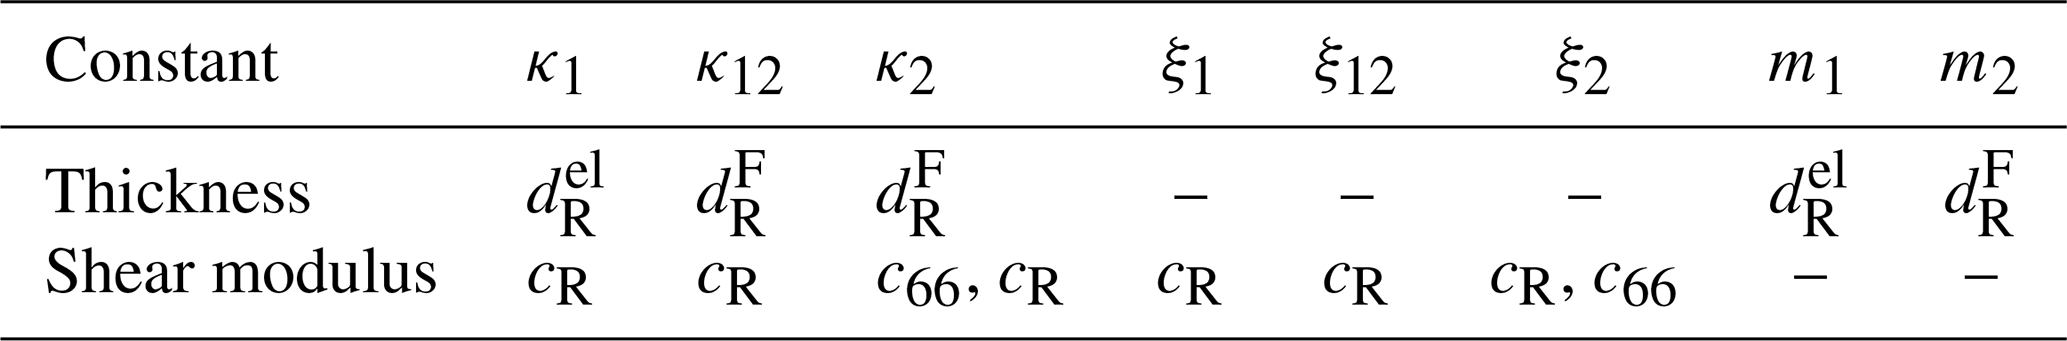
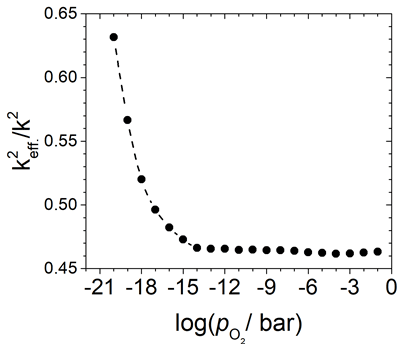
Figure 8Change in the effective electromechanical coupling coefficient in dependence of the oxygen partial pressure for a 5 MHz langasite resonator coated with a TiO2 sensor film and operated in conductivity mode at 600 ∘C. Calculated from the ratio of the capacities Cm and CB and data from Fritze et al. (2005).
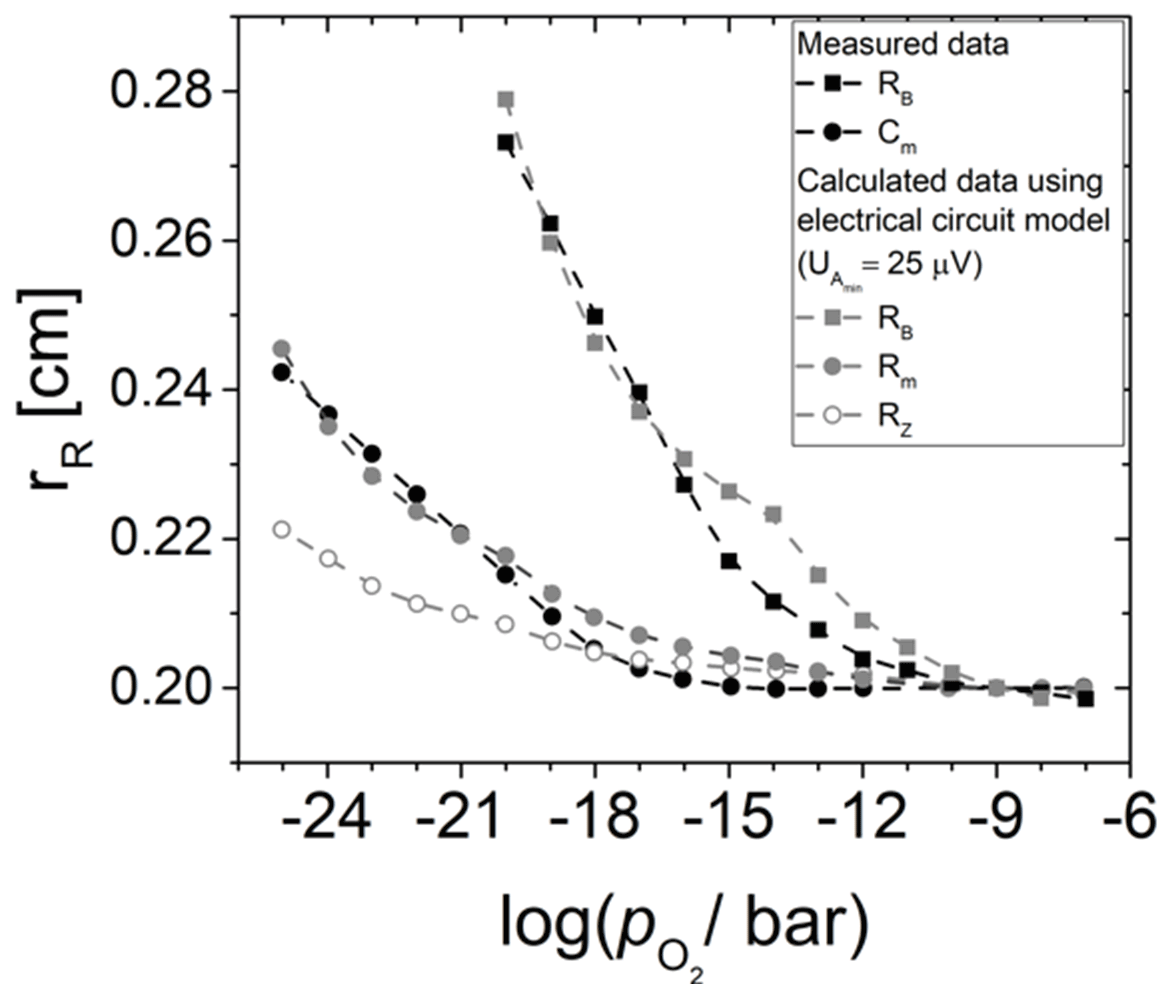
Figure 9Effective electrode radius rR of different lumped elements of the BvD EC in dependence of the oxygen partial pressure . Measured data from Fritze et al. (2005) are compared to calculations using different resonator resistances RRes. In addition, rR for the real part of the impedance at the resonance frequency is shown.
Subsequently, the dimensions and the material properties of the LGS resonator and the electrical conductivity of the oxide electrode at a specific oxygen partial pressure are used to calculate the effective resonator radius based on the electrical circuit model for the electrode layout presented in this study. Three resonator properties are used for discussion of its relation to the electrode conductivity.
-
The bulk resistance of the resonator RB.
-
The motional resistance Rm.
-
The real part of the impedance of the BvD EC at the resonance frequency RZ.
Furthermore, and with i=B, m, and Z are chosen for resistance underneath and outside the Pt electrode. The different resistances follow from the fact that these two regions do not have the same eigenfrequencies due to different mass loading and piezoelectric stiffening. Here, it is noteworthy that (Fritze et al., 2005). The resulting radii rR for the three different resonator properties shown in Fig. 9 are in quite good agreement with the data. The main errors causing the difference between measured and calculated data, especially at higher ( bar), are the uncertainties in the metal and oxide electrodes radii during sample preparation (ca. 0.1 mm) and the uncertainty in the electrical conductivity of the TiO2-δ electrode material. The latter depends on a variety of parameters, e.g. grain size or impurities. Therefore, values are taken for a TiO2-δ thin film prepared in a similar way (Richter, 2010).
Finally, the calculated effective electrode radii are used to calculate the resonance frequency shift ΔfR using Eq. (10). The results are presented in Fig. 10. It was observed that rR of Cm matches the measured resonance frequency shift fairly, but based on these calculations, the dependence of ΔfR is reflected more accurately by the rR of RZ. The origin of the resonance frequency shift is the increasing effective mass of the Pt electrode.
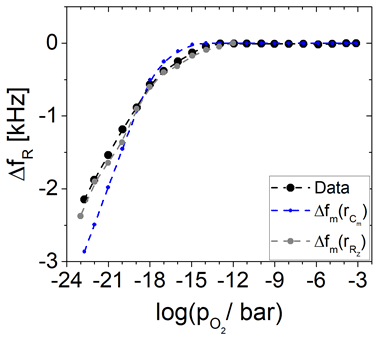
Figure 10Resonance frequency shift ΔfR in dependence of the oxygen partial pressure . Measured data (black) from Fritze et al. (2005) are compared to calculated data using the effective electrode radius of the capacitance Cm (blue) and the real part of the impedance in resonance RZ (grey).
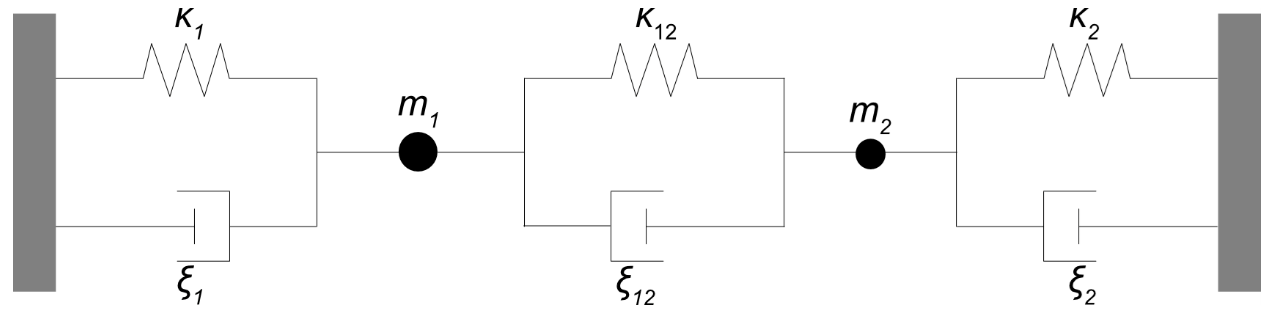
Figure 11Mechanical representation of a TSM resonator operated at increased oxide electrode conductivity.
4.4 Mechanical model to estimate the impact of the oxide electrode
Figure 11 shows the mechanical representation of the resonator operated at high oxide electrode conductivities. It consists of two mechanical oscillators, i.e. the resonator volume underneath the metal (index 1) and oxide (index 2) electrode. They are connected via a parallel arrangement of a spring and a damper (index 12). The corresponding spring constants κi, damper coefficients ξi, and masses mi are calculated using Eqs. (13)–(15). The symbols of the material parameters for calculation of the mechanical model parameters are summarized in Table 2. The equations of motion for the masses m1 and m2 are given by Eqs. (25) and (26).
with the amplitude of the shear wave ui and the external forces Fi caused by the electrical excitation (Bower and Qi, 2011). For oscillator 1, F1 can be considered constant, but for oscillator 2, F2 depends on the electrical excitation as a function of the oxide electrode conductivity. Therefore, calculations are performed for an average force . The forces Fi can be calculated using Eq. (27) (Steinem and Janshoff, 2007) and the average electrical excitation voltage of the metal and oxide electrode, respectively.
The steady-state vibration response for the equations of motion can be found by assuming that the masses m1 and m2 vibrate harmonically at the same frequency as the forces Fi and choosing the following approach (Bower and Qi, 2011):
with the angular frequency ω and time t. In addition, harmonic forces Fi are assumed.
Calculated mechanical impedance spectra without and with increased effective electrode radius rR of the resonator and presence of piezoelectric stiffening for m2 are shown in Fig. 12. Calculated amplitudes in resonance are about 0.26 nm, which is in general agreement with experimental data of 0.15 nm (Schmidtchen, 2013a), for an electrical excitation of about 0.2 V. Note that the resonance quality factor, which differs for both resonators, impacts the amplitude. At increased rR, there are two resonance peaks in total. To determine the resonance frequency from the mechanical impedance spectra, a Lorentz function is fitted to the data in a range of ±1 kHz around the resonance peak.
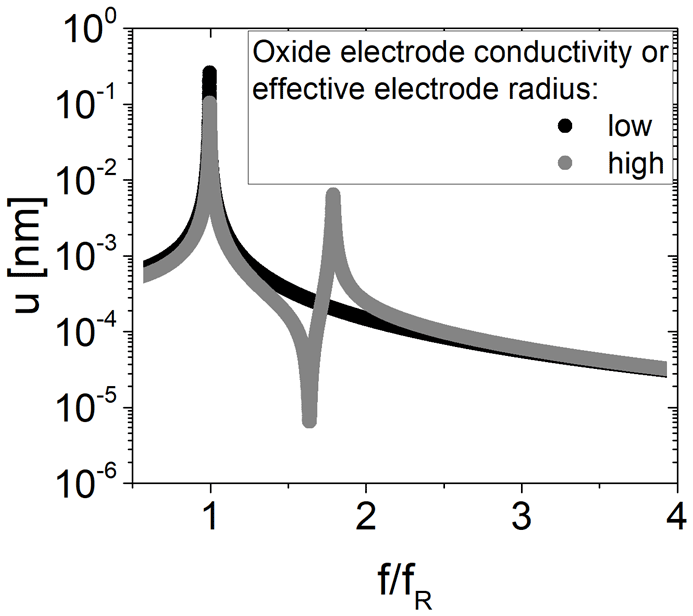
Figure 12Mechanical impedance spectra for a TSM resonator operated with an additional oxide electrode for low (black, fR=4 910 928 Hz) and high (grey, fR=4 909 035 Hz) oxide electrode conductivity. The oxide electrode conductivity is representative of the effective electrode radius.
The first peak belongs to m1 and is slightly higher compared to this eigenfrequency (4 910 928 Hz). The second peak belongs to m2 and is about 1.79 times . It depends on the spring constant κ2 and mass m2. Because of the low mass m2 for the conditions chosen for calculation, the second resonance peak occurs at such high values. However, the eigenfrequency of oscillator 2 is 4 986 512 Hz. Furthermore, an anti-resonance peak occurs in between, at about 1.63 times . In this study, the focus is on the shift in the resonance frequency of mass m1. Therefore, the mechanical model is used to discuss the impact of an increasing effective electrode radius rR and increasing piezoelectric stiffening on the resonance frequency fR. The results are shown in Fig. 13 and are restricted to the resonator parameter used for the calculation (see Table 2).
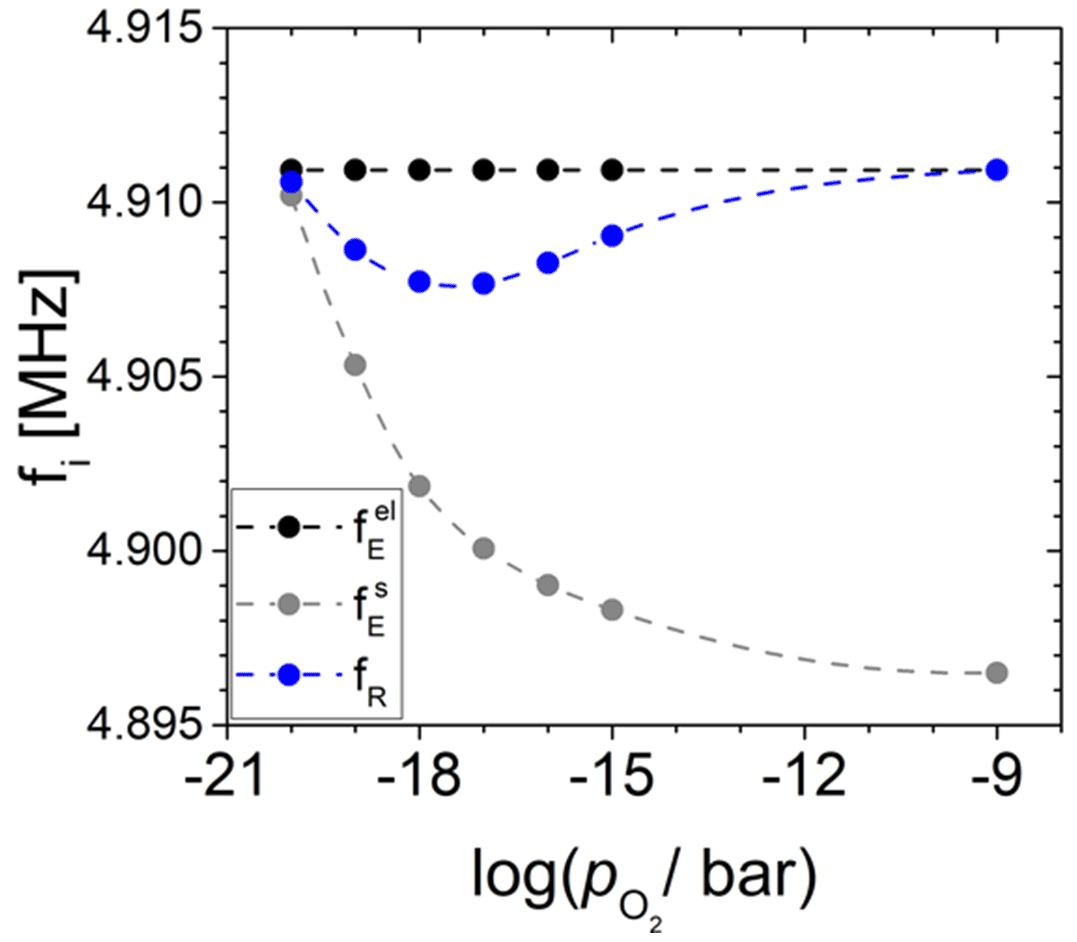
Figure 13Change in the resonance frequency (fR) and eigenfrequencies underneath () and outside () the Pt electrode calculated in dependence of the oxygen partial pressure () for the langasite resonator at 600 ∘C, as discussed in Sect. 3.4.
First of all, at high or low electrical conductivity, the eigenfrequency at the oxide electrode is much less than . With decreasing and increasing electrical conductivity of the oxide electrode, the resonance frequency fR is affected by two effects. First, the increasing effective electrode radius rR increases the mass m2. Consequently, the impact of the oscillator 2 on fR increases. Second, itself is expected to increase due to increasing piezoelectric stiffening. Moreover, the increase in piezoelectric stiffening at the oxide electrode is expected to equally increase the effective piezoelectric coupling coefficient . Nevertheless, for the conditions chosen in this study, always applies.
The resonance frequency fR always lies between and . In this study, is nearly constant, and increases below 10−14 bar with further decreasing (see black and grey data in Fig. 12). At small effective electrode radii or low electrical conductivity of the TiO2-δ electrode ( bar), respectively, the increasing impact of the mass m2 is dominant and, because , fR starts decreasing. At about 10−16 bar, the situation changes. The effect of increasing due to piezoelectric stiffening impacts fR more significantly, which leads to an increase in fR with a further decrease in . The maximum resonance frequency shift at the minimum resonance frequency fR is approximately −3 kHz.
4.5 Application example
The electrode layout presented in this study could be used for gas-sensing applications at high temperatures. Two examples are presented, where the increase in oxide electrode conductivity caused by an increase in gas concentration (e.g. 0 to 400 ppmV CH4, where ppm is parts per million) or decrease in (e.g. 10−12 bar down to 10−15 bar), respectively, impacts the resonance frequency. For both application examples, the respective oxide film and platinum electrode thicknesses are given in Table 1. First, the resonance frequency shift for a TiO2-δ oxide electrode at 700 ∘C at different . Second, methane (CH4) induced resonance frequency shifts for a SnO2 oxide electrode at 600 ∘C. At these temperatures, the screen-printed Pt electrodes are thermally stable. During the measurements, no effect on resonance frequency must be expected since, even at 1000 ∘C, the resonance frequency shift in such CTGS resonators is less than 0.4 % within 8000 h (Suhak et al., 2018). Both oxide electrode materials increase their conductivity due to the release of oxygen ions (Balachandran and Eror, 1988; Alagdal and West, 2015). Nevertheless, the mass loss due to the oxygen non-stoichiometry is negligible (Lee et al., 2005; Alagdal and West, 2015), and their impact on the resonance frequency can be neglected. A prior publication of the authors (Fritze, 2011b) gives a more detailed evaluation of mass changes for comparable thin films. No resonance frequency shifts above 10−13 bar for H2-containing atmospheres and only 40 Hz for CO-containing atmospheres are detected, which is negligible with respect to the resonance frequency shifts in more than 1000 Hz observed in this study.
To verify that the CTGS resonators with electrodes and SnO2 or TiO2 films do not undergo degradation within the applied oxygen partial pressure range, the resonance frequencies at room temperature (23±1) ∘C after deposition but before the measurement and after the measurement cycles are determined. The difference is 2.5 ppm only and, thus, considered to be neglectable within the measurement errors, leading to the conclusion that no hysteresis and/or degradation occurs, and the oxide layers are not permanently altered during measurement.
4.5.1 TiO2-δ oxide electrode at 700 ∘C in atmospheres of adjusted oxygen partial pressures
Figure 14 shows the temperature-compensated resonance frequency and for a 5 MHz CTGS resonator coated with a TiO2-δ oxide electrode (ca. 485 nm). Furthermore, the electrical conductivity of the TiO2-δ film is visualized. A decrease in from 10−11 to 10−19 bar results in an increase in the electrical conductivity from 10−4 to 10−1.4 S cm−1. Simultaneously, a decrease in resonance frequency of ca. −1.6 kHz is observed. A strong correlation between resonance frequency and is obvious. Therefore, the TiO2-δ electrode might be used as a sensor for high temperatures. No attempt was made to evaluate the kinetics, since it is not clear whether it is determined by film diffusion/surface exchange processes or the gas supply (see Sect. 3.2).
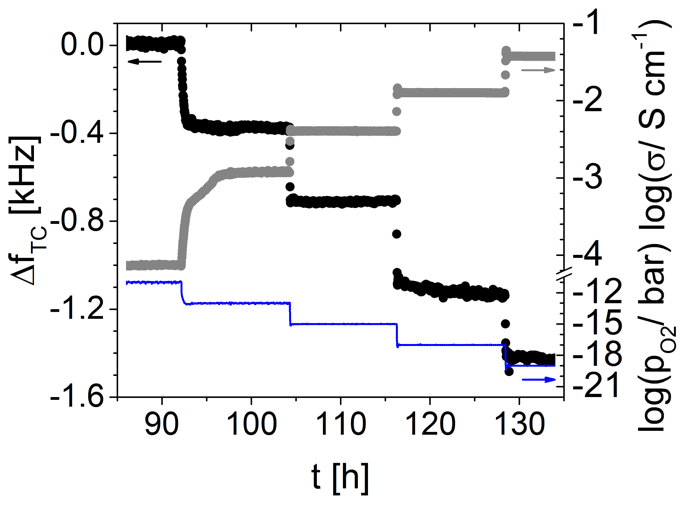
Figure 14Temperature-compensated resonance frequency of a 5 MHz resonator coated with a TiO2-δ oxide electrode, electrical conductivity of a TiO2-δ thin film, and adjusted oxygen partial pressure over time at 700 ∘C.
4.5.2 SnO2 electrode at 600 ∘C
The impact of different CH4 concentrations between 50 and 1500 ppmV on the resonance frequency of a 5 MHz CTGS resonator coated with a SnO2 electrode (201 nm) is tested at 600 ∘C. Results are shown in Fig. 15. Resonance frequency shifts ΔfTC by −1.1 kHz are observed (for resonator and electrode parameters see Table 1). For each tested CH4 concentration higher than 50 ppmV, the resonance frequency shift ΔfTC reach a nearly constant value and remain virtually unchanged for several hours. Therefore, the film is considered to be in equilibrium.
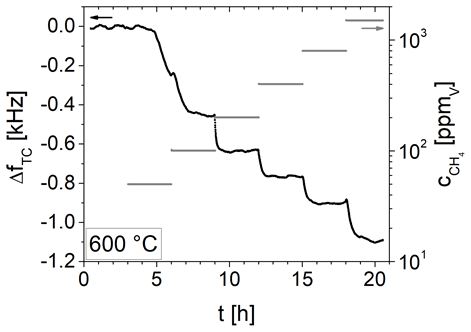
Figure 15Temperature-compensated resonance frequency shift in a 5 MHz resonator coated with a SnO2 electrode and corresponding change in methane concentration over time.
A strong correlation between ΔfTC and the CH4 concentration is obvious. Figure 16 shows ΔfTC in dependence of the CH4 concentration. With increasing CH4 concentration, the change in ΔfTC becomes somewhat lower. However, the data suggest that an even higher concentration could be detected with respect to the resolution of resonance frequency determination, which is about 4 Hz. Therefore, this resonator set-up can be used to detect CH4 at high temperatures in a wide concentration range from 100 ppmV, up to at least 1500 ppmV.
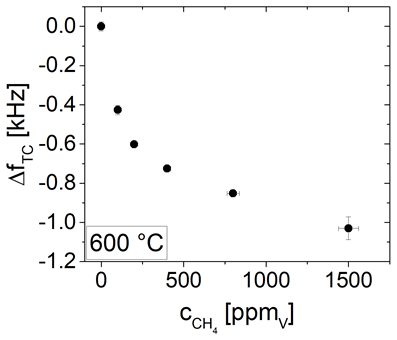
Figure 16Temperature-compensated resonance frequency shift in dependence of methane concentration for a 5 MHz resonator coated with a SnO2 electrode.
Ca3TaGa3Si2O14 and La3Ga5SiO14 y-cut single crystals with a diameter of 10 mm and a thickness of about 230 to 290 µm are operated as piezoelectric sensors. They are coated with platinum electrodes with different diameters at the top and bottom. In addition, a metal oxide electrode is deposited on the smaller electrode (see Fig. 1). As a result, the effective electrode radius of the resonator depends on the conductivity of the oxide electrode and impacts the resonance frequency of the device. An electrical circuit model to calculate the effective electrode radius of TSM resonators operated with an additional oxide electrode is presented. Using this model, experimental and calculated data for the effective electrode radius and resonance frequency shifts in a 5 MHz langasite resonator coated with thin metal and a TiO2-δ electrode show very good agreement. These results show, for the evaluated resonator, that the resonance frequency shifts are caused by the increasing mass sensitivity, i.e. the increasing effective mass of the Pt electrode. Furthermore, these results are helpful for applying and further optimizing the resonators for sensing purposes, which is demonstrated by the applications examples.
A simple mechanical model is used to estimate the impact of the effective electrode radius and piezoelectric stiffening at the oxide electrode on the resonance frequency. Using this approach in concert with the resonator parameters chosen in this study, it is found that an increase in piezoelectric stiffening at the oxide electrode leads to an increasing resonance frequency.
Finally, two application examples are presented. It is demonstrated how to detect the oxygen partial pressure and the CH4 concentration at temperatures up to 700 ∘C using TiO2-δ and SnO2 electrodes, respectively. The detection of CH4 is possible in a wide concentration range up to at least 1500 ppmV. Thereby, the sensitivity of the resonance frequency shift towards the CH4 concentration is in between 1 Hz ppm (100 ppmV CH4) and 0.25 Hz ppm (1500 ppmV CH4), leading to a gas concentration resolution of 1 and 16 ppmV, respectively, considering an uncertainty in the resonance frequency determination of 4 Hz. The detection of other gas species can be targeted by choosing other oxide electrode materials.
The data presented in this article are stored in internal systems, according to guidelines of the DFG. Data presented in Sect. 3.6 are stored in internal systems, according to confidentially agreement of the BMWi project KonAIR. Research data are available from the corresponding author upon reasonable request.
SSc was responsible for the sample preparation, characterization, experimental procedure, and calculations. HF initiated the research projects and supported SSc and HW with the data interpretation and discussion. HF and HW revised the paper. HF led the projects.
The contact author has declared that none of the authors has any competing interests.
Publisher's note: Copernicus Publications remains neutral with regard to jurisdictional claims in published maps and institutional affiliations.
The authors thank the Energy Research Centre of Lower Saxony (Energie-Forschungszentrum Niedersachsen, EFZN), for supporting this work.
This research has been supported by the Bundesministerium für Wirtschaft und Energie (grant no. 03ET1467B) and the Deutsche Forschungsgemeinschaft (grant no. FR 1301/20-2).
This open-access publication was funded by Clausthal University of Technology.
This paper was edited by Mervi Paulasto-Kröckel and reviewed by two anonymous referees.
Alagdal, I. A. and West, A. R.: Oxygen non-stoichiometry, conductivity and gas sensor response on SnO2 pellets, J. Mater. Chem. A, 3, 23213–23219, https://doi.org/10.1039/c5ta05818j, 2015.
Balachandran, U. and Eror, N. G.: Electrical conductivity in non-stoichiometric titanium dioxide at elevated temperatures, J. Mater. Sci., 23, 2676–2682, https://doi.org/10.1007/BF00547436, 1988.
Bower, A. and Qi, Y.: Dynamics and Vibrations: Notes: Multi-DOF vibrations, https://www.brown.edu/Departments/Engineering/Courses/En4/Notes/vibrations_mdof/vibrations_mdof.htm (last access: 13 January 2021), 2011.
Bund, A. and Schwitzgebel, G.: Signal oscillations of a piezoelectric quartz crystal in liquids caused by compressional waves, Anal. Chim. Acta, 364, 189–194, https://doi.org/10.1016/S0003-2670(98)00201-3, 1998.
Buttery, D. A. and Ward, M. D.: Measurement of Interfacial Processes at Electrode Surfaces with the Electrochemical Qurz crystal Microbalance, Chem. Rev., 92, 1355–1379, https://doi.org/10.1021/cr00014a006, 1992.
Cernosek, R. W., Bigbie, J. R., Anderson, M. T., Small, J. H., and Sawyer, P. S.: High temperature hydrocarbon gas sensing with mesoporous SiO2 thin films on TSM resonators, in: Proceedings of the 1998 Solid-State, Actuators, and Microsystems Workshop, 7–11 June 1998, Hilton Head, SC, USA, 375–379, https://doi.org/10.31438/trf.hh1998.87, 1998.
Cumpson, P. J. and Seah, M. P.: The quartz crystal microbalance; radial/polar dependence of mass sensitivity both on and off the electrodes, Meas. Sci. Technol., 1, 544–555, https://doi.org/10.1088/0957-0233/1/7/002, 1990.
Demtröder, W.: Experimentalphysik 2, Springer, Berlin, Heidelberg, https://doi.org/10.1007/978-3-642-29944-5, 2009.
Efimov, I., Hillman, A. R., and Walter Schultze, J.: Sensitivity variation of the electrochemical quartz crystal microbalance in response to energy trapping, Electrochim. Acta, 51, 2572–2577, https://doi.org/10.1016/j.electacta.2005.11.028, 2006.
Firebaugh, S. L., Jensen, K. F., and Schmidt, M. A.: Investigation of high-temperature degradation of platinum thin films with an in situ resistance measurement apparatus, J. Microelectromech. Syst., 7, 128–135, https://doi.org/10.1109/84.661395, 1998.
Fritze, H.: High-temperature bulk acoustic wave sensors, Meas. Sci. Technol., 22, 12002–12030, https://doi.org/10.1088/0957-0233/22/1/012002, 2011a.
Fritze, H.: High-temperature piezoelectrc crystals and devices, J. Electroceram., 26, 122–161, https://doi.org/10.1007/s10832-011-9639-6, 2011b.
Fritze, H., Schneider, O., Seh, H., Tuller, H. L., and Borchardt, G.: High temperature bulk acoustic wave properties of langasite, Phys. Chem. Chem. Phys., 5, 5207–5214, https://doi.org/10.1039/B307503F, 2003.
Fritze, H., Richter, D., and Tuller, H. L.: Simultaneous detection of atmosphere induced mass and conductivity variations using high temperature resonant sensors, Sensors Actuat. B, 111–112, 200–206, https://doi.org/10.1016/j.snb.2005.06.036, 2005.
IEEE: IEEE Standard on Piezoelectricity, ANSI/IEEE Std 176-1987, –, 0–1, https://doi.org/10.1109/IEEESTD.1988.79638, 1988.
Ikeda, T.: Fundamentals of Piezoelectricity, Oxford University Press, Oxford, ISBN 13 9780198563396, ISBN 10 0198563396, 1990.
Johannsmann, D.: Viscoelastic, mechanical, and dielectric measurements on complex samples with the quartz crystal microbalance, Phys. Chem. Chem. Phys., 10, 4516–4534, https://doi.org/10.1039/B803960G, 2008.
Johannsmann, D.: The quartz crystal microbalance in soft matter research: Fundamentals and modeling, Soft and Biological Matter (electronic), Springer, Cham, Heidelberg, New York, Dordrech, London, 387 pp., https://doi.org/10.1007/978-3-319-07836-6, 2015.
Johannsmann, D. and Heim, L. O.: A simple equation predicting the amplitude of motion of quartz crystal resonators, J. Appl. Phys., 100, 094505, https://doi.org/10.1063/1.2359138, 2006.
Johannsmann, D., Bucking, W., Bode, B., and Petri, J.: Simple frequency-based sensing of viscosity and dielectric properties of a liquid using acoustic resonators, in: 2009 IEEE International Frequency Control Symposium Joint with the 22nd European Frequency and Time forum, 20–24 April 2009, Besancon, France, https://doi.org/10.1109/FREQ.2009.5168308, 855–860, 2009.
Keysight Technologies Inc.: Impedance measurement handbook – a guide to measuremet technology and techniques, https://www.keysight.com/us/en/assets/7018-06840/application-notes/5950-3000.pdf (last access: 8 November 2022), 2015.
Lee, D.-K., Jeon, J.-I., Kim, M.-H., Choi, W., and Yoo, H.-I.: Oxygen nonstoichiometry (2-\delta-revisited, J. Solid State Chem., 178, 185–193, https://doi.org/10.1016/j.jssc.2004.07.034, 2005.
Lide, D. R.: Handbook of chemistry and physics, in: 84th Edn., CRC Press, Boca Raton, ISBN 13: 9780849304842, ISBN 10: 0849304849, 2003.
Martin, B. A. and Hager, A. E.: Velocity profile on quartz crystals oscillating in liquids, J. Appl. Phys., 65, 2630–2635, https://doi.org/10.1063/1.342772, 1989.
Nowotny, M. K., Sheppard, L. R., Bak, T., and Nowotny, J.: Defect Chemistry of Titanium Dioxide. Application of Defect Engineering in Processing of TiO2-Based Photocatalysts, J. Phys. Chem. C, 112, 5275–5300, https://doi.org/10.1021/jp077275m, 2008.
Richter, D.: Selektiver Gassensor auf der Basis Hochtemperaturstabiler piezoelektrischer Langasitresonatoren, Dissertation, Technische Universität Clausthal, Clausthal, https://d-nb.info/1013468104/34 (last access: 8 November 2022), 2010.
Sauerbrey, G.: Verwendung von Schwingquarzen zur Wägung dünner Schichten und Mikrowägung, Z. Physik, 155, 206–222, https://doi.org/10.1007/BF01337937, 1959.
Sauerbrey, G.: Messung von Plattenschwingungen sehr kleiner Amplitude durch Lichtmodulation, Z. Physik, 178, 457–471, https://doi.org/10.1007/BF01379475, 1964.
Schmidtchen, S.: Aufbau eines Laser-Vibrometer-Messsystem zur Hochtemperatur-Charakterisierung von Sensorkomponenten, Dissertation, Technische Universität Clausthal, Clausthal, https://d-nb.info/104959147X/34 (last access: 8 November 2022), 2013a.
Schmidtchen, S., Richter, D., and Fritze, H.: Variation of the vibration profile of piezoelectric resonant sensors with different electrode conductivity at high temperatures, Sensors Actuat. B, 187, 247–253, https://doi.org/10.1016/j.snb.2012.11.015, 2013b.
Schulz, M., Brillo, J., Strenzel, C., and Fritze, H.: Oxygen partial pressure control for microgravity experiments, Solid State Ion., 225, 332–336, https://doi.org/10.1016/j.ssi.2012.04.008, 2012.
Schulz, M., Ghanavati, R., Kohler, F., Wilde, J., and Fritze, H.: Electromechanical properties of housed piezoelectric CTGS resonators at high temperatures – Modelling of housing influences, tm – Technisches Messen, https://doi.org/10.1515/teme-2022-0028, in press, 2022.
Seh, H., Fritze, H., and Tuller, H. L.: Defect Chemistry of Langasite III: Predictions of electrical and gravimetric properties and application to operation of high temperature crystal microbalance, J. Electroceram., 139–147, https://doi.org/10.1007/s10832-007-9016-7, 2007.
Shah, M. I. and Saha, T.: Optimal Design of TSM Langasite Resonator for High-Temperature Applications: A Review, IEEE T. Ultrason. Ferroelect. Freq. Control, 68, 1465–1475, https://doi.org/10.1109/TUFFC.2020.3033704, 2021.
Shana, Z. A. and Josse, F.: Quartz Crystal Resonators as Sensors in Liquids Using the Acoustoelectric Effect, Anal. Chem., 66, 1955–1964, https://doi.org/10.1021/ac00085a006, 1994.
Shockley, W., Curran, D. R., and Koneval, D. J.: Trapped-Energy Modes in Quartz Filter Crystals, J. Acoust. Soc. Am., 41, 981–993, https://doi.org/10.1121/1.1910453, 1967.
Sotnikov, A., Schmidt, H., Weihnacht, M., Buzanov, O., and Sakharov, S.: Material parameters of Ca3TaGa3Si2O14 single crystal revisited, in: IEEE International Ultrasonics Symposium (IUS), 21–25 July 2013, Prague, Czech Republic, 1688–1691, IUS4-PC2-4, https://doi.org/10.1109/ULTSYM.2013.0430, 2013.
Steinem, C. and Janshoff, A.: Piezoelectric Sensors, 5, Springer, Berlin, Heidelberg, https://doi.org/10.1007/b100347, 2007.
Suhak, Y., Schulz, M., Wulfmeier, H., Johnson, W. L., Sotnikov, A., Schmidt, H., Ganschow, S., Klimm, D., and Fritze, H.: Langasite-Type Resonant Sensors for Harsh Environments, MRS Adv., 1, 1513–1518, https://doi.org/10.1557/adv.2016.109, 2016.
Suhak, Y., Schulz, M., Johnson, W. L., Sotnikov, A., Schmidt, H., and Fritze, H.: Electrochemical properties and charge transport of Ca3TaGa3Si2O14 (CTGS) single crystals at elevated temperatures, Solid State Ion., 317, 221–228, https://doi.org/10.1016/j.ssi.2018.01.032, 2018.
Suhak, Y., Fritze, H., Sotnikov, A., Schmidt, H., and Johnson, W. L.: High-temperature electromechanical loss in piezoelectric langasite and catangasite crystals, J. Appl. Phys., 130, 85102–85120, https://doi.org/10.1063/5.0058751, 2021.
Tiersten, H. F.: Linear Piezoelctric Plate Vibration, Springer Science + Business Media, New York, https://doi.org/10.1007/978-1-4899-6453-3, 1969.
van Dyke, K. S.: The Piezo-Electric Resonator and Its Equivalent Network, Proc. IRE, 16, 742–764, https://doi.org/10.1109/JRPROC.1928.221466, 1928.
Wulfmeier, H., Feder, R., Zhao, L., and Fritze, H.: Epitaxial Piezoelectric Langasite Thin Films for High-Temperature Application, MRS Adv., 4, 523–529, https://doi.org/10.1557/adv.2019.90, 2019.
Wulfmeier, H., Feder, R., Zhao, L., and Fritze, H.: High-temperature stable piezoelectric transducers using epitaxially grown electrodes, J. Sens. Sens. Syst., 9, 15–26, https://doi.org/10.5194/jsss-9-15-2020, 2020.
Yang, J. and Kosinski, J. A.: Effects of piezoelectric coupling on energy trapping of thickness-shear modes, IEEE T. Ultrason. Ferroelect. Freq. Control, 51, 1047–1049, https://doi.org/10.1109/TUFFC.2004.1334836, 2004.
Yu, F.-P., Chen, F.-F., Hou, S., Wang, H.-W., Wang, Y.-A., Tian, S.-W., Jiang, C., Li, Y.-L., Cheng, X.-F., and Zhao, X.: High temperature piezoelectric single crystals: Recent developments, in: 2016 Symposium on Piezoelectricity, Acoustic Waves, and Device Applications (SPAWDA), 21–24 October 2016, Xi'an, China, https://doi.org/10.1109/SPAWDA.2016.7829944, 2016.
Zu, H., Wu, H., and Wang, Q.-M.: High-Temperature Piezoelectric Crystals for Acoustic Wave Sensor Applications, IEEE T. Ultrason. Ferroelect. Freq. Control, 63, 486–505, https://doi.org/10.1109/TUFFC.2016.2527599, 2016.