the Creative Commons Attribution 4.0 License.
the Creative Commons Attribution 4.0 License.
 | 12 Jan 2023
Simulation-based investigation of the metrological interface structural resolution capability of X-ray computed tomography scanners
Tino Hausotte
The miniaturisation of components leads to new demands on measurement systems. One of these is the resolution. As a volumetric analysis method and method of non-destructive testing, industrial X-ray computed tomography (XCT) has the ability to measure geometrical features and their corresponding dimensions without destroying them and can therefore be used for quality assurance. However, the concept of resolution is not trivial for XCT and has not yet been finally clarified. In particular, the interface structural resolution, the detectability of two surfaces facing each other after surface segmentation, faces a lack of a test specimen, a corresponding measurand and a reliable method. Simulation-based XCT investigations of a method to determine this type of resolution are presented in this article using the geometry of a test specimen that contains several radially arranged holes of the same size. The borehole diameters correspond to the distance between the holes to investigate the resolvability of surfaces and interfaces. The evaluation is based on mean and extreme values of grey value profiles between the individual boreholes of the reconstructed volume. It is shown that the geometrical detectability of the test specimen surface and interface can be extended by a reasonable choice of the threshold value for surface segmentation within a defined interval. With regard to the resolving capability, a distinction is made between assured detectability and possible detectability, as well as the threshold value used when using the ISO50 threshold for surface segmentation and measurement chain completion.
- Article
(1522 KB) - Full-text XML
- BibTeX
- EndNote


Industrial X-ray computed tomography (XCT), like optical methods in general, is not able to produce an exact image of the examined specimen. A projection of a specimen generated with XCT is essentially influenced by partly competing effects of the system. The same applies with regard to the accuracy of the whole measurement system. One important factor is the resolution. In the literature for XCT, several resolution concepts exist which have already been distinguished by Villaraga-Gómez et al. (2020) and Binder and Hausotte (2022). One of them is the voxel size, which refers to the actual pixel size of the detector in relation to the geometric magnification due to the positioning of the test specimen, which by itself does not provide sufficient information about the resolving power of the entire system. Spatial resolution is a contrast-based feature distinction that can be described by the signal loss of known distances. The difference in contrast between the material and the surrounding medium is influenced by the absorption capabilities of the respective substance and superimposed by blurring effects caused by the X-ray spot size. The different settings of the measurement system have an influence in this case and also impact the metrological structural resolution (MSR). It includes the entire measurement chain for dimensional measurements on surfaces and thus incorporates the state-of-the-art threshold-based surface determination.
There are different concepts of measurement resolution. In dimensional metrology, the term resolution is differentiated into spatial resolution and structural resolution. “Positional resolution [(spatial resolution)], in coordinate metrology, describes the smallest measurable displacement in the measured direction […]. Structural resolution, in coordinate metrology, describes the size of the smallest structures separately measurable.” (VDI/VDE 2617:2011-12 Part 13, 2011) If the local shape measurement, such as the smallest sinusoidal waves of a topography like in Flessner et al. (2014) and Arenhart et al. (2015), is included in the definition of the “structural resolution”, this is referred to as “metrological structural resolution” (MSR) (Bartscher et al., 2018). The MSR thus allows for a statement about the detection capability of small structures on the component surface. For structures inside the component such as recesses, holes, pores or cracks, the “interface structural resolution” (ISR) introduced by Bartscher et al. (2018) is a relevant resolution term. It describes “the minimum distance of two (nearly) parallel surfaces, where these surfaces can still be separately recognised with a sufficient positional resolution” (Bartscher et al., 2018). The hourglass standard described first by Carmignato et al. (2012) is two stacked spheres that can be evaluated with regard to their neck-shaped transition. However, they do not distinguish between the two definitions described above. Nevertheless, the sphere surface distances as well as the detection of the extension of the contact point can be examined with this specimen. From this information, the structural resolution can be concluded (Zanini and Carmignato, 2017). Spheres, and their diameters, are generally recommended by the standard VDI/VDE 2630 Part 1.3:2011-12 (VDI/VDE 2617:2011-12 Part 13, 2011) as test specimens for determining the structural resolution. Due to their symmetric geometry, spheres are the simplest case that can be determined with XCT. However, for evaluating the more complex ISR, this geometry is not suitable. The gap standards presented by Hermanek et al. (2017) and Busch and Hausotte (2021) experimentally investigated the measurability of individual gaps using calibrated gauge blocks. Nevertheless, the influence of single projections, which tend to fulfil criteria for the investigation of MSR due to their grey value transition between air and material, cannot be denied in either approach. The DIN EN ISO 19232 series of standards deals with the inspection of single images. In DIN EN ISO 19232-2:2013-12, for example, a test specimen is presented from which the image quality is determined based on a step/hole image quality specimen in which the visual detectability of the smallest hole size is relevant. Also described in the series, a specimen for detail detectability is based on double-wire strips for image blurring determination (DIN EN ISO 19232-5:2018-12). The evaluation is based on averaged profile lines, looking for the first two-wire pair with less than 20 % modulation depth. DIN EN ISO 15708-3:2019-09 describes a measuring principle applied to transmitted light images using cylindrical line pair measuring templates. The purpose is to compare the spatial resolutions by means of averaged signal profiles along incorporated openings in the cylinder. A further specimen for visual inspection and quantitative evaluation of the spatial resolution is the QRM Micro-CT Bar Pattern phantom consisting of two silicon chips placed at right angles inside protective housing, presented in Langner et al. (2009). Each chip contains a bar (trenches) and point pattern with diameters from 5 to 150 µm line or point thickness by varied depth of the structures between 80 and 120 µm. For micro-focus CT systems there is also a version with structures between 1 and 10 µm with a depth between 5–15 µm and actinomorphic star test pattern (Weiß et al., 2012). Despite all this, the structures lie close to the surface due to the low aspect ratio and thus in the transition area to the component background and in its area of influence, as seen in the description of the hourglass. This is also not intended for the determination of the structure resolution or interface structure resolution. In the context of XCT, the quality of individual radiographic images influences the subsequent metrological evaluation, as they serve as the input to the reconstruction process. Its result – the reconstructed volume – is the basis for the surface segmentation, which is usually carried out with a threshold th value method of the grey value histogram and completes the entire measurement chain. The geometry of a specimen for assessing the detectability of interface structures that takes most of the above-mentioned specimen properties into account is presented below.
The geometry of the designed and simulation-based examined test specimen in this contribution is a borehole standard in accordance with DIN EN ISO 19232-2:2013-12. The specimen is a cylinder with a diameter (D) of 15 mm and a height (h) of 2.5 mm (Fig. 1). The dimensions and row designations of the continuous boreholes were based on the wire diameters and double wire numbers of the specimen of DIN EN ISO 19232-5:2018-12. In contrast to the double-wire standard designed for single radiographs, the test specimen corresponds to the cylindrical shape recommended by DIN EN ISO 15708-2:2019-09 for XCT specimens. On the line connecting the centres of a pair of bores, the distance between the cylindrical surfaces is equal to the bore diameter. The pairs of boreholes are placed on centric circles with diameters of 6, 9.5 and 13 mm. This means that each row of boreholes consists of 3×2 boreholes, which distinguishes the geometry of the test specimen to the varying but constant distances of an actinomorphic star test pattern. The specimen provides specifications specifically for the separate study of the recognisability of interface structures and surface structures. The material used is aluminium. The presence of several identical features is intended to provide a more stable result and cover a larger volume range for which statements on structural recognisability are to be made. Theoretically, a further enlargement of the test specimen would be desirable, and a transferability to real XCT systems is aimed at through the choice of parameters and the design of the specimen, although fine manufacturing processes such as the drilling of cylindrical cut-outs using lasers are still limited by the low aspect ratio of approx. 13–15. High-quality micro-holes at dimensions below 100 µm can already be produced using spiral laser drilling (Uchtmann et al., 2016). Although femtosecond lasers are able to manufacture high-aspect-ratio microholes to polymers, fabricating the different vertical microholes depth and aspect ratios is still a challenge (Wang et al., 2021). However, the current specimen geometry cannot yet be produced with this technology, and cylindrical boreholes with a diameter of 0.016 mm represent a challenge for the manufacturing process, whereby the maximum component thickness must not exceed approx. 0.220 mm. As soon as the manufacturing limitations have been overcome, a test piece calibration by means of synchrotron radiation CT and according to standard VDI/VDE 2630:2015-06 Part 2.1 (2015) would be a practical option.
Figure 1Geometry of the test specimen with borehole diameters of the individual borehole rows D4–D18.
To investigate the structural resolution in the area of the interface, the aluminium test specimen was positioned in the centre of the rotary table with one of the borehole sides plane in alignment with the central beam between the source and the detector. A statement is only possible with respect to the power parameters used and the resulting spot size of the source and the specimen positioning manipulator, which is responsible for the geometric magnification and voxel size.
4.1 XCT system and settings used
The resolution investigation was carried out on an experimentally modelled and parameterised virtual XCT system using the simulation software aRTist of Bundesanstalt für Materialforschung und -prüfung (BAM). The following settings of 16× gain, 1000 ms exposure time, 0.25 mm copper pre-filter and detector size 2048 pixel×2048 pixel with a pixel size of 0.2 mm were used. The varied parameters for generating different measurements with different resolving capability with regard to different structural resolutions are listed in Table 1. To generate different geometric magnifications, each source configuration was combined with different manipulator configurations (Table 2). The software Cera (Siemens Healthcare GmbH) was used for the Feldkamp–Davis–Kress (FDK) reconstruction (Feldkamp et al., 1984). The data processing of the measurements was done in the numeric computing environment MATLAB (The MathWorks, Inc.). The visual verification to secure statements that were made was carried out with VGSTUDIO MAX (version 3.5).

Table 2Manipulator settings with magnification and voxel size used.
4.2 Evaluation
For the evaluation of the test specimen, voxel-based sectional images were generated along the rows of boreholes (Fig. 2a and b). The number of profile lines used in the cross-section is dependent on the geometric magnification and was therefore not constant. Also, cone beam artefacts occurred in dependence on the geometric magnification on the non-centrally positioned top and bottom specimen surfaces. Their associated profile lines were not included in the evaluation. Table 3 shows the number of profile lines l used depending on the magnification. The profile lines (Fig. 2b) were averaged (red), and both the maximum (yellow) and minimum (blue) were extracted within the profile position (Fig. 2c and d). Distinctive points and areas that are relevant with respect to the structural resolution can be extracted from the graph. These are the six grey value minima in the profile lines valleys v1–v6 in the borehole area of the minimum values of the profile line and the six grey value minima h1–h6 of the maximum values and thus the highest located valley points of the profile line in the borehole area. Further relevant points are the three grey value peaks p1–p3 of the minimum values of the profile line between the grey value minima. A reference range is defined by the centre of the specimen and the maximum value of the averaged profile line mref, and through this the minimum grey value in the reference area, which qualifies as a possible surface segmentation threshold thref within the borehole series, will be identified. Depending on a chosen threshold value th, statements can be made for the structural recognisability of the borehole areas. With regard to ISR, the following statement applies: the higher the threshold th, the better the boreholes are detected. However, the threshold should not be selected higher than thref because in the area of surface noise, parts of the specimen are attributed to the background, and this leads to incorrectly extracted small cavities in the specimen. All six boreholes are reliably detected when the following statement is valid: (Fig. 2c and d). Even if reliable detectability is no longer a given, single boreholes can also be detected as long as . With regard to the MSR, which however was not the object of the investigation, another threshold value lower than the values of p could then limit the threshold-dependent structural resolution range for MSR and ISR, so that the following applies for a given borehole configuration: the lower the threshold value th is selected, the more the boreholes are separated by the intermediate bridge – the material between the boreholes of a borehole pair. All three intermediate bridges are reliably detected if this requirement is additionally fulfilled: . Although the ISR is to be used for the evaluation and detectability of small gaps and cracks in the component, a threshold value cannot be selected in the long term without taking into account the surface detectability and thus the external component structure. The minimum interface structural resolution (ISRmin) corresponds to the series of boreholes in which all the values h are below the minimum grey value in the reference range thref. Consequently, all boreholes in the size range are reliably detected. In addition, there are boreholes whose dimensional detectability is not given in all sectional planes due to the missing complete surface determination over the length of the borehole evaluated by profile lines. The maximum interface structure resolution ISRmax is given with the smallest but not completely dimensionally detectable borehole row. The reason is that there are still values of v below the threshold value and thus thref in the borehole area. Only at threshold values below all values of v are boreholes no longer perceived.
Figure 2Profile line along the row of three boreholes: plan view (a) and sectional view (b) of the reconstructed volume of the test specimen. Resulting grey value profiles from extreme (blue and yellow) and mean (red) values with characteristic features and feature areas (c) and enlargement in the area of the boreholes (d).
Table 3Number of evaluated profile lines within the reconstructed component volume depending on the voxel size.
For the overall assessment of the ISR, it is not sufficient to define a threshold range, but a threshold value must be set that finally defines the surface on which dimensional measurements are then possible. We used two threshold values within the grey-scale histogram. On the one hand, the threshold value from the ISO50 approach (DIN EN ISO 15708-3:2019-09) is used, where the threshold value is set at the centre of the characteristic peaks in the grey-scale histogram of the reconstructed volume for background and material (Fig. 3). On the other hand, the smallest reference value (min(thref)) of the 15 evaluated cross-sectional images was used as the threshold value. The following figure shows the exemplary result of all borehole rows on the grey value histogram of the reconstructed volume with the characteristic peaks for background and material with one of the 16 system settings: S4 and M2. Borehole diameters of a row are recognisable if the selected threshold value is above the values of h. The ISRISO50 corresponds to the smallest size of the completely recognisable borehole row, where all values of h are below the ISO50 threshold, which applies to the borehole rows D4 to D10 in Fig. 3 and thus D10. ISRmin represents the smallest completely recognisable borehole row using the smallest threshold values thref of the 15 extracted profile line mean values, which is the value of D14. For the results shown in Fig. 3 for source 4 and manipulator position 2, the ISRmin corresponds to the diameter of borehole D11. From borehole series D12 upwards, the values of h exceed the minimum reference value thref and are thus in the noise range of the surface so that the values do not appear in the bar chart. Reliable borehole detection is then no longer possible at these diameters, and the grey value of h is lost as the borehole diameter becomes smaller in the altitude range of the reference area. Including borehole D15, there are still values of v below the thref value, which defines the ISRmax. Figure 4 shows the results for all of the system configurations used, including the result shown in Fig. 3 for the system settings S4 and M2. It can be seen that the varied source setting only has a relatively small influence on the ISR values, while the manipulator position remains the same. The conditional highest detectability – expressed by the ISRmax values – of interface structures is generally neither at the smallest possible spot size nor the manipulator-related maximum magnification. A guaranteed interface structure resolution ISRmin of 80 µm (D11) was achieved with many of the chosen system configurations. Thus, with a voxel size of 16 µm, this interface structural resolution was achieved independent of the source settings. With the resulting voxel sizes of 8 and 24 µm, this resolvability was only achieved at higher powers and the corresponding larger spot sizes. For the system settings S3 and S4 combined with M1, no ISRmin exists because the value of max(h) is above the reference threshold thref. The resolution values of the ISRISO50 are exclusively dependent on the magnification and improve as a function of the magnification. However, the manipulator 1 setting sets ISO50 thresholds that are in the noise range of the surface. Values of h are above the threshold value that limits the meaningfulness in terms of their actual resolution due to the incorrectly extracted small cavities that appear in the specimen.
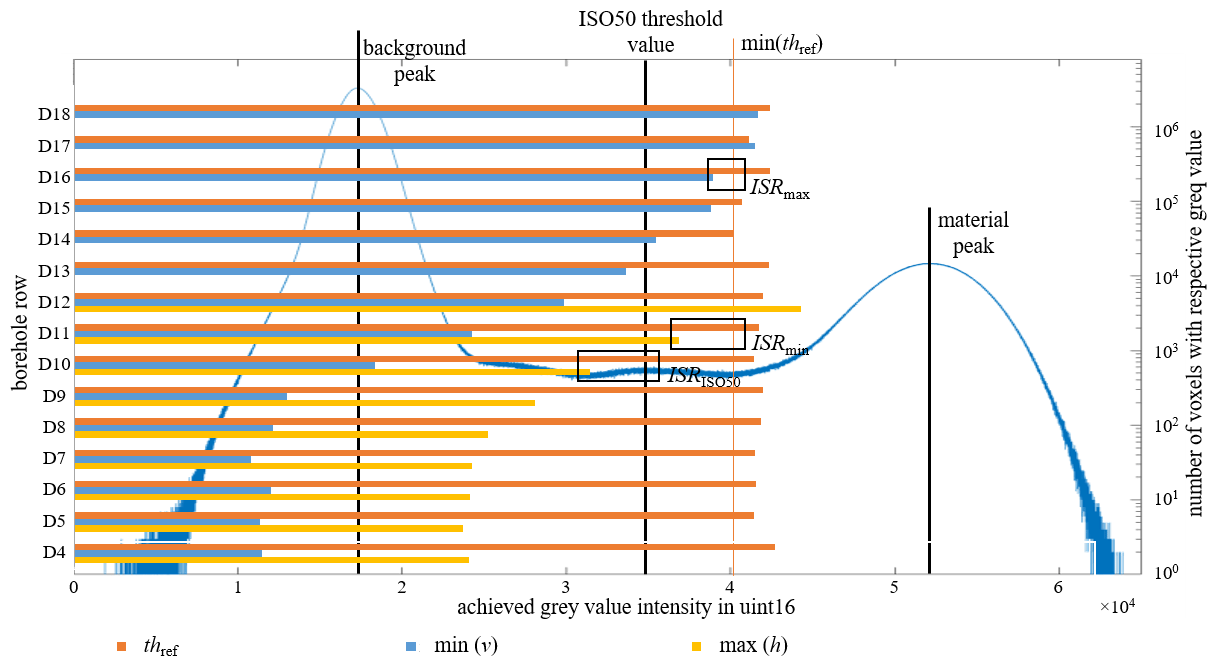
Figure 3Graphical determination of the interface structural resolution based on relevant extreme values of all borehole rows on the greyscale histogram of the reconstructed volume with system settings S4 and M2.
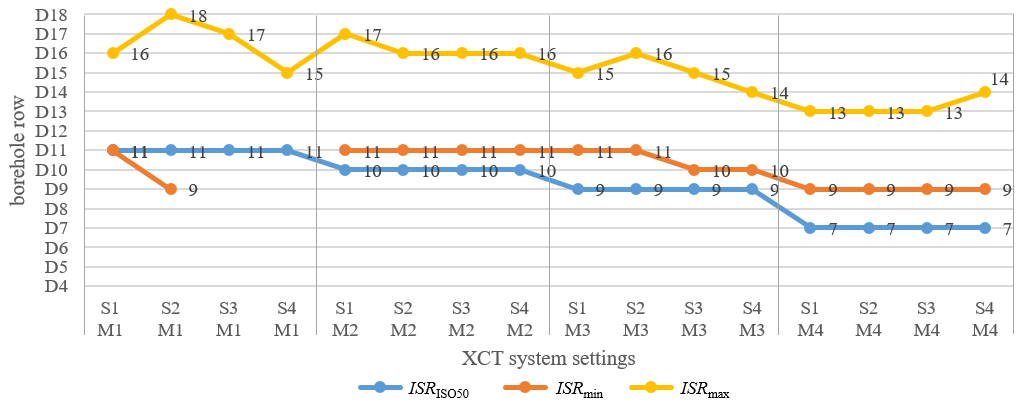
Figure 4Resulting recognisability of interface structures depending on the XCT system settings.
The contribution presented the geometry of a test specimen and simulation-based investigations about an evaluation method for interface structure resolution testing of XCT systems, which makes system configurations comparable with each other without validation on a real specimen due to limitations in the manufacturing process. All statements on resolution referred to the entire measurement chain using the respective algorithm used for reconstruction and depending on the surface determination method that was used. A modification can possibly lead to an improved or worsened resolution. A statement on the extent to which other test specimen materials would deliver similar results cannot be made with the given data. A weakness of the method is the unsecured transferability to other component geometries. Only vertical interface structures were investigated. Transferability to horizontal structures is not guaranteed. A reduced selection of evaluated line profiles due to the cone-beam artefacts seems logical – but the separation of areas affected by artefacts is still arbitrary. The determined extreme values from the voxel information from 15 sectional images provide robust values for thresholding during segmentation and ISR determination. However, it is still likely that regions with incorrectly extracted small cavities exist in the segmented volume due to individual outliers.
In this paper, we presented a simulation-based methodology to investigate the interface structural resolution of XCT systems. The necessary steps are described in detail as well as the specimen used. Furthermore, the parameters for the generation of the measurement data are described, as well as the software used to process the data (MATLAb, 2022, https://de.mathworks.com/products/matlab.html, last access: 23 December 2022; VGSTUDIO MAX, 2022, https://www.volumegraphics.com/de/produkte/vgsm/what-s-new-in-vgstudio-max-3-5-x.html, last access: 23 December 2022; Cera, 2022, https://www.oem-products.siemens-healthineers.com/software-components, last access: 23 December 2022; aRTist, 2022, https://artist.bam.de/, last access: 23 December 2022).
MB contributed to data curation, formal analysis, investigation, methodology, software, validation, visualisation and writing (the original draft) and led the review and editing process. TH contributed to conceptualisation, funding acquisition, project administration, supervision and writing and supported the review and editing process.
The contact author has declared that neither of the authors has any competing interests.
Publisher's note: Copernicus Publications remains neutral with regard to jurisdictional claims in published maps and institutional affiliations.
The authors want to thank the German Research Foundation (DFG) for funding the Collaborative Research Centre 285 (project ID 418701707), subproject C05.
This research has been supported by the Deutsche Forschungsgemeinschaft (grant no. 418701707).
This paper was edited by Thomas Fröhlich and reviewed by two anonymous referees.
Arenhart, F. A., Nardelli, V. C., and Donatelli, G. D.: Characterization of the metrological structural resolution of CT systems using a multi-wave standard, Proc. XXI IMEKO World Congress, 30 August–4 September 2015, Prague, Czech Republic, https://www.imeko.org/publications/wc-2015/IMEKO-WC-2015-TC14-282.pdf (last access: 23 December 2022), 2015.
aRTist: Bundesanstalt für Materialforschung und -prüfung (BAM), Berlin, Germany, https://artist.bam.de/, last access: 23 December 2022.
Bartscher, M., Neuschaefer-Rube, U., Illemann, J., Borges de Oliveira, F., Stolfi, A., and Carmignato, S.: Qualification and Testing of CT Systems, in: Industrial X-Ray Computed Tomography, edited by: Carmignato, S., Dewulf, W., and Leach, R., Springer, Cham, https://doi.org/10.1007/978-3-319-59573-3_6, 2018.
Binder, F. and Hausotte, T.: About the distinction of resolution concepts in industrial computed tomography, tm-Tech. Mess., 89, 20–24, https://doi.org/10.1515/teme-2022-0065, 2022.
Busch, M. and Hausotte, T.: Determination of the Interface Structural Resolution of an Industrial X-Ray Computed Tomograph using a Spherical Specimen and a Gap Specimen Consisting of Gauge Blocks, Key Engineering Materials, vol. 883, Trans Tech Publications, 41–48, https://doi.org/10.4028/www.scientific.net/KEM.883.41, 2021.
Carmignato, S., Pierobon, A., Rampazzo, P., Parisatto, M., and Savio, E.: CT for Industrial Metrology - Accuracy and Structural Resolution of CT Dimensional Measurements, 4th Conference on Industrial Computed Tomography (iCT), 19–21 September 2012, Wels, Austria, e-Journal of Nondestructive Testing, 17, https://www.ndt.net/?id=13718, 2012.
Cera: Siemens Healthcare GmbH, Erlangen, Germany, https://www.oem-products.siemens-healthineers.com/software-components, last access: 23 December 2022.
DIN EN ISO 15708-2:2019-09: Non-destructive testing – Radiation methods for computed tomography – Part 2: Principles, equipment and samples (ISO 15708-2:2017), 2019.
DIN EN ISO 15708-3:2019-09: Non-destructive testing – Radiation methods for computed tomography – Part 3: Operation and interpretation (ISO 15708-3:2017), 2019.
DIN EN ISO 19232-2:2013-12: Non-destructive testing – Image quality of radiographs – Part 2: Determination of the image quality value using step/hole-type image quality indicators (ISO 19232-2:2013), 2013.
DIN EN ISO 19232-5:2018-12: Non-destructive testing – Image quality of radiographs – Part 5: Determination of the image unsharpness and basic spatial resolution value using duplex wire-type image quality indicators (ISO 19232-5:2018), 2018.
Feldkamp, L. A., Davis, L. C., and Kress, J. W.: Practical cone-beam algorithm, J. Opt. Soc. Am. A, 1, 612–619, 1984.
Flessner, M., Vujaklija, N., Helmecke, E., and Hausotte, T.: Determination of metrological structural resolution of a CT system using the frequency response on surface structures, Proc. MacroScale, Vienna, Austria, 28–30 October 2014, 1–10, https://doi.org/10.7795/810.20150223B, 2014.
Hermanek, P., Borges de Oliveira, F., Bartscher, M., and Carmignato, S.: Experimental investigation of new multi-material gap reference standard for testing computed tomography systems. 7th Conference on Industrial Computed Tomography (iCT) 2017, 7–9 February 2017, Leuven, Belgium, e-Journal of Nondestructive Testing, 22, https://www.ndt.net/?id=20837, 2017.
Langner, O., Karolczak, M., Rattmann, G., and Kalender, W. A.: Bar and Point Test Patterns Generated by Dry-Etching for Measurement of High Spatial Resolution in Micro-CT, in: World Congress on Medical Physics and Biomedical Engineering, edited by: Dössel, O. and Schlegel, W. C., Munich, Germany, 7–12 September 2009, IFMBE Proceedings, vol. 25/2, Springer, Berlin, Heidelberg, https://doi.org/10.1007/978-3-642-03879-2_121, 2009.
MATLAB: The MathWorks, Inc., Massachusetts, USA, https://de.mathworks.com/products/matlab.html, last access: 23 December 2022.
Uchtmann, H., He, C., and Gillner, A.: High precision and high aspect ratio laser drilling: challenges and solutions, in: High-Power Laser Materials Processing: Lasers, Beam Delivery, Diagnostics, and Applications V, Proc. SPIE, vol. 9741, San Francisco, California, United States, 36–47, https://doi.org/10.1117/12.2222662, 2016.
VDI/VDE 2617:2011-12 Part 13: Accuracy of coordinate measuring machines – Characteristics and their testing – Guideline for the application of DIN EN ISO 10360 for coordinate measuring machines with CT-sensors, 2011.
VDI/VDE 2630:2015-06 Part 2.1: Computed tomography in dimensional measurement Determination of the uncertainty of measurement and the test process suitability of coordinate measurement systems with CT sensors, 2015.
VGSTUDIO MAX: Volume Graphics GmbH, Heidelberg, Germany, https://www.volumegraphics.com/de/produkte/vgsm/what-s-new-in-vgstudio-max-3-5-x.html, last access: 23 December 2022.
Villarraga-Gómez, H., Körner, L., Leach, R., and Smith, S. T.: Amplitude-wavelength maps for X-ray computed tomographysystems, Precis. Eng., 64, 228–242, https://doi.org/10.1016/j.precisioneng.2020.03.005, 2020.
Wang, H., Zhang, F., Ding, K., and Duan, J.: Non-diffraction-length Bessel-beam femtosecond laser drilling of high-aspect-ratio microholes in PMMA, Optik, 229, 166295, https://doi.org/10.1016/j.ijleo.2021.166295, 2021.
Weiß, D., Shi, Q., and Kuhn, C.: Measuring the 3D resolution of a micro-focus X-ray CT setup, in: 4th Conference on Industrial Computed Tomography (iCT), 19–21 September 2012, Wels, Austria (iCT 2012), e-Journal of Nondestructive Testing, 1435–4934, https://www.ndt.net/search/docs.php3?id=13738, 2012.
Zanini, F. and Carmignato, S.: Two-spheres method for evaluating the metrological structural resolution in dimensional computed tomography, Meas. Sci. Technol., 28, 114002, https://doi.org/10.1088/1361-6501/aa85b7, 2017.