the Creative Commons Attribution 4.0 License.
the Creative Commons Attribution 4.0 License.
 | 08 Aug 2023
Development of a gas chromatography system coupled to a metal-oxide semiconductor (MOS) sensor, with compensation of the temperature effects on the column for the measurement of ethene
Maximilian Koehne
Christopher Schmidt
Satnam Singh
Andreas Grasskamp
Tilman Sauerwald
A possible way to reduce the size and complexity of common gas chromatography (GC) systems is the economization of the column temperature regulation system. To this end, a temperature compensation method was developed and validated on a benchtop GC-PDD (pulsed discharge detector) with ethene. An in-house-developed algorithm correlates the retention index of a test gas to the retention index of a previously selected reference gas. To investigate further methods of cost reduction, commercial gas sensors were tested as cheap, sensitive, and versatile detectors. Therefore, CO2 was chosen as a naturally occurring reference gas, while ethene was chosen as a maturity marker for climacteric fruits and hence as a test gas. A demonstrator, consisting of a simple syringe injection system, a PLOT (porous layer open tubular) column boxed in a polystyrene-foam housing, a commercial MOS (metal-oxide semiconductor) sensor for the test gas, and a CO2-specific IR (infrared) sensor, was used to set up a simple GC system and to apply this method on test measurements. Sorption parameters for ethene and CO2 were determined via a van 't Hoff plot, where the entropy S was −11.982 J mol−1 K−1 and 1.351 J mol−1 K−1 , and the enthalpy H was −20.622 kJ mol−1 and −14.792 kJ mol−1 , respectively. Ethene (100 ppm) measurements revealed a system-specific correction term of 0.652 min. Further measurements of ethene and interfering gases revealed a mean retention time for ethene of 3.093 min; the mean predicted retention time is 3.099 min. The demonstrator was able to identify the test gas, ethene, as a function of the reference gas, CO2, in a first approach, without a column heating system and in a gas mixture by applying a temperature compensation algorithm and a system-specific holdup time correction term.
- Article
(1507 KB) - Full-text XML
-
Supplement
(1599 KB) - BibTeX
- EndNote


Fruit spoilage and fruit waste are huge problems in food logistics that cause economical and ecological problems. It is reported that about one-third of harvested fruits are lost during post-harvest logistic processes (Paul and Pandey, 2014; Lang et al., 2014; Jedermann et al., 2014; Porat et al., 2018; Eberhardt et al., 2020; Thyberg and Tonjes, 2016; Gustavsson et al., 2011; Elik et al., 2019). Losses can occur due to different harvest treatments and storing conditions (like air, humidity, or temperature), as they affect the shelf life and quality of the fruits (Lang et al., 2014; Janssen et al., 2014b). Post-harvest monitoring of the fruit status is a possible solution to avoid such large amounts of food waste, as more-mature fruits can be sold earlier than less-mature ones. This “first expired, first out” principle could replace today's common “first in, first out” process, which does not consider the actual maturity of fruits (Janssen et al., 2014a; Lang et al., 2014). Therefore, maturity markers, i.e., the volatile ethene, can be used to gain information on the maturity of fruits. Ethene (sometimes called ethylene) is a small organic gaseous phytohormone which occurs in climacteric fruits. It has a self-enhancing effect, as it is produced during the metabolic ripening process and can affect other fruits by inducing their ripening process as well (Paul et al., 2014; Hu et al., 2019). Furthermore, it can also induce senescence of fruits and thus contribute to fruit spoilage (Paul and Pandey, 2014; De Biasio et al., 2016). Therefore, ethene is an excellent marker for showing the ripening status of post-harvest fruits. Its measurement can be utilized to monitor and predict the quality of fruits (Pereira et al., 2017; Caprioli and Quercia, 2014; Hu et al., 2019).
A gas chromatography–mass spectrometer (GC–MS) is a powerful analyzing instrument that separates gases into gas mixtures. A conventional GC system comprises an injection system and a separating unit, i.e., the separation column. Mostly, a fused-silica capillary column, placed in a programmable oven, is used for the separation process. Thereby, the separation uses repetitive adsorption of the analyte from the carrier gas – the so-called mobile phase – to a condensed phase – the so-called stationary phase – with the respective desorption along the column. In conventional systems, the oven is heated via convection, which is time consuming and also consumes heating energy. In addition to the GC setup, a detector (like mass spectrometry, MS; photo-ionization detector, PID; flame-ionization detector, FID; thermal-conductivity detector, TCD; and many more) is used to identify the separated analytes. Unfortunately, a classical GC analysis requires highly skilled personnel and a laboratory environment. Besides, a standard GC device is too expensive (roughly five to six figures) for a broad in-field application. Thus, it is not usable for the comprehensive and cost-efficient ethene detection in logistic processes. Small and inexpensive analytical devices that can be used within logistic processes are needed (Hu et al., 2019; Janssen et al., 2014b) and have already been tested for some food quality monitoring applications, such as detecting spoiled food in time to prevent it from contaminating other food by rotting (Costello et al., 2003, 2000). A few developments have also been done in the field of miniaturized ethene detection devices (Hu et al., 2019; De Biasio et al., 2016; Zaidi et al., 2017; Sandfort et al., 2018). For instance, Wöllenstein and colleagues have focused on the development of optical detection systems for ethene, using IR sources and different detection methods like photoacoustic (PA) sensors or a filter rotation spectrometer, for example, which have gained promising results (Eberhardt et al., 2020; Sandfort et al., 2018; Schmitt et al., 2011; Hildenbrand et al., 2008; Fonollosa et al., 2009). On the other hand, Lang and colleagues have focused mainly on microelectromechanical systems (MEMS)-structured columns and entire miniaturized GC devices. Thereby, a key feature was the MEMS-structured column combined with a MEMS injection system (Cagliero et al., 2016; Zaidi et al., 2017; Sklorz et al., 2008; Janssen et al., 2014b; Janssen et al., 2013; Lucklum et al., 2015; Sklorz et al., 2013; Sklorz et al., 2010). Both groups offered promising results. Nevertheless, these detectors and MEMS-structured components suffer either from a lack of commercial availability (Azzouz and Bachari, 2018) or from high costs, as these setups are more complex than commercial metal-oxide semiconductor (MOS) sensors (approximately a single-digit euro amount) for instance, making an in-field device more expensive. MOS sensors are suitable detectors for ethene, fulfilling the requirements for a low-cost and comprehensive in-field ethene detection. MOS sensors are cheap, small, commercially available, and offer a very good sensitivity towards several volatile organic compounds (Ji et al., 2019; Baur et al., 2018a). Unfortunately, they suffer from a lack of selectivity, as the measurement principle relays on the detection of reducing and oxidizing compounds in general (Wang et al., 2010). Therefore, a combination of the separation efficiency of GC columns with the sensitivity of a MOS sensor could offer an opportunity for a low-cost analytical ethene device. Ethene itself is a permanent gas; accordingly, no heating system is required. As temperature variations from the surrounding environment affect the retention characteristics and thus the analysis, a compensation of these temperature effects on the column is necessary. Such a compensation can be done by using the relative position of a second peak, i.e., the reference peak. Carbon dioxide (CO2) can be used as a reference-peak gas (reference gas), as it is a ubiquitous gas that occurs at relatively high concentrations (in natural surrounding air with about 400 ppm). Fast and selective sensors for CO2 are commercially available. In addition, CO2 is produced by fruits through cellular respiration, enhancing the CO2 concentration during fruit storage and enabling a direct usage out of an ethene air mixture.
The aim of this work was, therefore, to design a GC demonstrator that consists of sensors and does not need an oven for the GC column. Furthermore, the demonstrator should be able to detect ethene peaks depending on the reference gas CO2. Thereto, we propose a temperature compensation method that correlates the retention time of a target gas to the retention time of a specific detectable reference gas, thus enabling the identification of a certain target compound via retention time without knowing the exact column temperature. The demonstrator was set up as a simple proof of principle of a PLOT (porous layer open tubular) column coupled to a sensor system. It consisted of a MOS sensor and a CO2-specific IR sensor. The system is combined with a temperature compensation algorithm (here called TCA). The PLOT column was chosen as it is specifically designed for the retention of permanent gases, and in addition, it is commercially available (unlike MEMS-structured columns). This proof of principle is a first step towards a small analytical low-cost device that is able to monitor the ethene formation against a background of interfering gases in fruit logistics.
In a previous study, we presented a temperature compensation algorithm that correlates the retention time of a reference gas to the retention time of a test gas, which we will use for the identification of ethene at various ambient temperatures with a non-heated column (Köhne et al., 2021). Therefore, ubiquitous CO2 was chosen as the reference gas. A preceding test measurement of CO2 and ethene on the employed PLOT column enables the determination of the dependency of the retention time of ethene on the retention time of CO2. Thus, a calculation of the temperature-independent sorption parameters is possible. The calculation is based on a van 't Hoff equation and describes the sorption process parameters, the entropy S and the enthalpy H, using the temperature-dependent equilibrium coefficient K (Eq. 1).
These parameters can be determined as the coefficients of the linear equation of , resulting in Eq. (2).
K is proportional to the net retention volume and at a constant flow ϑ proportional to the net retention time (Eq. 3). The equilibrium coefficient K can be determined via GC test measurements.
Thereby, the difference between the measured gross retention time tr and the holdup time t0 is called the net retention time . The holdup time is the time that a gas needs to pass the column without any retention. Thus, the corresponding adsorption enthalpy H and adsorption entropy S can be determined by preceding test measurements on the PLOT column for both gases, the test gas (ethene) and the reference gas (CO2). When resolving Eq. (2) to , inserting the respective variables, and equating both terms for ethene and CO2, Eq. (4) can be obtained:
The index E stands for ethene as test gas, and index C stands for CO2 as reference gas. Resolving Eq. (4) to KE leads to
The retention time of ethene can be predicted as a function of the CO2 retention time, together with Eqs. (3) and (5):
This offers the opportunity to predict the retention time of ethene via the depending CO2 retention time. With a CO2-specific detector, there is no need for an additional column heating system in an isothermal status. For a user-friendly practicability, a graphical user interface (GUI) is currently being developed. For more information, see Supplement (Sect. S2).
2.1 Measurement setup: benchtop GC – column characterization
Measurement methods regarding the column characterization and real sample measurements were performed as previously reported (Köhne et al., 2021) with ethene as test gas and CO2 as reference gas. Here, a different PLOT column (GS-Q, 0.32 mm i.d., Agilent Technologies) was characterized in a benchtop gas chromatograph. Thereto, 100 µL L−1 of ethene was injected via a gastight syringe (Hamilton, gastight, 100 µL) into a gas-measuring cell (4 L) and mixed with a magnetic stirrer. CO2 occurs directly in the ambient air. The stirrer was equipped with a sail made from a plastic foil (50×50 mm), and the sample was stirred at 1200 rpm for 10 min for a uniform gas-mixing process. The sampling volume per measurement was 5 mL. The column-dependent sorption parameters H and S were measured by GC (Fisons Instruments, GC 8000 series) using a GC-PDD system (pulsed discharge detector; VICI – Valco Instruments Co. Inc.). Helium was used as carrier-gas stream. For generating the van 't Hoff plot, measurements were taken, starting at 32 ∘C (operational minimum of the GC oven), at 35 ∘C, and in 5 ∘C steps up to 50 ∘C. The theoretical holdup time can be determined with the helium inlet pressure (55 kPa ≈ 8 psi) via the Hagen–Poiseuille equation and the holdup volume of the column. The measurement at each temperature step was carried out three times. Real sample measurements were carried out with apples and avocados at different GC column temperatures after 3 d of storage (apples) and 9 d of storage (avocados). Therefore, a PLOT column (GS-Q Megabore, 0.53 mm i.d., J&W Scientific) was used in the GC-PDD. Measurements revealed that the CO2 level enhances strongly due to cellular respiration; ethene occurs slightly, and no further gases could be found (Köhne et al., 2021). More details are given in the Supplement (Sect. S4). For that reason, CO2 and ethene were used as gases to be investigated by the demonstrator.
2.2 Measurement setup – demonstrator
Measurements with the demonstrator setup are first reported here. An internal low-cost GC development platform was used to set up the demonstrator and to test the temperature compensation outside of a classical laboratory benchtop GC detector setup as well as to test the sensor performance during the ethene measurement. A MOS sensor (SGP40 for ethene; Sensirion, Switzerland) and an IR sensor (infrared sensor; FLOWEVO F3 series for CO2; smartGAS Mikrosensorik GmbH, Germany) were connected in series to a PLOT column (GS-Q, 0.32 mm i.d., Agilent Technologies, USA). Therefore, the MOS sensor was mounted on a sensor-measurement chamber with a PTFE sealing. Sensor control and the sensor-measurement chamber are based on the work of Baur et al. (2018b). The SGP40 sensor contains four different sensitive layers (0–3), where layer 2 was chosen for further considerations of the sensor signal due to the distinct signal response (the exact composition of the layers is usually not published by manufacturers). According to the data sheet provided by the manufacturer, the sensor signal is directly proportional to the logarithmic resistance of the sensor layer (Sensirion, 2022), which correspond to an n-type behavior of the semiconducting metal oxide. Reducing gases (like ethene) react on the sensor surface, which leads to a decrease in the electron depletion area within the layer and hence to a decrease in the resistance of the sensor layer. For experiments, the SGP40 sensor was operated in a static configuration at 400 ∘C.
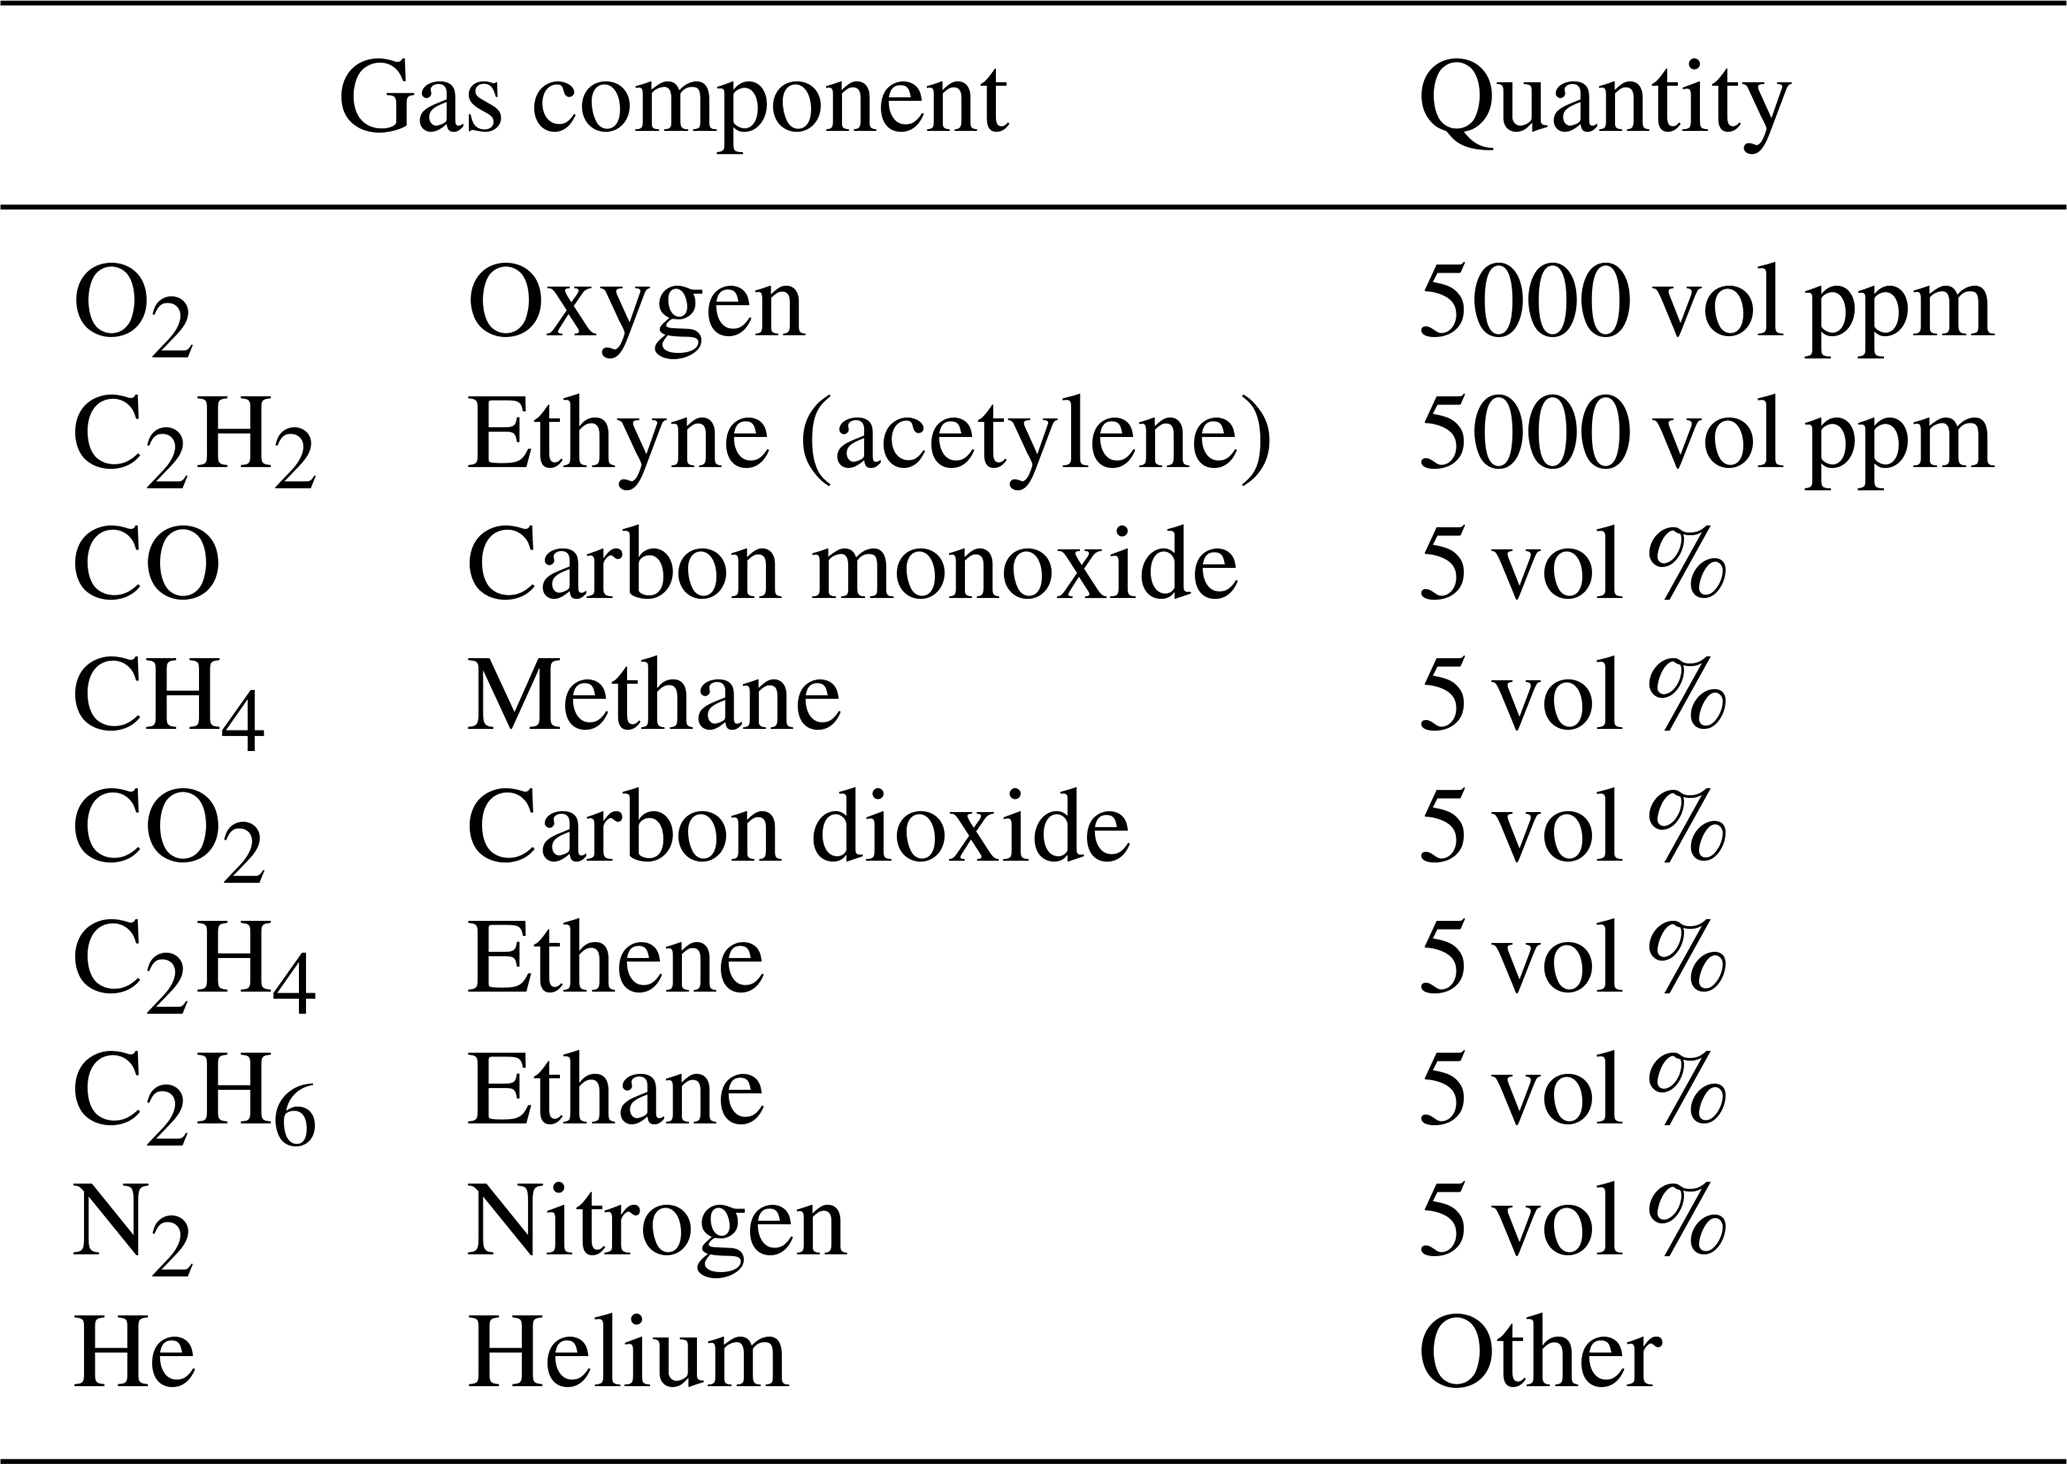
Table 1Composition of interfering gases in the test gas mixture supplied from Westfalen, Germany, used for test measurements.
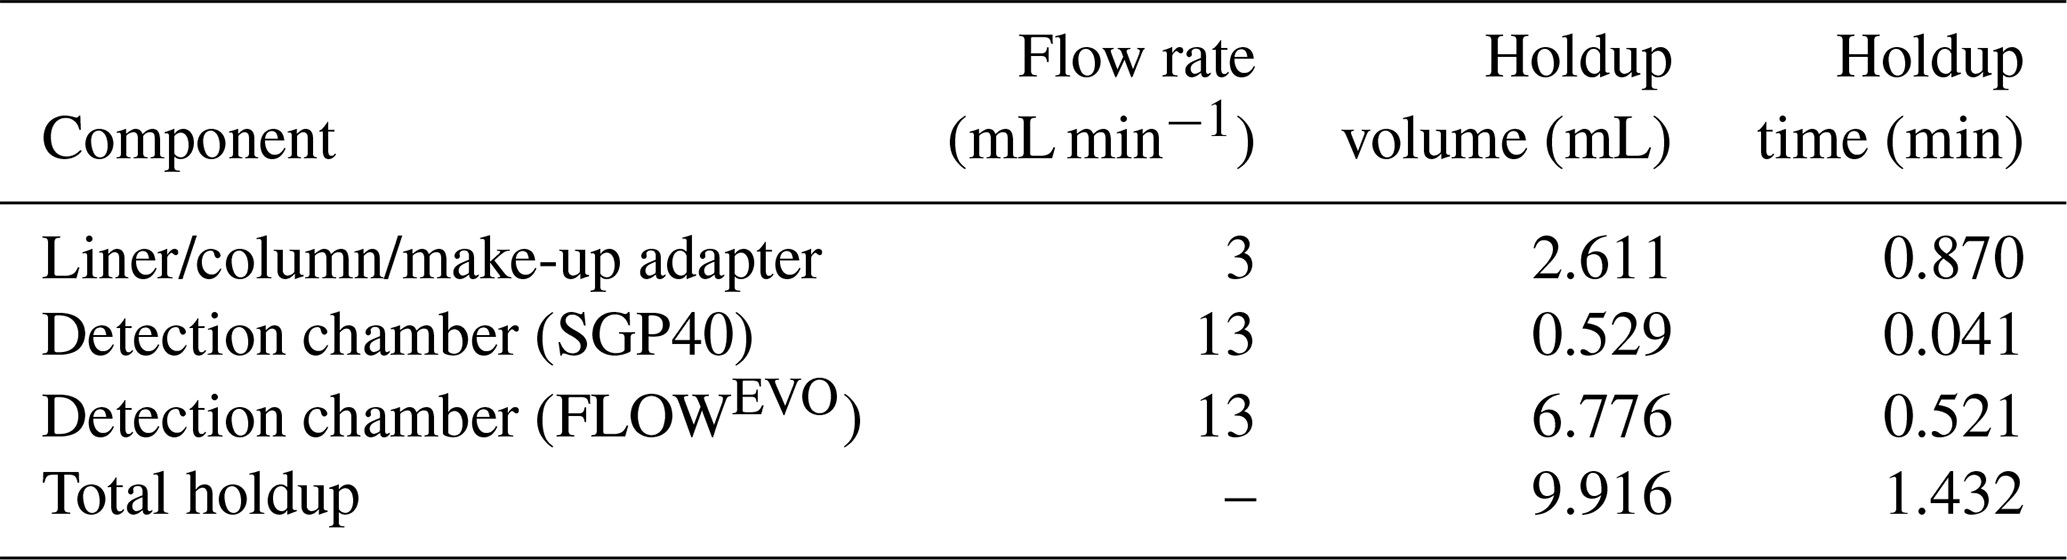
The sensor-measurement chamber was connected via a make-up adapter (VICI, USA) to the analytical PLOT column. A 10 cm long deactivated GC guard column (deactivated with diphenyl tetramethyldisiloxane; 0.53 mm i.d.; Agilent Technologies, USA) was used as a connector to the IR sensor. Swagelok fittings ( and in.; Swagelok, USA) were used as connectors between all components. For column connection, graphite ferrules (VICI, USA) were used for sealing the column connection within Swagelok fittings. The PLOT column was packed in a polystyrene-foam box (length of 32.5 cm; width of 26.5 cm; height of 20.0 cm or 24.4 cm with lid; wall thickness of 4.4 cm each side), to realize the isothermal measurement conditions that are necessary for the temperature compensation algorithm. Nitrogen was used as carrier gas with a flow rate of 3 mL min−1. A make-up stream of zero air (10 mL min−1) was interconnected between the column and the MOS sensors with the make-up adapter, to supply the SGP40 with a required oxygen atmosphere and to enhance the flow through both sensor chambers and their respective holdup volumes. The respective holdup times of the demonstrator setup were calculated via the mass flows and holdup volumes, according to Eq. (7), where t0 is the holdup time, V0 is the holdup volume, and ϑ is the respective flow of the carrier-gas stream.
The total holdup is given by the holdup in the GC column, including connectors (flow rate of 3 mL min−1), plus the holdup for the detectors (flow rate of 13 mL min−1). The holdup volumes and times are given in Table 2. Ethene retention times were calculated by the TCA.
Mass flow controllers (MFCs, G series; MKS, Mexico) are used to regulate the flow of both gas streams, and mass flow meters (MFMs, G series; MKS, Mexico) are used to control the actual flow at the end of the measuring apparatus. The gas samples of ethene in ambient air (400 µL ethene) and afterwards interfering gases in ambient air (9.5 mL, Westfalen, Germany; for composition, see Table 1) were prepared in the gas-measuring cell. Additionally, CO2 (2.0 mL) was added to enhance the CO2 level compared to the make-up stream already containing about 400 ppm CO2 regularly (originating from zero air). The samples were stirred at 1200 rpm for 10 min on a magnetic stirrer and introduced into the measurement system through a gastight syringe (Hamilton, USA; gastight, 2 mL) via a septum unit. One minute after the injection of 150 µL, the sensor's recording function was started. Measurements were carried out three times a day on three different days (resulting in nine measurements each) for the ethene air mixture measurement and for the ethene interfering-gases measurement as well. The peak detection was performed using the “peakdetect” library (https://github.com/avhn/peakdetect, last access: 17 February 2023). More information about the peak detection can be found in Sect. S3. An illustration of the measuring apparatus can be seen in Fig. 1.
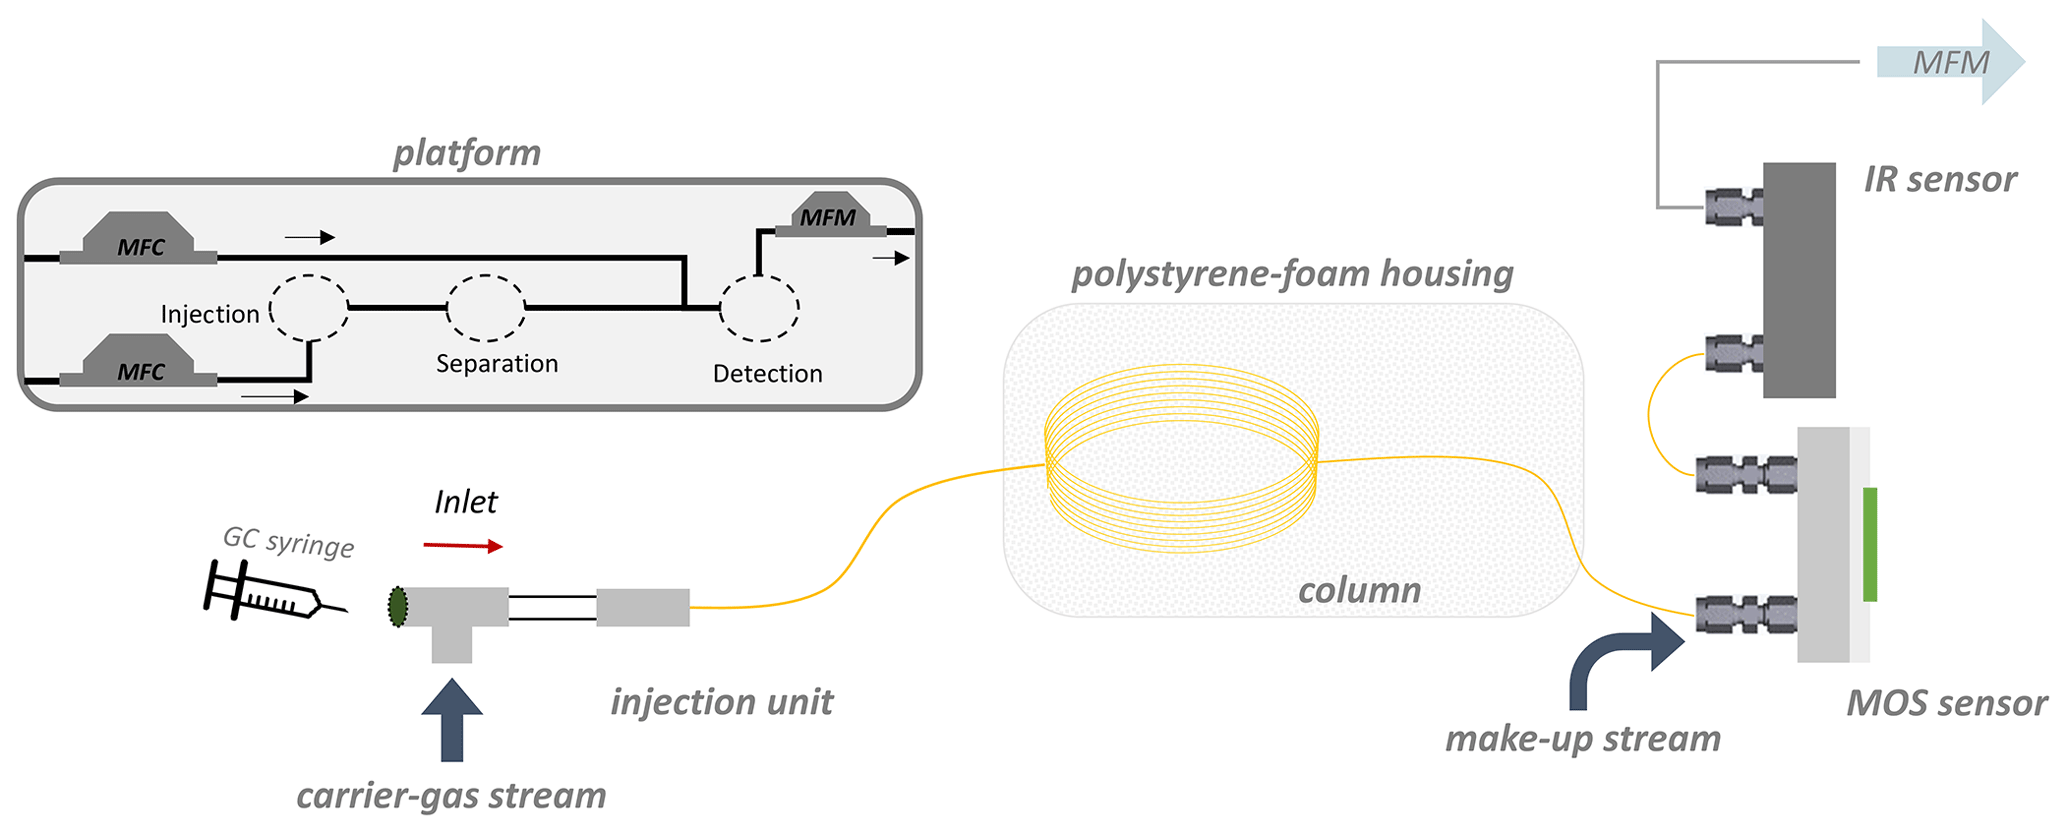
Figure 1Schematic illustration of the measurement setup with platform, injection port, polystyrene-foam box with inserted column, Swagelok connectors, and gas sensors mounted on a measurement chamber.
The column characterization revealed retention times of each gas for the specific temperature steps. The mean retention time at each temperature was used to calculate the logarithm of the partition coefficient, ln(K), for each gas, which was plotted against the inverse temperature (Fig. 2). The slope and the y intercept of the gained van 't Hoff plots were used to calculate the sorption parameters H and S for each gas, respectively. The entropy was −11.982 J mol−1 K−1 and 1.351 J mol−1 K−1 , and the enthalpy was −20.622 kJ mol−1 and −14.792 kJ mol−1 , respectively. Since the entropy is calculated as the y intercept of the linear equation but just a small temperature range can be considered here (measurements much closer to 0 K are hardly feasible), the entropy should be regarded as a rough mathematical estimate. However, those sorption parameters were used in the TCA for the peak prediction afterwards. Respective original chromatograms of the column characterization measurement can be found in the Supplement (Fig. S1 and Table S1).
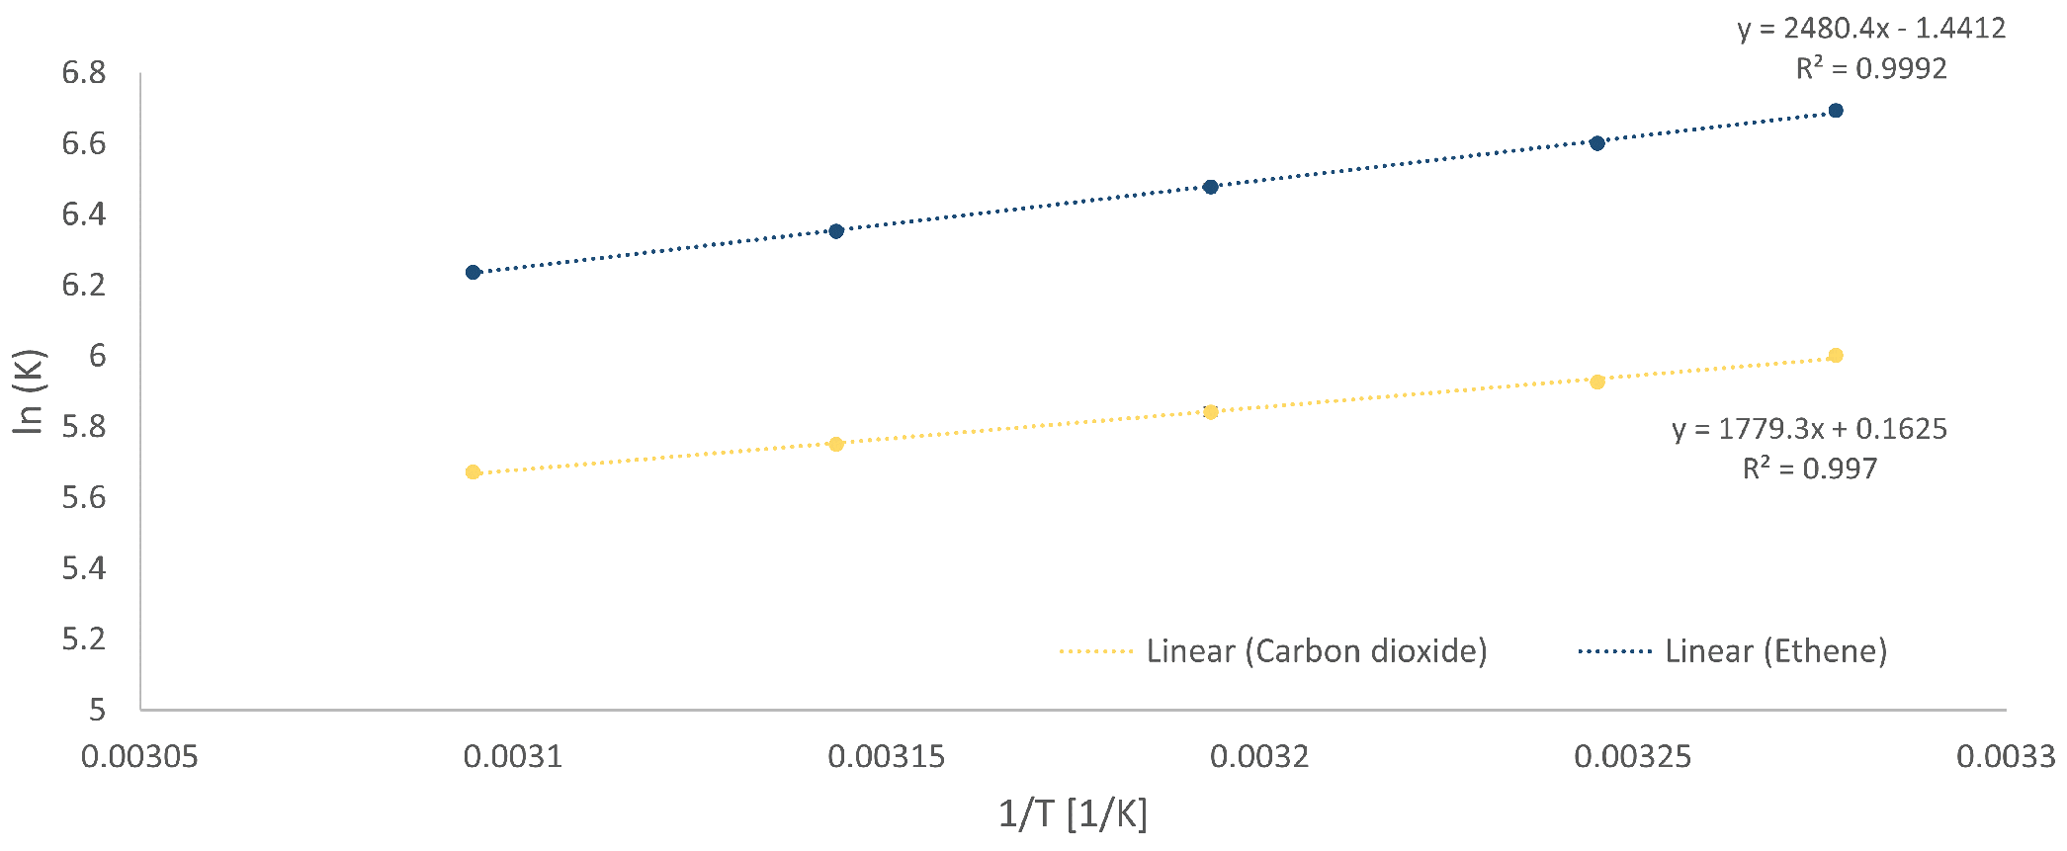
Figure 2The van 't Hoff plots for ethene (blue) and CO2 (yellow) for the GS-Q column with 0.32 mm i.d.
3.1 Ethene ambient-air measurements
A chromatogram for a mixture of 100 ppm ethene in ambient air is shown in Fig. 3. The gross retention time of CO2 was at 2.675 min (net retention time was at 1.243 min), the gross retention time for ethene was at 3.090 min (net retention time at 2.179 min). Both gross retention times and their respective holdup times can be seen in Fig. 3, where the SGP40 response is shown by the blue curve (ethene signal) and the IR-sensor response is shown by the yellow curve (CO2 signal). For better visualization, both baselines were aligned in the middle of the chromatogram.
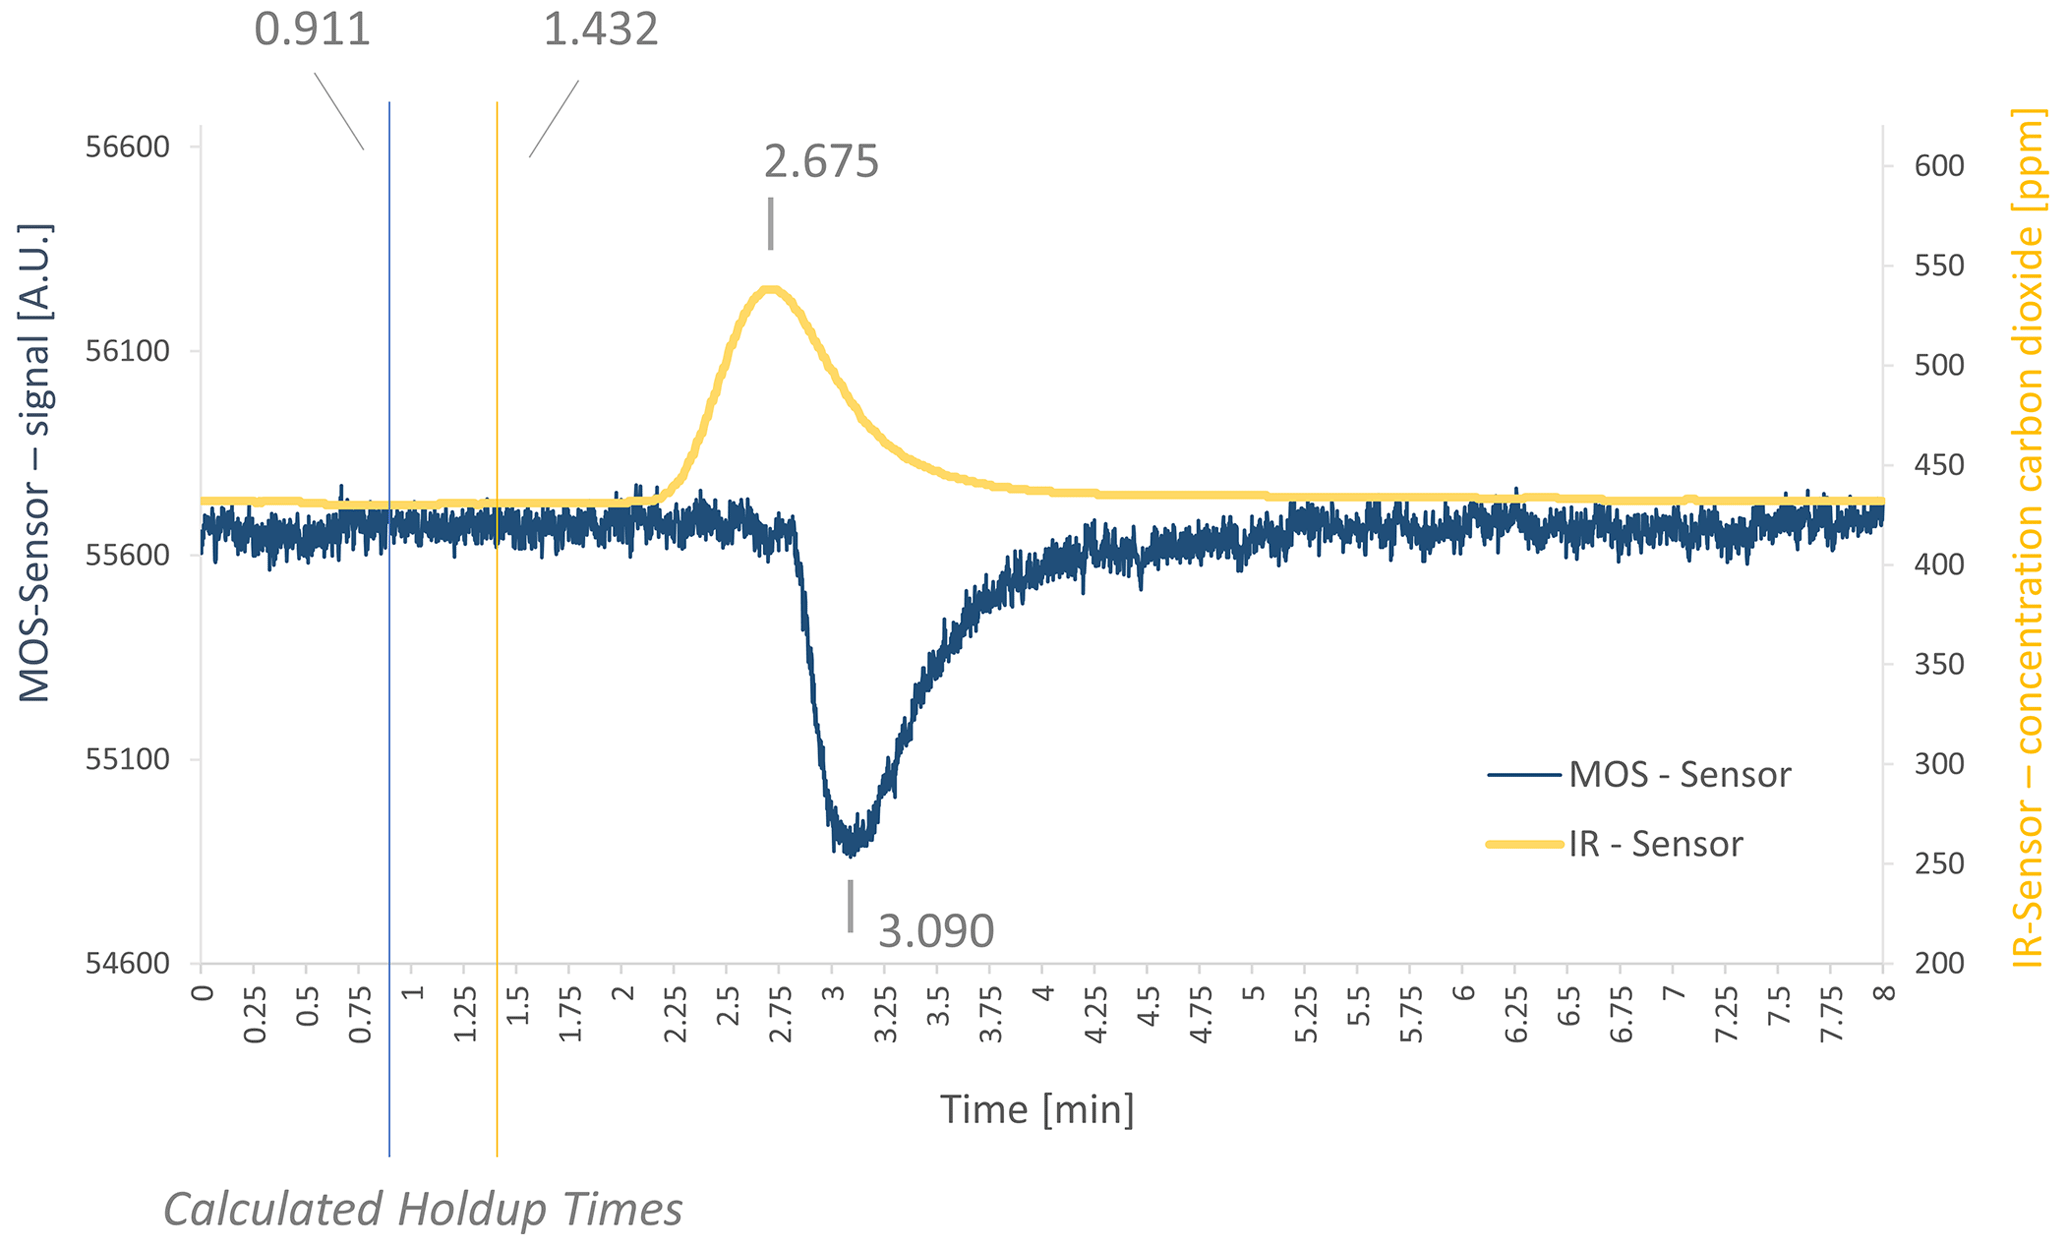
Figure 3Chromatogram of the measurement with an air ethene mixture in the demonstrator setup with gross retention times marked and calculated holdup times. Shown here is measurement no. 7 of the ethene air mixture measurements as shown in Table 3.
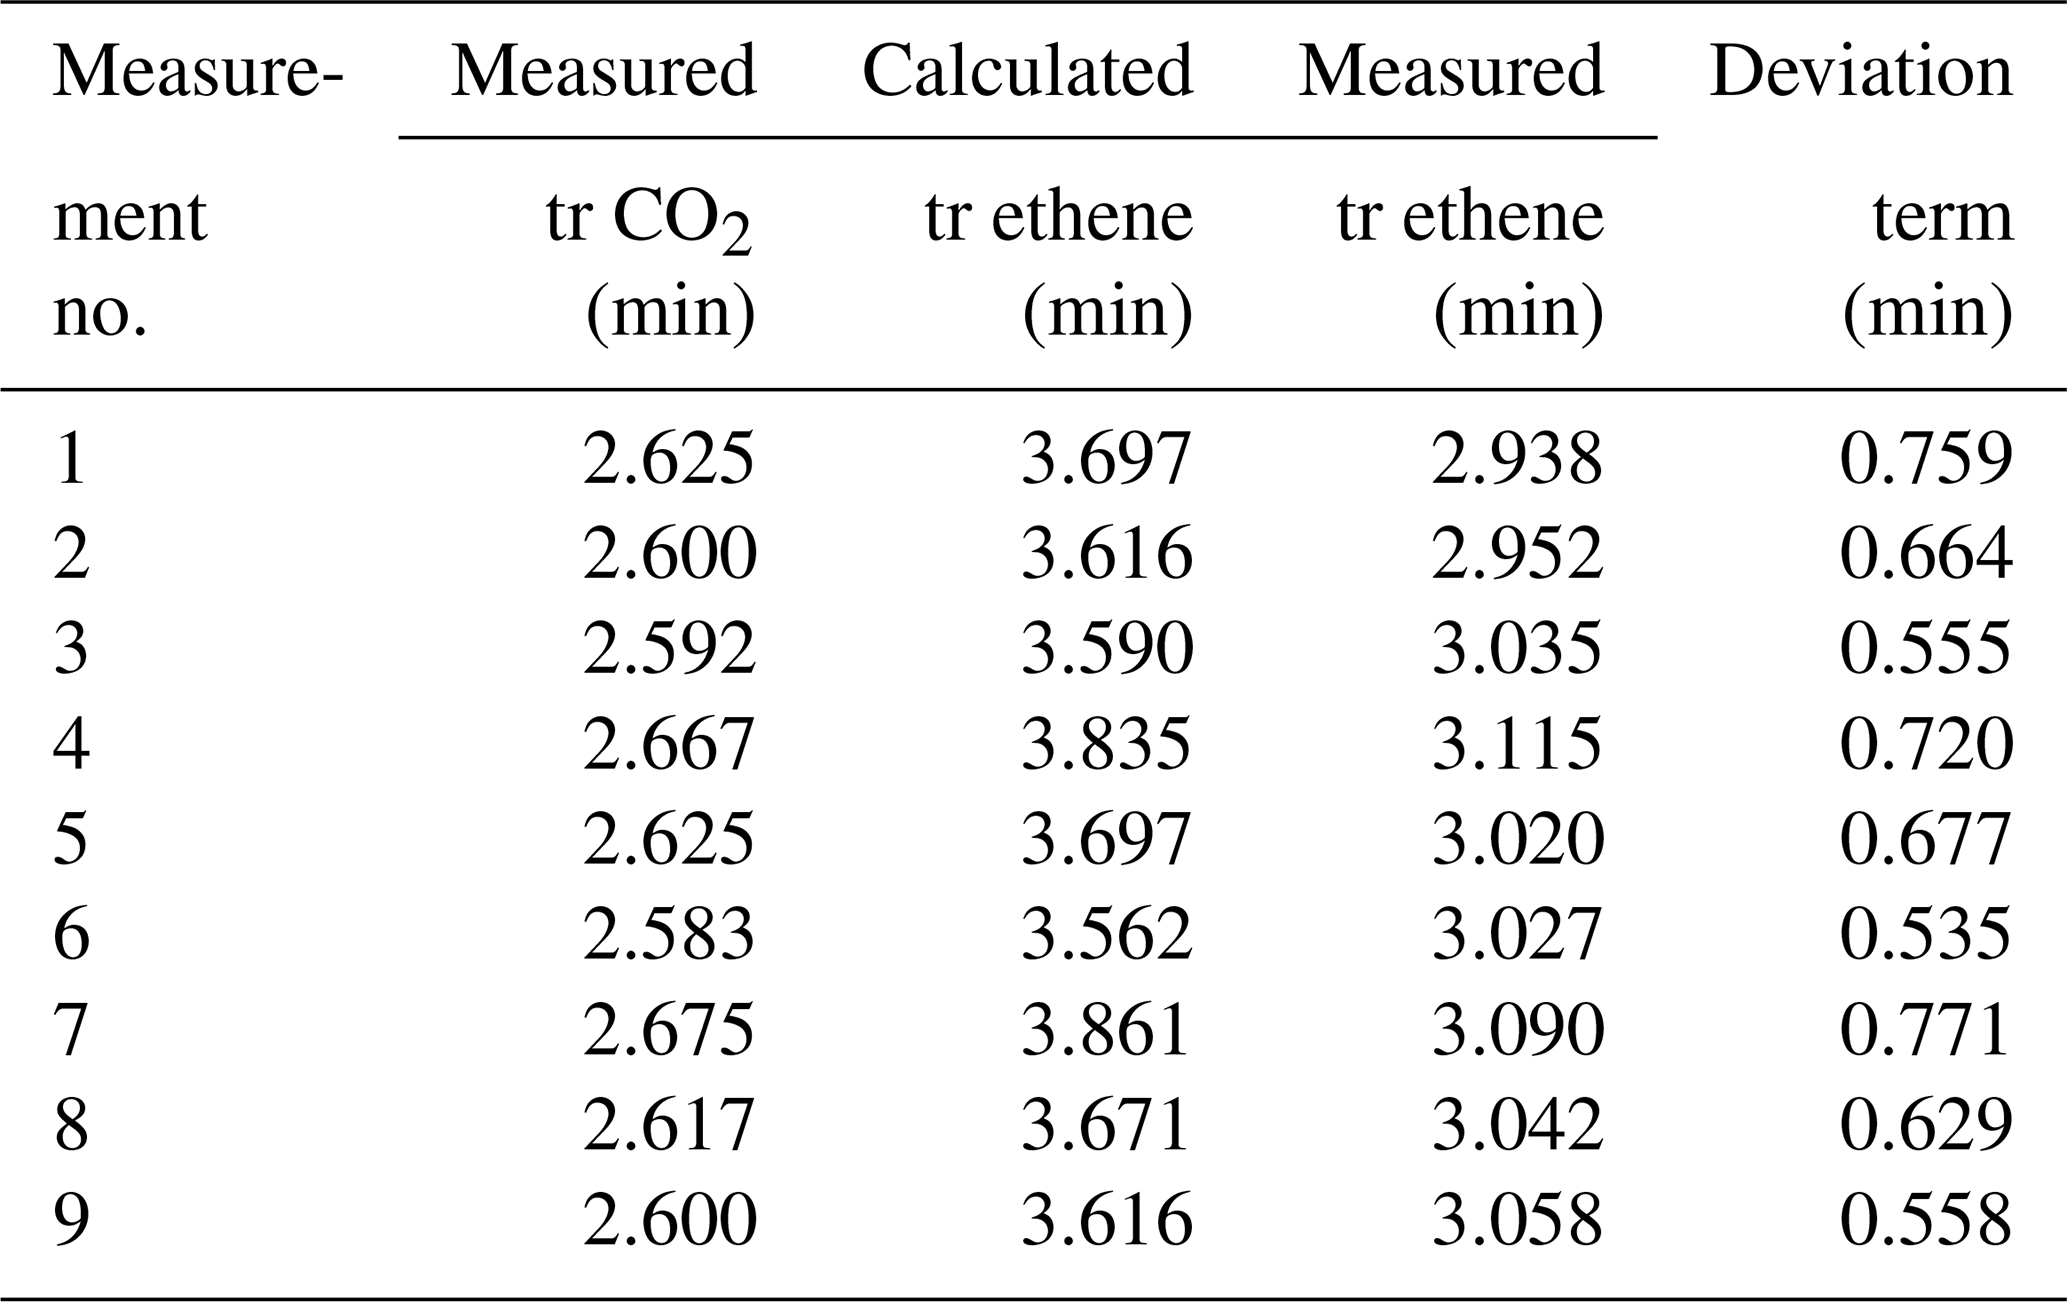
The retention times of CO2 for each individual measurement were compared and respective retention times for ethene were predicted. Afterwards, the predicted values were compared to the effectively measured retention times (see Table 3). The mean measured retention time of ethene was 3.031 min, the mean calculated retention time was 3.683 min. It is noticeable that a time offset occurs in all calculations. To determine this offset, the mean value (0.652 min) was used as the best estimation for this offset. Thereby, the results vary around the mean value in a small band between 0.533 and 0.759 min. The exact reason for this dispersion has not yet been investigated but needs to be considered in future. A possible reason may be a divergence of the calculated holdup volumes (based on the manufacturer's specifications) to the actual holdup volumes. Nevertheless, this indicates that the algorithm itself is predicting reasonably. But some parameters may be different than assumed, and the deviation of the prediction from the actual measured value needs to be considered (see Table 3).
Table 3Measured and predicted ethene gross retention times (tr) with GC–MOS/IR in the demonstrator setup for ethene ambient-air mixtures.
3.2 Interfering-gases ambient-air measurements
In a next step, the mixture of interfering gases (see Table 1) was measured. A chromatogram is shown in Fig. 4. The sensor response shows three peaks for the SGP40 (blue curve) and one peak for the IR sensor (yellow curve). The first peak at the SGP40 response occurs at a gross retention time of 1.680 min (net retention time 0.769 min) and was assigned to methane, according to the PLOT characteristics provided by Agilent Technologies (Agilent Technologies, 2023). The second peak has a gross retention time of 3.133 min (net retention time 2.222 min) and corresponds to ethene, while the third peak has a gross retention time of 3.625 min (net retention time 2.714 min) and corresponds to ethane. The respective holdup times were marked in the chromatogram as well. Comparing the list of interfering gases to the manufacturer's user manual of the PLOT column, the sensor should give a signal for ethane, ethene, ethyne, and methane. As ethyne occurs on the PLOT column between ethene and ethane, and as the ethyne concentration is much lower than the ethane and ethene concentrations (see Table 1), the ethyne peak might not be visible here, due to overlapping with other peaks. As a consequence, just methane, ethene, and ethane can be seen here. For the IR sensor, a peak occurs at a gross retention time of 2.675 min (net retention time 1.243 min).
The retention times of all three peaks were listed next to the CO2 retention times (Table 4), and ethene retention times were predicted via the TCA. Additionally, the predicted values were corrected by the mean deviation factor determined in the previous measurements (see Table 4).
It appears that simply predicted retention times differ from the actual measured retention times as well (see Table 4, columns three and six). Applying the system-specific deviation term for the unknown holdup time γ, new predicted retention times fit much better to measured times. The corrected retention times can be assigned to peak no. 2 from the three occurring peaks (see Table 4), with small deviations (mean deviation is about ± 0.162 min). The mean retention time of peak no. 2 is 3.093 min; the mean predicted retention time is 3.099 min.
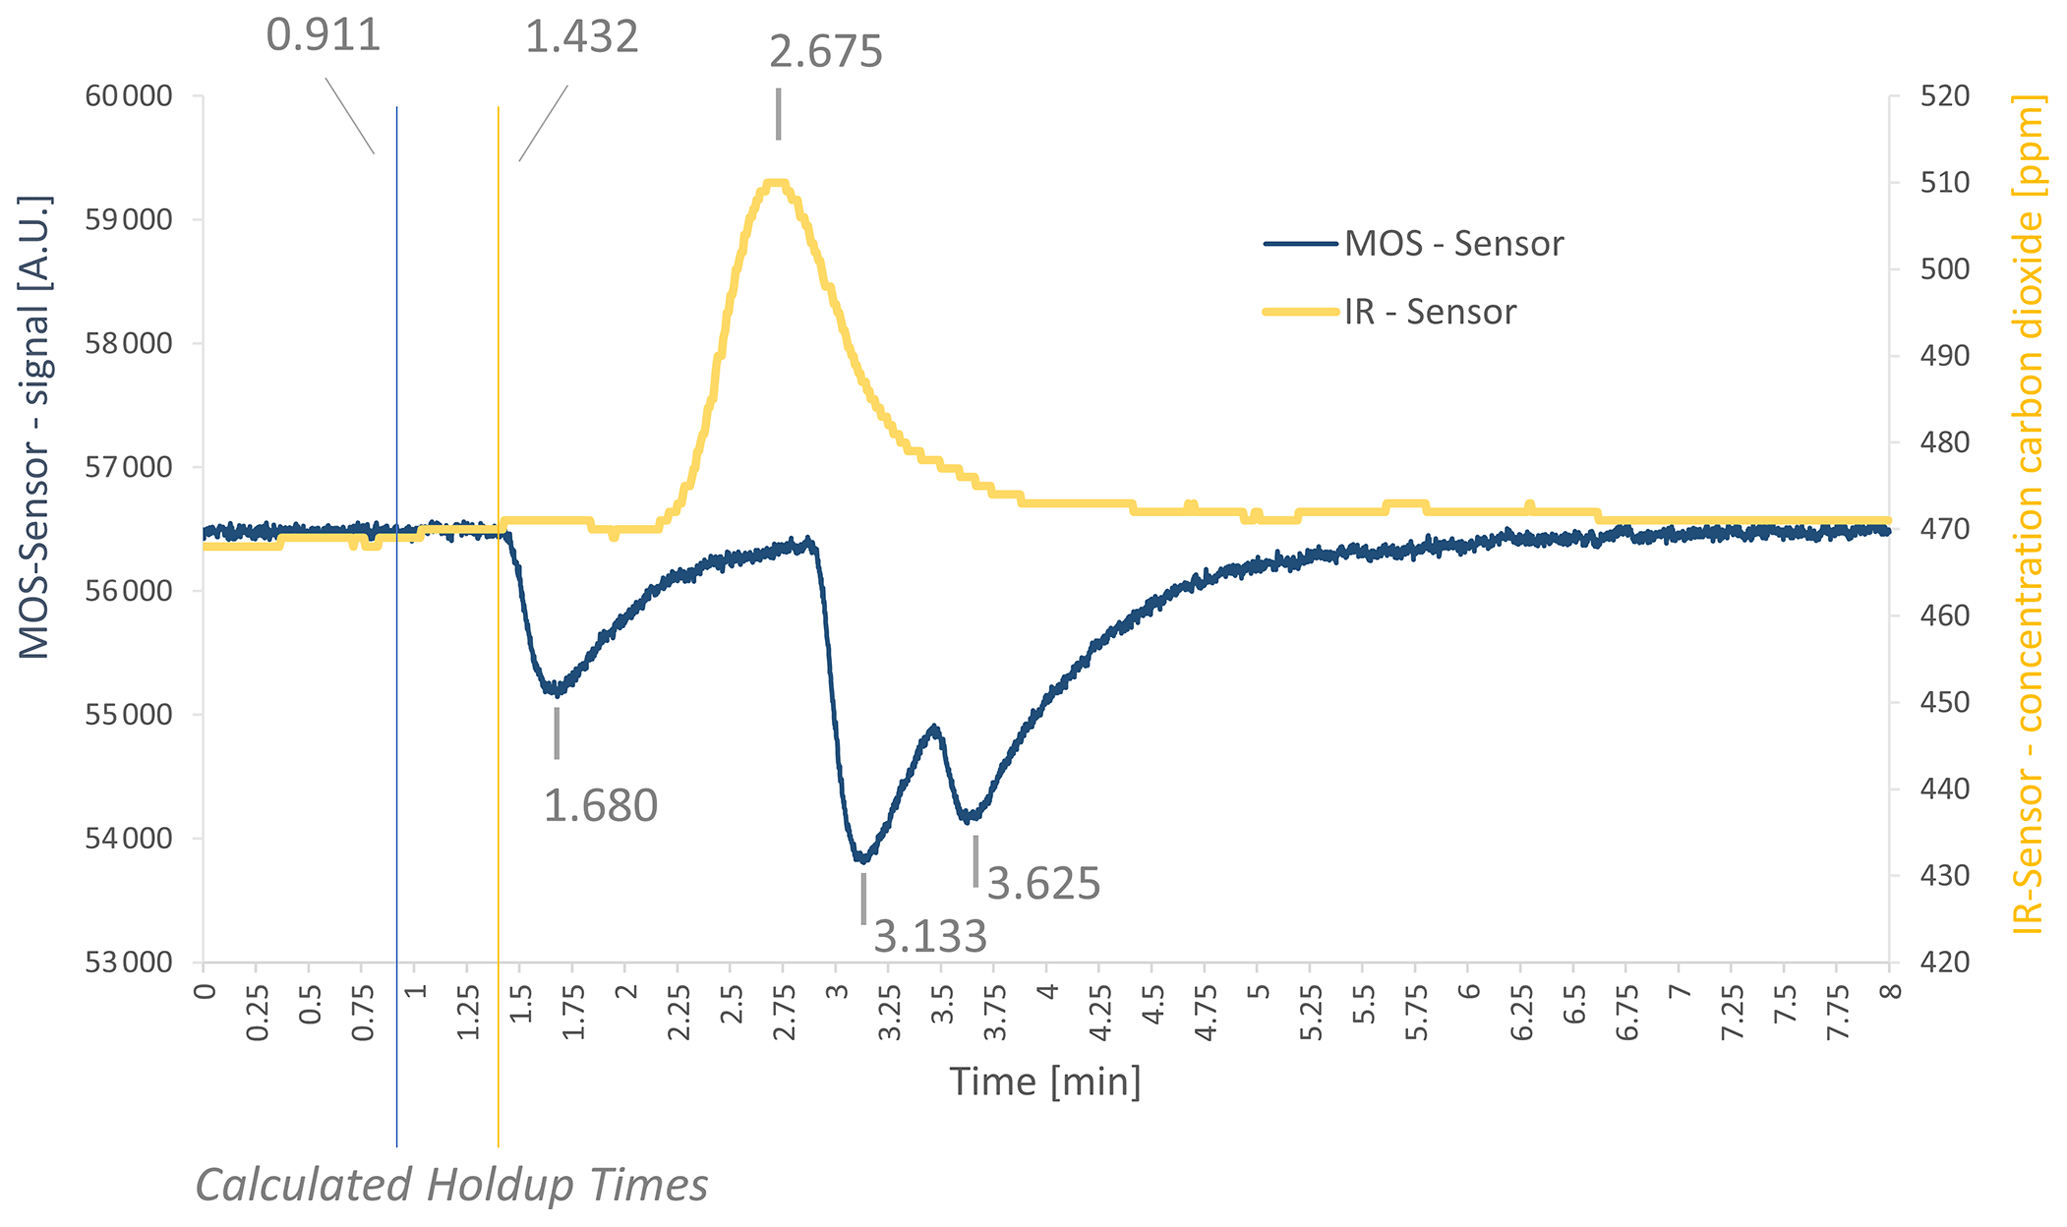
Figure 4Chromatogram of the measurement with a mixture of interfering gases in the demonstrator setup with gross retention times as well as calculated holdup times. Shown here is measurement no. 7 (see Table 4) of the ethene interfering-gases measurements.
Table 4Gross retention times of measurements with interfering-gases ambient air, ethene peak prediction, and peak correction (cor.).
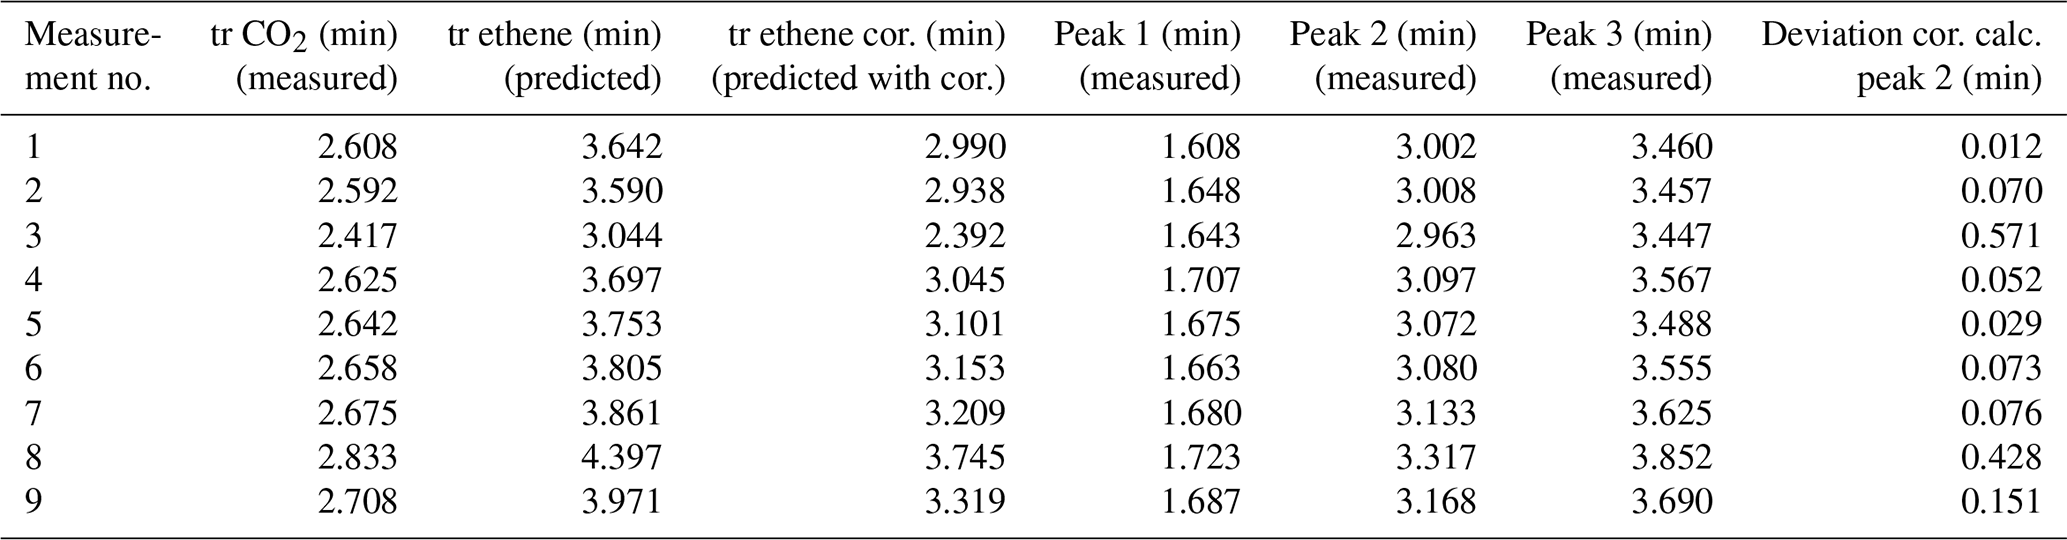
However, it is noticeable that the deviations of the predicted from the measured ethene values are higher for measurement nos. 3 and 8 than for the other measurements. Thus, measurement no. 3 already shows a deviation of the measured CO2 gross retention time (2.417 min) compared to the other CO2 retention times measured at room temperature (which is approx. 2.6 min; see Table 4). The predicted and by the correction term adjusted ethene value is 2.392 min, and thus it deviates 0.571 min from the actual measured value of 2.963 min. The compensation appears to be stronger than any underlying effects. For measurement no. 8, the CO2 gross retention time is 2.833 min, which is also a deviation from the others at room-temperature-measured CO2 values. Here, the predicted and correction-term-adjusted ethene value is 3.745 min, deviating by 0.428 min from the actual measured value of 3.317 min. The compensation here is too strong as well. The algorithm thus seems to overcompensate for those two cases. Since the CO2 retention time is used as reference value for the prediction, a small error in the CO2 retention time can already lead to a large error in the ethene prediction time. Therefore, a further investigation and adjustment is necessary in future work to avoid such overcompensation effects for small changes in CO2 retention time. Nevertheless, the TCA combined with a system-specific deviation term for the holdup time is able to predict the desired retention times of a target gas. This means that, for further applications, a two-step approach needs to be considered: first a characterization of the column (for the sorption parameters) and second a determination of a system-specific offset γ, leading to Eq. (8) for the TCA:
The construction of a simple demonstrator with temperature compensation was demonstrated, consisting of the combination of a MOS sensor as low-cost detector and a CO2-specific IR sensor. The setup used an in-house measurement platform that is able to characterize single components for GC applications. Thereby, a MOS sensor (SGP40) and an IR sensor (FLOWEVO) were connected with a PLOT column, implemented in an isothermal polystyrene-foam box. A stream of nitrogen as carrier gas and a make-up stream consisting of zero air were used to run the demonstrator. The determination of the ethene retention time could be realized, based on the previously identified sorption coefficients of the column, the temperature compensation algorithm combined with a system-specific correction term, and the (via an IR-sensor) measured CO2 retention time. The system-specific correction term, γ, is necessary, as the holdup time has an influence on the prediction, but mathematical and experimental determination of the holdup time remains difficult. The approach used here is based on rudimentary approximations by determining the holdup volumes and accounting for the flow velocities. Further but more complex mathematical holdup time determinations could be considered for further work (Wu et al., 2013), supplementary to the reduction of the holdup volume. Additionally, an overcompensation might occur, as small changes in the CO2 retention time have a greater influence on the predicted ethene retention values than the actual underlying effects. Further measurements with different column types, a reduction of the holdup volume, and different make-up connectors might reduce these factors or even make them redundant. Currently, a two-step approach is necessary to implement the TCA on a measurement system, where in a first step the sorption parameters are determined, and the system-specific holdup time deviation factor is determined in a second step.
Nevertheless, the applied PLOT column could enhance the sensor's selectivity. Measurements with a mixture of interfering gases showed that the chosen setup of cheap, commercial sensors and an isothermally operated GC separation column without using an oven is, in principle, suitable for ethene detection from a mixture of interfering gases. In further research, the holdup volume should be minimized to overcome deviations, which also might enhance the peak separation of ethene and ethane. The holdup volume of the detection chamber is presumably the main influencing factor on the peak width. By the comparison of the peak widths of ethene in the chromatograms of the benchtop gas chromatograph (∼ 10 s, Fig. S1) with those of the chromatograms of the sensor setup (∼ 60 s, Figs. 3 and 4), a difference can be observed. The contribution of the column (the same for both setups) to the peak broadening tends to be smaller than that contribution of the holdup volume, which is negligibly low for the PDD, in contrast to the holdup volumes of the sensor chamber (Table 2). Therefore, a better peak separation could be achieved by reducing the holdup volume within the sensor chamber. In this case, a reduction in column length could be considered. In addition, signal processing can provide a better baseline separation as well (Eberheim, 2003; Drix and Schmuker, 2021). Therefore, signal processing will be implemented in the future. Further, two sensors are required currently, as CO2 was chosen as reference gas. For future approaches, another specifically detectable gas could be chosen as a reference gas. Therefore, this reference gas should fulfill two criteria. First, its retention time on the column should be around the same order but not equal to ethene (clearly baseline separable), to enable the usage of the same column for both compounds. Second, it should show specific detection characteristics on the sensor, so that it can be determined from possibly occurring interfering gases. These specific determination characteristics could be fulfilled either by a kind of filter system or by special features within the sensor's response (like slope behavior, signal intensity, or others). This avoids a second holdup time with additional holdup volume for the second sensor chamber. Thus, a basic concept for a compensation of temperature effects could be demonstrated in a first approach, leading to an economization of the heating system and a simple peak identification based on reference gases. This approach can be extended to all permanent gases and therefore be applied in a broad range of applications. It enables the realization of a cost-effective analytical measuring instrument, based on gas chromatography, for the cheap and miniaturized detection of ethene.
Our code used for the peak detection is available in an OSF repository (https://osf.io/mzdhn/, last access: 3 August 2023; https://doi.org/10.17605/OSF.IO/MZDHN, Singh, 2023). In addition, we used the publicly available library “PeakDetect” (https://github.com/avhn/peakdetect, Dede, 2023). More information can be provided by the corresponding authors on reasonable request.
The supplement related to this article is available online at: https://doi.org/10.5194/jsss-12-215-2023-supplement.
Conceptualization: MK and TS; investigation: MK and CS; formal analysis: MK and SS; methodology: MK and TS; software: AG; supervision: GZ and TS; writing – original draft preparation: MK; writing – review and editing: MK, GZ, and TS.
The contact author has declared that none of the authors has any competing interests.
Publisher’s note: Copernicus Publications remains neutral with regard to jurisdictional claims in published maps and institutional affiliations.
This research has been supported by the Bayerische Staatsministerium für Wirtschaft, Landesentwicklung und Energie (Bavarian State Ministry of Economic Affairs, Regional Development and Energy) as part of the project “Campus der Sinne” (Campus of the Senses, grant no. 20-3410-2-14-3).
This paper was edited by Thomas Fröhlich and reviewed by two anonymous referees.
Agilent Technologies: Agilent J&W Column Performance Summary GS-Q, Light Hydrocarbon, https://www.agilent.com/en/products/gas-chromatography/gc-columns/capillary/gs-q/gp43071, last access 31 July 2023.
Azzouz, I. and Bachari, K.: MEMS Devices for Miniaturized Gas Chromatography, IntechOpen, 149–169, https://doi.org/10.5772/intechopen.74020, 2018.
Baur, T., Schultealbert, C., Schütze, A., and Sauerwald, T.: Novel method for the detection of short trace gas pulses with metal oxide semiconductor gas sensors, J. Sens. Sens. Syst., 7, 411–419, https://doi.org/10.5194/jsss-7-411-2018, 2018a.
Baur, T., Schultealbert, C., Schütze, A., and Sauerwald, T.: Device for the detection of short trace gas pulses, tm – Technisches Messen, 496–503, https://doi.org/10.1515/teme-2017-0137, 2018b.
Cagliero, C., Galli, S., Galli, M., Elmi, I., Belluce, M., Zampolli, S., Sgorbini, B., Rubiolo, P., and Bicchi, C.: Conventional and enantioselective gas chromatography with microfabricated planar columns for analysis of real-world samples of plant volatile fraction, J. Chromatogr. A, 1429, 329–339, https://doi.org/10.1016/j.chroma.2015.12.037, 2016.
Caprioli, F. and Quercia, L.: Ethylene detection methods in post-harvest technology: A review, Sensors Actuat. B-Chem., 203, 187–196, https://doi.org/10.1016/j.snb.2014.06.109, 2014.
Costello, B. P. J. d. L., Ewen, R. J., Gunson, H. E., Ratcliffe, N. M., and Spencer-Phillips, P. T. N.: The development of a sensor system for the early detection of soft rot in stored potato tubers, Meas. Sci. Technol., 11, 1685–1691, https://doi.org/10.1088/0957-0233/11/12/305, 2000.
Costello, B. P. J. d. L., Ewen, R. J., Gunson, H., Ratcliffe, N. M., Sivanand, P. S., and Spencer-Phillips, P. T. N.: A prototype sensor system for the early detection of microbially linked spoilage in stored wheat grain, Meas. Sci. Technol., 14, 397–409, https://doi.org/10.1088/0957-0233/14/4/301, 2003.
De Biasio, M., Leitner, R., Krall, C., Krivec, M., Wilk, A., Mizaikoff, B., Waldner, R., Starmans, F., and Maier, D.: Ethylene gas sensing using non-dispersive infrared spectroscopy, EEE Sensors 2016, 30 October–2 November 2016, Orlando, Florida, USA, IEEE Sensors J., 1–3, https://doi.org/10.1109/ICSENS.2016.7808682, 2016.
Dede, M.: PeakDetect, GitHub [code], https://github.com/avhn/peakdetect, last access: 17 February 2023.
Drix, D. and Schmuker, M.: Resolving Fast Gas Transients with Metal Oxide Sensors, ACS Sensors, 6, 688–692, https://doi.org/10.1021/acssensors.0c02006, 2021.
Eberhardt, A., Bauersfeld, M. L., Schmitt, K., and Wöllenstein, J.: Filterrotationsspektrometer für den Nachweis von Ethen im ppb-Bereich, tm – Technisches Messen, 87, 164–176, https://doi.org/10.1515/teme-2019-0141, 2020.
Eberheim, A.: Qualifizierung von Halbleiter-Gassensoren für die Detektion spezifischer organischer Rauchgaskomponenten, Qualifying semiconductor gas sensors for the detection of specific organic smoke compounds, doctoral thesis, GEB – Giessener Elektronische Bibliothek, University of Giessen, https://doi.org/10.22029/jlupub-9504, 2003.
Elik, A., Yanik, D. K., Istanbullu, Y., Guzelsoy, N. A., Yavuz, A., and Gogus, F.: Strategies to Reduce Post-Harvest Losses for Fruits and Vegetables, JSTR, 5, 29–39, https://doi.org/10.7176/jstr/5-3-04, 2019.
Fonollosa, J., Halford, B., Fonseca, L., Santander, J., Udina, S., Moreno, M., Hildenbrand, J., Wöllenstein, J., and Marco, S.: Ethylene optical spectrometer for apple ripening monitoring in controlled atmosphere store-houses, Sensors Actuat. B-Chem., 136, 546–554, https://doi.org/10.1016/j.snb.2008.12.015, 2009.
Gustavsson, J., Cederberg, C., Sonesson, U., Van Otterdijk, R., and Meybeck, A.: Global food losses and food waste, Save Food Congress, 16 May 2011, Düsseldorf, Germany, Swedish Institute for Food and Biotechnology, ISBN 978-92-5-107205-9, https://www.fao.org/documents/card/es/c/I2697E/ (last access: 2 August 2023), 2011.
Hildenbrand, J., Wöllenstein, J., Hartwig, S., Eberhardt, A., Halford, B., Moreno, M., Fonollosa, J., Fonseca, L., Santander, J., Rubio, R., Gràcia, I., and Cané, C.: A compact optical multichannel system for ethylene monitoring, Microsyst. Technol., 14, 637–644, https://doi.org/10.1007/s00542-007-0475-1, 2008.
Hu, B., Sun, D. W., Pu, H., and Wei, Q.: Recent advantages in detecting and regulating ethylene concentrations for shelf-life extension and maturity control of fruit: A review, Trend. Food Sci. Technol., 66–82, https://doi.org/10.1016/j.tifs.2019.06.010, 2019.
Janssen, S., Tessmann, T., Niessen, M., Sklorz, A., and Lang, W.: Large-capacity-on-chip preconcentrator device for selective ethylene measurement below 400 PPBV, in: 2013 Transducers & Eurosensors XXVII: The 17th International Conference on Solid-State Sensors, Actuators and Microsystems (TRANSDUCERS & EUROSENSORS XXVII), Barcelona, Spain, 16–20 June 2013, 2771–2774, 2013.
Janssen, S., Tessmann, T., and Lang, W.: High sensitive and selective ethylene measurement by using a large-capacity-on-chip preconcentrator device, Sensors Actuat. B-Chem., 197, 405–413, https://doi.org/10.1016/j.snb.2014.02.001, 2014a.
Janssen, S., Schmitt, K., Blanke, M., Bauersfeld, M. L., Wöllenstein, J., and Lang, W.: Ethylene detection in fruit supply chains, Philos. Trans. A, 372, 20130311, https://doi.org/10.1098/rsta.2013.0311, 2014b.
Jedermann, R., Poetsch, T., and Lang, W.: Smart Sensors for the Intelligent Container, in: Smart SysTech 2014, European Conference on Smart Objects, Systems and Technologies, Dortmund, Germany, 1–2 July 2014, 1–2, 2014.
Ji, H., Zeng, W., and Li, Y.: Gas sensing mechanisms of metal oxide semiconductors: a focus review, Nanoscale, 11, 22664–22684, https://doi.org/10.1039/C9NR07699A, 2019.
Köhne, M., Zeh, G., Schmidt, C., and Sauerwald, T.: P13.4 – Entwicklung eines kostengünstigen Gaschromatographie-Systems für die Messung von Reifegas mit Kompensation der Temperatureinflüsse auf die Säule, Poster, 338–342, https://doi.org/10.5162/15dss2021/P13.4, 2021.
Lang, W., Janßen, S., and Jedermann, R. (Eds.): The Intelligent Container – A Cognitive Sensor Net for Fruit Logistics, in: Proceedings of the 3rd International Conference on Sensor Networks, 7–9 January 2014, Lisbon, Portugal, Volume 1: SENSORNETS, 351–359, https://doi.org/10.5220/0004705703510359, 2014.
Lucklum, F., Janssen, S., Lang, W., and Vellekoop, M. J.: Miniature 3D Gas Chromatography Columns with Integrated Fluidic Connectors Using High-resolution Stereolithography Fabrication, Procedia Engineering, 120, 703–706, https://doi.org/10.1016/j.proeng.2015.08.761, 2015.
Paul, V. and Pandey, R.: Role of internal atmosphere on fruit ripening and storability-a review, J. Food Sci. Technol., 51, 1223–1250, https://doi.org/10.1007/s13197-011-0583-x, 2014.
Pereira, L., Pujol, M., Garcia-Mas, J., and Phillips, M. A.: Non-invasive quantification of ethylene in attached fruit headspace at 1 p.p.b. by gas chromatography-mass spectrometry, The Plant J., 91, 172–183, https://doi.org/10.1111/tpj.13545, 2017.
Porat, R., Lichter, A., Terry, L. A., Harker, R., and Buzby, J.: Postharvest losses of fruit and vegetables during retail and in consumers' homes: Quantifications, causes, and means of prevention, Postharvest Biol. Tec., 139, 135–149, https://doi.org/10.1016/j.postharvbio.2017.11.019, 2018.
Sandfort, V., Goldschmidt, J., Wöllenstein, J., and Palzer, S.: Cavity-Enhanced Raman Spectroscopy for Food Chain Management, Sensors, 18, 709, https://doi.org/10.3390/s18030709, 2018.
Schmitt, K., Müller, A., Huber, J., Busch, S., and Wöllenstein, J.: Compact photoacoustic gas sensor based on broadband IR source, Proc. Eng., 25, 1081–1084, https://doi.org/10.1016/j.proeng.2011.12.266, 2011.
Sensirion: SGP40 – VOC sensor for HVAC and air quality applications: Datasheet SGP40, https://sensirion.com/products/catalog/SGP40/ (last access: 19 January 2023), 2022.
Singh, S.: EPD-GC, OSF [code], https://doi.org/10.17605/OSF.IO/MZDHN, 2023.
Sklorz, A., Miyashita, N., Scha, A., and Lang, W.: Low level ethylene detection using preconcentrator/sensor combinations, in: 2010 IEEE Sensors, Kona, HI, 1–4 November 2010, 2494–2499, 2010.
Sklorz, A., Janssen, S., and Lang, W.: Application of a miniaturised packed gas chromatography column and a SnO2 gas detector for analysis of low molecular weight hydrocarbons with focus on ethylene detection, Sensors Actuat. B-Chem., 180, 43–49, https://doi.org/10.1016/j.snb.2011.12.110, 2013.
Sklorz, A., Alamin Dow, A. B., Mrugala, D., Jedermann, R., Benecke, W., and Lang, W.: In-Situ Ethylen Konzentrationsmesssysteme für die Qualitätsüberwachung in der Fruchtlogistik, 10. DFMRS Fachtagung, Bremen, Germany, 27–28 February 2008, 50–71, ISSN 0944-694X, 2008.
Thyberg, K. L. and Tonjes, D. J.: Drivers of food waste and their implications for sustainable policy development, Resources, Conservation and Recycling, 106, 110–123, https://doi.org/10.1016/j.resconrec.2015.11.016, 2016.
Wang, C., Yin, L., Zhang, L., Xiang, D., and Gao, R.: Metal oxide gas sensors: sensitivity and influencing factors, Sensors (Basel, Switzerland), Sensors, 10, 2088–2106, https://doi.org/10.3390/s100302088, 2010.
Wu, L., Chen, M., Chen, Y., and Li, Q. X.: Determination and evaluation of gas holdup time with the quadratic equation model and comparison with nonlinear models for isothermal gas chromatography, J. Chromatogr. A, 1297, 196–203, https://doi.org/10.1016/j.chroma.2013.04.078, 2013.
Zaidi, N. A., Tahir, M. W., Vellekoop, M. J., and Lang, W.: A Gas Chromatographic System for the Detection of Ethylene Gas Using Ambient Air as a Carrier Gas, Sensors (Basel, Switzerland), 17, https://doi.org/10.3390/s17102283, 2017.