the Creative Commons Attribution 4.0 License.
the Creative Commons Attribution 4.0 License.
 | 20 Mar 2023
Assisting the automated analysis of chemical–analytical measurements in spirits using validated algorithms and an intuitive user interface
Andreas T. Grasskamp
Satnam Singh
Helen Haug
Tilman Sauerwald
Exhaustive analysis of chemical measurements requires considerable expenditure of time and personnel. However, many aspects of this can be automated by translating manual work into objective algorithmic routines. To this end, we developed adaptable software for gas chromatography data and validated analysis steps using whisky samples. We employed an unspecific, larger, in-house volatile organic compound (VOC) database and another specifically curated database of 217 known whisky chemicals, to automate database-matching based on mass spectra and retention indices. We managed to reduce the amount of necessary interaction, facilitated complex analysis for the less experienced user, and showed that characteristic whisky components constituted the majority of detected molecules in all 16 analyzed samples. With this approach, we present a decisive contribution towards the automated assessment of aroma profiles in food.
- Article
(1337 KB) - Full-text XML
- BibTeX
- EndNote


Aroma compounds determine the perceptual experience of flavors in beverages and foods. The widely enjoyed whisky spirit contains a complex mixture of many different aroma compounds (e.g., Câmara et al., 2007; Poisson and Schieberle, 2008a). These odorous volatile organic compounds (VOCs) determine the aroma profile perceived by the consumer. They can be identified by a combination of rigorous chemical analysis and olfactory measurements and have been reported in literature (Jeleń et al., 2019; Poisson and Schieberle, 2008a, b). Analyzing a mixture such as whisky which contains high levels of non-odorant and odorant compounds (Câmara et al., 2007; Demyttenaere et al., 2003; Poisson and Schieberle, 2008a) with varying odor thresholds (Poisson and Schieberle, 2008b) requires a selective, highly resolved, and dynamic measurement technology to capture all relevant odor determinants. Instrumental chemical analysis methods using gas chromatography–mass spectrometry (GC-MS) are currently established as the most powerful approaches to detect and identify these VOCs. For the identification of odorants, the combination of GC or GC-MS with olfactometry denoted as GC-MS/O is a widely applied method (d'Acampora Zellner et al., 2008b; Jeleń et al., 2019; Poisson and Schieberle, 2008a). However, this process is afflicted with high costs due to its high demands in technical equipment and time, especially regarding the analysis of acquired data. Therefore, the desire for an efficient and reliable method for detection of the decisive ingredients is high. Here, we propose one such method employing intuitive user guidance and adaptable purpose to facilitate analysis and reduce data interaction for the less experienced user. In addition to matching unknown VOCs using an in-house database consisting of > 700 mostly odor-active molecules, we validated our method by comparing standard software from the field. A list of > 200 whisky components (yielded from, e.g., Câmara et al., 2007; Daute et al., 2021; Demyttenaere et al., 2003; Jeleń et al., 2019; Poisson and Schieberle, 2008a) specifically designed for this purpose was further used to assess the plausibility of detection, although not using reference standards normally employed for identification beyond reasonable doubt. Lastly, we checked the plausibility of our approach by automatically classifying substance groups in 16 whisky samples from two geographic origins using an established method (Djoumbou Feunang et al., 2016).
The principal approach in conventional and semi-automated analysis after GC-MS measurements is schematically depicted in Fig. 1. Special attention was given to reduce the amount of necessary user interaction and maximize the output of comprehensible information.
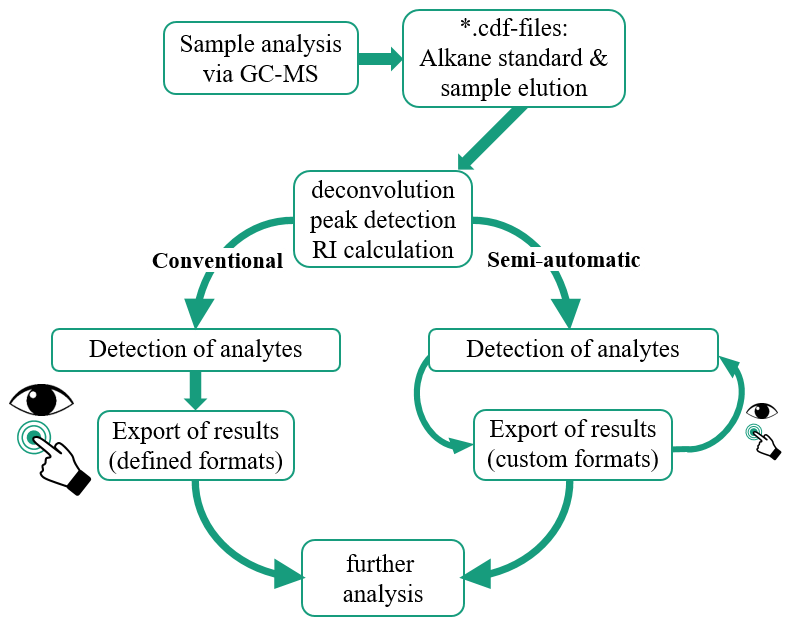
Figure 1Process of sample analysis in conventional and in our proposed semi-automated analysis. Eye and hand icons indicate data inspection and interaction, with their size relative to the necessary amounts of these actions.
2.1 Data acquisition: stir bar sorptive extraction thermal desorption (SBSE–TD) GC-MS
Samples of 16 different, commercially available whisky spirits were analytically evaluated, as described in our own work (Haug et al., 2023). Among these samples, nine were of Scotch and seven of American denomination. Native alcohol contents varied from 40 % to 50.5 % by volume (ABV). To ensure comparability, all samples were brought to 40 % ABV with mineral drinking water where necessary. In order to extract volatile components, all samples were processed using stir bar sorptive extraction (SBSE; Baltussen et al., 1999) in conjunction with polydimethylsiloxane (PDMS)-coated Gerstel Twisters® (1 cm length, 0.5 mm coat thickness; GERSTEL GmbH & Co. KG, Mühlheim a. d. Ruhr, Germany). In short, an aliquot of each sample was taken, mixed with a standard solution of 4-chloro-2-methoxyphenol (Sigma Aldrich, Steinheim, Germany) and undecane (Sigma Aldrich, Steinheim, Germany) in ethanol (VWR International GmbH, Darmstadt, Germany), diluted with deionized water, and finally mixed with sodium chloride (Th. Geyer GmbH & Co. KG, Renningen, Germany). Following extraction using the Twister®, thermal desorption, and subsequent cryo-focusing (Gerstel TDU and KAS, GERSTEL GmbH & Co. KG, Mühlheim a. d. Ruhr, Germany), analytes were transferred to the GC-MS instrument (Trace GC Ultra, DSQ II, Thermo Fisher Scientific GmbH, Dreieich, Germany). Carrier gas flux (helium) over the thermal desorption unit (TDU) was set to 50 mL min−1. Separation was carried out through a DB-FFAP (Durabond free fatty acid phase) column (30 m × 0.25 mm, coat thickness of 0.25 µm; J & W Scientific, Agilent Technologies, Waldbronn, Germany). Mass spectrometric detection in electron ionization (EI) mode was performed at 70 eV, and ions were detected in full scan mode (mass-to-charge ratio, 35–399). In parallel, in order to measure linear retention index values (L-RI; written as RI for brevity), an n-alkane standard mix (C6-C26) was analyzed under the same GC conditions. The generated .raw files were converted to .cdf files using Xcalibur 3.0.63 (Thermo Fisher Scientific GmbH, Dreieich, Germany).
2.2 Analysis in AMDIS
GC-MS data were evaluated using the AMDIS software (Version 2.37; D'Arcy and Mallard, 2017; Stein, 1999; Stein and Scott, 1994). To this end, an RI-value calibration file was first generated using the alkane standard run, checking for correct assignment of alkanes C11–C26. Subsequently, 16 whisky files were individually assessed through the function “use retention index data” and the respective RI calibration file. An in-house database of target analytes generated with AMDIS was used in this, containing over 700 entries. The RI values determined by AMDIS and the mass spectra of detected peaks were then compared to the targets by the software. Afterwards, the result of this comparison was saved as a text report and used in validating the newly developed semi-automatic approach.

Figure 2Overview of the alkane and sample peak detection and spectral deconvolution process. (a) Exemplary alkane reference run with detected alkane peak times and intensities. (b) Plot of several detected alkane peak times and time steps to the next detected alkane. (c) Exemplary sample run with detected peak times and intensities. (d) Exemplary mass spectrum before and after deconvolution.
2.3 Preprocessing steps and automated identification of peaks
Detection of the relevant substances and their respective GC peaks present in the data generated in Sec. 2.1 requires processing the alkane standard run, as described for AMDIS above. These reference substances were used to calculate RI values (according to van den Dool and Kratz, 1963, and as done in Haug et al., 2021, 2023) that can be used in narrowing down the list of possible analytes. We developed a preprocessing pipeline (see Figs. 2 and 3) to work with this GC-MS data in a non-proprietary form and independently from AMDIS. The first step in the pipeline includes extracting intensity matrices in a shape of number of scans by the range. Following this, deconvolution as designed by Biller and Biemann is applied (Biller and Biemann, 1974). The peaks deconvolved in this way (Fig. 2d) consist of a large amount of noise that must be removed. For this purpose, we developed a sliding-window-based approach that calculates the median absolute deviation (MAD) to estimate noise. The window of size 256 scan units and a stride of 50 scan units slides across the deconvolved signal with an overlap. The amplitude of each peak within the window is compared against the corresponding window's MAD to ascertain if a sufficient number of peak ions are above the noise cutoff for it to be considered a meaningful peak. Regarding the alkane references, the challenge was to automatically recognize peaks that occur in semi-regular spacing and size (Figure 2a) while making sure not to include off-target peaks as this would invalidate all following RI values. To help in the localization of alkanes, we developed a linear model between the retention time of the alkane peaks and the distance between two consecutive alkanes (limited between 300 and 1600 s; Fig. 2b) using the expected linear variation of retention time (RT) differences (d'Acampora Zellner et al., 2008a). Since the time steps between the alkanes decrease approximately linearly over the elution time, the model can be used to estimate the likelihood of a detected peak to occur within a time frame where an alkane could be expected by using lower and upper thresholds. Neighboring peaks that lay in time differences below the lower thresholds were ignored, while those with higher time differences than the upper threshold were used to indicate missing neighboring alkanes. If no peak could be detected in this time frame, the position would be estimated by interpolation. Alkane C17 was used in low concentration compared to the neighboring ones for easier identification. By knowing the position of C17, all other alkanes could be identified using the retention time model with interpolation and thresholding. We want to emphasize that a proper identification beyond reasonable doubt (e.g., to validate the presence of toxic substances) would require using reference substances, which is not what we did here.
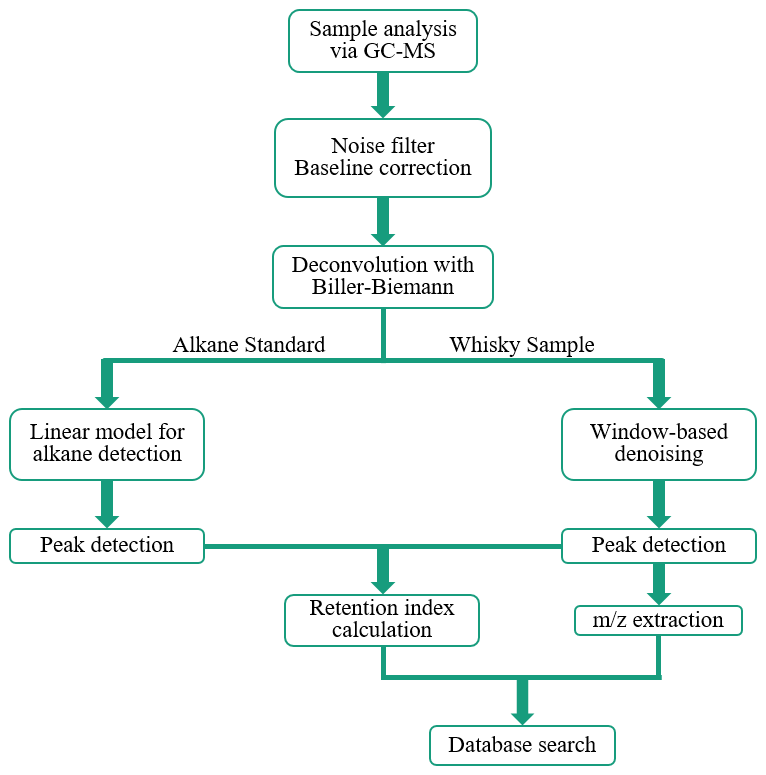
Figure 3Schematic depiction of data flux and steps in processing and analyzing GC-MS data via the semi-automated process.
Unknown substances were detected and assigned an RI value by the same processing steps as described above (Fig. 2c), including intensity matrices and deconvolution (Biller and Biemann, 1974). To minimize the number of falsely identified peaks, we followed the approach to reduce noise described above, which estimates the MAD inside a sliding window over the data. For each segment of the data inside the window, an MAD value was calculated and compared to a threshold in order to identify outliers and differentiate between noise and the signal. Retention times of signal peaks were then saved and, in conjunction with alkane standard retention times, converted to retention indices (van den Dool and Kratz, 1963). Lastly, a list of retention times, retention indices, and all mass spectra was saved to proceed with database-augmented target matching, as described in the following sections.
2.4 Comparing mass spectra of unknowns with database entries
Database-matching of molecules from detected individual, deconvolved mass spectra was performed using cosine similarity (Stein and Scott, 1994), as shown in Eq. (1).
In Eq. (1), MSlib is one of n spectra present in the database (or library) and MStemp poses a mass spectrum to be compared with all library entries. The highest intensity value of each individual mass spectrum was set to 1000. All values were rounded to integer numbers. For all unknown mass spectra with a corresponding RI value (i.e., a retention time between first and last reference alkane), scoreMS was then combined with the difference in RI between library and unknown substance to yield scoreMS+RI, as shown in Eq. (2).
Here, only entries in the library were considered a possible match when the condition was fulfilled. To achieve this, a Heaviside step function (heaviside function §1.16(iv); NIST, 2022; shown in Eq. 3) was multiplied with the respective score.
Procedures in Eqs. (1) to (3) were repeated for each unknown spectrum in a chromatogram. Values for the score fell within a range of 0 (no similarities) to 1 (identical). The library entry with the highest score was accepted as the most likely molecule if its respective score was above a certain threshold (0.6/0.8/0.9, respectively; see below).
2.5 Building a graphical user interface (GUI) for intuitive analysis
Incorporating the above-mentioned processes into a guided user experience to reduce the interaction necessary to come to a result was one of the main goals of this work. Therefore, we developed a user interface using both the Python and MATLAB environments. Implementation of peak detection and alkane identification was performed through Python 3.10.8 and using the PyMassSpec library, while all other procedures including the database search and the main user interface were generated in MATLAB (R2022a) using the integrated functionality “appdesigner” (Fig. 4).
2.6 Comparing results between AMDIS and the semi-automated process
To assess the quality of database-matching in all 16 samples and compare between both approaches (conventional AMDIS analysis and semi-automatic GUI-based approach), we proceeded as follows. For each sample, a list of all detected molecules (with the respective thresholds listed above) was generated with each molecule occurring only once despite the possibility of several detection RTs. We kept only those instances of each molecule that had the highest confidence (“net score” in AMDIS, “score” in our approach) of detection. The exact way of calculating the net score in AMDIS could not be fully retraced, but metrics like mass spectral and RI value differences are taken into account here as well (according to the AMDIS manual by D'Arcy and Mallard, 2017). Following this, we checked whether each molecule detected in AMDIS was found in the semi-automated routine as well. From the number of molecules found in both approaches, we calculated the overlap by dividing by the total number of molecules found with AMDIS. Dividing the detected molecules into two classes (characteristic/unknown whisky component) was achieved by comparing them against the custom database of 217 whisky molecules.
A number of proprietary solutions exist for the analysis of instrumental-analytical data. However, these often lack viable options to export data in a non-proprietary format for utilization in other programs. Other labs have also successfully amended the functionalities of AMDIS to increase efficiency and quality of results (e.g., Behrends et al., 2011) or otherwise produced solutions to help with interpretation of spectrometric data. Other solutions claim easy use via a GUI (e.g., Nicolè et al., 2012a), but the provided links lead to non-existing websites (HTML error 404 for MSeasyTkGUI; Nicolè et al., 2012b) less than 10 years after publication of the latest version (at the time of writing; version 5.3.3 from 21 March 2013 can be found via another link) and require some knowledge in R, making it hard for the inexperienced user. Here, we developed a modifiable and intuitive tool to utilize chromatographic data (currently as .cdf files) that can be customized to fit several input and output formats. Furthermore, this tool allows the usage of tailor-made databases to improve plausibility of results. Our software allows semi-automated data analysis through a GUI that requires a few steps, and only a few parameters need to be set at the beginning. With the framework developed in Python and MATLAB, this can also be adapted, e.g., to automatically detect new chromatogram files in the working directory of the laboratory and analyze them without any user inputs.
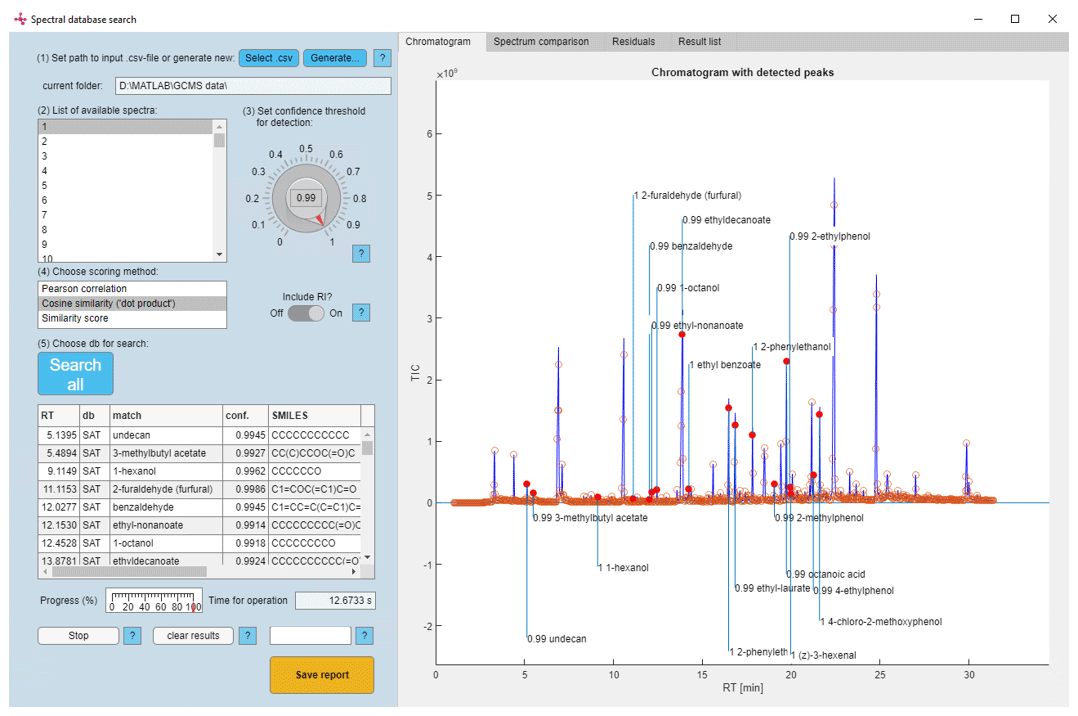
Figure 4Full view of the graphical user interface with an exemplary chromatogram and compounds detected with high confidence values (note: the confidence threshold was set to 0.99 for ease of display).
3.1 Building and validation of the graphical user interface
To ensure intuitive and efficient application of the described procedures for data analysis, we developed a modular and customizable GUI with intuitive user guidance (Fig. 4). With this process, we could automate a considerable number of labor-intensive steps necessary for analysis, using 16 whisky spirit samples as an example. We validated the quality of our approach against a conventional software (AMDIS) and found that our approach adequately reproduced the results found therein; however, not to the degree of identification using reference standards.
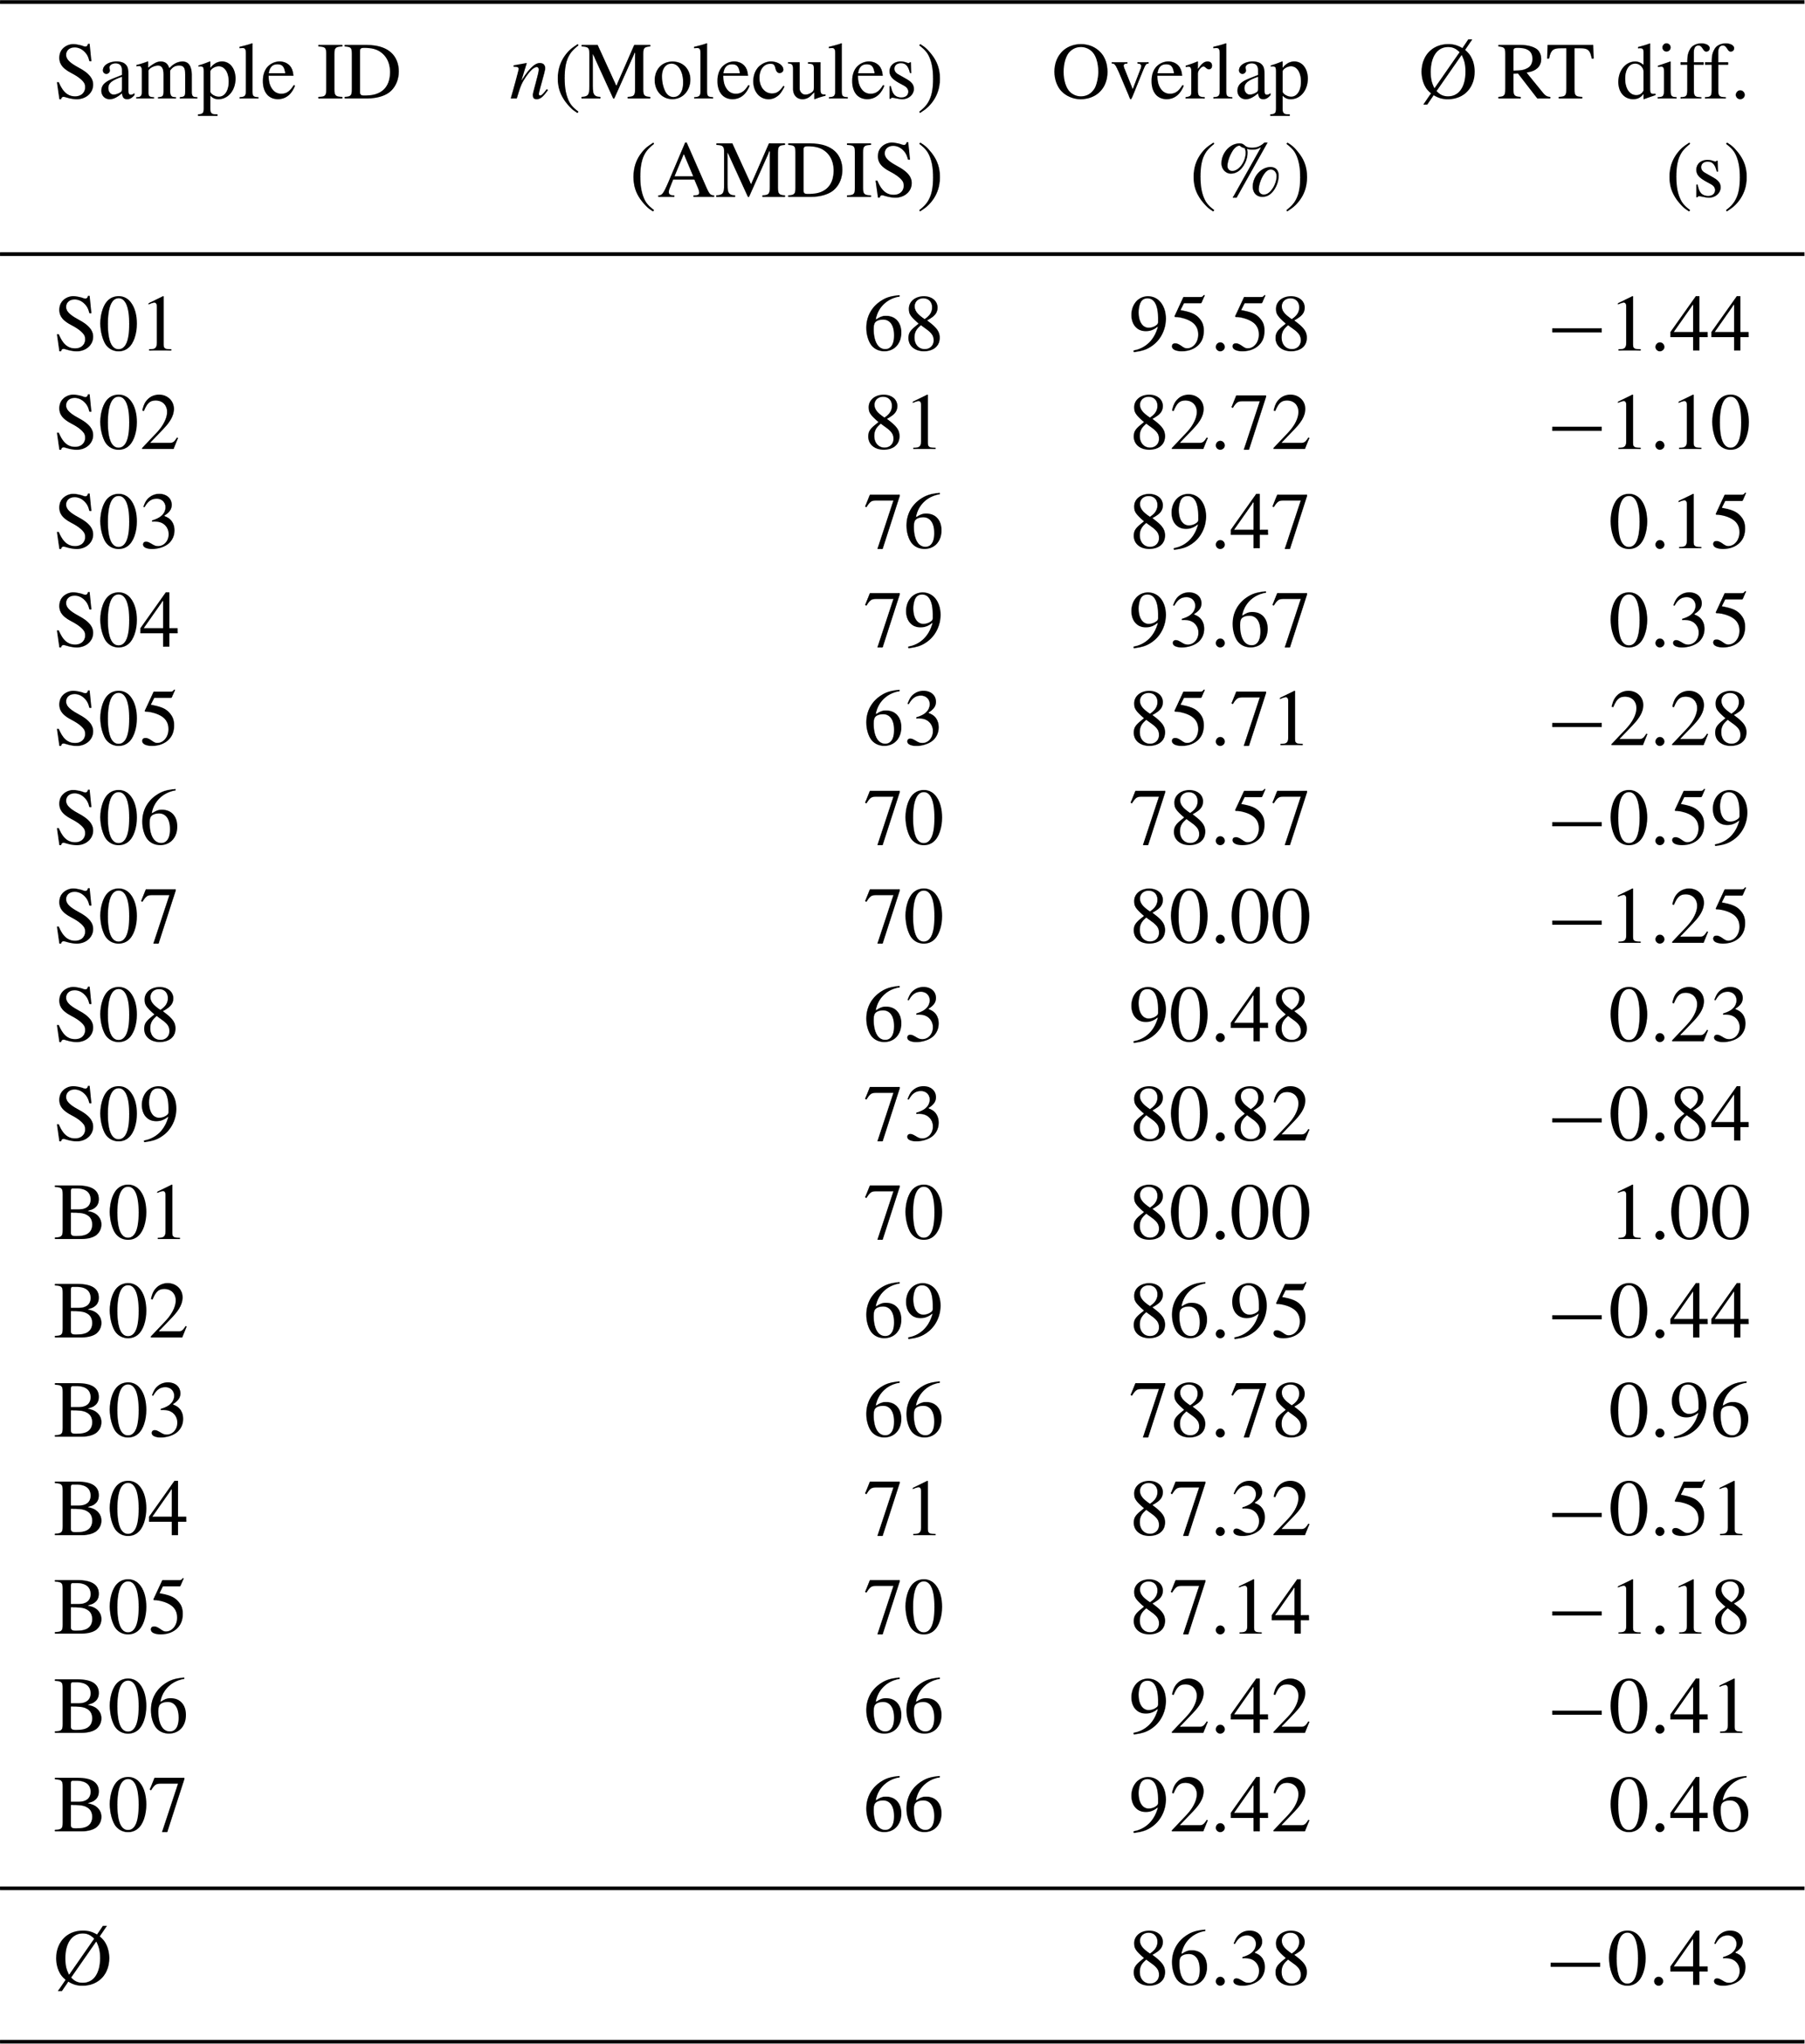
To assess the quality of our approach, we firstly determined which of the molecules found via conventional analysis (with both “high” and “medium” confidence, i.e., net scores of 60 or 80) could also be detected using our semi-automatic approach in an unspecific VOC database of > 700 aroma molecules (that had also been used in the conventional analysis). Table 1 shows that we could on average detect ∼ 86 % of those molecules detected in AMDIS with the GUI and processing pipeline. The mean deviation in retention times between molecules found in both procedures was below 0.5 s. Considering the saving of manual interaction with this procedure, and the possibility of misidentification in both approaches, these metrics show that our approach is efficient and precise enough to be used in high-data-throughput environments.
Table 1Results of the comparison between analysis in AMDIS and semi-automated procedure.
Next, we wanted to determine which part of the found molecules in each of the approaches was also present in the curated list of 217 characteristic whisky components. Furthermore, we observed whether the probability of matching was correlated with a molecule being present in this list. To this end, we determined the mean quality of molecule detection in two classes: those molecules that were present in the curated list and those that were not. In the case of our semi-automatic routine, the difference was statistically significant in all samples. This implies that (1) the curated list of whisky molecules indeed contains molecules that were likely to be found in each of our whisky samples and that (2) our approach is working as intended, detecting the molecules typically found in whisky with higher likelihood. This was only the case for four samples analyzed using AMDIS. Several factors may play a role in this observed discrepancy. Firstly, the analysis performed in AMDIS on average had an overlap of 78.3 % between detected molecules and the curated list, implying that molecules typically found in whisky were present in the majority share, while our semi-automated approach had an overlap of only 45.8 %. However, our semi-automated approach also found a considerably larger amount of molecules not detected in AMDIS, implying a higher sensitivity for background noise or traces not detected in AMDIS. Modification of the criteria for AMDIS analysis (net score of at least 80, corresponding to high confidence of matching) and the semi-automatic approach (score of at least 0.8) resulted in an increase of metric quality (AMDIS: 82.7 %; our method: 59.9 %) and convergence of the overlap in both approaches of 88.7 %. Further increasing the criteria to 90/0.9 yielded an overlap of 88.2 % and a further convergence in the quality of detection of 85.2 %/75.1 %.
Further evaluations will be necessary to optimize these metrics and increase the quality of detection and/or reduce the detection of background noise as signals in our approach. In light of the simplification and reduced effort necessary for database-matching, this approach is promising and already useful nonetheless. Furthermore, a failure to detect < 25 % of molecules as characteristic of whisky is not necessarily a sign of wrong matching per se, especially considering that the conventional procedure fails to detect ∼ 15 % itself. In following experiments and validation, we will use other sources of VOCs (e.g., food products, synthetics) to demonstrate the usefulness of our approach not just in the spirit realm. Furthermore, we want to build verifiable references for our approach by utilizing synthetic mixtures of substances modeled after real products. Only this will allow the comparison of approaches with finality, as a ground truth is currently lacking. The reference substances added to the samples used here (undecane and 4-chloro-2-methoxyphenol; see Methods section) were found in all samples. Further potential for reduction of effort lies in the intensive evaluation of AMDIS reports using expert knowledge, other than the mere generation and export of results lists, which can be objectified in principle.
Table 2Substance groups found in two different types of whisky (American/Scotch). Numbers show total counts of compounds within substance groups and the overall average proportion of substance groups (avg. % ± SD). Class denominations were taken as assigned in ClassyFire by Djoumbou Feunang et al. (2016).
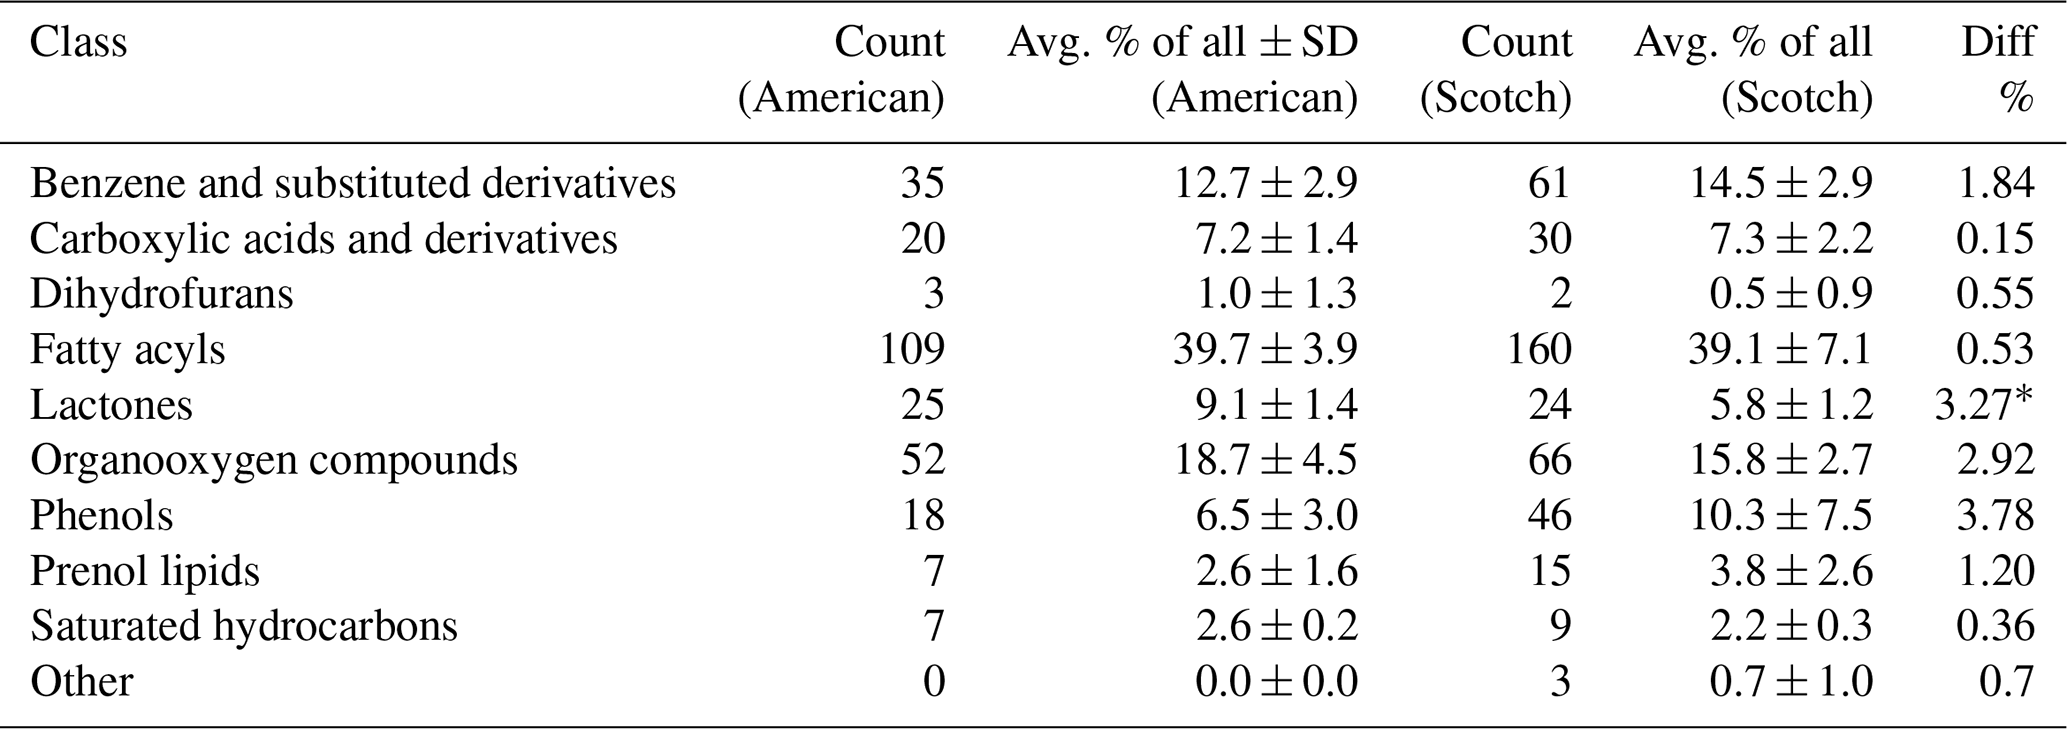
∗ p < 0.001; unpaired t test.
3.2 Classification of molecules into substance groups
Independently from the conventional analysis performed in AMDIS, we wanted to see whether we could find differences in the substance groups of molecules detected in our approach. Theoretically, due to different ways of whisky production used in the two regions of origin (Scotland (UK) and USA), we should be able to see higher or lower amounts of certain substances in the samples. For this, we used the “ClassyFire” approach (Djoumbou Feunang et al., 2016) and assigned a predefined class of substances to each molecule. Such classes included, e.g., “fatty acyls”, “phenols”, and “benzene and substituted derivatives”. We found that whisky samples of American denomination contained 9.1 % molecules classifiable as lactones, while whisky samples of Scottish make contained significantly less at 5.8 % (p < 0.001; unpaired t test). This is possibly explained by the fact that whisky distilleries in the USA by law have to age their product in previously unused oak casks to use denominations such as bourbon or rye (Code of Federal Regulations – Title 27 Alcohol, Tobacco Products and Firearms; United States Government, 2023), while in Scotland, used oak casks are permitted for the whole maturation process. Oak wood is a prime source for lactones, and diffusion of these molecules into the whisky likely explains our observation. Furthermore, higher lactone contents have been found in the American oak (Quercus alba), as compared to the prevalent European species (Quercus robur and Quercus petraea; Prida and Puech, 2006). Whisky samples of Scottish origin, on the other hand, showed a phenol content of 10.3 %, while those of US origin contained 6.5 %. This is likely explained in part by the use of peat in charring casks in Scotch distilleries, which leads to high phenol contents that can then enter the maturing spirit (Jeleń et al., 2019; Mall and Schieberle, 2018). However, this difference has to be viewed as unverified, as it was not found to be significant due to high intersample variance and three Scotch outliers heavily skewing the mean towards high values. The determined classes as denominated by the utilized approach can be found in Table 2. In conclusion, the detection and classification of molecules in two whisky spirit types lead to plausible differences in the amounts of molecule contents.
Despite the best efforts and admirable results of some groups (e.g., Behrends et al., 2011; Broeckling et al., 2006; Martínez-Jarquín et al., 2017), and mainly owing to the specialist character of the subject matter, some hurdles are still to be cleared when it comes to making the expert data analysis of complex VOC mixtures following GC-MS procedures simpler and more efficient while retaining an acceptable margin of accuracy. With the semi-automatic approach shown here, we offer a way to decrease necessary interaction with data and facilitate interpretation of yielded results, potentially freeing up time and other resources. Another important feature of this custom approach is that interaction with the data and adjustment of individual functions, databases, and export file formats is simplified. This will likely make it easier for inexperienced users to yield the same quality of data analysis as an expert in the future, although exact identification of molecules using our approach is not yet implemented. Using a curated database of known whisky molecules, we validate our approach and show matching qualities close to conventional analysis proceedings. While we do not offer a tool with as much functionality as some of the proprietary Original Equipment Manufacturer (OEM) software, as we focused on the most important core features in the analysis pipeline here, we do believe that the procedures shown here will be useful to the community.
Usage of the presented software can be discussed with the corresponding authors. Data pertaining to the results shown here will be made available upon reasonable request.
ATG and SaS devised the methods to analyze the data and analyzed the data in Python and MATLAB. HH analyzed whisky samples in GC-MS and AMDIS. ATG, SaS, HH, and TS all conceived, wrote, and reviewed the paper.
The contact author has declared that none of the authors has any competing interests.
Publisher's note: Copernicus Publications remains neutral with regard to jurisdictional claims in published maps and institutional affiliations.
This article is part of the special issue “Sensors and Measurement Systems 2022”. It is a result of the “Sensoren und Messsysteme 2022, 21. ITG/GMA-Fachtagung”, Nuremberg, Germany, 10–11 May 2022.
The authors are grateful to the Bavarian Ministry of Economic Affairs, Regional Development and Energy (StMWi) and Fraunhofer (Fraunhofer-Gesellschaft zur Förderung der angewandten Forschung e.V.) for funding this work in the “Campus of the Senses” (“Campus der Sinne”) initiative.
This research has been supported by the Bayerische Staatsministerium für Wirtschaft, Landesentwicklung und Energie (Campus der Sinne grant).
This paper was edited by Anita Lloyd Spetz and reviewed by two anonymous referees.
Baltussen, E., Sandra, P., David, F., and Cramers, C.: Stir bar sorptive extraction (SBSE), a novel extraction technique for aqueous samples: Theory and principles, J. Microcolumn Sep., 11, 737–747, https://doi.org/10.1002/(SICI)1520-667X(1999)11:10<737::AID-MCS7>3.0.CO;2-4, 1999.
Behrends, V., Tredwell, G. D., and Bundy, J. G.: A software complement to AMDIS for processing GC-MS metabolomic data, Anal. Biochem., 415, 206–208, https://doi.org/10.1016/j.ab.2011.04.009, 2011.
Biller, J. E. and Biemann, K.: Reconstructed Mass Spectra, A Novel Approach for the Utilization of Gas Chromatograph—Mass Spectrometer Data, Anal. Lett., 7, 515–528, https://doi.org/10.1080/00032717408058783, 1974.
Broeckling, C. D., Reddy, I. R., Duran, A. L., Zhao, X., and Sumner, L. W.: Met-IDEA: Data extraction tool for mass spectrometry-based metabolomics, Anal. Chem., 78, 4334–4341, https://doi.org/10.1021/ac0521596, 2006.
Câmara, J. S., Marques, J. C., Perestrelo, R. M., Rodrigues, F., Oliveira, L., Andrade, P., and Caldeira, M.: Comparative study of the whisky aroma profile based on headspace solid phase microextraction using different fibre coatings, J. Chromatogr. A, 1150, 198–207, https://doi.org/10.1016/j.chroma.2006.09.014, 2007.
d'Acampora Zellner, B., Bicchi, C., Dugo, P., Rubiolo, P., Dugo, G., and Mondello, L.: Linear retention indices in gas chromatographic analysis: a review, Flavour. Frag. J., 23, 297–314, https://doi.org/10.1002/ffj.1887, 2008a.
d'Acampora Zellner, B., Dugo, P., Dugo, G., and Mondello, L.: Gas chromatography-olfactometry in food flavour analysis, J. Chromatogr. A, 1186, 123–143, https://doi.org/10.1016/j.chroma.2007.09.006, 2008b.
D'Arcy, P. and Mallard, W. G.: AMDIS–user guide, https://www.nist.gov/system/files/documents/srd/AMDISMan.pdf (last access: 16 March 2023), 2007.
Daute, M., Jack, F., Baxter, I., Harrison, B., Grigor, J., and Walker, G.: Comparison of Three Approaches to Assess the Flavour Characteristics of Scotch Whisky Spirit, Appl. Sci.-Basel, 11, 1410, https://doi.org/10.3390/app11041410, 2021.
Demyttenaere, J., Sanchezmartinez, J., Verhe, R., Sandra, P., and Dekimpe, N.: Analysis of volatiles of malt whisky by solid-phase microextraction and stir bar sorptive extraction, J. Chromatogr. A, 985, 221–232, https://doi.org/10.1016/s0021-9673(02)01471-1, 2003.
Djoumbou Feunang, Y., Eisner, R., Knox, C., Chepelev, L., Hastings, J., Owen, G., Fahy, E., Steinbeck, C., Subramanian, S., Bolton, E., Greiner, R., and Wishart, D. S.: Classyfire: Automated chemical classification with a comprehensive, computable taxonomy, J. Cheminformatics, 8, 61, https://doi.org/10.1186/s13321-016-0174-y, 2016.
Haug, H., Singh, S., Grasskamp, A. T., and Sauerwald, T.: P5.1 – Automatisierte Auswertung chromatographischer Daten für die Bewertung von Whisky, 15. Dresdner Sensorsymposium, Dresden, 6–12 December 2018, 245–250, https://doi.org/10.5162/15dss2021/P5.1, 2021.
Haug, H., Grasskamp, A. T., Singh, S., Strube, A., and Sauerwald, T.: Quick insights into whisky – investigating rapid and efficient methods for sensory evaluation and chemical analysis, ResearchSquare [Preprint], https://doi.org/10.21203/rs.3.rs-2599252/v2, 2023.
Jeleń, H. H., Majcher, M., and Szwengiel, A.: Key odorants in peated malt whisky and its differentiation from other whisky types using profiling of flavor and volatile compounds, Lebensm. Wiss. Technol., 107, 56–63, https://doi.org/10.1016/j.lwt.2019.02.070, 2019.
Mall, V. and Schieberle, P.: Decoding the unique peaty aroma of Islay scotch single malt whisky by means of the sensomics concept, Flavour Science, 83–86, https://doi.org/10.3217/978-3-85125-593-5, 2018.
Martínez-Jarquín, S., Moreno-Pedraza, A., Cázarez-García, D., and Winkler, R.: Automated chemical fingerprinting of Mexican spirits derived from Agave (tequila and mezcal) using direct-injection electrospray ionisation (DIESI) and low-temperature plasma (LTP) mass spectrometry, Anal. Methods-UK, 9, 5023–5028, https://doi.org/10.1039/C7AY00793K, 2017.
NIST: Heaviside Function §1.16(iv), National Institute of Standards and Technology, NIST Digital Library of Mathematical Functions, https://dlmf.nist.gov/1.16.iv (last access: 7 February 2023), 2022.
Nicolè, F., Guitton, Y., Courtois, E. A., Moja, S., Legendre, L., and Hossaert-McKey, M.: Mseasy: Unsupervised and untargeted GC-MS data processing, Bioinformatics, 28, 2278–2280, https://doi.org/10.1093/bioinformatics/bts427, 2012a.
Nicolè, F., Guitton, Y., Courtois, E. A., Moja, S., Legendre, L., and Hossaert-McKey, M.: MSeasyTkGUI, https://cran.r-project.org/web/packages/MSeasyTkGUI/index.htm (last access: 7 February 2023, no longer available online), 2012b.
Poisson, L. and Schieberle, P.: Characterization of the most odor-active compounds in an American Bourbon whisky by application of the aroma extract dilution analysis, J. Agr. Food Chem., 56, 5813–5819, https://doi.org/10.1021/jf800382m, 2008a.
Poisson, L. and Schieberle, P.: Characterization of the key aroma compounds in an american bourbon whisky by quantitative measurements, aroma recombination, and omission studies, J. Agr. Food Chem., 56, 5820–5826, https://doi.org/10.1021/jf800383v, 2008b.
Prida, A. and Puech, J.-L.: Influence of geographical origin and botanical species on the content of extractives in American, French, and East European oak woods, J. Agr. Food Chem., 54, 8115–8126, https://doi.org/10.1021/jf0616098, 2006.
Stein, S. E.: An integrated method for spectrum extraction and compound identification from gas chromatography/mass spectrometry data, J. Am. Soc. Mass Spectr., 10, 770–781, https://doi.org/10.1016/S1044-0305(99)00047-1, 1999.
Stein, S. E. and Scott, D. R.: Optimization and testing of mass spectral library search algorithms for compound identification, J. Am. Soc. Mass Spectr., 5, 859–866, https://doi.org/10.1016/1044-0305(94)87009-8, 1994.
United States Government: Code of Federal Regulations – Title 27 Alcohol, Tobacco Products and Firearms: §5.74 Statements of age, storage, and percentage, United States Government, National Archives and Records Administration https://www.ecfr.gov/current/title-27/chapter-I/subchapter-A/part-5/subpart-E/section-5.74 (last access: 7 February 2023), 2023.
van den Dool, H. and Kratz, P.: A generalization of the retention index system including linear temperature programmed gas—liquid partition chromatography, J. Chromatogr. A, 11, 463–471, https://doi.org/10.1016/S0021-9673(01)80947-X, 1963.