the Creative Commons Attribution 4.0 License.
the Creative Commons Attribution 4.0 License.
Miniaturized two-chamber photoacoustic CO2 sensor with a wafer-bonded MEMS (micro-electro-mechanical systems) detector
Simon Gaßner
Simon Essing
David Tumpold
Katrin Schmitt
Jürgen Wöllenstein
The measurement of air quality, particularly the concentration of carbon dioxide (CO2), has gained significant interest due to increased public health awareness. Elevated concentrations of CO2 in the air have been linked to negative effects on cognitive functions and directly correlate with the quality of indoor air. This work presents the prototype of a miniaturized sensor module designed for sensing CO2 concentrations in the air. The sensor module utilizes the two-chamber photoacoustic concept and features a compact design combining an absorption cell with a wafer-bonded detector based on silicon MEMS (micro-electro-mechanical systems) microphone technology. The CO2-filled detector chip uses the photoacoustic effect and is able to detect pressure oscillations within an enclosed volume generated by the absorption of modulated infrared (IR) light by CO2 molecules. The complete sensor module measures only mm3 and the used detector chip is the smallest detector for two-chamber photoacoustic sensors reported to date. Experimental characterization showed that the prototype achieves a detection limit of 81 ppm CO2 and exhibits a response time τ63 of 53 s. The compact size and performance characteristics make the proposed sensor module suitable for applications in indoor air quality monitoring.
- Article
(3698 KB) - Full-text XML
- BibTeX
- EndNote
In recent years, there has been a significant increase in public awareness of health-related issues, leading to heightened interest in measuring air quality (Fernández-Agüera et al., 2023; Mirabelli et al., 2020). Several studies indicate that an increased concentration of CO2 in the air has a negative influence on cognitive functions. For instance, increased CO2 levels can cause headaches and drowsiness and decrease overall mental performance (Du et al., 2020; Fan et al., 2023; Lee et al., 2022; Petersen et al., 2016; Satish et al., 2012; Vehviläinen et al., 2016).
Furthermore, several studies indicate a correlation between increased CO2 concentrations and the viral load in indoor spaces, which spurred the demand for small and cheap sensor solutions, particularly throughout the COVID-19 pandemic (Bhagat et al., 2020; Peng and Jimenez, 2021). Generally, an increased CO2 concentration is one of the most commonly used markers for poor indoor air quality. This definition dates back to the so-called hygienic limit of 1000 ppm, which was specified by von Pettenkofer in 1859. Consequently, maintaining a low CO2 concentration through effective ventilation with fresh air is highly desirable and therefore recommended by several standards and national institutes (EN 16798, 2022; Umweltbundesamt, 2008). However, uncontrolled and excessive ventilation can lead to increased energy consumption for heating and air conditioning, especially under very hot or cold weather conditions. To address this, an optimized ventilation system that adjusts to the actual demand is necessary, requiring a control parameter such as the current CO2 concentration in the controlled environment (Ahmed et al., 2015; Chen and Markusson, 2019; Delwati et al., 2018; Fisk and de Almeida, 1998; Li and Cai, 2022; Song et al., 2022; Wachenfeldt et al., 2007).
The first commercially available optical gas sensors for CO2 were relatively large, mechanically complex and therefore quite expensive (Egle and Ernst, 1949; Lehrer and Luft, 1943). However, advancements in sensor technology have facilitated the development of smaller and more cost-effective devices. Recent product launches have demonstrated a trend towards further reducing sensor size, with the ability to reflow-mount these sensors as surface-mounted devices (SMDs). The latest generation of CO2 sensors utilizes the photoacoustic effect, which involves the conversion of light energy into sound. More specifically, the electromagnetic energy of a modulated infrared (IR) light beam can be absorbed by molecules, which leads to intra-molecular vibrations and local temperature fluctuations. Using periodically modulated light, these local temperature variations ultimately cause local pressure oscillations (Essing et al., 2022; Jha, 2022; Palzer, 2020). This effect can occur in media of any phase, e.g. in gases (Röntgen, 1881), in liquids (Wetsel and McDonald, 1976) or in solids (Bell, 1881).
Existing consumer sensors utilizing the photoacoustic effect typically employ a single photoacoustic chamber with a spectral filter (Carbonelli et al., 2018; Essing et al., 2022). While this design is relatively simple, it offers limited selectivity for the target gas and is susceptible to acoustic interference. To address this, these sensors utilize special algorithms or physical barriers, such as specially designed MEMS (micro-electro-mechanical systems) gas diffusion ports, which provide adequate acoustic suppression but on the downside increase the sensor's response time (Palzer, 2020).
An alternative approach, known as the “two-chamber” concept, employs two sensor cells: one which is in exchange with the gas to be analysed and another, in the following referred to as “detector”, which contains the microphone membrane together with a high concentration of the target analyte. This detector is also hermetically encapsulated in order to maintain a stable analyte concentration inside (Ambs et al., 2015; El-Safoury et al., 2020, 2024; Huber et al., 2015b; Palzer, 2020; Yassine et al., 2023). In this approach, the gas-filling acts as a spectral filter, making the sensor selective only for the target gas (Huber and Wöllenstein, 2013; Huber et al., 2015a, 2016; Lehrer and Luft, 1943).
Due to the encapsulation of the detector and the resulting isolation of the acoustically sensitive MEMS membrane from the environment, this approach inherently minimizes the impact of acoustic interference. Furthermore, the intrinsic acoustic insensitivity of the detector eliminates the need for special measures such as the mentioned gas diffusion ports, which restrict the gas diffusion into the sensor. This leads to a significant decrease in the response time of such sensors compared to single-chamber photoacoustic gas sensors.
In this work, we present a miniaturized sensor based on the two-chamber approach, measuring only mm3 (L × W × H). To the best of our knowledge, the detector of our two-chamber photoacoustic sensor module is the smallest reported to date.
The core of the sensor module we developed is a hermetically encapsulated wafer-bonded detector built on a full silicon wafer with MEMS membranes typically used for differential microphones. The MEMS structures comprise two perforated, rigid backplates and a thin, flexible membrane that form a differential parallel-plate capacitor. The membranes and backplates are made of polysilicon and silicon nitride layers and have a high transmission of IR light in the relevant wavelength region. The MEMS membrane stack has a ventilation hole in the centre of the membrane, which allows low-frequency (static) pressure to equalize between the two volumes (Dehe et al., 2013; Füldner and Dehé, 2015). To encapsulate the MEMS membrane, two additional silicon wafers are bonded to the bottom and top of the MEMS wafer. During the encapsulation process, the wafers are exposed to a 100 % CO2 atmosphere, effectively trapping CO2 within the created cavities. This results in two gas-filled volumes: the front volume above the MEMS membrane stack and the back volume underneath. Figure 1 shows a schematic cross section of our photoacoustic MEMS detector.
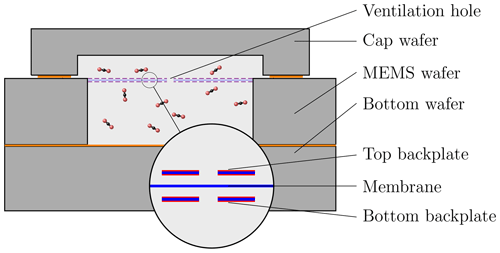
Figure 1Schematic cross section of the photoacoustic MEMS detector (not to scale) comprising a cap wafer, a MEMS backplate–membrane stack produced on a silicon wafer and a bottom wafer.
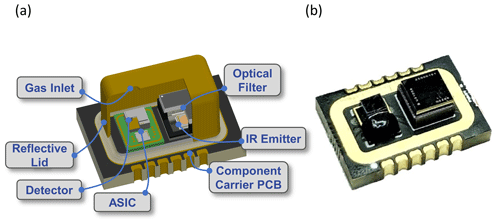
Figure 2(a) Sectional view of CAD drawing, showing all functional components and their arrangement in the sensor module. (b) Photograph of the sensor module with a MEMS detector and an IR emitter (without a lid).
The transparency of silicon for IR light in the wavelength region in which CO2 absorbs light (around 4.26 µm) allows IR light to penetrate the sensor cavity through its top and side walls (Green and Keevers, 1995; Gordon et al., 2022). As the MEMS membrane stack is transparent for IR light, the irradiated IR light reaches not only the front volume, but also the back volume, where the CO2 molecules absorb the IR light and cause a slight increase in temperature. The two cavities have different volumes and, combined with the non-linear absorption behaviour described by the Beer–Lambert law, this results in different amplitudes of the pressure generated in the two cavities. This pressure gradient causes deflection of the membrane between the cavities, resulting in moving charges on the capacitive membrane and the backplates and thus generating the detector signal. Similar to non-dispersive infrared (NDIR) sensors, the raw signal of our sensor has an inverse relationship with the CO2 concentration which is based on the attenuation of the IR light intensity in the absorption path. Consequently, an increase in concentration leads to a decrease in the raw sensor signal and vice versa.
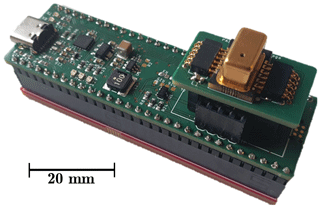
Figure 3Photograph of the evaluation electronics, consisting of a PSoC 4200M development board, a motherboard, an adapter printed circuit board (PCB) and the sensor module.
The MEMS photoacoustic detector (measuring approximately 2×2 mm) was mounted onto a thin substrate circuit board and connected to an application-specific integrated circuit (ASIC). The ASIC integrates an embedded temperature sensor and a digital signal filter, enabling effective pre-processing of the acoustic data. To electrically access the detector unit, it was soldered alongside a ceramics-packaged MEMS IR emitter module with an optical filter (the emitter module and filter were taken from a XENSIV PASCO2 sensor, Infineon Technologies AG) onto a circuit board specifically designed for housing all components of our sensor. While the inclusion of an optical filter on top of the emitter package is not strictly necessary for the sensor's functionality, it offers additional benefits by minimizing cross-sensitivities and providing protection for the sensitive MEMS emitter's hotplate. Both components were shielded by a gold-plated, reflective metal lid, which served the dual purpose of providing protective housing and acting as a diffuse reflector for IR radiation. The metal lid has an opening of d=0.9 mm and l=0.3 mm for diffusive gas exchange with the environment. The sensor module can be connected through castellated hole side contacts. A detailed sectional view of the sensor module's computer-aided design (CAD) drawing together with a photograph of the sensor is shown in Fig. 2.

Figure 4Exemplary signal processing chain, starting from the resistance–feedback PWM control loop, via the raw and windowed detector signal, to a series of calculated 40 Hz spectral component magnitude values.
The sensor module was connected to a motherboard which acted as a central hub for managing all the sensor functions. This motherboard was carried by a Programmable System-On-Chip (PSoC) 4200M microcontroller development board (CY8CKIT-043, Infineon Technologies AG, Germany), which offers access to all pins and provides all discrete components for the microcontrollers' minimal circuitry. The motherboard was connected to a computer utilizing its USB Type C port. This port provided a standard 5 V supply voltage which was converted to 3.3 V logic supply voltage by a low-dropout regulator (XC6220, Torex Semiconductor Ltd.) and to 12 V emitter supply voltage with a boost converter circuit (TLV61048, Texas Instruments Inc.). Furthermore, the motherboard incorporated a USB-UART bridge chip (FT230XQ, Future Technology Devices International Limited), which enabled USB communication between the microcontroller and computer to control the firmware and acquire the sensor data. To regulate the operation of the IR emitter, a metal oxide semiconductor field-effect transistor (MOSFET, BSR202N, Infineon Technologies AG) was employed as a low side switch. To accurately measure the supply current, a current shunt with a resistance of 1 Ω was placed in series with the MOSFET and the IR emitter. Additionally, a voltage divider (56 and 4.3 kΩ) was utilized to gather information about the exact supply voltage of the IR emitter. By combining the measurements from the current shunt and the voltage divider, the electrical power of the IR emitter could be monitored and adjusted by the control loop, allowing for stabilized optical output power. To ensure reliable contact with the sensor module, a small circuit board featuring spring-loaded pin connectors was used. This board was specifically designed to make contact with the side contacts of the sensor module, establishing a reliable connection. In Fig. 3, a photograph of the evaluation electronics with the attached adapter board and the connected sensor module is shown.
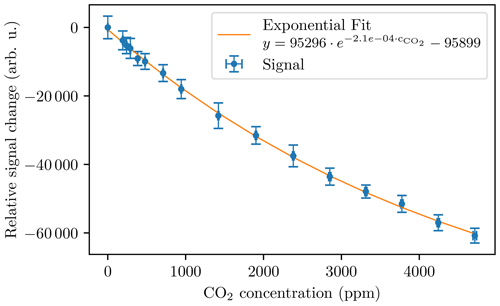
Figure 5Relative sensor signal response for 16 different CO2 concentrations and the exponential regression curve.
During the operational phase, the microcontroller used a pulse width modulation (PWM) signal at a frequency of 24 kHz to control the optical output power of the IR emitter. The PWM control function was based on a resistance-based feedback loop and targeted to drive the IR emitter at a constant hot-temperature resistance, resulting in a stabilized optical output power. Using this control function, a sequence of 18 hot and cold pulses with a frequency of 40 Hz was generated. The emitted IR light pulses interact with the CO2 molecules inside the detector cavities and generate a corresponding acoustic signal. During the measurement, the signal was read using the I2C interface of the detector ASIC and then buffered by the microcontroller. After each pulsing sequence, the data were sent to a host computer for post-processing and evaluation. The sequence was repeated for each measurement, accumulating numerous emission and detection cycles. An exemplary signal processing chain is shown in Fig. 4.
During post-processing, the raw detector signal was initially weighed with a cosine-window function. Subsequently, the magnitude of the 40 Hz spectral component was extracted from the signal using a specialized discrete Fourier transformation (DFT) algorithm as proposed by Goertzel (1958). The resulting magnitude values served as individual data points in our final sensor signal. In order to be able to determine an accurate response time, measurements were triggered every 2 s.
To enhance stability and to minimize noise, a trailing moving average filter with a window size of 46 s was applied to the sensor signal. This filter aided in smoothing out fast fluctuations and the noise of the signal.
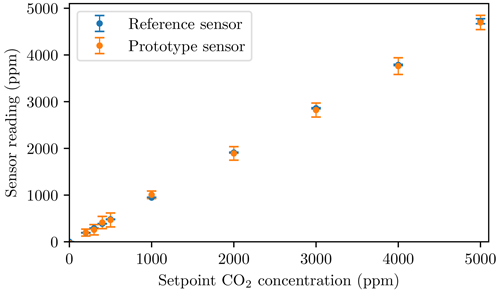
Figure 6Sensor reading of the prototype (with the applied calibration function) and the reference sensor vs. the set point of CO2 concentration.
For the characterization of the sensor prototype, we employed a gas-measuring test bench with mass flow controllers (MFCs) which can mix defined concentrations of CO2 from gas bottles containing synthetic air (79 % N2 and 21 % O2) and CO2. In the measurement chamber, reference sensors were placed in order to monitor ambient conditions such as air temperature (DPS386, Infineon Technologies AG), relative humidity (SHTC3, Sensirion AG) or absolute pressure (DPS368, Infineon Technologies AG). Furthermore, the signal of an ambient light sensor (APDS-9006-020, Broadcom Limited) in the measurement chamber was recorded and used later to determine when the measurement chamber was open or closed. In the exhaust line of the gas-testing bench, a highly accurate CO2 sensor (GMP343, Vaisala Oyj) was installed, which served as a reference sensor for the CO2 concentration.
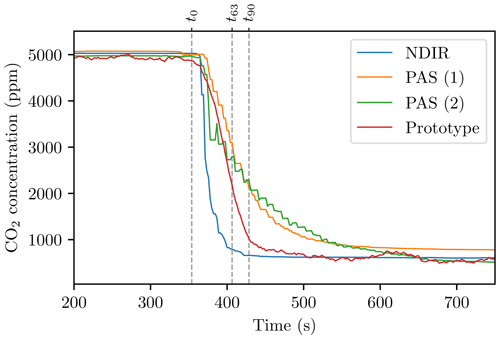
Figure 7Response time measurement of our sensor prototype compared to different consumer sensors (t0=354 s, t63: 407 s, t90: 429 s).
2.1 Results
To characterize the sensitivity of our sensor to the presence of CO2 inside the sensor housing, the sensor was placed in the measurement chamber of the gas testing bench. Throughout the experiment, the CO2 concentration was systematically decreased from 5000 to 200 ppm at a flow rate of 280 standard cubic centimetres per minute (sccm). Each CO2 concentration was held constant for 10 min. To ensure accurate measurements, the bench was purged with pure synthetic air between all the concentration steps. The raw signal of the detector was recorded and processed with the method described above. Based on a 46 s rolling mean window, we determined the change in the sensor signal for each of the CO2 concentration steps, derived the sensitivity of the sensor, and fitted an exponential calibration equation in the form (with , and ), which is shown in Fig. 5.
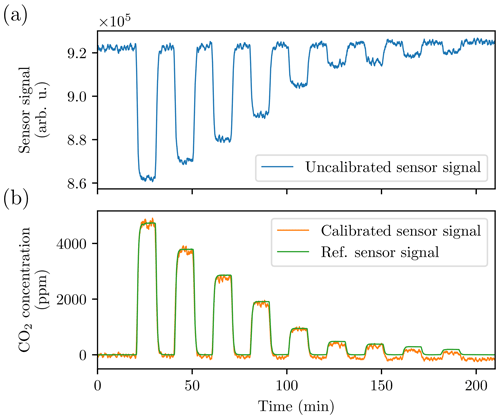
In order to verify the found regression parameters, we conducted another measurement and applied the calibration curve in the form to the acquired signal. The time series data are shown in Fig. A1 in the Appendix. Figure 6 depicts the actual sensor reading versus the CO2 concentration set in the measurement chamber. The calibrated values fit well with the data of the reference sensors. Based on these measurements, a 3σ standard deviation of 2214 arbitrary units could be determined for the prototype, which corresponds to a detection limit of 81 ppm.
To measure the response time of the sensor, an additional experiment was carried out in order to record the step response of the sensor. We did this by performing the measurements in an enclosed box containing an initial concentration of 5000 ppm CO2. At time t0 (354 s), the box was opened, exposing the sensors to laboratory air (620 ppm). The aim of the experiment was to determine how long it takes the sensor to detect a concentration change and to reach 63 % and 90 % of its maximum value after the step change. Figure 7 depicts the raw signal response of our sensor (with a 46 s rolling mean applied) alongside three other consumer sensors.
The calculated response times τ63 and τ90 for all four sensors are listed in Table 1. τ63 represents the time taken to detect a change of 63 % in the signal, while τ90 indicates the time for a change of 90 %. Our two-chamber prototype exhibited response times of 53 and 75 s for τ63 and τ90, respectively.
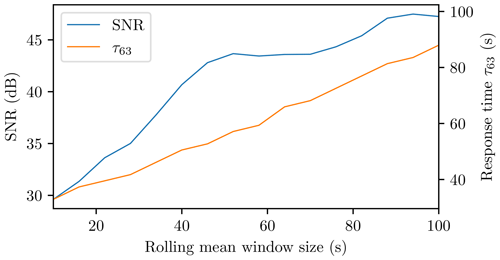
Based on the step response measurements, we also analysed the sensor signals to determine the optimal window size for the rolling mean filter. For that, we calculated the sensor's signal-to-noise ratio (SNR) for increasing window sizes and evaluated it by utilizing an Allan deviation analysis (Marinov et al., 2019), as illustrated in Fig. 8. By evaluating the Allan deviation values, we identified a window size of 46 s as optimal. This size provided a good balance between noise reduction and maintaining an adequate response time for the sensor to measure indoor air quality.
We presented a prototype sensor based on a two-chamber photoacoustic sensor design, which uses a miniaturized wafer-bonded MEMS detector. The sensor's sensitivity and reaction time were characterized, showing its potential for indoor air quality monitoring applications. Despite its miniaturized form factor of mm3, the sensor provides a reasonable detection limit of 81 ppm CO2 and demonstrated a fast response time with a τ63 value of only 53 s.
Future work could include the development of efficient calibration algorithms and the investigation of cross-sensitivities and their compensation algorithms in order to enhance measurement accuracy. Moreover, the post-processing of the data and a calibration algorithm might be integrated into the module for seamless integration with different systems and platforms.
Furthermore, efforts could be directed towards evaluating the sensor's overall robustness and reliability, with a focus on reducing potential sensitivity or baseline drift. This includes ensuring the detector's tightness and the stability of the optical power output of the employed IR emitter over time.
Overall, while some challenges still need to be addressed, our concept of using a wafer-bonded photoacoustic detector has delivered promising results.
Both the software code and data are courtesy of Infineon Technologies AG. Data can be shared upon reasonable request to the corresponding author with the permission of Infineon Technologies AG.
Conceptualization: SG, DT and SE; methodology: SG; software: SG and SE; validation: SG and DT; formal analysis: SG; investigation: SG and SE; resources: SG and DT; data curation: SG; writing and preparation of the draft: SG; review and editing: SG, KS, JW and DT; visualization: SG and DT; supervision: DT and JW; project administration: DT.
The contact author has declared that none of the authors has any competing interests.
Publisher’s note: Copernicus Publications remains neutral with regard to jurisdictional claims made in the text, published maps, institutional affiliations, or any other geographical representation in this paper. While Copernicus Publications makes every effort to include appropriate place names, the final responsibility lies with the authors.
This article is part of the special issue “Sensors and Measurement Science International SMSI 2023”. It is a result of the 2023 Sensor and Measurement Science International (SMSI) Conference, Nuremberg, Germany, 8–11 May 2023.
This project received funding from the German Federal Ministry of Education and Research (BMBF) within the research project PASiC under grant no. 03XP0276A.
This research has been supported by the Bundesministerium für Bildung und Forschung (grant no. 03XP0276A).
This open-access publication was funded by the University of Freiburg.
This paper was edited by Alexander Bergmann and reviewed by two anonymous referees.
Ahmed, K., Kurnitski, J., and Sormunen, P.: Demand controlled ventilation indoor climate and energy performance in a high performance building with air flow rate controlled chilled beams, Energ. Buildings, 109, 115–126, https://doi.org/10.1016/j.enbuild.2015.09.052, 2015. a
Ambs, A., Huber, J., and Wöllenstein, J.: 2.3 – Compact Photoacoustic Gas Measuring System for Carbon Dioxide Indoor Monitoring Applications, in: Proceedings IRS2 2015, AMA Service GmbH, Von-Münchhausen-Str. 49, 31515 Wunstorf, Germany, 918–921, https://doi.org/10.5162/irs2015/2.3, 2015. a
Bell, A. G.: LXVIII. Upon the production of sound by radiant energy, The London, Edinburgh, and Dublin Philosophical Magazine and Journal of Science, 11, 510–528, https://doi.org/10.1080/14786448108627053, 1881. a
Bhagat, R. K., Davies Wykes, M. S., Dalziel, S. B., and Linden, P. F.: Effects of ventilation on the indoor spread of COVID-19, J. Fluid Mech., 903, F-1–F-18, https://doi.org/10.1017/jfm.2020.720, 2020. a
Carbonelli, C., Hollenbach, A., Furtner, W., and Tumpold, D.: System Level Simulations of an Open Photo-Acoustic Gas Sensor, in: EUROSENSORS 2018, MDPI, p. 773, https://doi.org/10.3390/proceedings2130773, pII: proceedings2130773, 2018. a
Chen, H. and Markusson, C.: Demand Controlled Ventilation in Residential Buildings, in: Cold Climate HVAC 2018, edited by: Johansson, D., Bagge, H., and Wahlström, A., Springer Proceedings in Energy, Springer International Publishing, 111–122, ISBN 978-3-030-00661-7, https://doi.org/10.1007/978-3-030-00662-4_10, 2019. a
Dehe, A., Wurzer, M., Fuldner, M., and Krumbein, U.: Design of a poly silicon MEMS microphone for high signal-to-noise ratio, in: 2013 Proceedings of the European Solid-State Device Research Conference (ESSDERC), IEEE, 292–295, ISBN 978-1-4799-0649-9, https://doi.org/10.1109/ESSDERC.2013.6818876, 2013. a
Delwati, M., Merema, B., Breesch, H., Helsen, L., and Sourbron, M.: Impact of demand controlled ventilation on system performance and energy use, Energ. Buildings, 174, 111–123, https://doi.org/10.1016/j.enbuild.2018.06.015, 2018. a
Du, B., Tandoc, M. C., Mack, M. L., and Siegel, J. A.: Indoor CO2 concentrations and cognitive function: A critical review, Art. Res. Supp., 30, 1067–1082, https://doi.org/10.1111/ina.12706, 2020. a
Egle, K. and Ernst, A.: Die Verwendung Des Ultrarotabsorptionsschreibers für die vollautomatische und fortlaufende CO2-Analyse Bei Assimilations- und Atmungsmessungen an Pflanzen, 4, 351–360, 1949. a
El-Safoury, M., Weber, C., Kiesewetter, O., Hespos, Y., Eberhardt, A., Schmitt, K., and Wöllenstein, J.: Miniaturized photoacoustic detection of organofluorine-based refrigerants, J. Sens. Sens. Syst., 9, 89–97, https://doi.org/10.5194/jsss-9-89-2020, 2020. a
El-Safoury, M., Weber, C., Yassine, H., Wöllenstein, J., and Schmitt, K.: Towards a Miniaturized Photoacoustic Sensor for Transcutaneous CO2 Monitoring, Sensors, 24, 457, https://doi.org/10.3390/s24020457, 2024. a
EN 16798: Energy performance of buildings - Ventilation for buildings - Part 1: Indoor environmental input parameters for design and assessment of energy performance of buildings addressing indoor air quality, thermal environment, lighting and acoustics - Module M1-6; German version EN 16798-1:2019 (Standard DIN EN 16798-1:2019), https://doi.org/10.31030/3327351, 2022. a
Essing, S., Schrag, G., Tumpold, D., Glacer, C., Mihotek, M., and Kravchenko, A.: Towards predictive system-level modelling of miniaturized photoacoustic gas sensors, in: 2022 23rd International Conference on Thermal, Mechanical and Multi-Physics Simulation and Experiments in Microelectronics and Microsystems (EuroSimE), IEEE, 1–5, ISBN 978-1-6654-5836-8, https://doi.org/10.1109/EuroSimE54907.2022.9758881, 2022. a, b
Fan, Y., Cao, X., Zhang, J., Lai, D., and Pang, L.: Short-term exposure to indoor carbon dioxide and cognitive task performance: A systematic review and meta-analysis, Build. Environ., 237, 110331, https://doi.org/10.1016/j.buildenv.2023.110331, 2023. a
Fernández-Agüera, J., Domínguez-Amarillo, S., Campano, M. A., and Al-Khatri, H.: Effects of covid-induced lockdown on inhabitants' perception of indoor air quality in naturally ventilated homes, Air Qual. Atmos. Hlth, 16, 193–212, https://doi.org/10.1007/s11869-022-01239-3, 2023. a
Fisk, W. J. and de Almeida, A. T.: Sensor-based demand-controlled ventilation: a review, Energ. Buildings, 29, 35–45, https://doi.org/10.1016/S0378-7788(98)00029-2, 1998. a
Füldner, M. and Dehé, A.: Double Back Plate Silicon MEMS Microphone: Balancing High Performance!, in: 41. Jahrestagung für Akustik, edited by: Becker, S., Fortschritte der Akustik, DAGA, ISBN 978-3-939296-08-9, https://pub.dega-akustik.de/DAGA_2015/data/articles/000534.pdf (last access: 5 June 2024), 2015. a
Goertzel, G.: An Algorithm for the Evaluation of Finite Trigonometric Series, Am. Math. Mon., 65, 34, https://doi.org/10.2307/2310304, 1958. a
Gordon, I. E., Rothman, L. S., Hargreaves, R. J., Hashemi, R., Karlovets, E. V., Skinner, F. M., Conway, E. K., Hill, C., Kochanov, R. V., Tan, Y., Wcisło, P., Finenko, A. A., Nelson, K., Bernath, P. F., Birk, M., Boudon, V., Campargue, A., Chance, K. V., Coustenis, A., Drouin, B. J., Flaud, J., Gamache, R. R., Hodges, J. T., Jacquemart, D., Mlawer, E. J., Nikitin, A. V., Perevalov, V. I., Rotger, M., Tennyson, J., Toon, G. C., Tran, H., Tyuterev, V. G., Adkins, E. M., Baker, A., Barbe, A., Canè, E., Császár, A. G., Dudaryonok, A., Egorov, O., Fleisher, A. J., Fleurbaey, H., Foltynowicz, A., Furtenbacher, T., Harrison, J. J., Hartmann, J., Horneman, V., Huang, X., Karman, T., Karns, J., Kassi, S., Kleiner, I., Kofman, V., Kwabia–Tchana, F., Lavrentieva, N. N., Lee, T. J., Long, D. A., Lukashevskaya, A. A., Lyulin, O. M., Makhnev, V., Matt, W., Massie, S. T., Melosso, M., Mikhailenko, S. N., Mondelain, D., Müller, H., Naumenko, O. V., Perrin, A., Polyansky, O. L., Raddaoui, E., Raston, P. L., Reed, Z. D., Rey, M., Richard, C., Tóbiás, R., Sadiek, I., Schwenke, D. W., Starikova, E., Sung, K., Tamassia, F., Tashkun, S. A., Vander Auwera, J., Vasilenko, I. A., Vigasin, A. A., Villanueva, G. L., Vispoel, B., Wagner, G., Yachmenev, A., and Yurchenko, S. N.: The HITRAN2020 molecular spectroscopic database, J. Quant. Spectrosc. Ra., 277, 107949, https://doi.org/10.1016/j.jqsrt.2021.107949, 2022. a
Green, M. A. and Keevers, M. J.: Optical properties of intrinsic silicon at 300 K, Prog. Photovoltaics: Res. Appl., 3, 189–192, https://doi.org/10.1002/pip.4670030303, 1995. a
Huber, J. and Wöllenstein, J.: Kompaktes photoakustisches Gasmesssystem mit Potential zur weiteren Miniaturisierung, tm – Technisches Messen, 80, 448–453, https://doi.org/10.1524/teme.2013.0052, 2013. a
Huber, J., Wöllenstein, J., Kolb, S., Dehé, A., and Jost, F.: E6.3 – Miniaturized Photoacoustic CO2 Sensors for Consumer Applications, in: Proceedings SENSOR 2015, AMA Service GmbH, Von-Münchhausen-Str. 49, 31515 Wunstorf, Germany, 688–692, https://doi.org/10.5162/sensor2015/E6.3, 2015a. a
Huber, J., Wöllenstein, J., Kolb, S., Dehé, A., and Jost, F.: E6.3 – Miniaturized Photoacoustic CO2 Sensors for Consumer Applications, in: Proceedings SENSOR 2015, AMA Service GmbH, Von-Münchhausen-Str. 49, 31515 Wunstorf, Germany, 688–692, https://doi.org/10.5162/sensor2015/E6.3, 2015b. a
Huber, J., Enriquez, J. A., Escobar, A., Kolb, S., Dehé, A., Jost, F., and Wöllenstein, J.: Photoakustischer Low-Cost CO2-Sensor für Automobilanwendungen, in: Automobil-Sensorik, edited by: Tille, T., Springer Berlin Heidelberg, 79–96, ISBN 978-3-662-48943-7, https://doi.org/10.1007/978-3-662-48944-4_4, 2016. a
Jha, R. K.: Non-Dispersive Infrared Gas Sensing Technology: A Review, IEEE Sens. J., 22, 6–15, https://doi.org/10.1109/JSEN.2021.3130034, 2022. a
Lee, J., Wan Kim, T., Lee, C., and Koo, C.: Integrated Approach to Evaluating the Effect of Indoor CO2 Concentration on Human Cognitive Performance and Neural Responses in Office Environment, J. Manage. Eng., 38, 04021085, https://doi.org/10.1061/(ASCE)ME.1943-5479.0000993, 2022. a
Lehrer, E. and Luft, K.: Verfahren zur Bestimmung von Bestandteilen in Stoffgemischen mittels Strahlungsabsorption, German Patent/DE Patent DE730478C, 1943. a, b
Li, B. and Cai, W.: A novel CO2-based demand-controlled ventilation strategy to limit the spread of COVID-19 in the indoor environment, Build. Environ., 219, 109232, https://doi.org/10.1016/j.buildenv.2022.109232, 2022. a
Marinov, M. B., Ganev, B., Djermanova, N., and Tashev, T. D.: Analysis of Sensors Noise Performance Using Allan Deviation, in: 2019 IEEE XXVIII International Scientific Conference Electronics (ET), 1–4, https://doi.org/10.1109/ET.2019.8878552, 2019. a
Mirabelli, M. C., Ebelt, S., and Damon, S. A.: Air Quality Index and air quality awareness among adults in the United States, Environ. Res., 183, 109185, https://doi.org/10.1016/j.envres.2020.109185, 2020. a
Palzer, S.: Photoacoustic-Based Gas Sensing: A Review, Sensors, 20, 2745, https://doi.org/10.3390/s20092745, 2020. a, b, c
Peng, Z. and Jimenez, J. L.: Exhaled CO2 as a COVID-19 Infection Risk Proxy for Different Indoor Environments and Activities, Environ. Sci. Tech. Let., 8, 392–397, https://doi.org/10.1021/acs.estlett.1c00183, 2021. a
Petersen, S., Jensen, K. L., Pedersen, A. L. S., and Rasmussen, H. S.: The effect of increased classroom ventilation rate indicated by reduced CO2 concentration on the performance of schoolwork by children, Indoor Air, 26, 366–379, https://doi.org/10.1111/ina.12210, 2016. a
Röntgen, W. C.: On tones produced by the intermittent irradiation of a gas, The London, Edinburgh, and Dublin Philosophical Magazine and Journal of Science, 11, 308–311, https://doi.org/10.1080/14786448108627021, 1881. a
Satish, U., Mendell, M. J., Shekhar, K., Hotchi, T., Sullivan, D., Streufert, S., and Fisk, W. J.: Is CO2 an indoor pollutant? Direct effects of low-to-moderate CO2 concentrations on human decision-making performance, Environ. Health Persp., 120, 1671–1677, https://doi.org/10.1289/ehp.1104789, 2012. a
Song, G., Ai, Z., Liu, Z., and Zhang, G.: A systematic literature review on smart and personalized ventilation using CO2 concentration monitoring and control, Energy Reports, 8, 7523–7536, https://doi.org/10.1016/j.egyr.2022.05.243, 2022. a
Umweltbundesamt: Gesundheitliche Bewertung von Kohlendioxid in der Innenraumluft. Mitteilungen der Ad-hoc-Arbeitsgruppe Innenraumrichtwerte der Innenraumlufthygiene-Kommission des Umweltbundesamtes und der Obersten Landesgesundheitsbehörden, Bundesgesundheitsbla., 51, 1358–1369, https://doi.org/10.1007/s00103-008-0707-2, 2008. a
Vehviläinen, T., Lindholm, H., Rintamäki, H., Pääkkönen, R., Hirvonen, A., Niemi, O., and Vinha, J.: High indoor CO2 concentrations in an office environment increases the transcutaneous CO2 level and sleepiness during cognitive work, J. Occup. Environ. Hyg., 13, 19–29, https://doi.org/10.1080/15459624.2015.1076160, 2016. a
von Pettenkofer, M.: Über den Luftwechsel in Wohngebäuden, Cotta'sche Buchhandlung, https://doi.org/10.11588/diglit.41379.6, 1859. a
Wachenfeldt, B. J., Mysen, M., and Schild, P. G.: Air flow rates and energy saving potential in schools with demand-controlled displacement ventilation, Energ. Buildings, 39, 1073–1079, https://doi.org/10.1016/j.enbuild.2006.10.018, 2007. a
Wetsel, G. C. and McDonald, F. A.: Experimental investigation of the photoacoustic effect in liquids and solids, J. Acoust. Soc. Am., 60, S52–S53, https://doi.org/10.1121/1.2003397, 1976. a
Yassine, H., Weber, C., Eberhardt, A., El-Safoury, M., Wöllenstein, J., and Schmitt, K.: Detection of SO2F2 Using a Photoacoustic Two-Chamber Approach, Sensors, 24, 191, https://doi.org/10.3390/s24010191, 2023. a


