the Creative Commons Attribution 4.0 License.
the Creative Commons Attribution 4.0 License.
Data fusion of surface data sets of X-ray computed tomography measurements using locally determined surface quality values
Andreas Michael Müller
Tino Hausotte
X-ray computed tomography as a measurement system faces some difficulties concerning the quality of the acquired measurements due to energy-dependent interaction of polychromatic radiation with the examined object at hand. There are many different techniques to reduce the negative influences of these artefact phenomena, which is also the aim of this newly introduced method. The key idea is to create several measurements of the same object, which only differ in their orientation inside the ray path of the measurement system. These measurements are then processed to selectively correct faulty surface regions. To calculate the needed geometrical transformations between the different measurements with the goal of a congruent alignment in one coordinate system, an extension of the iterative closest point (ICP) algorithm is used. To quantitatively classify any surface point regarding its quality value to determine the individual need of correction for each point, the local quality value (LQV) method is used, which has been developed at the Institute of Manufacturing Metrology. Different data fusion algorithms are presented whose performances are tested and verified using nominal–actual comparisons.
- Article
(4066 KB) - Full-text XML
- BibTeX
- EndNote
The measurement principle of X-ray computed tomography (CT) makes it possible to determine the distribution of attenuation coefficients of a measurement volume, which is achieved by creating and evaluating a set of radiographs. The inevitable polychromatic character of the X-rays and the physical interaction of matter with that radiation combined with introduced simplifications of those phenomena within the reconstruction routine causes image artefacts to occur within the reconstructed picture of the measurement object. Various methods have been proposed to prevent those unwanted phenomena from emerging at different locations of the measurement chain: pre-filtration is used to change the polychromatic character of the radiation, locally adaptive surface determination algorithms try to take account of the shifting radiation spectrum due to beam hardening. Additionally, there are different techniques to use data fusion of several faulty measurements to achieve an exact representation of the measurement object (Heinzl et al., 2007; Guhathakurta et al., 2015). Because of the requirements of certain boundary conditions (dual-energy CT, Heinzl et al., 2007; orthogonal orientations for different measurements, Guhathakurta et al., 2015) those methods are not always practicable.
This paper presents a newly developed procedure to correct artefacts of X-ray computed tomography measurements. An important aspect of the solution presented is the qualitative classification of single-surface vertices with the help of the LQV (local quality value) method, which has been developed at the Institute of Measurement Metrology (Fleßner and Hausotte, 2016; Fleßner et al., 2015a). Given the necessary expert knowledge, this method is capable of detecting artefacts in measurement data to provide rated surface points for further evaluation. Depending on the chosen quality parameter, the resulting quality classification is also well suited for multi-material problems, because the underlying transitions can be evaluated for different shape criterions, relative to other transitions within that measurement. The basic principle behind the presented data fusion routine is to produce several single measurements of a measurement object, which only differ in terms of the location and direction of their rotation axis in the cone beam CT system. These measurements subsequently differ regarding the appearance of artefacts, which allows for selective mathematical combination of measurements to acquire a final measurement result with higher precision and validity.
The following chapter presents the general procedure behind the idea of fusing the determined surfaces out of several single measurements into one data set with improved quality measures. Subsequently, the main goal is to correct locally incorrect surface determinations, which are provoked mainly by beam hardening and cone beam artefacts. Verification of the data fusion results will be achieved by using and evaluating nominal–actual comparisons. The complete process is implemented fulfilling the following framework conditions:
-
The starting points of the procedure are the triangulated surfaces resulting from the surface determination process.
-
The orientations of the different single measurements respectively to each other are unknown and can take arbitrary values. This leads to high requirements for the necessary registration procedure.
-
Information regarding the local surface quality will be applied at different process steps by utilizing the LQV method (Sect. 2.2).
-
The registration and fusion process will be implemented without using a CAD-reference file of the measurement object. This ensures the usability of the method even when no representation of a reference is available.
The complete workflow will subsequently be demonstrated with the help of an example.
2.1 Measurement data
In order to be able to provoke certain artefact appearances in the measurement data, all data sets were acquired using the simulation tool aRTist, developed by the Federal Institute for Materials Research and Testing (BAM) in Berlin, Germany. The (virtual) CT settings were chosen as follows: 130 kV tube voltage, 275 µA tube current, 44 µm voxel size, 800 projections. The foundation of the examinations is a special test specimen (dimensions approx. mm3), which has been developed at the Institute of Manufacturing Metrology (FMT) (Zierer, 2013). The main material of the measurement object is chosen as plastic (PVC, density 1.38 g cm−3, Kern, 2017), while additional small objects made out of tungsten (density 19.25 g cm−3, http://www.chemie.de/, last access: 12 June 2017) have been inserted into the body in order to provoke heavy beam hardening and photon starvation artefacts. The measurement series consists of four single measurements, which differ only in the orientation and position of their rotation axis in the cone beam X-ray beam path. The process of surface determination out of the reconstructed volume data was performed using the software VGStudio Max 3.0.1 (VGS, Volume Graphics GmbH, Germany). Because of the very high-density differences of tungsten compared to PVC and the atmosphere, the automatic material definition setting of VGS leads to segmentation of the tungsten objects rather than the PVC specimen. In order to achieve a segmentation of the correct material, the “ISO value” (starting threshold in the VGS segmentation routine) was estimated by calculating a histogram of the complete volume data, identifying the “background peak” and “PVC peak” and manually setting the resulting ISO50 value of both peaks in VGS. This procedure has proven to be suitable for segmentation of rather extreme multi-material scenarios. Created surfaces were then exported as a triangulated surface using the STL interface to enable further processing. The concept in this paper relies on the premise that every point on the surface will be measured correctly at least once (see description above), thus reducing the importance of a correct segmentation in surface regions corrupted by artefacts.
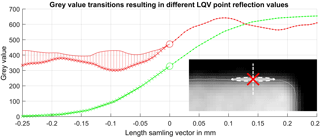
Figure 1LQV-parameter point reflection: grey value profiles (green and red) are constructed and sampled perpendicular to the determined surface (VGS, small image bottom right). The position x=0 (marked with circles and red cross in the small image respectively) represents a surface data point. Mirroring of the right function branch (x>0) onto the left one (x<0) leads to differently sized areas (hatched region) between both function branches, thus resulting in a good or a bad point reflection parameter value (green curve, red curve respectively).
2.2 Local quality value (LQV)
In order to classify different surface points during processing, a local quality measure was used. The following patented (Fleßner and Hausotte, 2016) framework has been developed at the Institute of Manufacturing Metrology (Fleßner et al., 2015a, b) and is currently subject to ongoing research efforts. The procedure is characterized by extraction of grey value profiles in the vicinity of the surface point and evaluation of those profiles according to certain criteria. Starting from one single-surface point, a search ray is constructed inside the CT volume data following the vertex normal vector in both possible directions for a certain length (approximately ±250 µm). Along that search-ray volume data, grey values are linearly interpolated with sub-voxel accuracy, thus constructing the characteristic grey value profile for each surface vertex. Subsequently each grey value profile consists of 2 n+1 sampled values, with n being the number of steps in each direction of the surface normal vector (see also Fig. 1). Grey value profiles with sufficient quality usually present themselves in the shape of a sigmoidal function, consequently making it possible to construct different kinds of quality measures evaluating the local goodness of a certain surface point. The determined quality parameters are then rescaled and normalized during a post-processing routine. Subsequently, a visual representation of the local surface quality can be achieved by pairing the determined quality parameters with a suitable colour map (e.g. red–yellow–green standing for low to high quality). To reduce the impact of falsely classified surface points, a moderate iterative mean filter (Gauss filter) is applied.
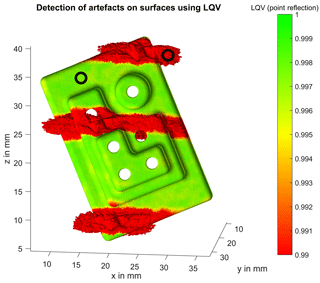
In order to classify surface points with the LQV method for the assessment of the introduced measurement series (see Sect. 2.1), a point symmetry measure (point reflection) is evaluated for each grey value transition. The idea behind this procedure is that symmetric transitions with a high maximum grey value gradient and therefore a high contrast are expected to be of higher quality, because it makes surface determination at this point very stable and robust. If this transition has a lower point reflection quality parameter, the transition is anticipated as being invaluable and thus representing a local artefact appearance. The procedure is visualized in Fig. 1. The sampled grey value transition of an underlying surface point alongside its vertex normal vector results in a sigmoidal curve (green lines) or a disrupted sigmoidal curve (caused by artefacts, red lines). To determine the LQV parameter “point reflection”, one of the function branches (line with dots) is mirrored (point reflection at x=0) onto the other branch (straight line). The size of the remaining area between the first part of the transition (straight line) and the mirrored part of the transition (line with crosses) represents the desired quality parameter (after inverting and scaling). In the case of the green lined example, the area between the two function branches is very small, thus resulting in a high LQV, while the red lined example is rated worse. The regions of the surface points from this example have been marked in Fig. 2.
Figure 2 shows one measurement of the mentioned measurement series with a certain orientation of the measurement object in the CT-ray beam. In the illustrated figure, the surface coordinates are depicted in the volume grid coordinate system of the volume data representing the measurement. That means that the rotation of the object within the cone beam CT was performed around an axis parallel to the z axis. As previously mentioned, the measurement object consists of a polymer material with some tungsten deposits at three different positions. The impact of this very dense material, which leads to heavy beam hardening artefacts, is clearly visible as surface regions with an incorrect surface determination. It is also evident that the mentioned artefacts occur almost perpendicular to the applied rotation axis during the measurement. This observation is exploited by varying the orientation of the measurement object during the measurement within a measurement series in order to change the presence of artefacts in each measurement. Local examination of the volume data at the regions with heavy artefacts shows that a reasonable surface determination is not possible in those regions without pre-processing or introduction of external knowledge. Figure 2 also shows the capability of the LQV parameter point reflection, as it is possible to detect the problematic surface regions precisely and robustly. With help of this stable classification, further processing of the measurement series is possible.
2.3 Surface registration
Each measurement is represented in its own coordinate system, which originates from the related volume grid coordinate systems of each measurement set-up. In order to render local data fusion based on surface coordinates possible, a registration process is necessary to transform all measurements of one series into the same coordinate system. The necessary transformation is a rigid transformation, which allows for a degree of freedom of six (three rotations and three translations). The goal of this step is to transform all measurements into a common coordinate system, while maintaining a minimum residual error between the registration partners. A commonly used algorithm for this kind of problem is the iterative closest point (ICP) algorithm, proposed almost at the same time by Besl and McKay (1992) and by Chen and Medioni (1991). Initially, as there is no CAD-reference surface available for a normal measuring task, a “master surface” has to be chosen arbitrarily, which represents the reference registration surface for the other measurements. The basic function of the ICP algorithm consists of a matching step, in which corresponding coordinate pairs are determined in such a way that each surface point of the master surface pi is assigned the nearest (Euclidian distance) vertex of the fitting partner qi. The algorithm then iteratively determines the unknown rotational and transformational directions by minimization of a certain error function. Equation (1) shows the so-called “point-to-point” error metric, which minimizes the sum of the distances e of n corresponding coordinate pairs pi and qi by determining the ideal rotation matrix R and translation vector T.
By changing the error function to minimize the sum of perpendicular distances of the vertices of one surface to the tangent plane of the corresponding vertices by introducing the normal vectors ni (Eq. 2), better convergence behaviour can be achieved for structured surfaces (“point-to-plane”). Although the normal vectors of both fitting surfaces are not absolutely robust, as these are both measurements and therefore prone to noise, the point-to-plane approach resulted in better results and is therefore used subsequently.
A challenge when using this registration routine is the occurrence of basins of convergence of limited size and depth. That means that it is possible that the algorithm converges to only a local rather than a global minimum in the error space. A suboptimal transformation (mainly the rotational part) instruction is calculated. This behaviour was solved by implementing a first step, which determines an optimum pre-transformation by means of structured sampling. In order to limit computational expenses to a reasonable level, pre-transformation is only determined with heavily reduced surface point density.
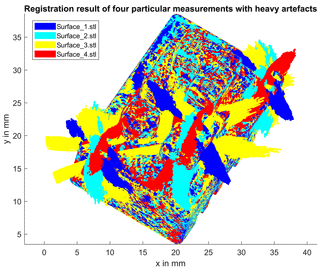
Overall, the registration problem at hand constitutes a huge challenge for any registration process due to heavy artefact occurrences. If the registration is performed without any additional information, the result will be insufficient to use for further fusion algorithms, because the error function will be evaluated incorrectly. Experiments have shown that a convergence even near to a correct solution is impossible because of the error introduced by faulty surface regions. To enable the correct registration of correctly determined surface regions without the influence of bad regions, a weighting factor is introduced for each corresponding point pair. This factor is set as the product of the LQVs for each of the mentioned vertex pairs pi and qi. A rescaling procedure of the LQV parameters to fill the complete value range available (0–1) ensures a more robust mathematical response for badly classified pairs. The registration result as shown in Fig. 3 demonstrates a very good transformation of four single measurements into the same coordinate system, while the impact of faulty surface regions has mostly been suppressed.
2.4 Data fusion algorithms and verification set-up
The previously described methods allow for an actual fusion routine to be introduced. Starting with an overall number of n surfaces to process, the main idea is to correct each single measurement by means of the other measurements, resulting in n corrected surfaces. This process is performed iteratively, meaning that the corrected surfaces will converge to each other. The overall fusion framework can be described in the following steps:
-
Choose a “master” surface with index , which will be the starting point for further processing.
〈begin of iteration〉
-
Define set .
-
Choose a single-surface point , master surface i, with “max” being the last surface point index.
-
Search for a set of nearest neighbours k for pu,i in surfaces j (Euclidian distance, utilize efficient search trees).
-
For fusion, determine out of set ; see below for detailed description of different fusion logics.
-
Repeat 3–5 for each surface point of surface i.
-
Repeat 1–6 for each surface by changing index i.
-
Set .
〈end of iteration〉
-
Repeat 1–8 until maximum number of iterations reached (set to 15 for all further evaluations).
In the following, three different fusion logics are introduced, featuring the different formulas for calculating out of the set {pu,k}, as mentioned previously in step 5.
The first method (Eq. 3) can be calculated using the arithmetic mean coordinate of the set {pu,k}, which is expected to deliver unsatisfying results. This is the case because bad surface points are treated the same as good surface points, resulting in insufficient correction of bad points and faulty correction of good points.
The second method (Eq. 4) is determined by computing the linearly weighted mean of set . The weighting factors are represented by the corresponding LQVs for the set of points to be processed. The usage of weighting factors ensures the different influence of differently qualitatively classified surface points on the result of .
Lastly, the third method (Eq. 5), introduces an additional condition compared to method two, which states that a correction will not be performed if the LQV of pu,i surpasses a certain boundary value (LQVboundary, here 0.99; see also Fig. 2).
The quality of the surface fusion routine is verified using cumulative evaluations of nominal–actual comparisons, evaluating the alignment of the measurement and the correction with the CAD model of the used specimen. Additionally, a measurement of the specimen was performed, using the exact same settings as for the creation of the measurement data, but leaving out the artefact causing tungsten insertions. This reference measurement represents the quality of the maximum achievable correction in this context. Nominal–actual comparisons were calculated using VGS.
A visual observation of a corrected surface utilizing correction method three (Eq. 5) is shown in Fig. 4. It is apparent that faulty surface regions have been corrected up to a certain extent, but some errors remain. Yellow regions depict an incorrect surface normal vector, indicating an imperfect triangulation of the surface at hand. The reason for that is that the fusion algorithm itself only processes point clouds without any consideration of the spatial correspondence of certain points within a triangulated surface. The visual presentation in Fig. 4 uses the original triangulation mapping, which may not be correct any more after the fusion process in certain regions. A repeated triangulation of the raw point cloud may solve this problem but could prove to be difficult without implementation of knowledge about the direction of the underlying grey value gradient of the volume data. Nevertheless, it is visible that a selective correction of faulty surface regions has been achieved.
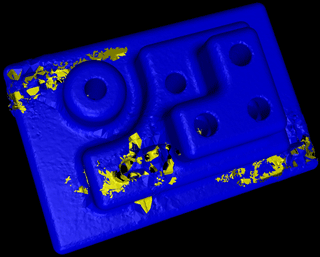
Figure 4Visualization of a corrected surface. Yellow regions indicate faulty triangulation correspondences due to point cloud processing.
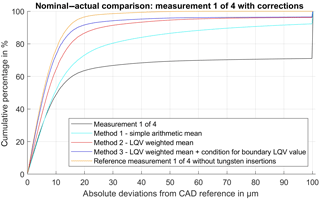
Figure 4 shows several nominal–actual comparisons of different processing results of the same measurement. The three lines representing the results of the different fusion algorithms (colours teal, red and blue) originate from the same single measurement, ensuring comparability. All observed deviations are limited to a maximum deviation of 100 µm, resulting in the sharp cut-off in Fig. 5. The black line represents the nominal–actual comparison of one arbitrarily chosen measurement (number 1 of 4; see Fig. 3) with the CAD reference and shows strong deviations indicating the presence of severe artefacts. The teal line shows the result of a correction using an unweighted arithmetic mean of the corresponding coordinates (Eq. 3), which results in a slight improvement of shape fidelity compared to the original measurement. Further improvements (red line) are achieved using a weighted arithmetic mean algorithm for the calculation of the corrected coordinates and by implementing LQVs (Eq. 4). Finally, the best enhancements are provided by implementing the additional condition (blue line), which prevents a correction of surface points classified as good quality (Eq. 5). These results show that the prevention of a correction of already very well rated surface points (method three, Eq. 5 leads to superior results compared to a weighted mean correction Eq. 4). That means that the LQV parameter used (point reflection) does not behave linearly (what is expected) and that a very high LQV classification correlates very strongly with a low measurement deviation. To rank the results, a supplementary measurement has been introduced (orange line), featuring the basic geometry of the specimen made out of PVC like the other measurements, but without the tungsten insertions. It shows that the provided solution of using a boundary condition for the correction routine and implementing LQV parameters can result in a significant improvement of the shape fidelity of the corrected measurement.
The method presented is able to compensate for locally occurring faulty surface regions due to the influence of beam hardening artefacts. Part of the solution demonstrated is the implementation of LQVs for each surface point, which allow the classification of surface regions with different quality measures. Using LQV parameters for data fusion yields superior results compared to unweighted fusion procedures, which indirectly shows the performance capabilities of the LQV method. Furthermore, a correction is possible without knowledge of a reference surface. In addition, the geometric orientations of different single measurements of a complete measurement series do not need to be known beforehand.
In the future, additional improvements regarding fusion results can be achieved by further development of the LQV parameters. These parameters are used within the presented framework at several occasions: registration and weighted fusion. Consequently, LQV classification errors also directly result in fusion errors, subsequently reducing the quality of the corrected surfaces. Difficulties appear when large correction vectors are applied for certain surface regions. The correspondences determined between coordinate pairs pi and qi of different surfaces are not always truly accurate, because the nearest-neighbour criterion is not guaranteed to also find the correct neighbour. This can lead to slightly incorrect coordinate shifts during the fusion process. In addition, local fluctuations in surface point density can influence the result of the correction.
In this paper, we present a possibility to fuse CT surface data sets from repeated measurements to reduce the unwanted influence of artefacts on the measurement result. The algorithms used for this purpose are described in detail in the paper. Additionally, publications cited in the paper describe the LQV method, as well as the specimen used and the registration routine. Furthermore, the parameters for the generation of the measurement data are described in detail in the paper as well as the software used to process the data if necessary.
AMM contributed data curation, formal analysis, investigation, methodology, software, validation, visualization, and writing (the original draft) and lead the review and editing process. TH contributed to conceptualization, funding acquisition, project administration, supervision, and writing and supported the review and editing process.
The authors declare that they have no conflict of interest.
The work presented was supported by the DFG with the project
“Bestimmung der Messunsicherheit und systematischer Gestaltabweichungen
für eine funktionsorientierte Toleranzvergabe” (DFG Germany, FOR 2271,
TP 03).
Edited by: Marco Jose da
Silva
Reviewed by: three anonymous referees
Besl, P. J., McKay, N. D.: A Method for Registration of 3-D Shapes, IEEE T. Pattern Anal., 14, 239–252, 1992.
Chemie.de: available at: http://www.chemie.de/lexikon/Wolfram.html, last access: 12 June 2017.
Chen, Y. and Medioni, G.: Object Modeling by Registration of Multiple Range Images, Proceedings of the 1991 IEEE International Conference on Robotics and Automation, 9–11 April, 1991.
Fleßner, M. and Hausotte, T.: Method and system for determining the local quality of surface data extracted from volume data, Germany Patent WO 2016/042105 A1, 2016.
Fleßner, M., Müller, A., Helmecke, E., and Hausotte, T.: Automated detection of artefacts for computed tomography in dimensional metrology, available at: , Digital Industrial Radiology and Computed Tomography, https://cris.fau.de/converis/portal/Publication/122186944 (last access: 12 June 2017), 2015a.
Fleßner, M., Müller, A., Helmecke, E., and Hausotte, T.: Evaluating and visualizing the quality of surface points determined from computed tomography volume data, MacroScale 2014 – Recent developments in traceable dimensional measurements, available at: https://cris.fau.de/converis/portal/Publication/118782004 (last access: 12 June 2017), 2015b.
Guhathakurta, J., Kiess, S., and Hillebrand, J.: Reducing Computed Tomography Reconstruction and Beam Hardening Artefacts by Data Fusion, International Symposium on Digital Industrial Radiology and Computed Tomography (DIR), 330–337, 22–25 June, 2015.
Heinzl, C., Kastner, J., Gröller, E.: Surface Extraction from Multi-Material Components using Dual Energy CT, IEEE Trans. Vis. Comput. Graph., 13, 1520–1527, 2007.
Kern: available at: https://www.kern.de/de/technisches-datenblatt/polyvinylchlorid-pvc-u?n=2690_1, last access: 12 June 2017.
Zierer, P.: Entwicklung eines Multi-Material-Prüfkörpers für die industrielle Computertomographie, Lehrstuhl für Fertigungsmesstechnik, Universität Erlangen-Nürnberg, 2013.


