the Creative Commons Attribution 4.0 License.
the Creative Commons Attribution 4.0 License.
 | 30 Jul 2019
Uncertainty evaluation in industrial pressure measurement
Nadine Schiering
Olaf Schnelle-Werner
In the process and manufacturing industry, pressure is one of the variables that most often need to be recorded and monitored. Whether in standard applications or under special operating conditions, each application requires pressure gauges that are perfect for their needs. In Germany, pressure gauges are calibrated by accredited calibration laboratories, according to guideline DKD-R 6-1 (DKD-R 6-1, 2014). This calibration guideline establishes minimum requirements for the calibration procedure and the measurement uncertainty calculation when calibrating pressure gauges. In addition to the uncertainty contributions due to the calibration, the uncertainty contributions due to the specific application, like extreme temperatures, high pressure in containers, extreme height differences, shocks, aggressive media or problematic physical product properties, should be taken into account. This paper presents the approach in which the measurement uncertainty can be calculated in industrial pressure measurements. Furthermore, the individual uncertainty contributions and their identification or origin are discussed. Finally, an example of a measurement uncertainty budget is shown as an important tool in the measurement uncertainty calculation.
- Article
(363 KB) - Full-text XML
- BibTeX
- EndNote


In industry, various types of pressure gauges like bourdon tube manometers, electrical pressure gauges, or pressure transmitters with electrical output are used. These types differ in their construction, functionality, and measuring principle. Pressure gauges are available in various designs: more than 150 measuring ranges are available from approximately 25 mbar to 15 000 bar in the most important internationally used units as gauge pressure, absolute pressure, and vacuum, but also as ± measuring ranges. Pressure gauges can have over 15 output signals, including various current and voltage signals, RS232 and bus signals. Also, different plugs and different cables for electrical connections as well as more than 35 pressure connections of common threads or also flush-mounted connections are available. You can also find various accuracies, pressure peak attenuation, special media and environmental conditions, and much more for the specific application (WIKA, 1995).
All of the pressure gauges can be calibrated by accredited calibration laboratories according to guideline DKD-R 6-1, “Calibration of Pressure Gauges”. This guideline was drawn up by the “Pressure and Vacuum” DKD Technical Committee, in cooperation with the PTB and the accredited calibration laboratories. It specifies minimum requirements for the calibration procedure and for the measurement uncertainty in the calibration of pressure gauges. It takes into account the three different types of pressure:
-
positive and negative gauge pressure;
-
absolute pressure; and
-
differential pressure.
The calibration of pressure gauges is performed by direct comparison of the measured values of the calibration object with those of the reference standard. The metrological traceability of the measuring equipment is ensured by the accredited calibration laboratories.
Depending on the desired measurement uncertainty, pressure gauges are calibrated according to different sequences and their respective measurement series number. The different calibration sequences are shown in Table 1.
Table 1Calibration sequences according to DKD-R 6-1.
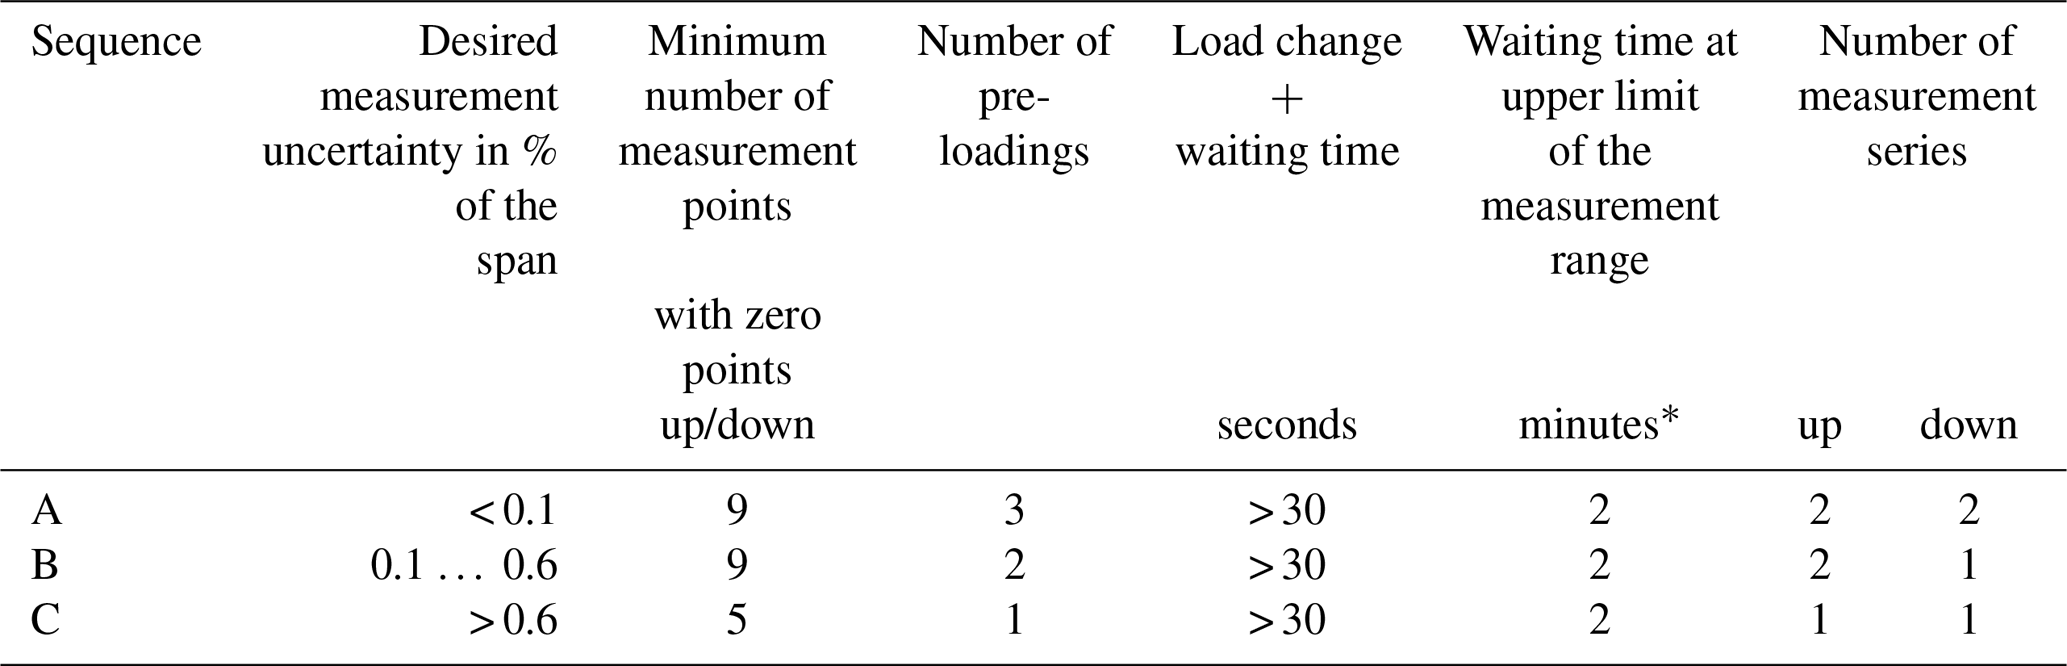
* For Bourdon tube pressure gauges, a waiting time of 5 min is to be observed.
For the measuring setup, it is important to be certain that the calibration object and the standard are at the same height (reference height), to avoid pressure differences due to height differences. The calibration of pressure gauges is carried out at equally distributed measuring points across the calibration range which correspond to the range of application of the pressure gauges. Depending on the desired measurement uncertainty or accuracy of the calibration object, the measurements are carried out at different numbers of pre-loadings and measuring series (see Table 1). The pre-loadings serve the function of wetting the calibration setup with the pressure medium, and for improving the elasticity of the measuring systems. The magnitude of measurement uncertainty is directly related to the number of measurement series.
During calibration, each pressure stage is first approached in the upward measuring series. After setting the pressure and keeping a waiting time of at least 30 s, the calibration object and the standard are compared with each other. This waiting time is necessary to stabilize the pressure throughout the measurement system and to indicate the applied pressure on the calibration object and on the standard (if digital). This happens only after a certain relaxation time. Especially for Bourdon tube manometers, the frictional effect of the pointer system is minimized by a slight tapping on the housing of the manometers. For the pressure step variation in a measurement series, the time between two successive load steps is the same.
After reaching the highest measuring value of the calibration object, a waiting time of 2 min (for Bourdon tube manometers 5 min) is observed before the measurement is continued with the downward measuring series.
When approaching the individual load steps, care is taken that the measuring points are not exceeded in the upward measuring series or have not fallen below in the downward measuring series.
The determination of the measurement uncertainty is done for each calibration measurement value, meaning for every load step.
The calibration of pressure gauges is to be carried out at stable ambient temperature in the range of 18 to 28 ∘C. The temperature fluctuation during calibration should not exceed ±1 K, and is taken into account in the measurement uncertainty budget.
Sufficient temperature equilibrium between the calibration object and the environment, as well as a warm-up time of the calibration object (or a possible warming of the calibration object by the supply voltage), are considered.
In addition to the uncertainty contributions due to the calibration, the uncertainty contributions due to the specific application, like extreme temperatures, high pressure in containers, extreme height differences, shocks, aggressive media or problematic physical product properties should be taken into account. The user of the pressure gauge should do additional investigations to quantify these uncertainty contributions which are relevant for the specific application.
2.1 Definition
The measurement uncertainty is defined in VIM (ISO/IEC-Leitfaden 99, 2007) as a non-negative parameter characterizing the dispersion of the values being attributed to the measure, and is based on the information used.
2.2 Procedure
Terms and calculation rules for measurement uncertainty determination according to the guide to the expression of uncertainty in measurement (JCGM 100, 2008) and EA guideline “Evaluation of the Uncertainty of Measurement In Calibration” (EA-4/02 M, 2013) are listed in Table 2. Correlations between the input quantities are not taken into account.
Table 2Terms and calculation rules for measurement uncertainty determination.
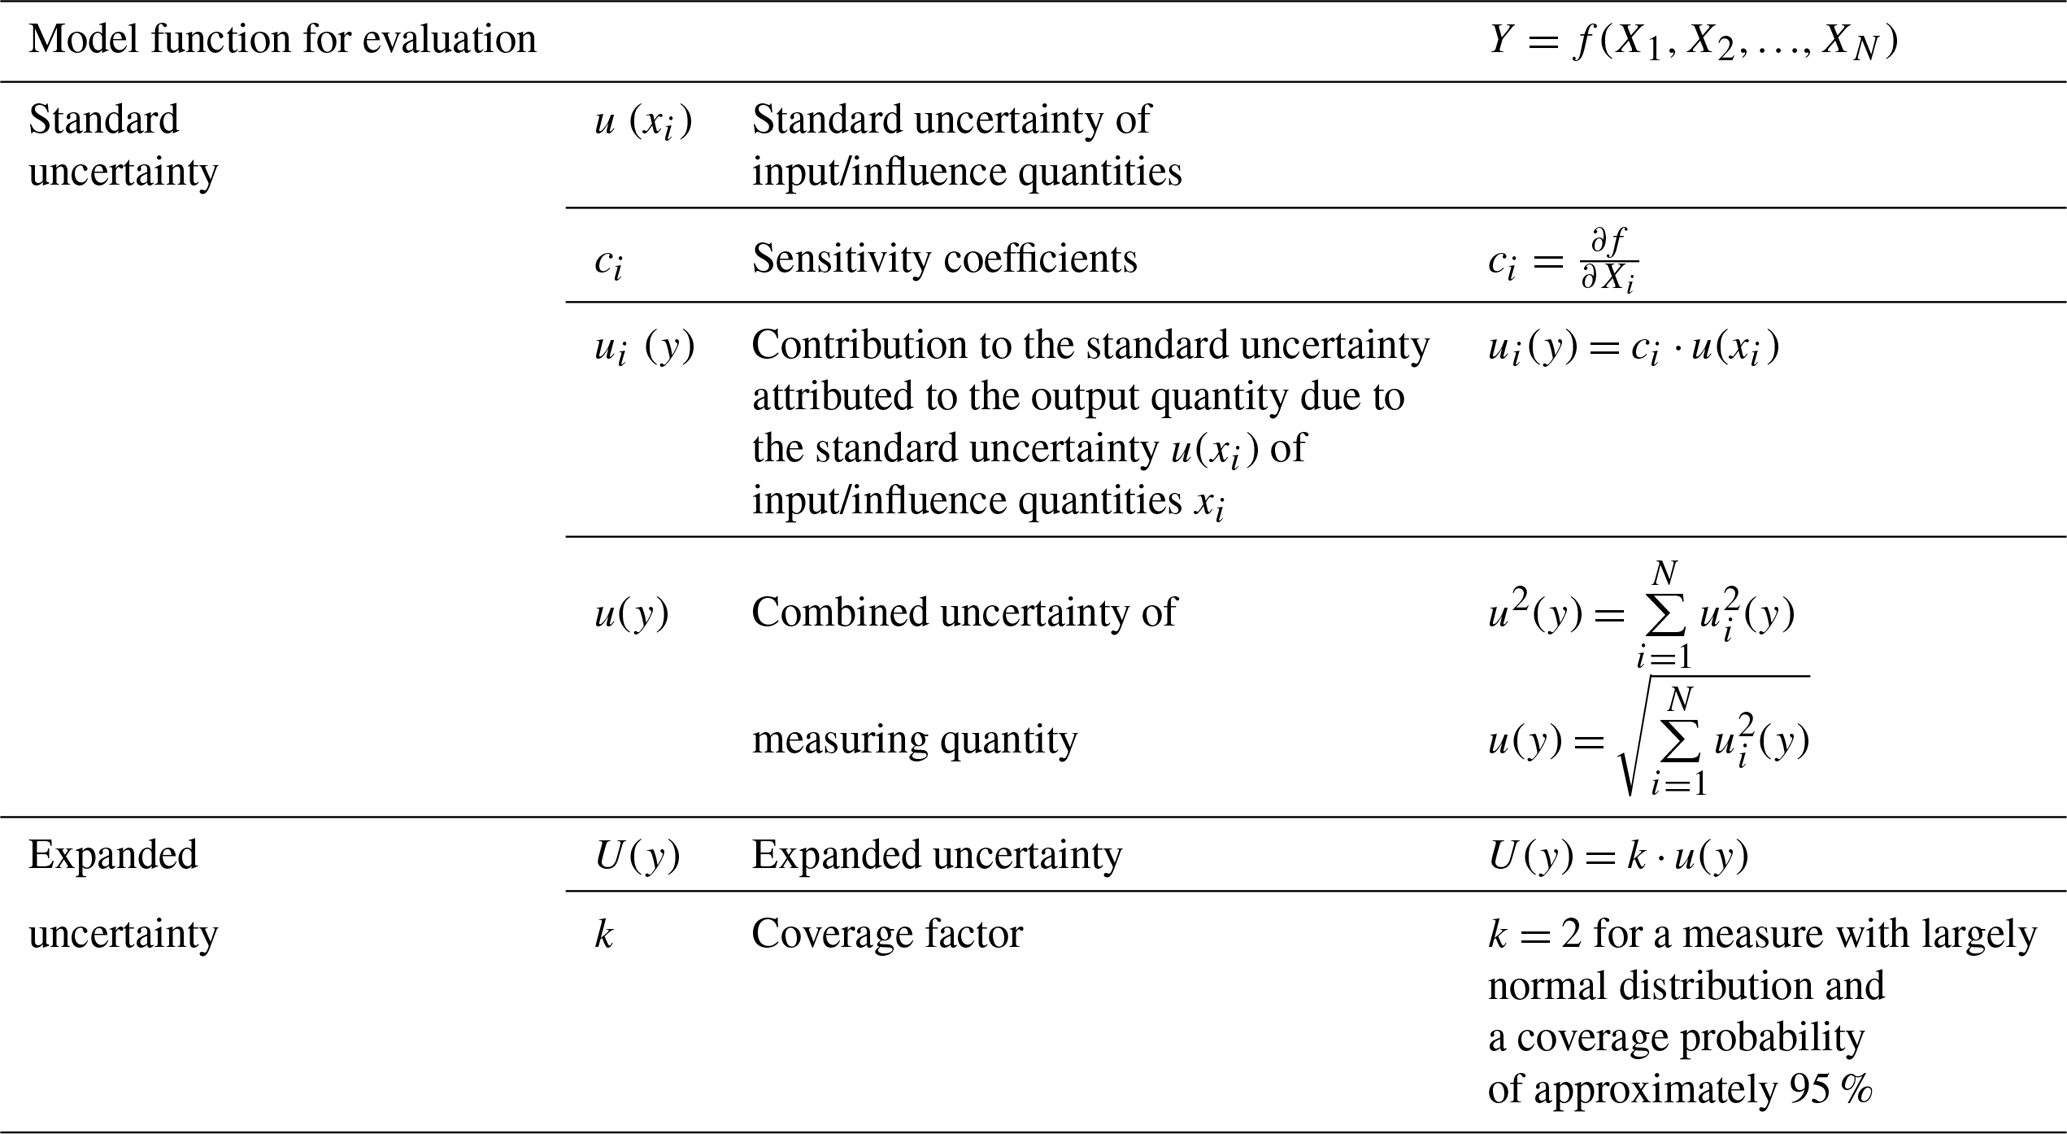
Source: DKD-R 6-1 calibration of pressure gauges (DKD-R 6-1, 2014).
3.1 Possible sources of uncertainty
The following Fig. 1 shows an example of the possible influences for determination of expected value and measurement uncertainty, which should be considered when calibrating a pressure gauge with a piston gauge (pressure balance) as a standard. Based on this illustration, the model of evaluation and calculation of the measurement uncertainty are prepared (Heidenblut et al., 2007; Sommer et al., 2006).
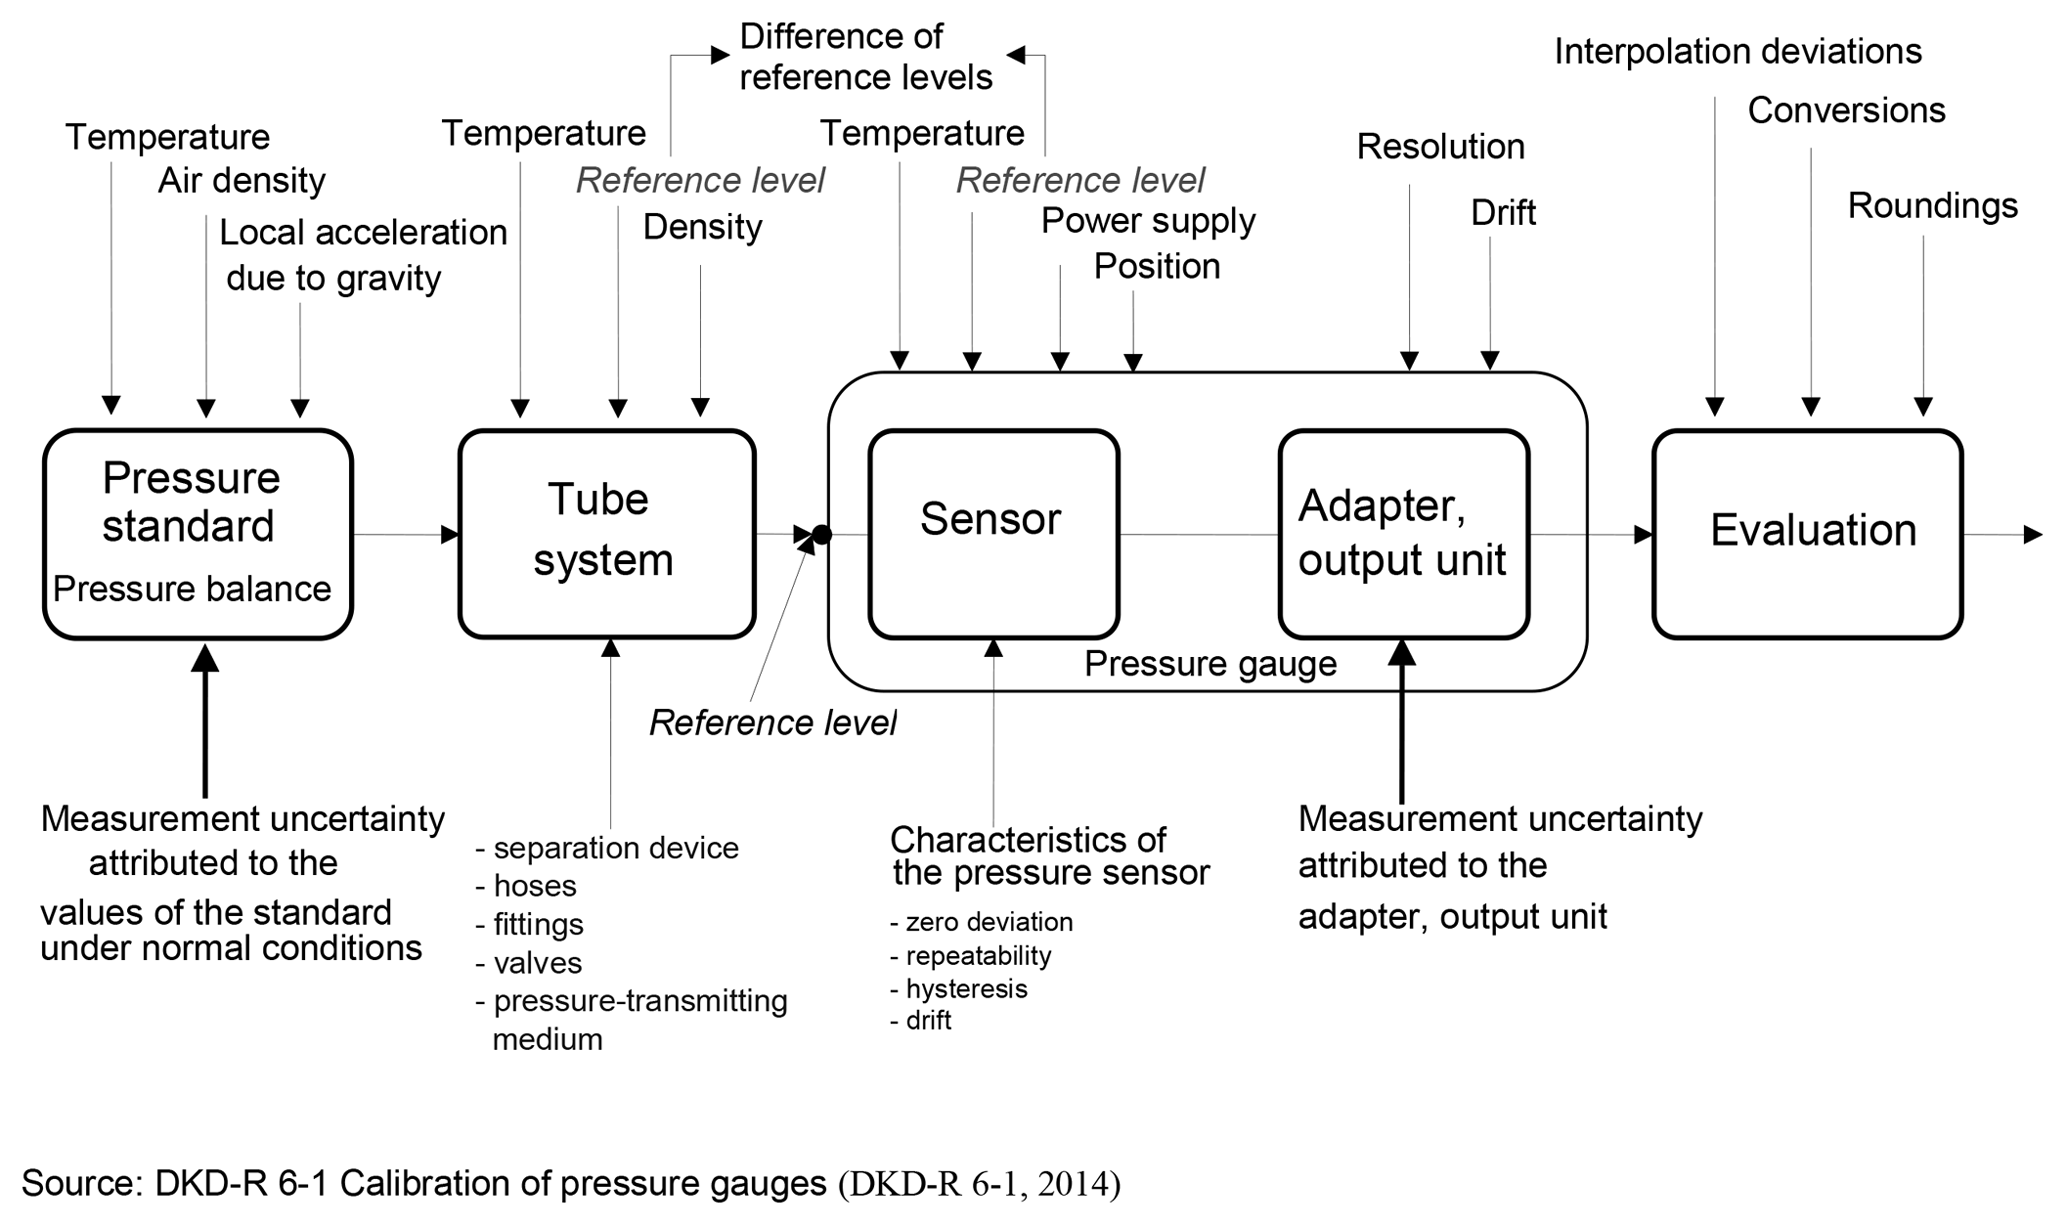
Figure 1Possible influence quantities for calibration of pressure gauges.
In addition to the uncertainty contributions due to the calibration process, application influences should be considered. For example, the temperature gradients could be greater than during calibration. In this case, additional investigations of the pressure gauge should be done to determine the magnitude of this influence.
3.2 Model of evaluation for calibration of Bourdon tube manometers and digital pressure gauges
For calibration of Bourdon tube manometers and digital pressure gauges, a simple sum/difference model for determining the mean measurement deviation of the indication is used:
with and pind,up the mean value of the up measuring values and pind,down the mean value of the down measuring values.
In Table 3, all used variables are listed and explained.
Table 3Overview of the used variables.
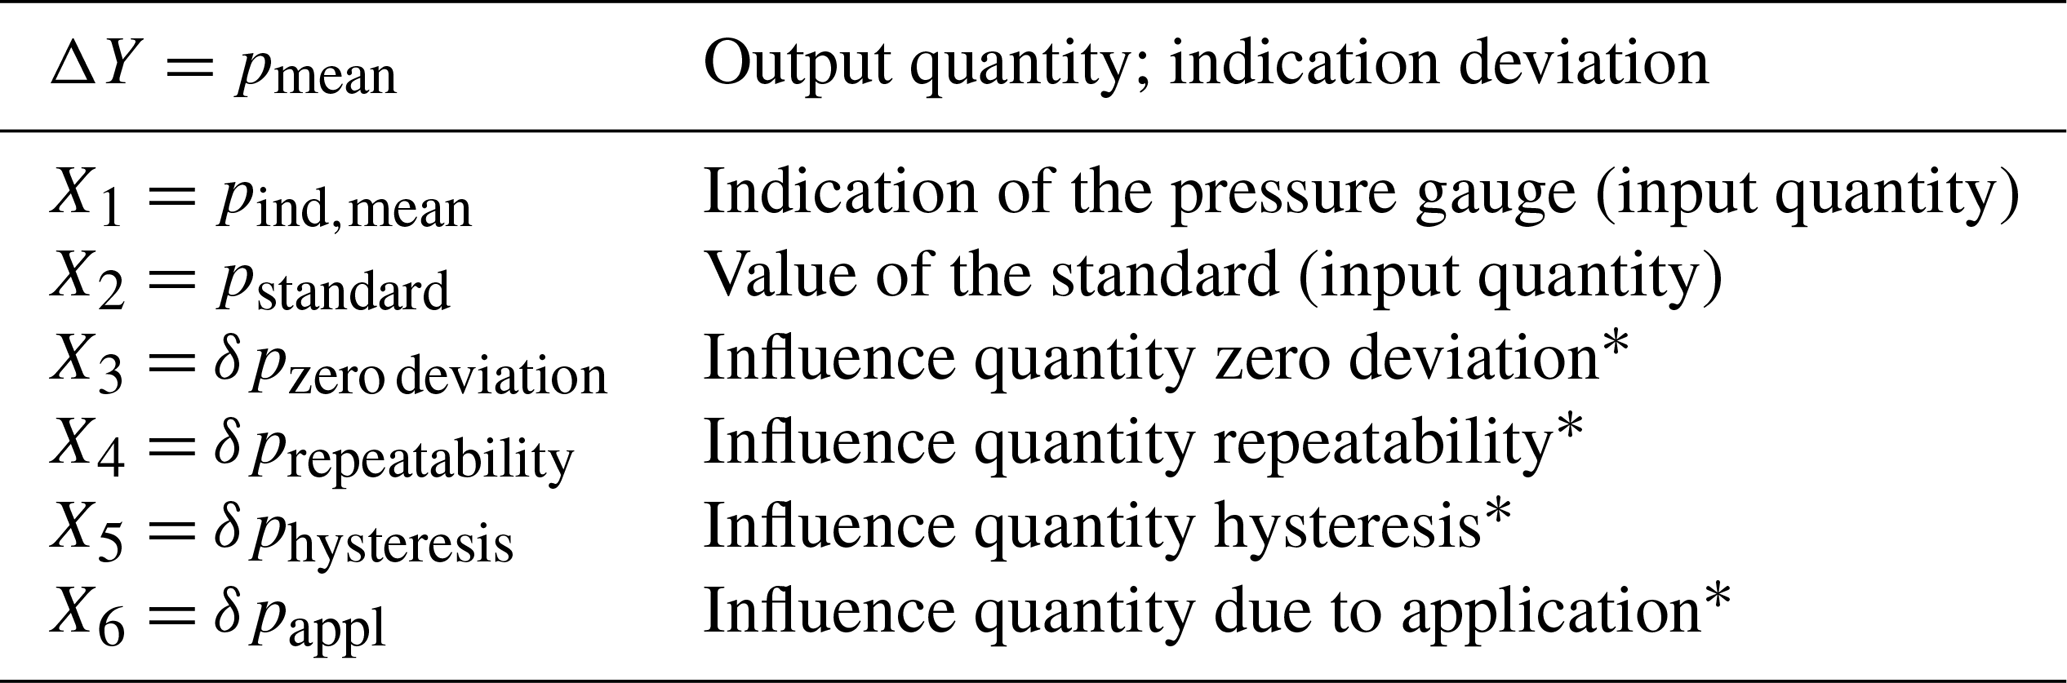
: component with an expected value of 0. It does not contribute to the calculation of the output quantity, but it is taken into account in the measurement uncertainty.
When using the averages from the up and down measurement series, the expanded uncertainty (k=2) is calculated following the law of Gaussian uncertainty propagation according to the following equation:
The indication of the pressure gauge is related to the resolution of the device. In consequence ur is the uncertainty contribution for the indication of the pressure gauge.
3.3 Influence quantities of the measurement uncertainty budget
3.3.1 Influence quantities of the used standard
When measuring pressure gauges, piston gauges (pressure balances), electrical pressure gauges, or pressure calibrators are used as a reference standard.
Piston gauges (pressure balance)
When using piston gauges, it should be considered that the expanded calibration uncertainty which is given in the calibration certificate is valid for reference conditions (standard acceleration or local acceleration, at a temperature of 20 ∘C and an atmospheric pressure of 1013.25 hPa). However, since the calibration with these standards is outside the reference conditions (which means that under application conditions, corrections must be applied in the pressure calculation), the measurement uncertainties attributable to these corrections based on influence quantities are taken into account as additional contributions in the measurement uncertainty budget.
Model of evaluation using a piston gauge
For a piston gauge under application conditions, two corrections must be applied. The first correction takes into account the influence quantities such as
-
t piston temperature,
-
α+β thermal expansion coefficients of piston and cylinder,
-
g acceleration of gravity, and
-
λ deformation coefficient,
which in turn are associated with individual measurement uncertainties.
The temperature of the piston is measured with a calibrated thermometer during the current calibration. The measurement uncertainty of the thermometer is taken from the calibration certificate.
The thermal expansion coefficients and the coefficient of deformation of the piston–cylinder unit, including the associated measurement uncertainties, are given in the calibration certificate of the piston gauge.
The acceleration of gravity is known with sufficient accuracy for the location of the measurement. The uncertainty contribution of the acceleration of gravity is not significant and can be neglected. The uncertainty contribution of the deformation coefficient depends on pressure. At pressures above about 100 MPa, the deformation coefficient becomes a dominant uncertainty source.
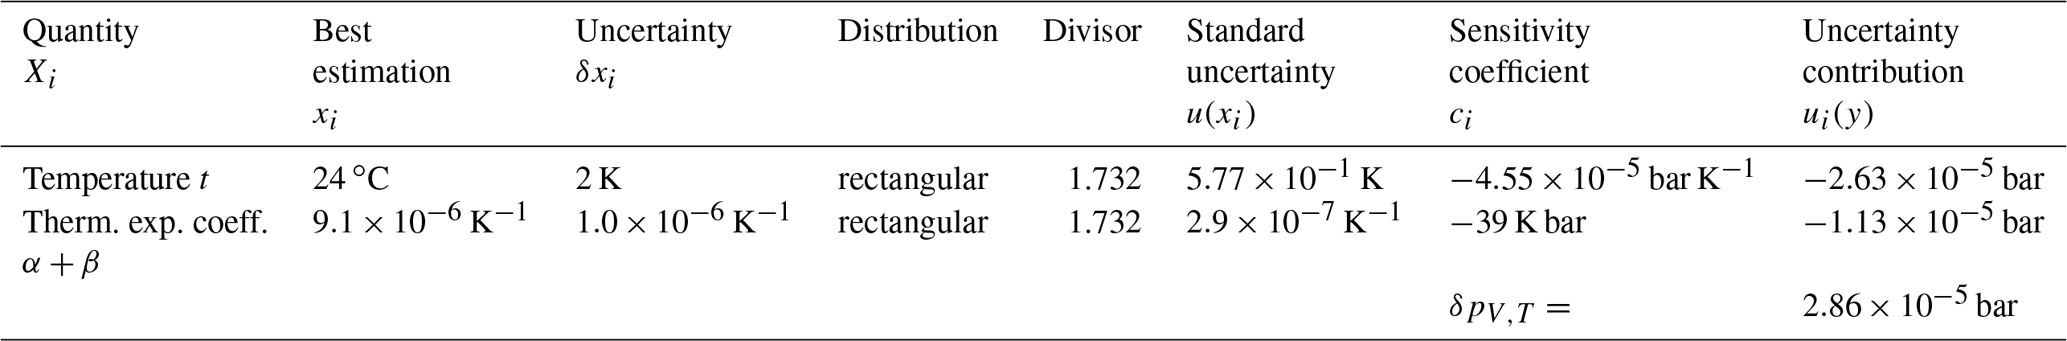
Table 4 shows the measurement uncertainty budget for the temperature influence on the calibration procedure.
Table 4Measurement uncertainty budget due to temperature influence on the measurement procedure.
Another correction takes into account the influence quantities for determination of hydrostatic pressure:
-
Δh difference in altitude between the pressure reference levels of the pressure gauge and of the piston gauge;
-
Δρ difference between the density of the pressure-transmitting medium ρFl and the density of ambient air ρa; and
-
g acceleration of gravity.
In turn, these influence quantities are assigned individual measurement uncertainties.
The difference in altitude between the pressure reference levels of the pressure gauge and of the piston gauge must be currently determined for each measurement. The measuring equipment used for this purpose is a calibrated height gauge or a steel ruler. It should be noted that the pressure reference level of the piston gauge corresponds to the lower edge of the piston in measuring position.
The density difference is calculated from the current air density and the density of the pressure-transmitting medium. The current air density is determined from the ambient temperature and the atmospheric pressure, which means taking into account the pressure-dependent gas density (approximation).
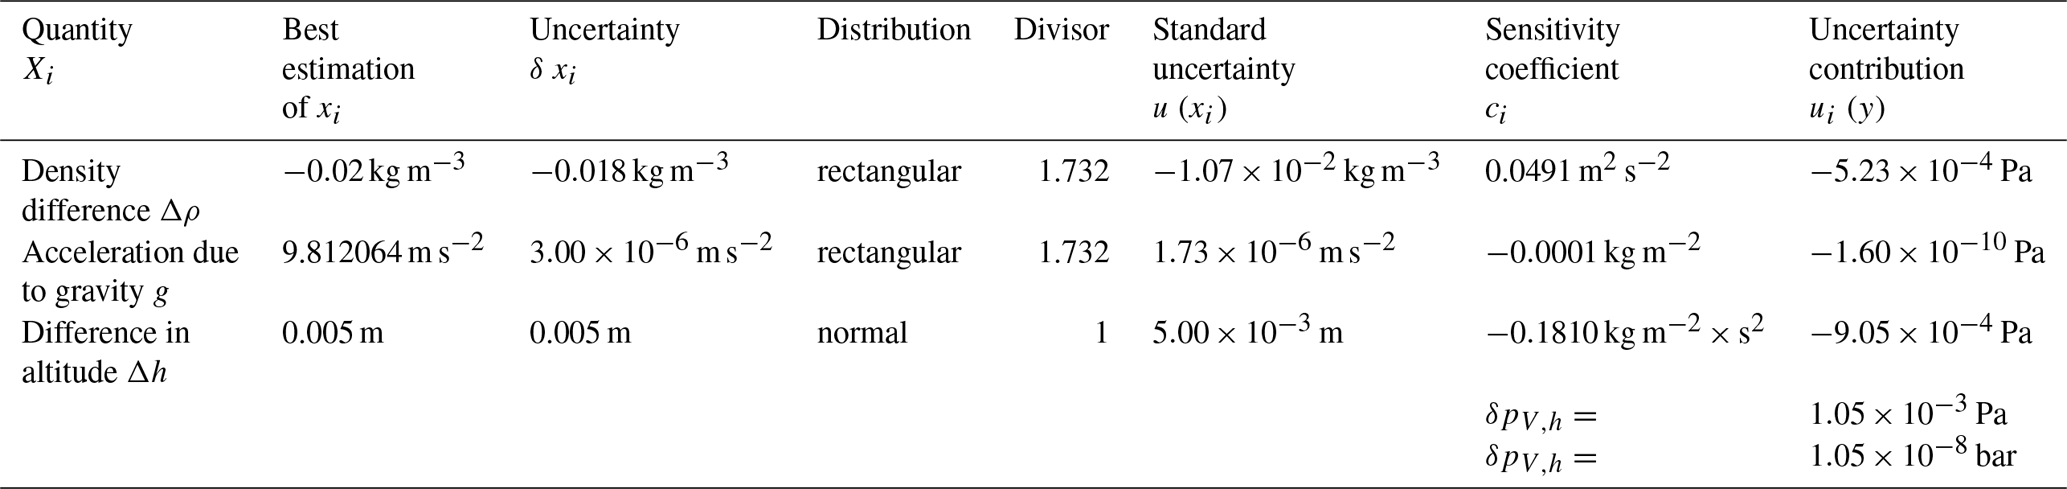
The density of the pressure-transmitting medium is given in the calibration certificate of the piston gauge. The acceleration of gravity at the measuring location of the measurement is considered. Table 5 shows the measurement uncertainty budget for the influence of the difference in altitude on the measurement procedure.
Table 5Measurement uncertainty budget due to difference in altitude to the measurement procedure.
Electrical pressure gauges or pressure calibrators
When using directly indicating pressure gauges (digital pressure gauges/calibrators) as standard measuring instruments, the following influence quantities are taken into account in the measurement uncertainty budget.
-
Measurement uncertainty (calibration certificate, normal distribution)
-
Resolution (manufacturer specification, rectangular distribution)
-
Long-term stability (drift between the recalibrations, rectangular distribution)
-
If necessary, the temperature dependence (manufacturer specification, rectangular distribution)
3.3.2 Influence quantities of the characteristics of the pressure gauge
Source: DKD-R 6-1 calibration of pressure gauges (DKD-R 6-1, 2014)
Resolution r
Analogue indication device
The resolution of the indicating device is obtained from the ratio of the pointer width to the centre distance of two adjacent graduation lines (scale interval). In practice, the ratio 1∕5 is used.
The best estimate of an analogue indicating device is determined by visual interpolation. The smallest estimable fraction of a scale interval is the interpolation component r by which the measurement values can be distinguished. Thus, the variation interval for the best estimate x is and , with the width of the rectangular distribution .
Digital indicating devices
The resolution of digital indicating devices corresponds to the digital step. For the determination of the uncertainty contribution, half the value of the resolution is assigned to the half-width of the rectangular distribution.
Fluctuations of readings
If the reading fluctuates by more than the previously determined value of the resolution with the pressure gauge not being loaded, the resolution r is to be taken as half the span of the fluctuation, additionally added with a digital step.
Zero deviation f0
The zero point (unloaded pressure gauge usually at atmospheric pressure) is set prior to each measurement cycle and is recorded before and after each measurement cycle. The reading is carried out with the instrument being completely relieved. The zero deviation is calculated according to the following equation:
The indices number the measured values x, read at the zero points of the measurement series M1 to M4. To determine the measurement uncertainty contribution, the half-width of the rectangular distribution is assigned half the value of the zero deviation.
Repeatability b′
The repeatability with the mounting not being changed is determined from the difference of the zero signal-corrected measurement values of the corresponding measurement series.
The index j numbers the nominal values of the pressure (j=0: zero point). To determine the measurement uncertainty contribution, the half-width of the rectangular distribution is assigned half the value of the repeatability.
Hysteresis h
When stating the mean values, the hysteresis is determined from the difference of the zero point-corrected measurement values of the increasing and decreasing series as follows:
For index j, see above. The variable n stands for the number of the complete measurement cycles (consisting of an increasing and a decreasing series). To determine the measurement uncertainty contribution, the half-width of the rectangular distribution is assigned half the value of the hysteresis.
3.3.3 Possible influence quantities due to the specific application
Possible influence quantities due to the specific application become necessary if the boundary conditions used by the manufacturer for the calculation of the total performance are different from the site of application of the pressure-measuring device (Industrielle Druck-Messtechnik Grundlagen und Praxis, 2017).
Each measurement result of measuring instruments is influenced by changing environmental and process conditions and by the spatial arrangement of the measuring instruments. For two reasons it is therefore important to carry out an estimation of the expected measuring uncertainty of a measurement setup:
-
ensuring that a selected measurement setup can capture the required process parameters with the accuracy required by the process; and
-
selection of the pressure gauge from a number of different types, which is best suited for a measurement task with regard to the expected measuring uncertainty.
To determine the expected measuring uncertainty, it is first necessary to know the relevant environmental and process conditions. The following questions should be answered.
-
In which range does the ambient temperature change?
-
In which range does the process temperature change?
-
In which range does the process pressure change?
-
Is the transmitter exposed to vibrations at the application site?
-
Is the power supply constant or is it fluctuating?
-
Do electromagnetic influences affect the pressure gauge?
-
Is there a specific alignment of the pressure gauge at the application site?
-
How are the electrical connections realized? Are there any electrical disturbing quantities?
The influences and effects of changes in the ambient and process conditions on the pressure gauge are specified in the manufacturer's specifications. If the application of the pressure gauge differs from these conditions, additional investigations should be planned to quantify an additional uncertainty contribution.
In this paper, the influences of the ambient or process temperature, vibrations in the pipeline and non-constant power supply are taken into account.
Influence of the ambient or process temperature
Additional investigations should be done if the ambient or process temperature of the specific application differs from the boundary conditions of the manufacturer. This influence can be quantified by repeated measurements at different simulated temperatures. To determine the measurement uncertainty contribution, the half-width of the rectangular distribution is assigned half of the span of the measured values.
Typical values are ± (0.15 % of the measuring span +0.15 % of the measured value).
Influence of vibrations
Additional investigations should be done if there are strong vibrations in the measuring system, which can influence the pressure gauge. This influence can be quantified by monitoring the pressure in the measuring system generated by the pressure control unit with a reference pressure gauge at different pressure points. To determine the measurement uncertainty contribution, the half-width of the rectangular distribution is assigned half of the span of the measured values. Typical values are < ±0.1 % of the measuring span (tested in the field or at high pipeline vibrations).
Influence of the power supply
Separate investigations should be done if the power supply is not constant or it is fluctuating. To determine the measurement uncertainty contribution, the half-width of the rectangular distribution is assigned half of the span of the measured values. Typical values are less than ±0.005 % of the measured value per volt change, in volt at the pressure transmitter connection terminals.
These uncertainty contributions can be combined into the uncertainty contribution for the specific application.
3.4 Sensitivity coefficients
Sensitivity coefficients ci describe how the output quantity is affected by small changes in the input quantities. For the model function, ci is the first-order partial derivative of f with respect to Xi. For the present sum/difference model all sensitivity coefficients have the value ±1.
3.5 Measurement uncertainty budget
The input/influence quantities are preferably summarized in a measurement uncertainty budget (Krystek, 2012). Table 6 below shows a general representation of a measurement uncertainty budget. In Table 7, an example measurement uncertainty budget in measurement of a digital pressure gauge is shown.
Table 6Measurement uncertainty budget in calibration of digital pressure gauges.
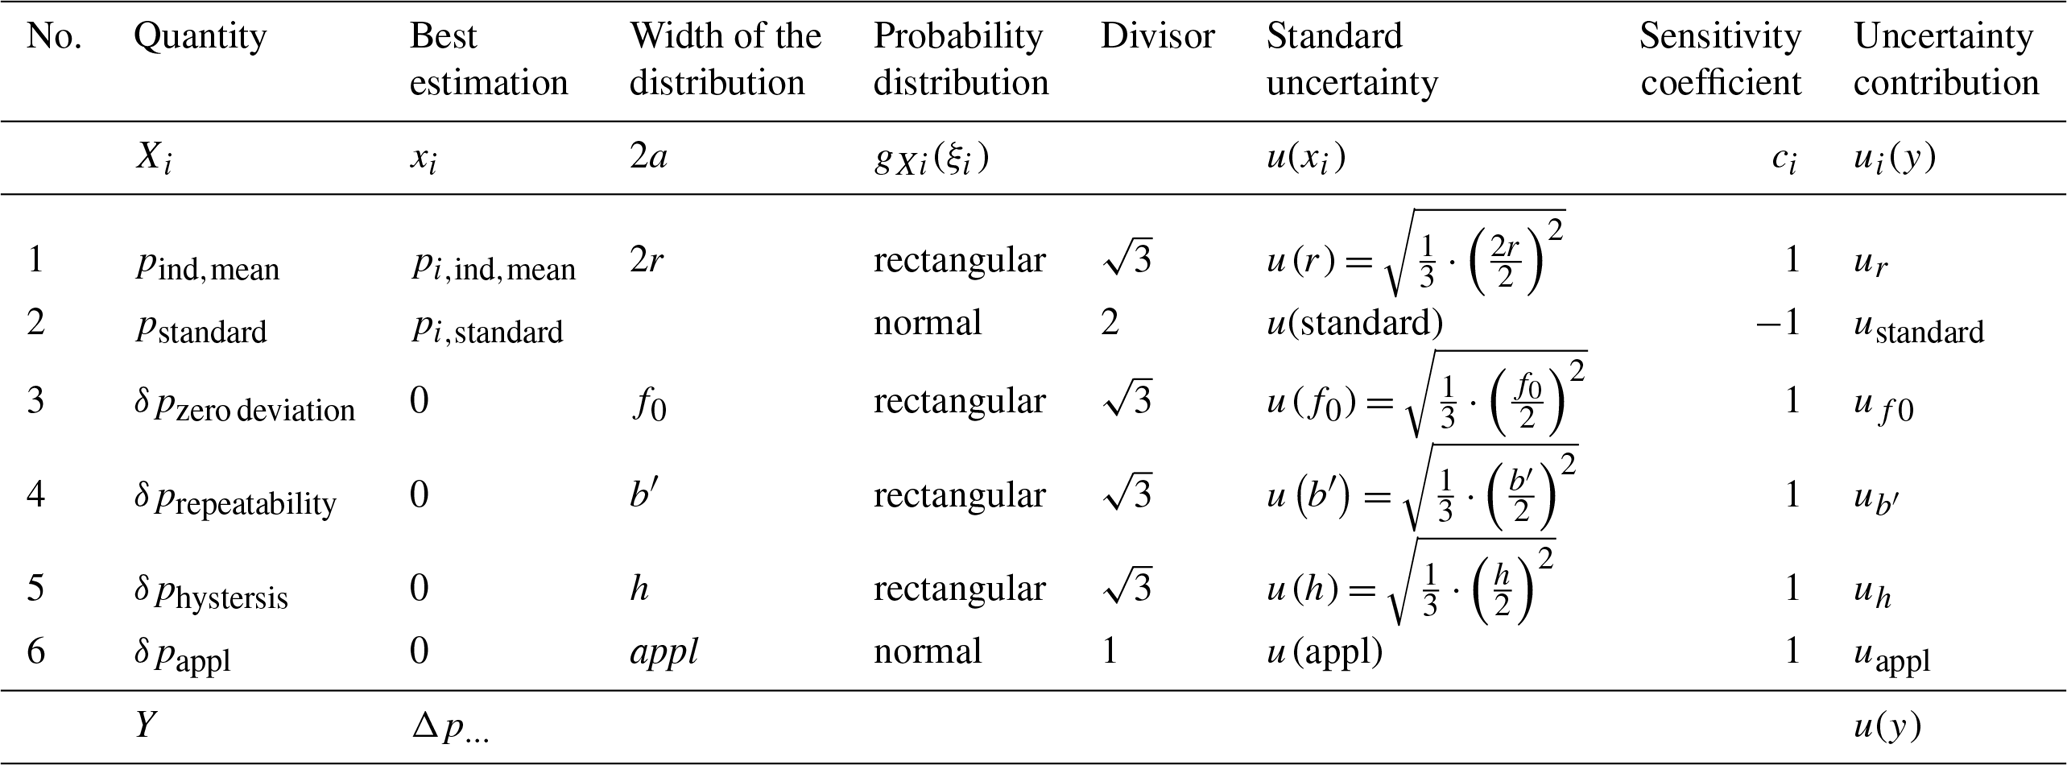
Table 7Example measurement uncertainty budget in measurement of digital pressure gauges, sequence A, measuring range 0 to 5 bar, pressure medium nitrogen.
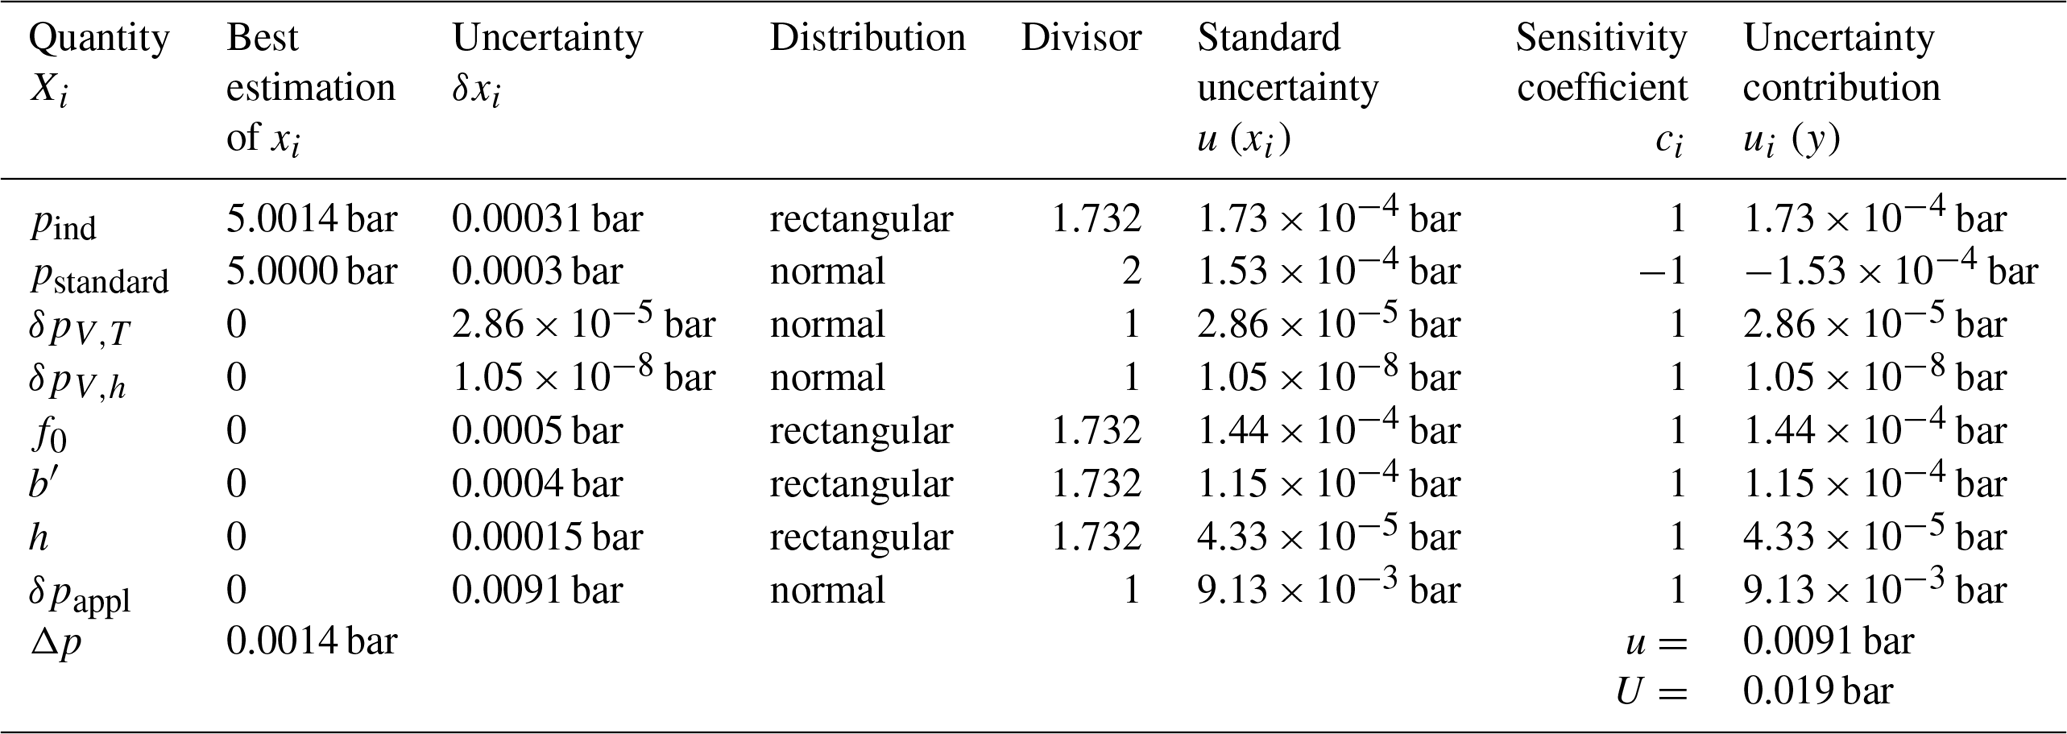
As a result of the uncertainty analysis or the measurement uncertainty budget, the complete measurement result of the digital pressure gauge is composed of the determined deviation of 0.0014 bar and the associated expanded measurement uncertainty of 0.019 bar (taking into account a coverage probability of approximately 95 %).
Limiting values derived from the practical experience of calibrating pressure gauges
According to guideline DKD-R 6-1 when calibrating pressure gauges, regardless of the result of the calibration, the measurement uncertainty is specified
-
for calibration according to sequence B not smaller than 0.04 % of the measurement span and
-
for calibration according to sequence C not smaller than 0.30 % of the measurement span.
These limiting values are taken into account when specifying the measurement uncertainties.
Application of smart sensor technologies and digitally networked measurement systems creates new challenges in terms of calibration and traceability. In industry, the number of sensors is increasing rapidly.
The challenge is to deal with this multitude of sensors that cannot be removed from the system, so that classical calibration is not possible.
In addition, correlation is a very important issue in this area and needs to be taken into account as it can significantly change uncertainty. Furthermore, the sensors may have a different or dynamic behaviour.
Therefore, new calibration and traceability strategies and calibration of these sensors and measurement systems are required.
A novel approach to solutions at lower hierarchy levels to ensure traceability is artificial intelligence, e.g. machine learning. Machine learning uses algorithms to analyse data, recognize patterns, learn from them, and then make a determination or prediction about something. Machine learning algorithms are capable of solving many every day or even very specific problems.
In practice, problems often arise when there are either too few data or when there are too many dimensions of the data.
Instead of manually coding software routines with a particular set of instructions to perform a particular task, the machine is “trained” with large amounts of data and algorithms so that it can learn how to perform the task.
There are various kinds of pressure gauges available for industrial pressure measurement. The calibration of these pressure gauges is carried out according to guideline DKD-R 6-1. This guideline specifies requirements for the calibration procedure as well as the calculation of the measurement uncertainty. For the measurement uncertainty determination, measurement uncertainty contributions of the used standard, the calibration procedure, the ambient conditions, the calibration object, and the examiner are included. These factors should be considered in the industrial application of pressure gauges as well, meaning it is important to know the repeatability or the hysteresis of a pressure gauge and to apply it in the practical measuring process. Additional uncertainty contributions due to the specific application of the industrial pressure measurement should be investigated and quantified. For these influences a sub-budget uappl was introduced with the main influence quantities. For the specific application the end user must investigate these sources or other additional influences.
Furthermore, when using piston gauges, the necessary influence quantities, such as temperature dependence of the piston–cylinder unit or the difference in altitude, have to be taken into account or be corrected.
Finally, an example measurement uncertainty budget is presented, which includes all investigated uncertainty contributions and reflects their influence on the expanded measurement uncertainty during a measurement.
In addition, the new challenges in terms of calibration and traceability when applying smart sensor technologies and digitally networked measurement systems were addressed. Machine learning is an industrial trend of these years and needs to be further developed.
The underlying measurement data are not publicly available and can be requested from the authors if required.
NS performed the uncertainty calculations and wrote the article. OSW advised, reviewed and recommended the corrections of the article.
The authors declare that they have no conflict of interest.
This paper was edited by Klaus-Dieter Sommer and reviewed by two anonymous referees.
DKD-R 6-1: Kalibrierung von Druckmessgeräten. Deutscher Kalibrierdienst (DKD) unter Schirmherrschaft der Physikalisch-Technischen Bundesanstalt (PTB), Ausgabe 03/2014, 2014.
EA-4/02 M: Evaluation of the Uncertainty of Measurement In Calibration, European Accreditation, September, 2013.
Heidenblut, S., Kessel, R., Sommer, K.-D., and Weckenmann, A.: Ein Modellbildungskonzept für die praxisgerechte Bestimmung der Messunsicherheit/A Modelling Concept for Practice-Oriented Evaluation of Measurement Uncertainty, Tech. Mess., 74, 494–506, 2007.
Industrielle Druck-Messtechnik Grundlagen und Praxis, ©2012 ABB Automation Products GmbH, BO/PRESSURE-DE REV. A 09, 2017.
ISO/IEC-Leitfaden 99:Internationales Wörterbuch der Metrologie, Grundlegende und allgemeine Begriffe und zugeordnete Benennungen (VIM), Beuth Verlag Berlin, 4, Auflage 2012, 2007.
JCGM 100: Evaluation of the measurement data – Guide to the expression of uncertainty in measurement (GUM), GUM 1995 with minor corrections, First edition 2008, Corrected version 2010, 2008.
Krystek, M.: Berechnung der Messunsicherheit, Grundlagen und Anleitung für die praktische Anwendung, Beuth Verlag, Berlin, ISBN 978-3-410-20932-4, 2012.
Sommer, K.-D., Siebert, B. R. L., and Weckenmann, A.: Ansatz zur systematischen Modellbildung für die Messunsicherheitsanalyse, in: Beiträge zum Experten-Seminar Neue Entwicklungen in der Messunsicherheitsanalyse, VDI/VDE-Gesellschaft für Mess- und Automatisierungstechnik GMA, 2006.
WIKA-Handbuch: Druck- und Temperaturmeßtechnik, WIKA Alexander Wiegand GmbH & Co., ISBN 3-9804074-0-3, 1995.