the Creative Commons Attribution 4.0 License.
the Creative Commons Attribution 4.0 License.
 | 30 Jan 2020
A novel non-invasive, non-conductive method for measuring respiration
Jan Ringkamp
Philipp Radler
Philipp Lebhardt
Jens Langejürgen
We present a novel method for measuring dynamic changes in respiration parameters due to breathing based on the coupling of two ultra-high-frequency (UHF) antennae. For evaluation, we built a dynamic 3-D printed phantom encasing two compartments separated by an elastic diaphragm. By filling this artificial lung with air the effective permittivity in the compartment changes, resulting in a significant variation of the S21 parameter's magnitude and phase. We show that there is a strong linear correlation between the volume of air in the artificial lung and the magnitude (in dB) of the S21 parameter (R2=0.997) as well as the parameter's phase (R2=0.975). Our sensor system shows a high reproducibility (standard deviation of predicted volume =0.67 mL) and a timing similar to a conventional flow sensor (delay =5.33 ms). The presented method is a promising candidate to overcome some of the most important technical burdens of measuring respiratory parameters and might be used as a trigger for patient–ventilator synchronization in infants and neonates.
- Article
(3028 KB) - Full-text XML
- BibTeX
- EndNote


Respiratory parameters like breathing rate, tidal volume, or inhalation onset are among the most crucial parameters in intensive care. Medical respirators need current values to adjust timing and flow rates in order to ensure an optimal and protecting ventilation of the lung. This is especially important when it comes to the ventilation of infants or neonates. Here, low tidal volumes (as low as 3 mL), the comparably higher breathing rate, and the sensitive skin hamper precise measurement and control of respiratory parameters. Also, in the ventilation of premature infants it is common practice to use uncuffed endotracheal tubes to prevent the development of ventilator-induced lung injury, like volu- or barotrauma (Mahmoud et al., 2015). This poses an additional challenge for respiration sensors, because the unknown leakage due to the uncuffed endotracheal tube makes simple pressure and airflow measurement highly unreliable.
A promising alternative approach is the use of sensors based on an electrical and electromagnetical measurement, because they are leakage independent, and several embodiments can measure without direct contact, preventing damage to the infant's sensitive skin.
Uesawa et al. (2018) use an electromyogram to detect muscle activity necessary for diaphragm movement (Uesawa et al., 2018). Uesawa et al. (2018) placed an infant on a mattress with integrated sheet-type electrodes. The electrodes function as capacitor plates deriving an electrocardiogram and an electromyogram (EMG). The sensing electrodes were connected to a boost-trap buffer to provide a high-impedance input leading to high sensitivity. The EMG signal of Uesawa et al. (2018) was closely correlated (r=0.96) to the readings of a commercially available belt transducer.
A different approach used in several works involves using the patient as the dielectric medium of a plate capacitor.
Teichmann et al. (2013) presented a sensor where they used the detuning of a Colpitts oscillator to measure the respiration (Teichmann et al., 2013). Teichman et al. (2013) described two different systems. The first system uses a coil as sensing element. Therefore, the patient's respiration changes the inductances of the oscillator by inductive coupling. The second system uses two capacitor plates as sensing elements. In this case, the patient's respiration changes the permittivity between the plates, therefore changing the capacitance and detuning the oscillator. A similar system is described by Kundu et al. (2013). Kundu et al. (2013) use two capacitor plates as well, whereas the plates are made of a conductive textile and integrated in a T-shirt. Both systems come with the disadvantage of omnidirectional sensing, especially in the approach of Teichmann et al. (2013).
Because the capacitor plates are mounted in the same plane in the approach of Teichmann et al. (2013), there is no distinction between an object in front of or behind the plates. Kundu et al. (2013) partly overcome this issue by placing the patient between the capacitor plates. Still, in the approach of Kundu et al. (2013) a body with high permittivity, e.g. an arm, forms a parasitic capacitance to ground and disturbs the respiration measurement. Also, Teichmann et al. (2013) and Kundu et al. (2013) target applications for adult patients, whereas our work emphasizes applications for infants and neonates.
In this paper, we present a new kind of sensor system in the class of electromagnetic respiration sensors by using two coupled antennae as sensor element. With this approach, we can measure respiration parameters without electrically conducting contact and we can tailor the field of view of the sensor by choosing the antenna's radiation pattern. However, in this paper we only investigate the feasibility of a coupled antenna pair as sensing element under ideal conditions. Future works will address the radiation pattern to form a well-defined region of interest.
The theory of operation of our sensor system is based on the change of the thoracic electrical parameters while breathing. Several works exist which investigate the electrical properties of various tissues over a wide frequency range (see Hahn et al., 1980; C. Gabriel et al., 1996; S. Gabriel et al., 1996). The difference in permittivity of inflated and deflated lungs are of special interest to our work.
Pulmonary tissue has a significantly higher permittivity than air (see S. Gabriel et al., 1996). During inhalation, the high-permittivity pulmonary tissue is flooded with air, significantly decreasing the lung's overall permittivity (see Hahn et al., 1980, for data on porcine lungs).
As mentioned earlier, we used a coupled antenna pair as sensor element. This means the impedance of the first antenna is not only dependent on its self-impedance but also on the impedance of the second antenna; both antennae are linked by a mutual impedance Z12 (King, 1943), where the mutual impedance Z12 is the open-circuit voltage across the terminals of antenna one, caused by the excitation current through antenna two; thus (Jordan and Balmain, 1968). The coupling of two antennae depends on their distance, where two antennae far from each other can be considered loosely coupled (King, 1943). The mutual impedance Z12 of two small electric dipoles of the same length can be modelled in the following way (Wheeler, 1959):
where l is the dipole length, r the distance between the dipoles and R0 the wave resistance in free space.
From Eq. (1) an equivalent circuit consisting of a capacitor, a resistor and an inductor can be derived to model the mutual impedance Z12 (Wheeler, 1959), where the capacitor dominates in the antenna's near field and the inductor in the antenna's far field (Wheeler, 1959). Due to our intention to detect changes of permittivity, it is obvious from the equivalent circuit of the mutual impedance that the antennae should be brought close together and should operate in or close to their respective near fields.
As sensor elements, we used two identical UHF antennae (Molex 105262-0002). The antennae have a transmission band starting at 863 MHz, specified by the manufacturer. The antenna is a slightly meandered dipole with a physical length of 79 mm and a width of 10 mm. The direct measurement of voltage and currents faces practical problems at microwave frequencies due to dependence on the magnitude and phase of an electromagnetic wave (Pozar, 1998). Therefore, we did not determine the mutual impedance but measured scattering parameters using a vector network analyser to facilitate the set-up. In contrast to impedance, which is a ratio of voltage to a current, the scattering parameters are the ratio of outgoing and incident waves at various ports of an electrical network (Pozar, 1998). We measured the scattering parameter S21, which in our case is the ratio of the wave received through the second antenna to the wave sent into the first antenna, and the scattering parameter S11, which is the ratio of the wave reflected by the first antenna to the wave sent into the first antenna. The S21 describes the transmission between the two antennae, whereas the S11 parameter can be used to characterize a single antenna. The measured frequency range was 700 to 1200 MHz with a step size of 100 kHz.
As a model for an infant's lung, we fabricated a plastic phantom by 3-D printing. We printed two compartments using a Form 2 3-D printer with clear resin from Formlabs Inc. The outer dimensions of the phantom are mm3 with a wall thickness of 2.4 mm.
An elastic diaphragm separates the two compartments. The lower compartment contains water to simulate the electrical properties of an infant's thoracic tissue and a single balloon. The balloon can be inflated and the expansion pushes the water into the upper compartment by dilating the diaphragm. The upper compartment contains air and in conjunction with the diaphragm serves as the model for the infant's lung. Hence, a dilated diaphragm models an exhaled state of the lung and a diminished diaphragm an inhaled state; see Fig. 1. We assume that the increase in volume of the balloon is equivalent to the decrease in air volume in the upper compartment. The antennae were attached to the sides of the upper compartment to simulate the direct placement of the antennae lateral on a patient's thorax.
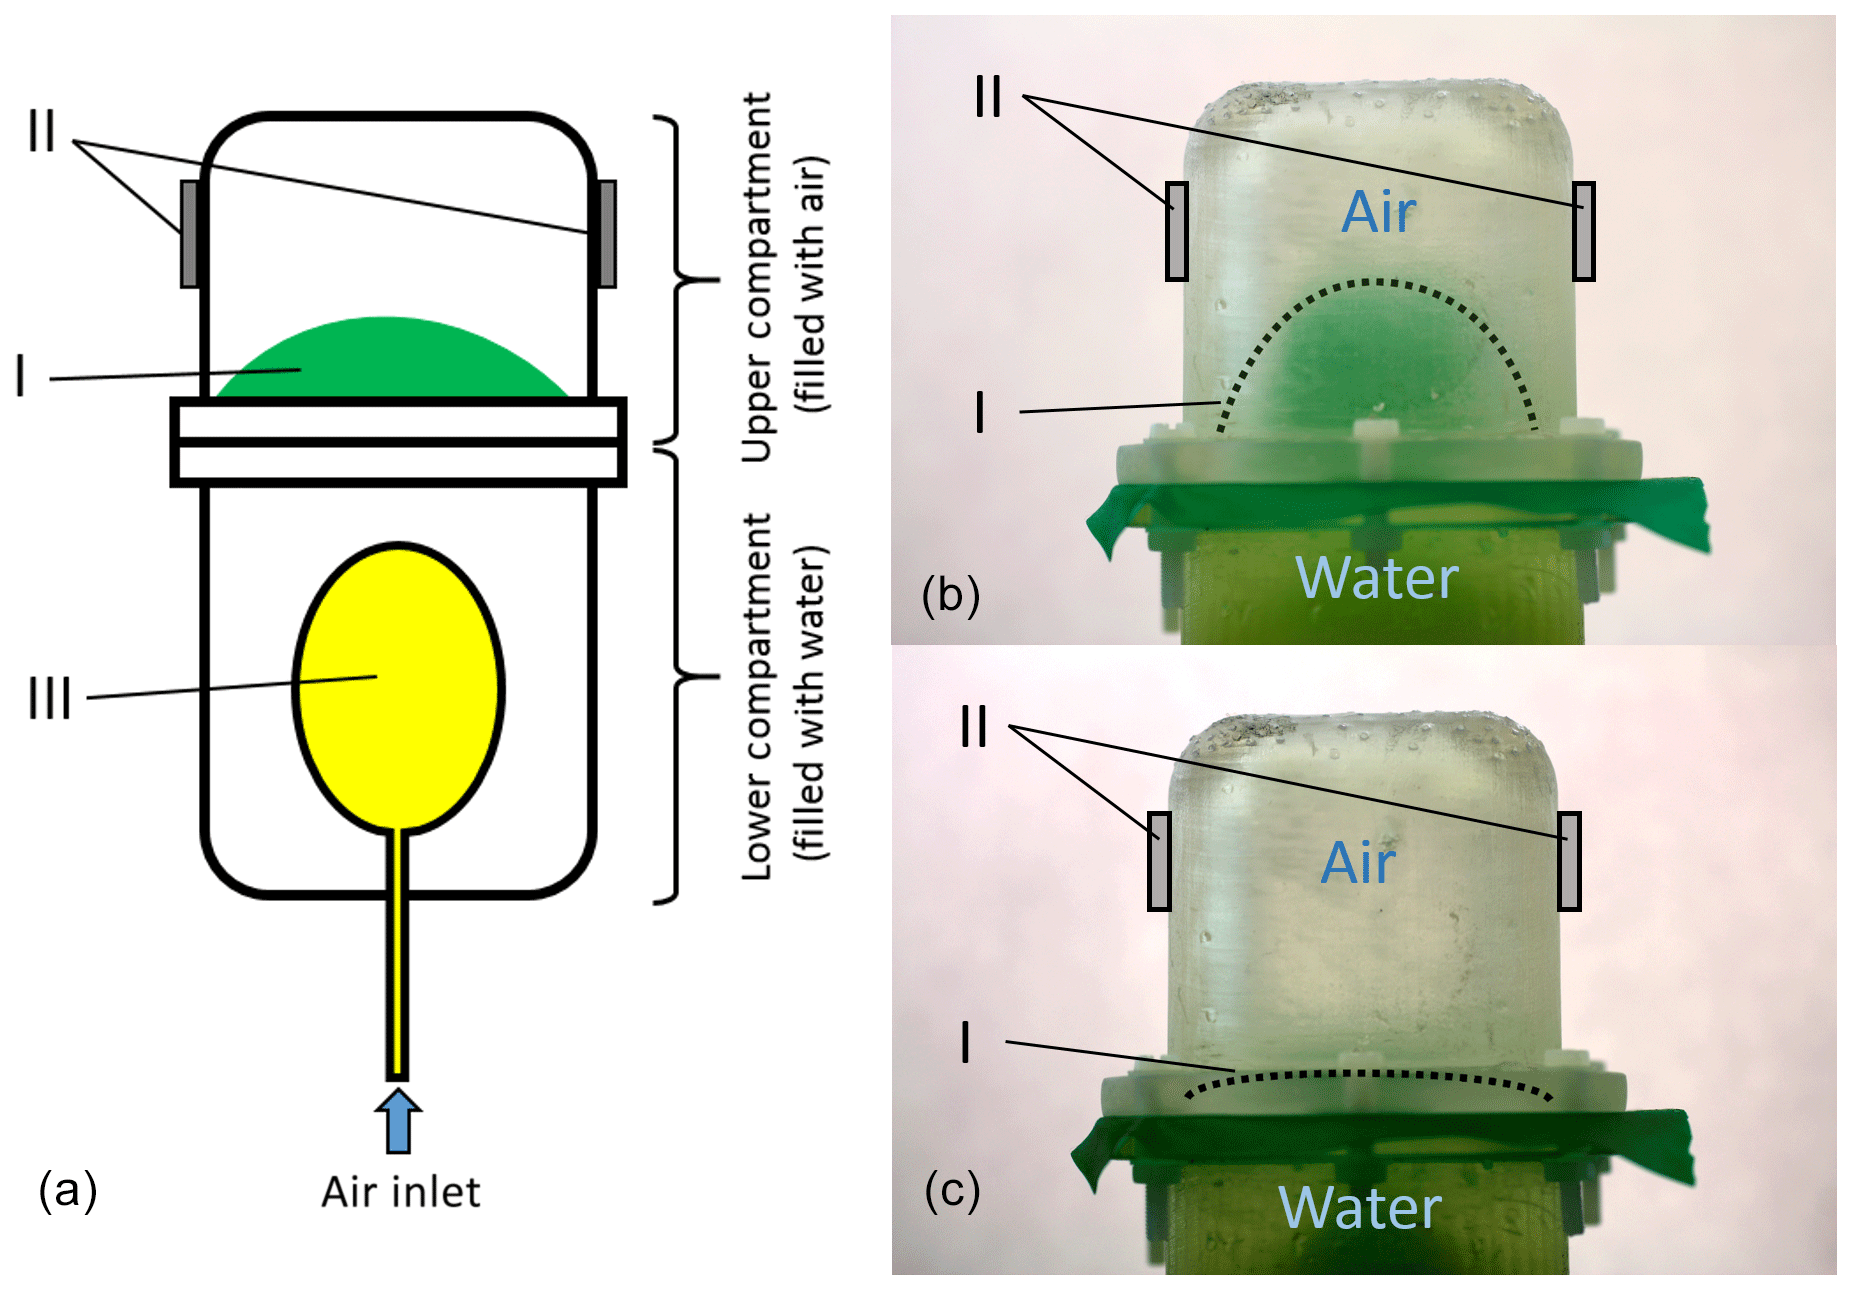
Figure 1A technical drawing of the used lung phantom is shown in panel (a). The lung phantom consists of two compartments. The lower compartment is filled with water and contains a balloon (III). By inflating the balloon, the water is pushed in the upper compartment and an elastic diaphragm (I) between the two compartments dilates. This case is shown in panel (b). This models an exhaled state of the lung. By deflating the balloon, the diaphragm contracts. This models an inhaled state and is shown in panel (c). The grey blocks (II) indicate the position at which the antennae were placed.
For the characterization of the sensor system, the balloon was inflated using a 20 mL syringe held by two clamps mounted on a rod. The second clamp holding the syringe's piston was movable and was used to inflate the balloon with up to 20 mL in 1 mL steps.
For evaluating the reproducibility and timing of the sensor system, a medical ventilator replaced the syringe. An additional flow sensor (Sensirion SFM3000) was added as reference signal. The medical ventilator was in CPAP (continuous positive airway pressure) mode. The breathing rate was set to 15 breaths per minute with 2 s inhalation and 2 s exhalation. The inspiratory pressure was increased from 5 to 40 cm H2O in 5 cm H2O steps. After reaching the peak inspiratory pressure of 40 cm H2O, the pressure was decreased in 5 cm H2O steps back to an inspiratory pressure of 5 cm H2O. The pressure ramp was set to the steepest setting.
4.1 Characterization in free space
Before we investigated the effect of the lung volume on the antenna pair, we conducted a series of experiments to characterize the antennae in free space. Here, the emphasis was to evaluate the effect of the coupling between the two antennae in free space. The results are shown in Fig. 2. We characterized each antenna by measuring the S11 parameter of each antenna without the other antenna in its vicinity. In this case, the antennae can be considered loosely coupled or uncoupled. The two resonances of each transmission band were clearly visible in the S11 parameter. The two resonances were slightly higher than the centre frequencies stated by the manufacturer, probably due to different mounting conditions in our set-up. Afterwards, both antennae were placed in close vicinity to each other. In this case, the antennae are coupled. Due to the coupling the resonances in S11 of the first antenna shifted to slightly lower frequencies. In particular, the high-frequency resonance became much more prominent by shifting roughly 10 dB lower. The S21 parameter showed a 3 dB frequency range from 910 to 1000 MHz, further called passband.
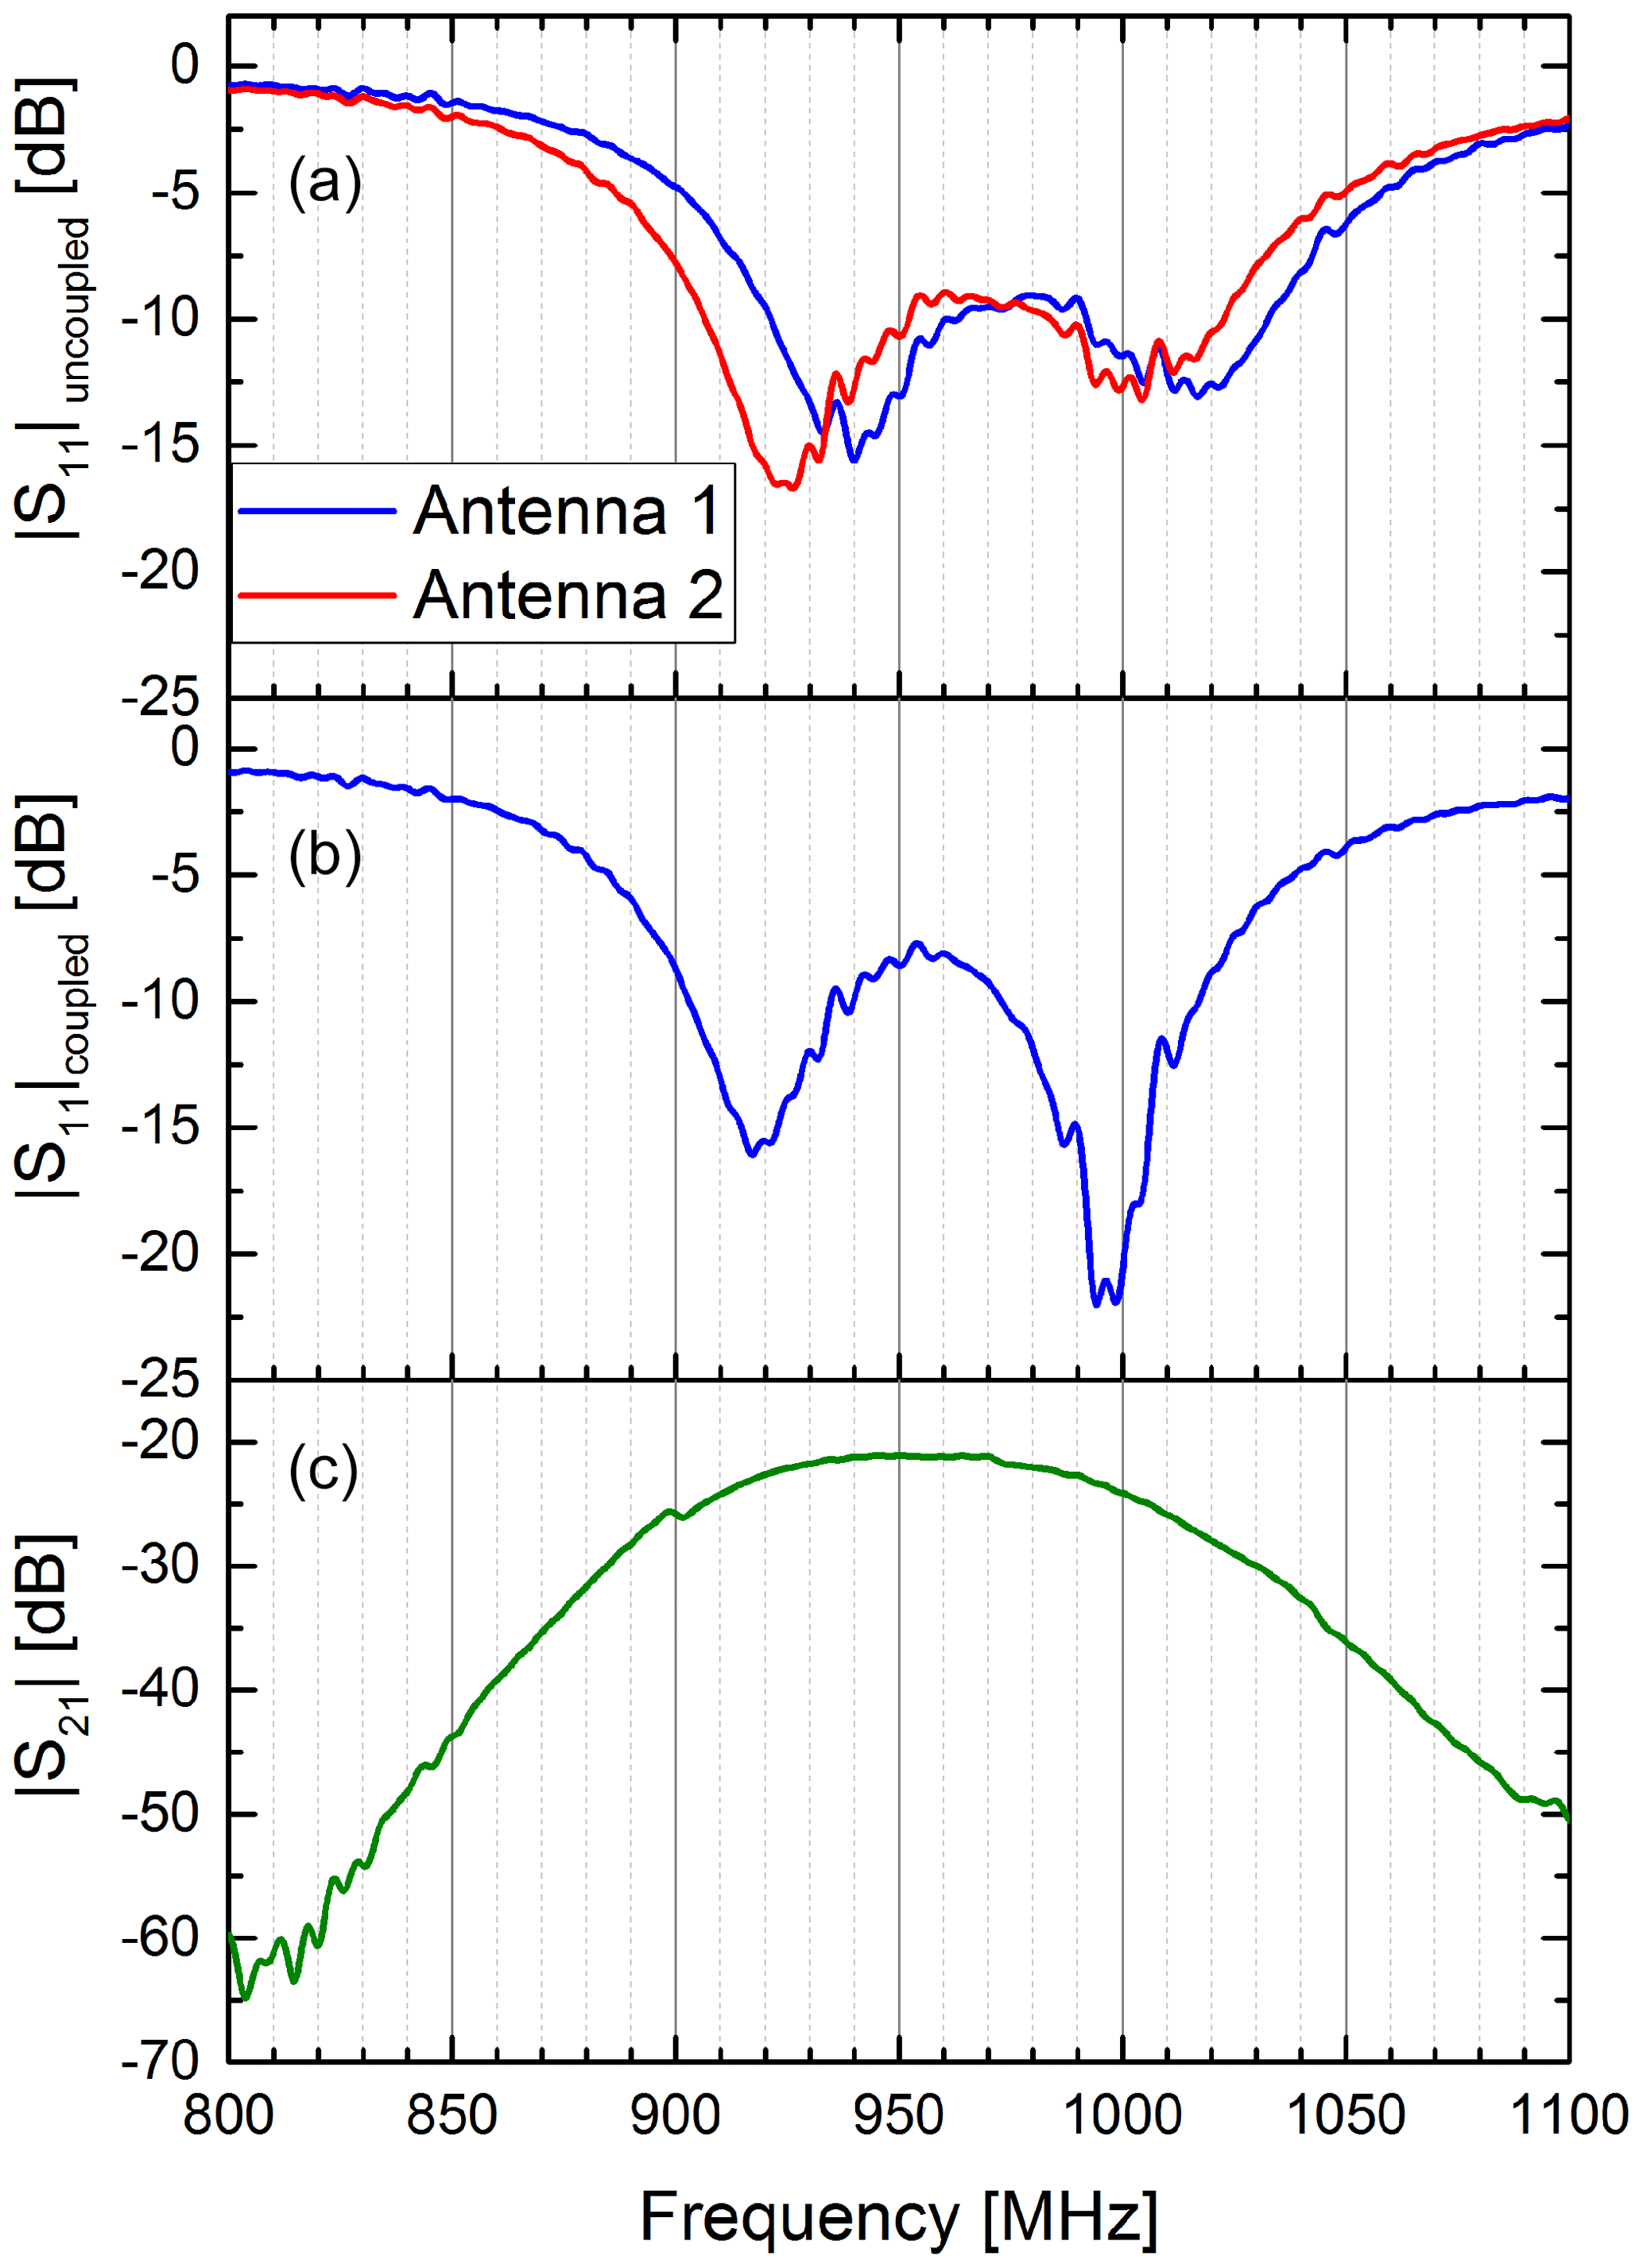
Figure 2Coupling of two antennae in free space. The upper diagram (a) shows the S11 parameter of the two antennae without the other antenna in its vicinity. In this case both antennae are uncoupled. Clearly visible are the two resonance frequencies for the antenna's two transmission bands between 900 and 1050 MHz. The middle diagram (b) shows the S11 parameter of the first antenna, when the second antenna is in its close vicinity. In this case, both antennae are closely coupled. It can be seen that the resonance frequencies of the first antenna shifts to slightly lower frequencies compared to the uncoupled case. Also, the higher frequency resonance becomes much more prominent by shifting roughly 10 dB down. The lower diagram (c) shows the S21 parameter of the coupled antenna pair.
4.2 Characterization in set-up
As expected, we observed that the initial free-field resonance frequency of the antennae changed and became narrower when both antennae were brought in close contact with the phantom due to the water body's high permittivity. For the characterization of the sensor sensitivity, we used the set-up with syringe to push water in the phantom's upper compartment. We determined complex S21 parameters for different volumes. In Fig. 3 the magnitude of S21 is shown for three exemplary volumes. It is visible that the magnitude is decreasing at higher frequencies with increasing water content in the upper compartment. In addition, the maximum of the passband shifted to slightly lower frequencies with an increase in permittivity, probably due to a further detuning of the antenna pair. We picked a frequency close to the higher passband edge (see dotted line in Fig. 3) to evaluate the dependency of the magnitude on the permittivity change. A significant correlation between the S21 magnitude and the volume in the upper compartment can be observed in Fig. 4.
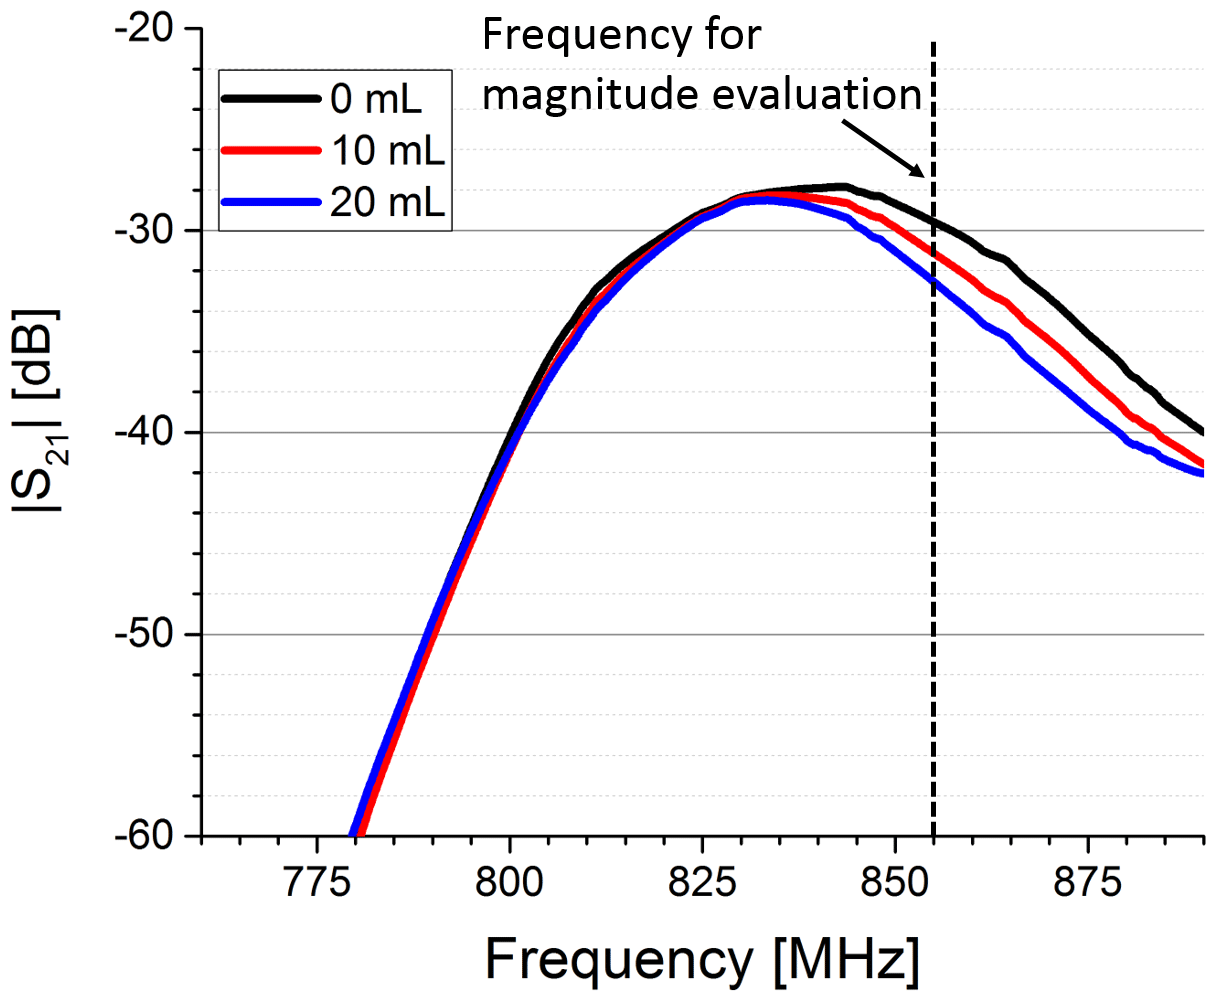
Figure 3Magnitude of the S21 parameter for three different water volumes pushed in the upper compartment. Clearly visible is the decrease in the magnitude in the higher-frequency part of the transmission band, when the water volume is increased. The magnitude was evaluated at a fixed frequency (dotted line).
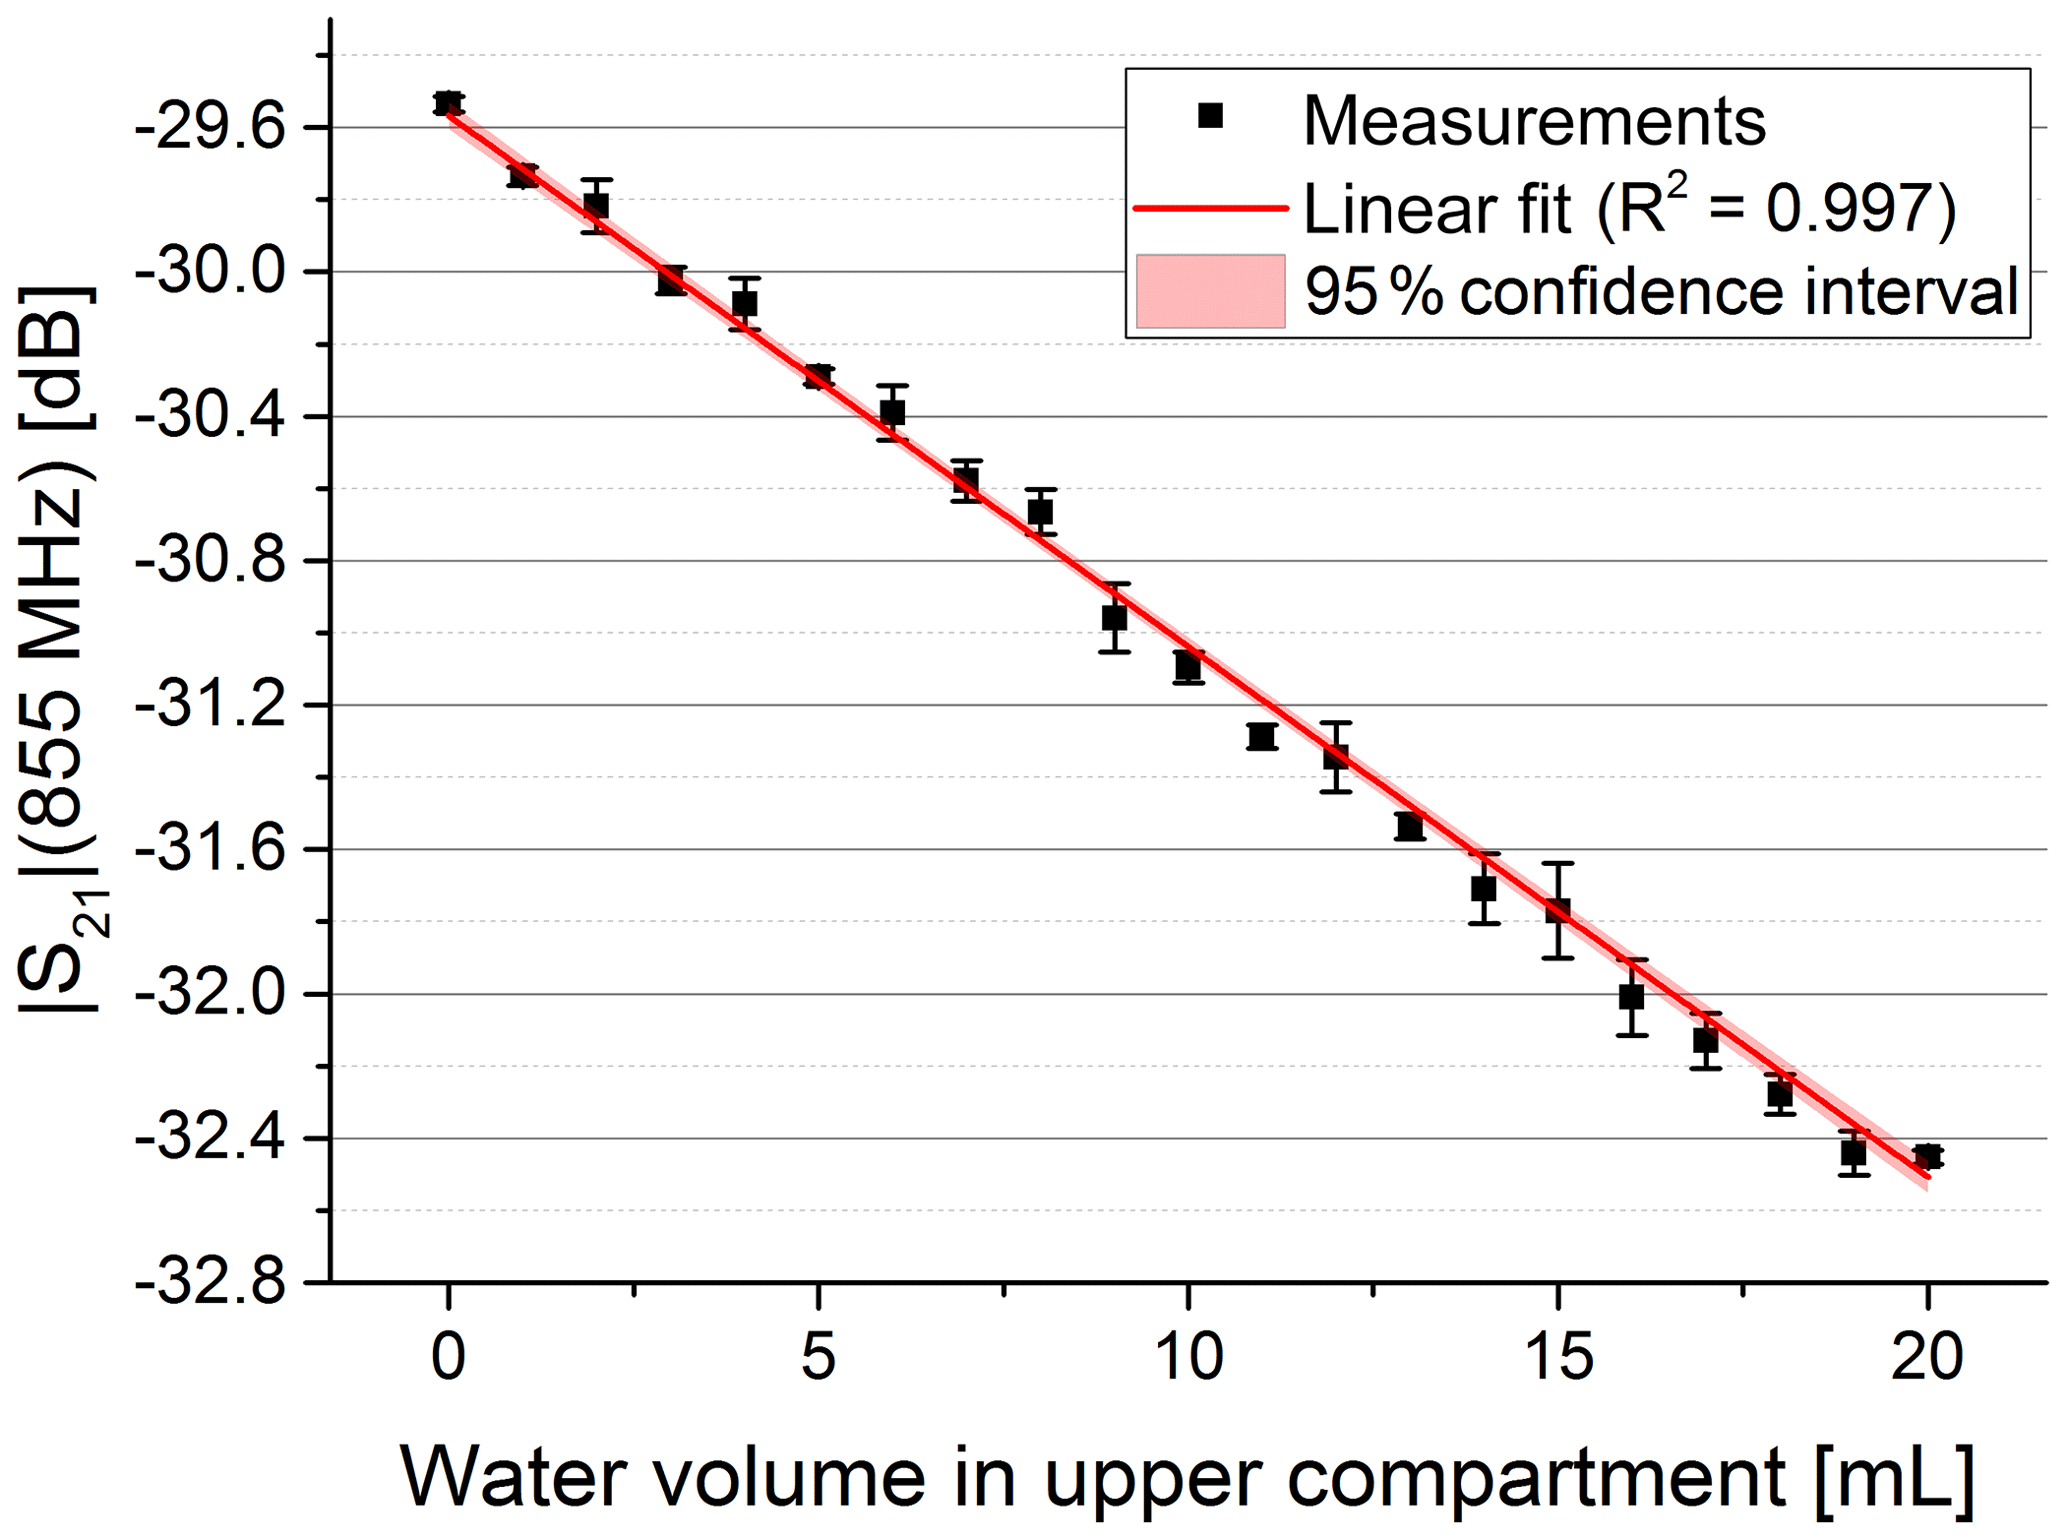
Figure 4Magnitude at constant frequency vs. water volume pushed in the upper compartment. The data were fitted with a linear fit (red curve) yielding R2=0.997.
In Fig. 5 the phase of S21 is shown for three exemplary volumes. We used the frequency of the maximum magnitude without water in the upper compartment to evaluate the phase for varying water volumes at a constant frequency (see dotted line in Fig. 5). Figure 6 shows the phase over the whole volume range.

Figure 5Phase response of the S21 parameter for three different water volumes pushed in the upper compartment. The increase in permittivity by pushing water in the upper compartment significantly decreases the overall phase in the observed frequency range. The phase was evaluated at a fixed frequency (dotted line).
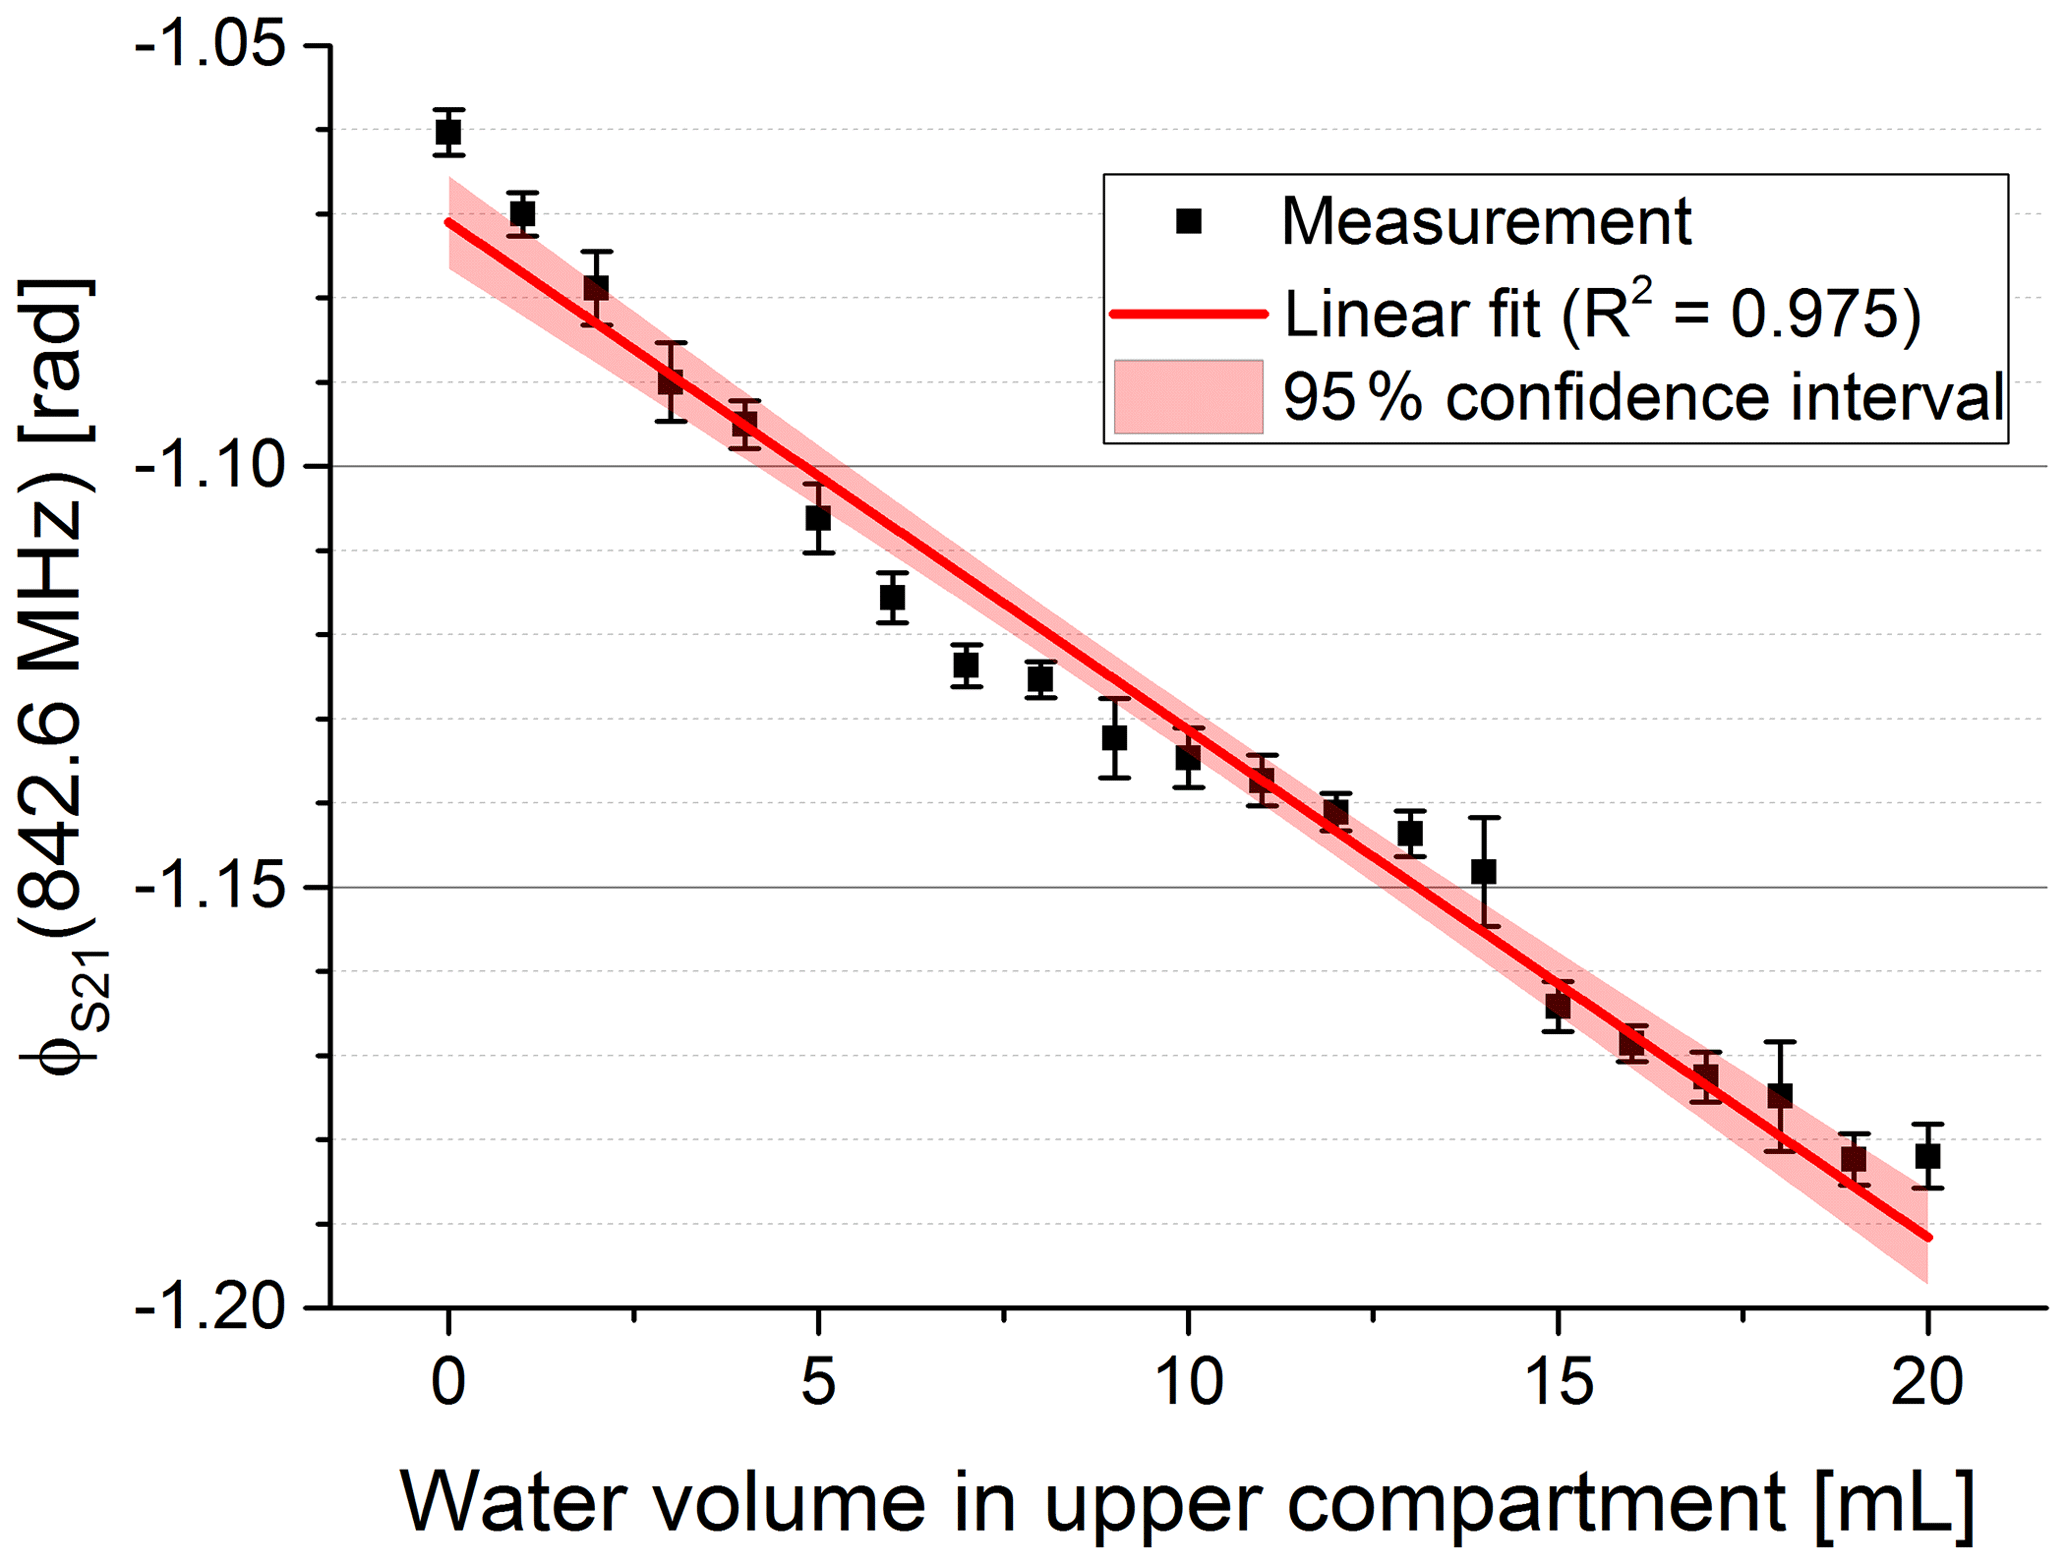
Figure 6Phase at constant frequency vs. water volume pushed in the upper compartment. The data were fitted with a linear fit (red curve) yielding R2=0.975.
4.3 Reproducibility and timing
In our early trials the phase was less sensitive on varying the evaluation frequency than the amplitude even though its characteristic was less linear. This can especially be seen in the almost parallel lines in Fig. 5. Therefore, we only considered the phase for further evaluation. The syringe in our test set-up was replaced by a medical ventilator to evaluate the reproducibility and timing of our sensor system. The phase shift between expiratory and inspiratory state of our sensor signal was calculated for each breath applied by the medical ventilator. Overall, 141 breaths were applied with different pressure settings and the phase shift was automatically calculated. The reproducibility measurements yielded a standard deviation of 3.35 mrad across the whole data set.
To assess the timing of our sensor system we compared our sensor signal to the flow sensor. An excerpt is shown in Fig. 7. Both signals show a similar rate. However, the shape of both signals is significantly different. This is because a shift in phase is a steady function of the air volume within the upper compartment while the flow is a function of the change in air volume over this.
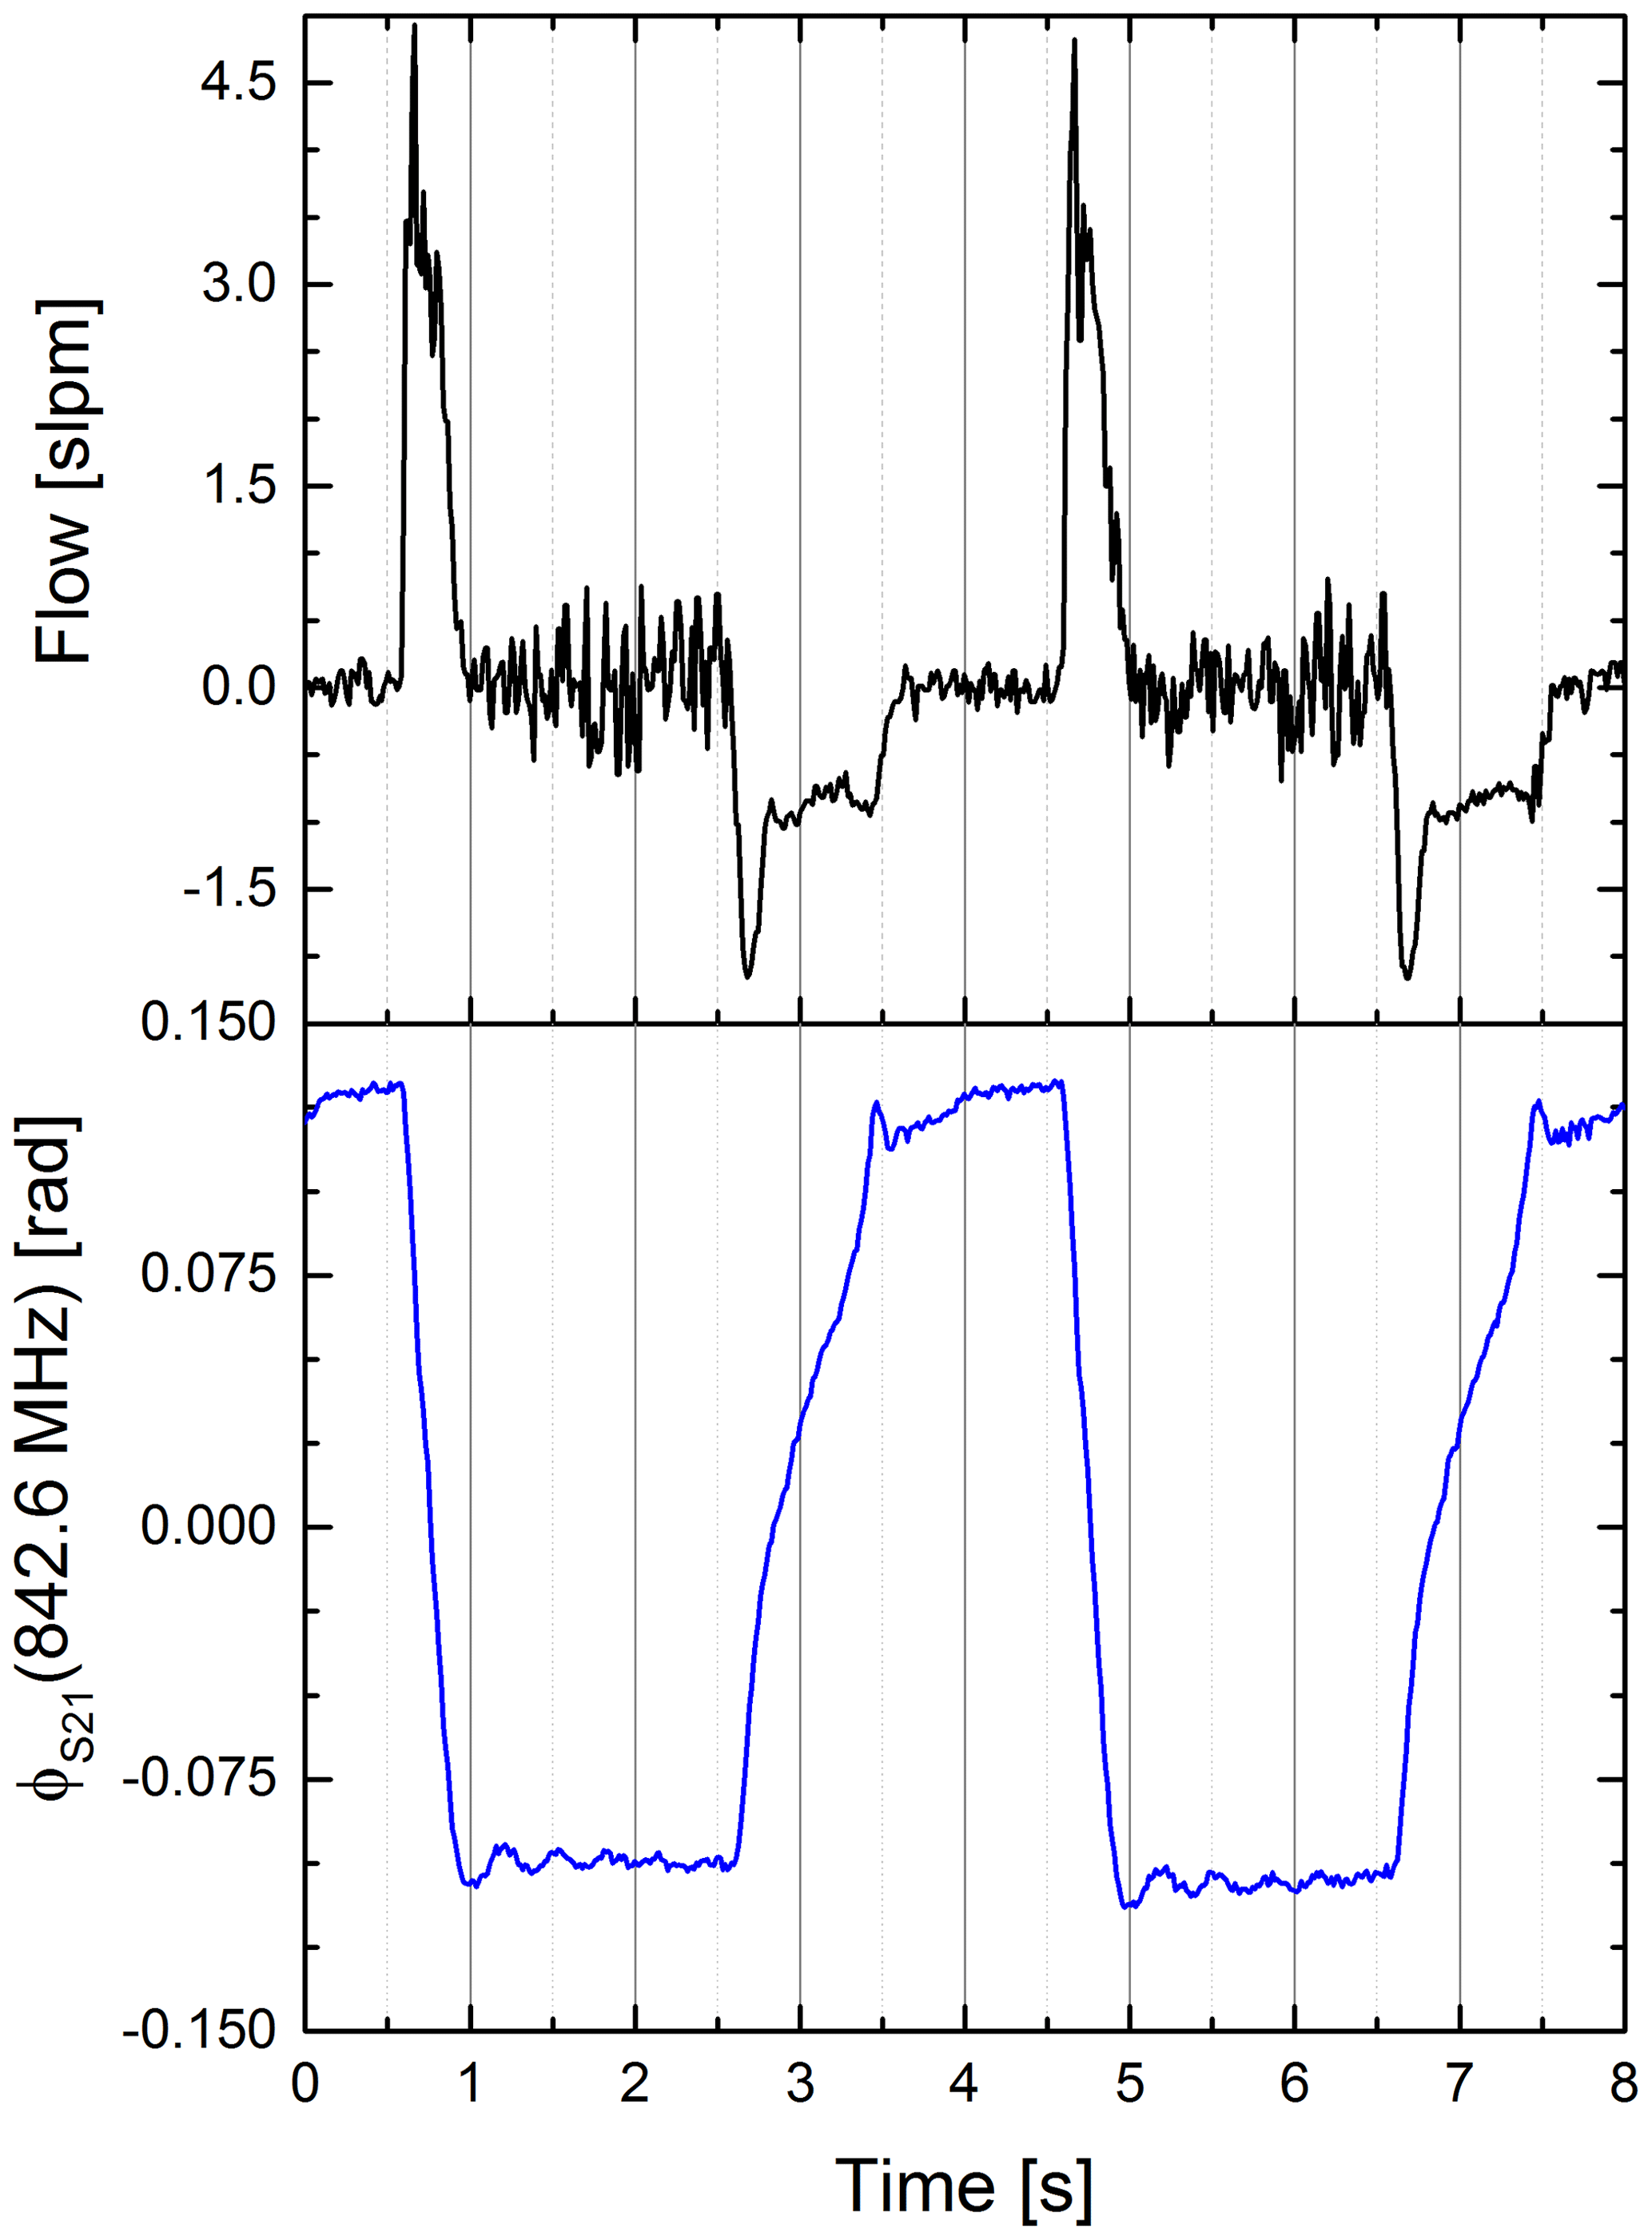
Figure 7Airflow (black) and phase of the S21 parameter at a fixed frequency (blue) vs. time. Clearly visible is the differing signal shape (Pearson coefficient ). We assume the difference is caused by different proportionalities. The S21 is proportional to the water volume in the upper compartment, whereas the flow is proportional to the change of air in the lower compartment. Also visible is the synchrony of the signals.
We used the differential quotient of our sensor signal to emphasize the edges of the signal; see Fig. 8. The cross-correlation was used to determine the delay between the two signals. The sample rate of our system is roughly 75 Hz, leading to a mean time between samples of 13.33 ms. We linearly interpolated between samples to artificially decrease the time between samples and therefore get a more accurate assumption about the delay. The cross-correlation yielded a delay of 5.33 ms of our sensor signal to the conventional flow sensor.
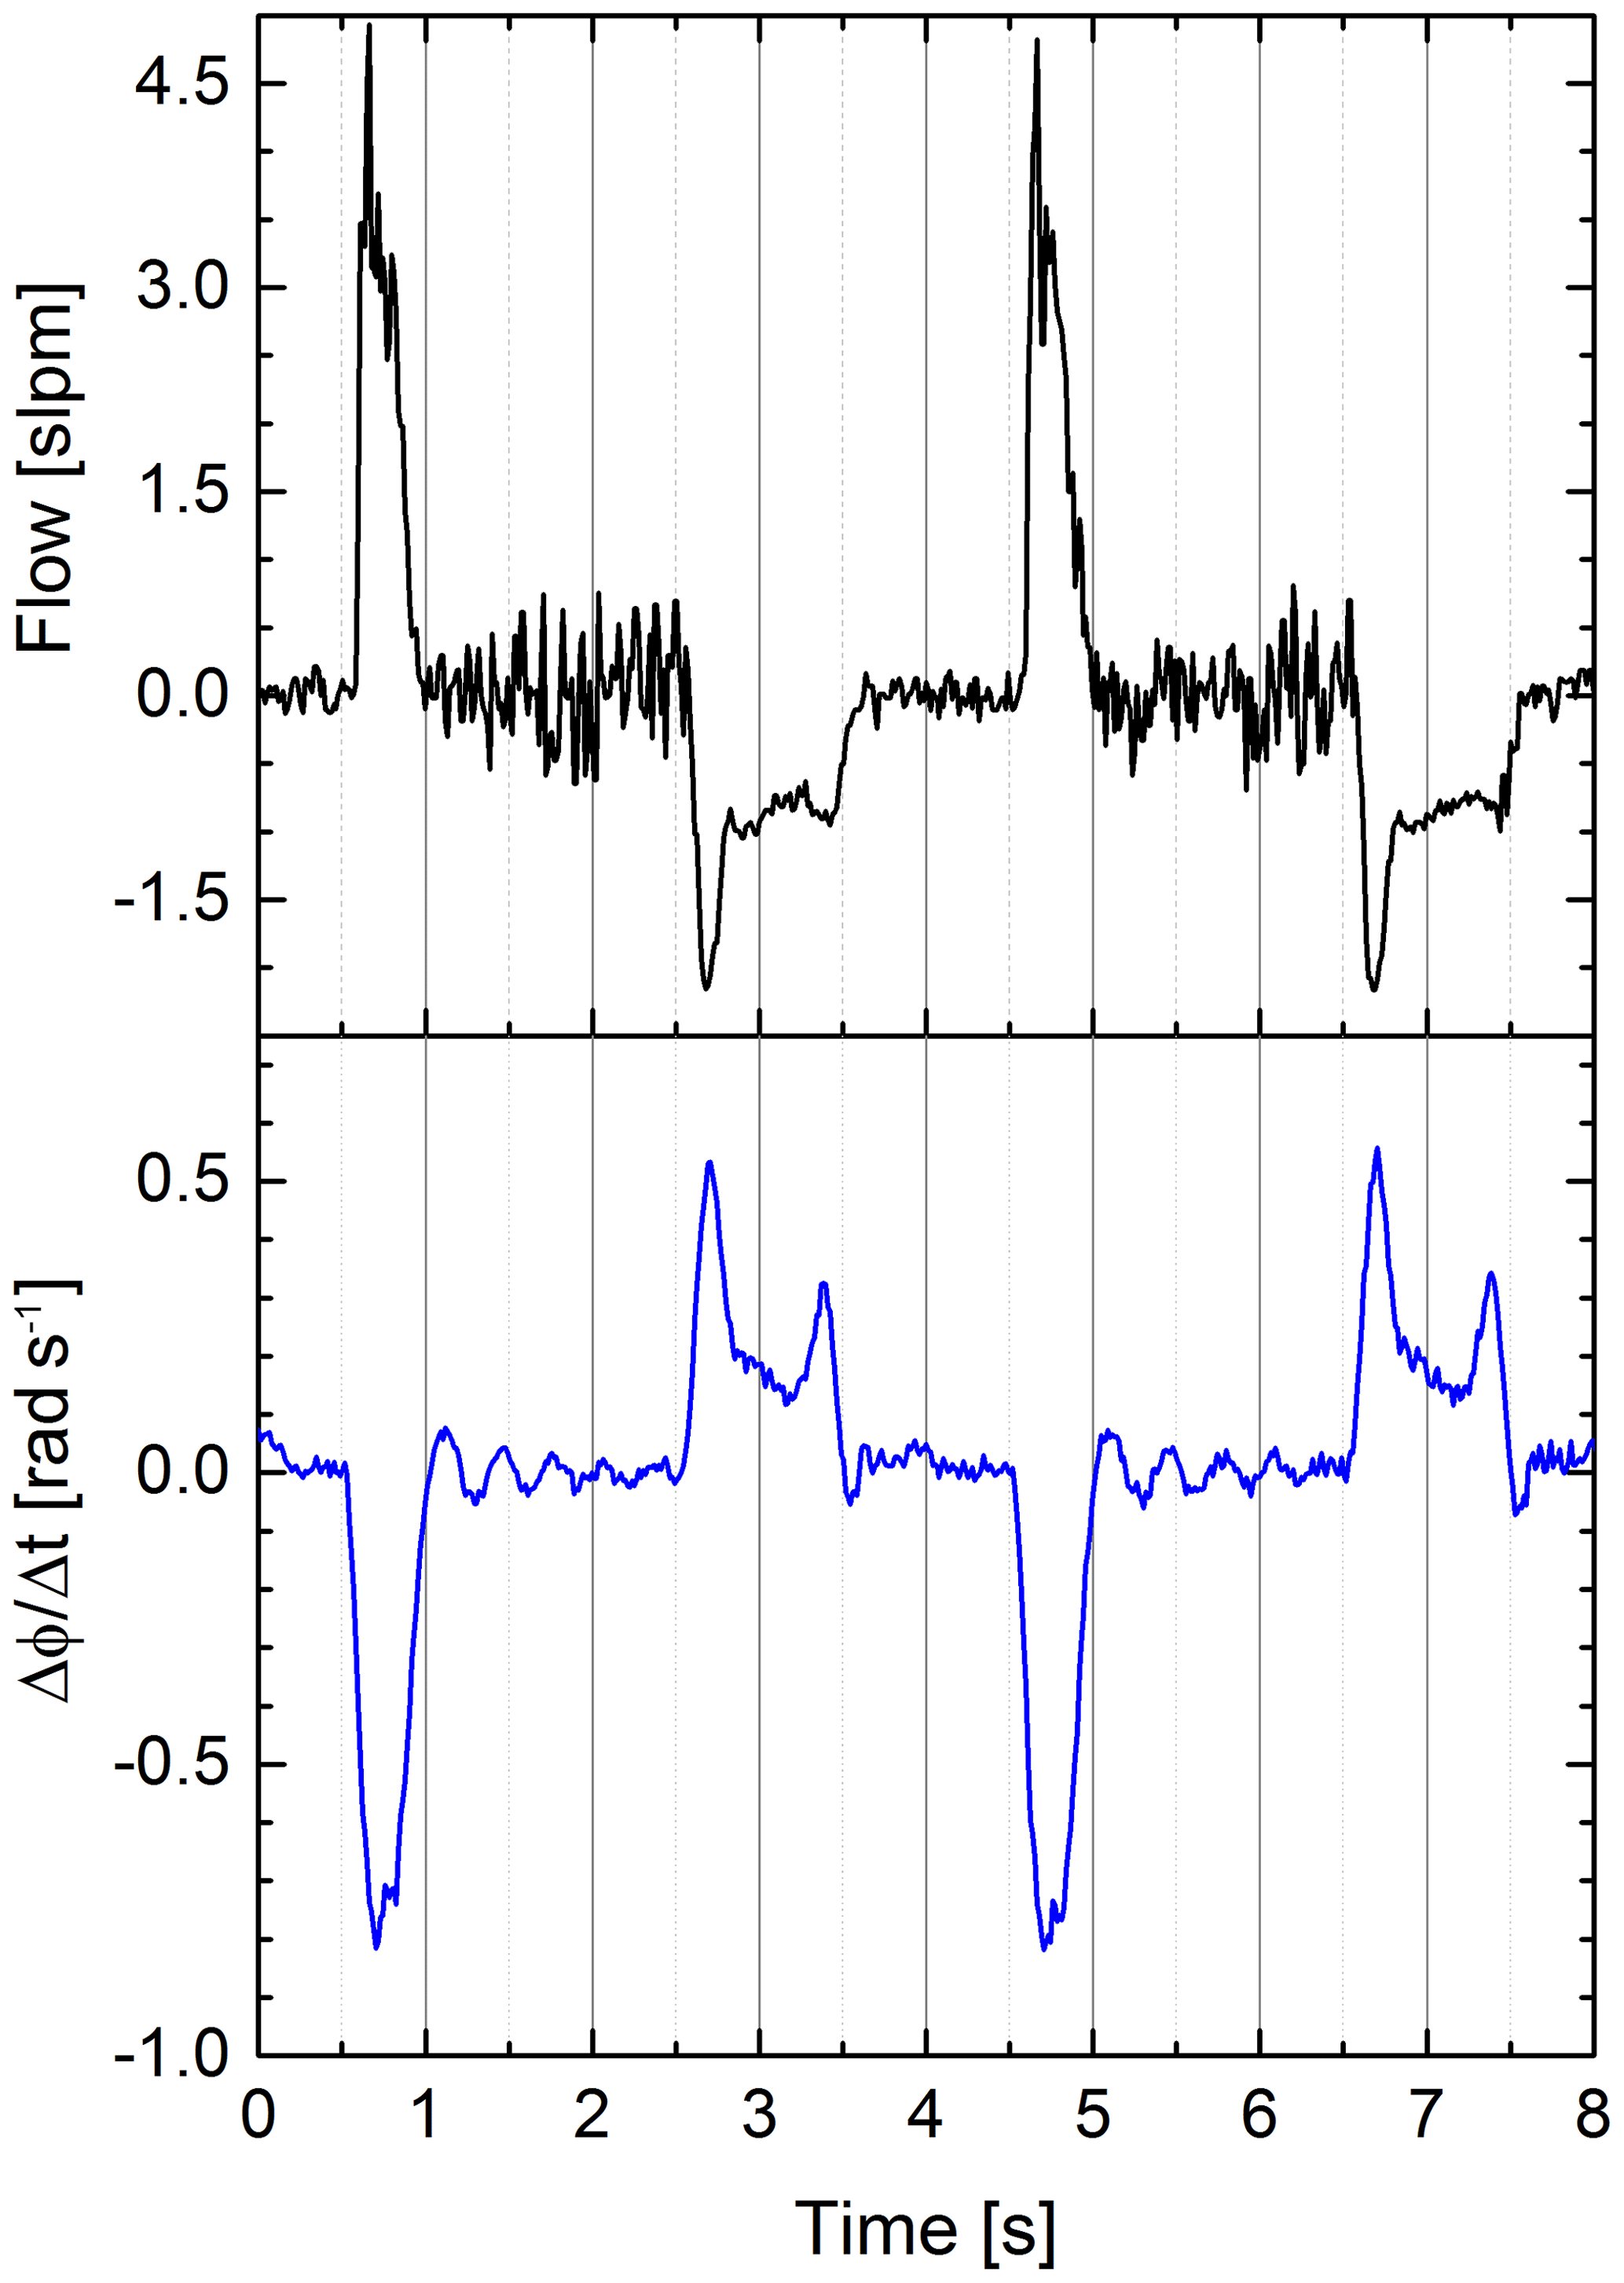
Figure 8Airflow (black) and differential quotient of the S21 parameter's phase at a fixed frequency (blue) vs. time. The differential quotient is clearly more similar to the flow (Pearson coefficient ) than the original phase signal (Pearson coefficient ), because both signals are proportional to a volume change. A swinging motion of the balloon causes the slight ringing on the differential quotient after “exhalation” (see signal between second 1 and 2 or between second 5 and 6).
We fitted the characterization data, shown in Figs. 4 and 6, linearly to evaluate our results. The linear fits are shown in the figures as red lines.
The linear fit of the magnitude versus the water volume showed a coefficient of determination of 0.997 (see Fig. 4). It also yielded a sensitivity of −0.14 dB mL−1. Considering the sensor signal's root-mean-square error of 0.025 dB, this leads to a root-mean-square error of 178 µL in volume. The high linear dependence in decibels, however, leads to an exponential characteristic when considering the amplitude of the receive signal in volts. So the conversion to decibels can be considered a linearization of the receive signal's amplitude.
The linear fit of the phase at constant frequency showed a coefficient of determination of 0.975 (see Fig. 6). The fit yielded a sensitivity of −5 mrad mL−1. Due to the higher non-linearity of the phase signal the root-mean-square error in volume using a linear model is only in the range of 1.1 mL (root-mean-square error phase 5.7 mrad). This can be considered as the systematic error due to a non-linearity characteristic of our sensor system. Dividing the standard deviation of the reproducibility measurement of 3.35 mrad by the sensitivity leads to a standard deviation in volume of 0.67 mL. This can be considered as the random error of our sensor system.
As expected, the correlation between the phase signal and the flow signal is rather low (Pearson coefficient ). We identified a significant correlation between the flow rate and the differential quotient of the phase signal (Pearson coefficient ). Thus, a prediction of the actual flow rate with the sensor data seems possible.
We presented a new kind of electromagnetic respiration sensor using coupled antennae as sensor element. The sensor was characterized using a 3-D printed lung phantom and showed a high sensitivity in the volume range of an infant's lung and a negligible delay to a conventional flow sensor.
When the sensor is used to assess the absolute volume of a lung, a calibration routine will be necessary, but this has to be addressed in clinical or pre-clinical trials. However, the proposed sensor might be a viable choice as a trigger for patient–ventilator synchronization in infants and neonates as it can measure dynamic changes in volume with a high temporal and volume resolution. The sensor shows a high sensitivity even at low volume changes and might be well suited to derive breathing patterns in real time, while being insensitive to leakage. This could strongly reduce the ventilation-induced lung injuries like baro- or volutrauma in the smallest of patients.
Future work will address improvement of the antennae system to allow a contactless measurement, which would be beneficial for neonatal applications because no adhesive tape strip had to be placed on the neonatal skin. Also, our future work will focus on non-invasive measurements on adult humans and small rodents.
The underlying data sets are available at https://doi.org/10.24406/fordatis/49 (Ringkamp et al., 2020).
JR and PR designed the sensor system under supervision of JL. JR and JL designed the experiments and did the data analysis. PR and PL designed the lung phantom. All authors contributed to the writing process.
The authors declare that they have no conflict of interest.
This article is part of the special issue “Sensors and Measurement Systems 2019”. It is a result of the “Sensoren und Messsysteme 2019, 20. ITG-/GMA-Fachtagung”, Nuremberg, Germany, 25–26 June 2019.
This paper was edited by Jens Zosel and reviewed by two anonymous referees.
Gabriel, C., Gabriel, S., and Corthout, E.: The dielectric properties of biological tissues: I. Literature survey, Phys. Med. Biol., 41, 2231–2249, https://doi.org/10.1088/0031-9155/41/11/001, 1996.
Gabriel, S., Lau, R. W., and Gabriel, C.: The dielectric properties of biological tissues: II. Measurements in the frequency range 10 Hz to 20 GHz, Phys. Med. Biol., 41, 2251–2269, https://doi.org/10.1088/0031-9155/41/11/002, 1996.
Hahn, G. M., Kernahan, P., Martinez, A., Pounds, D., Prionas, S., Anderson, T., and Justice, G.: Some Heat Transfer Problems Associated with Heating by Ultrasound, Microwaves, or Radio Frequency, Ann. NY Acad. Sci., 335, 327–346, https://doi.org/10.1111/j.1749-6632.1980.tb50757.x, 1980.
Jordan, E. C. and Balmain, K. G.: Electromagnetic waves and radiating systems, 2nd ed., Prentice-Hall, Englewood Cliffs, New Jersey, USA, 1968.
King, R.: Coupled Antennas and Transmission Lines, Proc. IRE, 31, 626–640, https://doi.org/10.1109/JRPROC.1943.233357, 1943.
Kundu, S. K., Kumagai, S., and Sasaki, M.: A Wearable Capacitive Sensor for Monitoring Human Respiratory Rate, Jpn. J. Appl. Phys., 52, 04CL05, https://doi.org/10.7567/JJAP.52.04CL05, 2013.
Mahmoud, R., Proquitté, H., Hadhood, S., and Schmalisch, G.: Effect of endotracheal tube leakage on respiratory function monitoring: Comparison of three neonatal ventilators, J. Pediatr. Intensive Care, 1, 61–69, https://doi.org/10.3233/PIC-2012-012, 2015.
Pozar, D. M.: Microwave engineering, 2nd edn., John Wiley & Sons, Inc., New York, USA, 1998.
Ringkamp, J., Radler, P., Lebhardt, P., and Langejürgen, J.: A novel non-invasive, non-conductive method for measuring respiration, Fordatis – Research Data Repository of Fraunhofer-Gesellschaft, https://doi.org/10.24406/fordatis/49, 2020.
Teichmann, D., Foussier, J., Jia, J., Leonhardt, S., and Walter, M.: Noncontact monitoring of cardiorespiratory activity by electromagnetic coupling, IEEE Trans. Biomed. Eng., 60, 2142–2152, https://doi.org/10.1109/TBME.2013.2248732, 2013.
Uesawa, H., Takehara, T., and Ueno, A.: Non-contact measurements of diaphragm electromyogram, electrocardiogram and respiratory variations with sheet-type fabric electrodes for neonatal monitoring, in: 2018 IEEE EMBS International Conference on Biomedical & Health Informatics (BHI), 4–7 March 2018, Las Vegas, NV, USA, 2018, IEEE, 25–28, 2018.
Wheeler, H.: The Radiansphere around a Small Antenna, Proc. IRE, 47, 1325–1331, https://doi.org/10.1109/JRPROC.1959.287198, 1959.