the Creative Commons Attribution 4.0 License.
the Creative Commons Attribution 4.0 License.
 | 07 Oct 2025
EyeOnWater Raspberry Pi: a do-it-yourself maker sensor system project to measure and classify natural water colour based on the Forel–Ule scale
Nick Rüssmeier
Frederic Stahl
Felix Becker
The EyeOnWater Raspberry Pi (EOW–RPI) is a do-it-yourself maker project for citizen science to measure and classify the natural colour of water. It describes the systematic development (from concept to the prototype and application) and evaluation of a replicable optical sensor system that enables the automatic determination of water's colour according to the Forel–Ule colour scale using a Raspberry Pi and associated camera. Within the framework of image data processing, the system was automated in accordance with the criteria of scientific methods such that application errors were minimised from the initial image acquisition to the colour analysis. The overarching purpose of this project was to promote the independence of scientifically interested and technically skilled laypersons in building their own research device and collecting and providing their own data through a community website. Furthermore, the project can serve as inspiration for the maker community with respect to the development of enhanced extensions. For this purpose, it is crucial that the documentation of software and hardware is made available as open-source information. In this project, we follow a systemic methodology that extends from the requirement analysis and conceptualisation phase through to the system architecture, with the aim of developing suitable hardware and software. To this end, the sensor system was implemented as a prototype and its technical feasibility; handling; and the scientific quality of data acquisition, processing, and Forel–Ule colour analysis were evaluated.
- Article
(10671 KB) - Full-text XML
- BibTeX
- EndNote


The involvement of the general public in documenting environmental observations has become an essential aspect of environmental science, giving rise to the concept of “citizen science”. Such contributions can help experts gain a deeper understanding of local environmental processes while also promoting greater awareness and engagement with environmental issues among the wider public. The International Ocean Sampling Day (OSD) serves as an inspiring example of this concept (Kopf et al., 2015). Launched on the summer solstice (21 June) in 2014, the project was a global research campaign in which citizens and marine biologists collaborated to collect samples from the world's oceans, thereby gathering contextual data. A fundamental aspect of citizen science is not only active participation but also the scientific value that emerges from the observations themselves. In recent years, projects related to the OSD have been initiated in which measurement methods and sensors for optical coastal and marine water monitoring have been developed in the context of citizen science (Ceccaroni et al., 2020). In that regard, approaches have emerged towards assessing and classifying the natural water colour, as a meaningful measure for assessing the health and productivity of aquatic ecosystems, thereby allowing researchers to monitor and understand ecological dynamics and guiding the sustainable management of resources.
The natural colour of water bodies can be attributed to interactions between incident light and optically active components (OACs) in the water (Kirk, 2010). These components absorb and scatter light depending on the different wavelengths, resulting in the characteristic colour of water and affecting the availability of light underwater. Three important OACs, which also serve as indicators of water quality, have an essential effect in this context: (1) dissolved organic matter (chromophoric dissolved organic matter, CDOM); (2) non-dissolved inorganic substances, such as suspended matter and sediment load (non-algae particles); and (3) phytoplankton with its various photosynthetic pigments (mainly chlorophyll-a, Chl-a), which form the basis of the food web.
The illustration of the Blue Marble (Fig. 1, adapted from Stöckli, 2007) simply depicts that the colour of water in oceans and in coastal and inland waters varies regionally and globally. The combination of OACs leads to a multitude of dynamic temporal and seasonal fluctuations, for instance, driven by (1) algal blooms associated with the discharge of nutrient-rich water masses from riverine systems or (2) increased sediment loads resulting from precipitation or storm events. In this manner, fluctuations in the concentrations of these substances can be linked to significant issues of social interest, such as climate change or eutrophication.
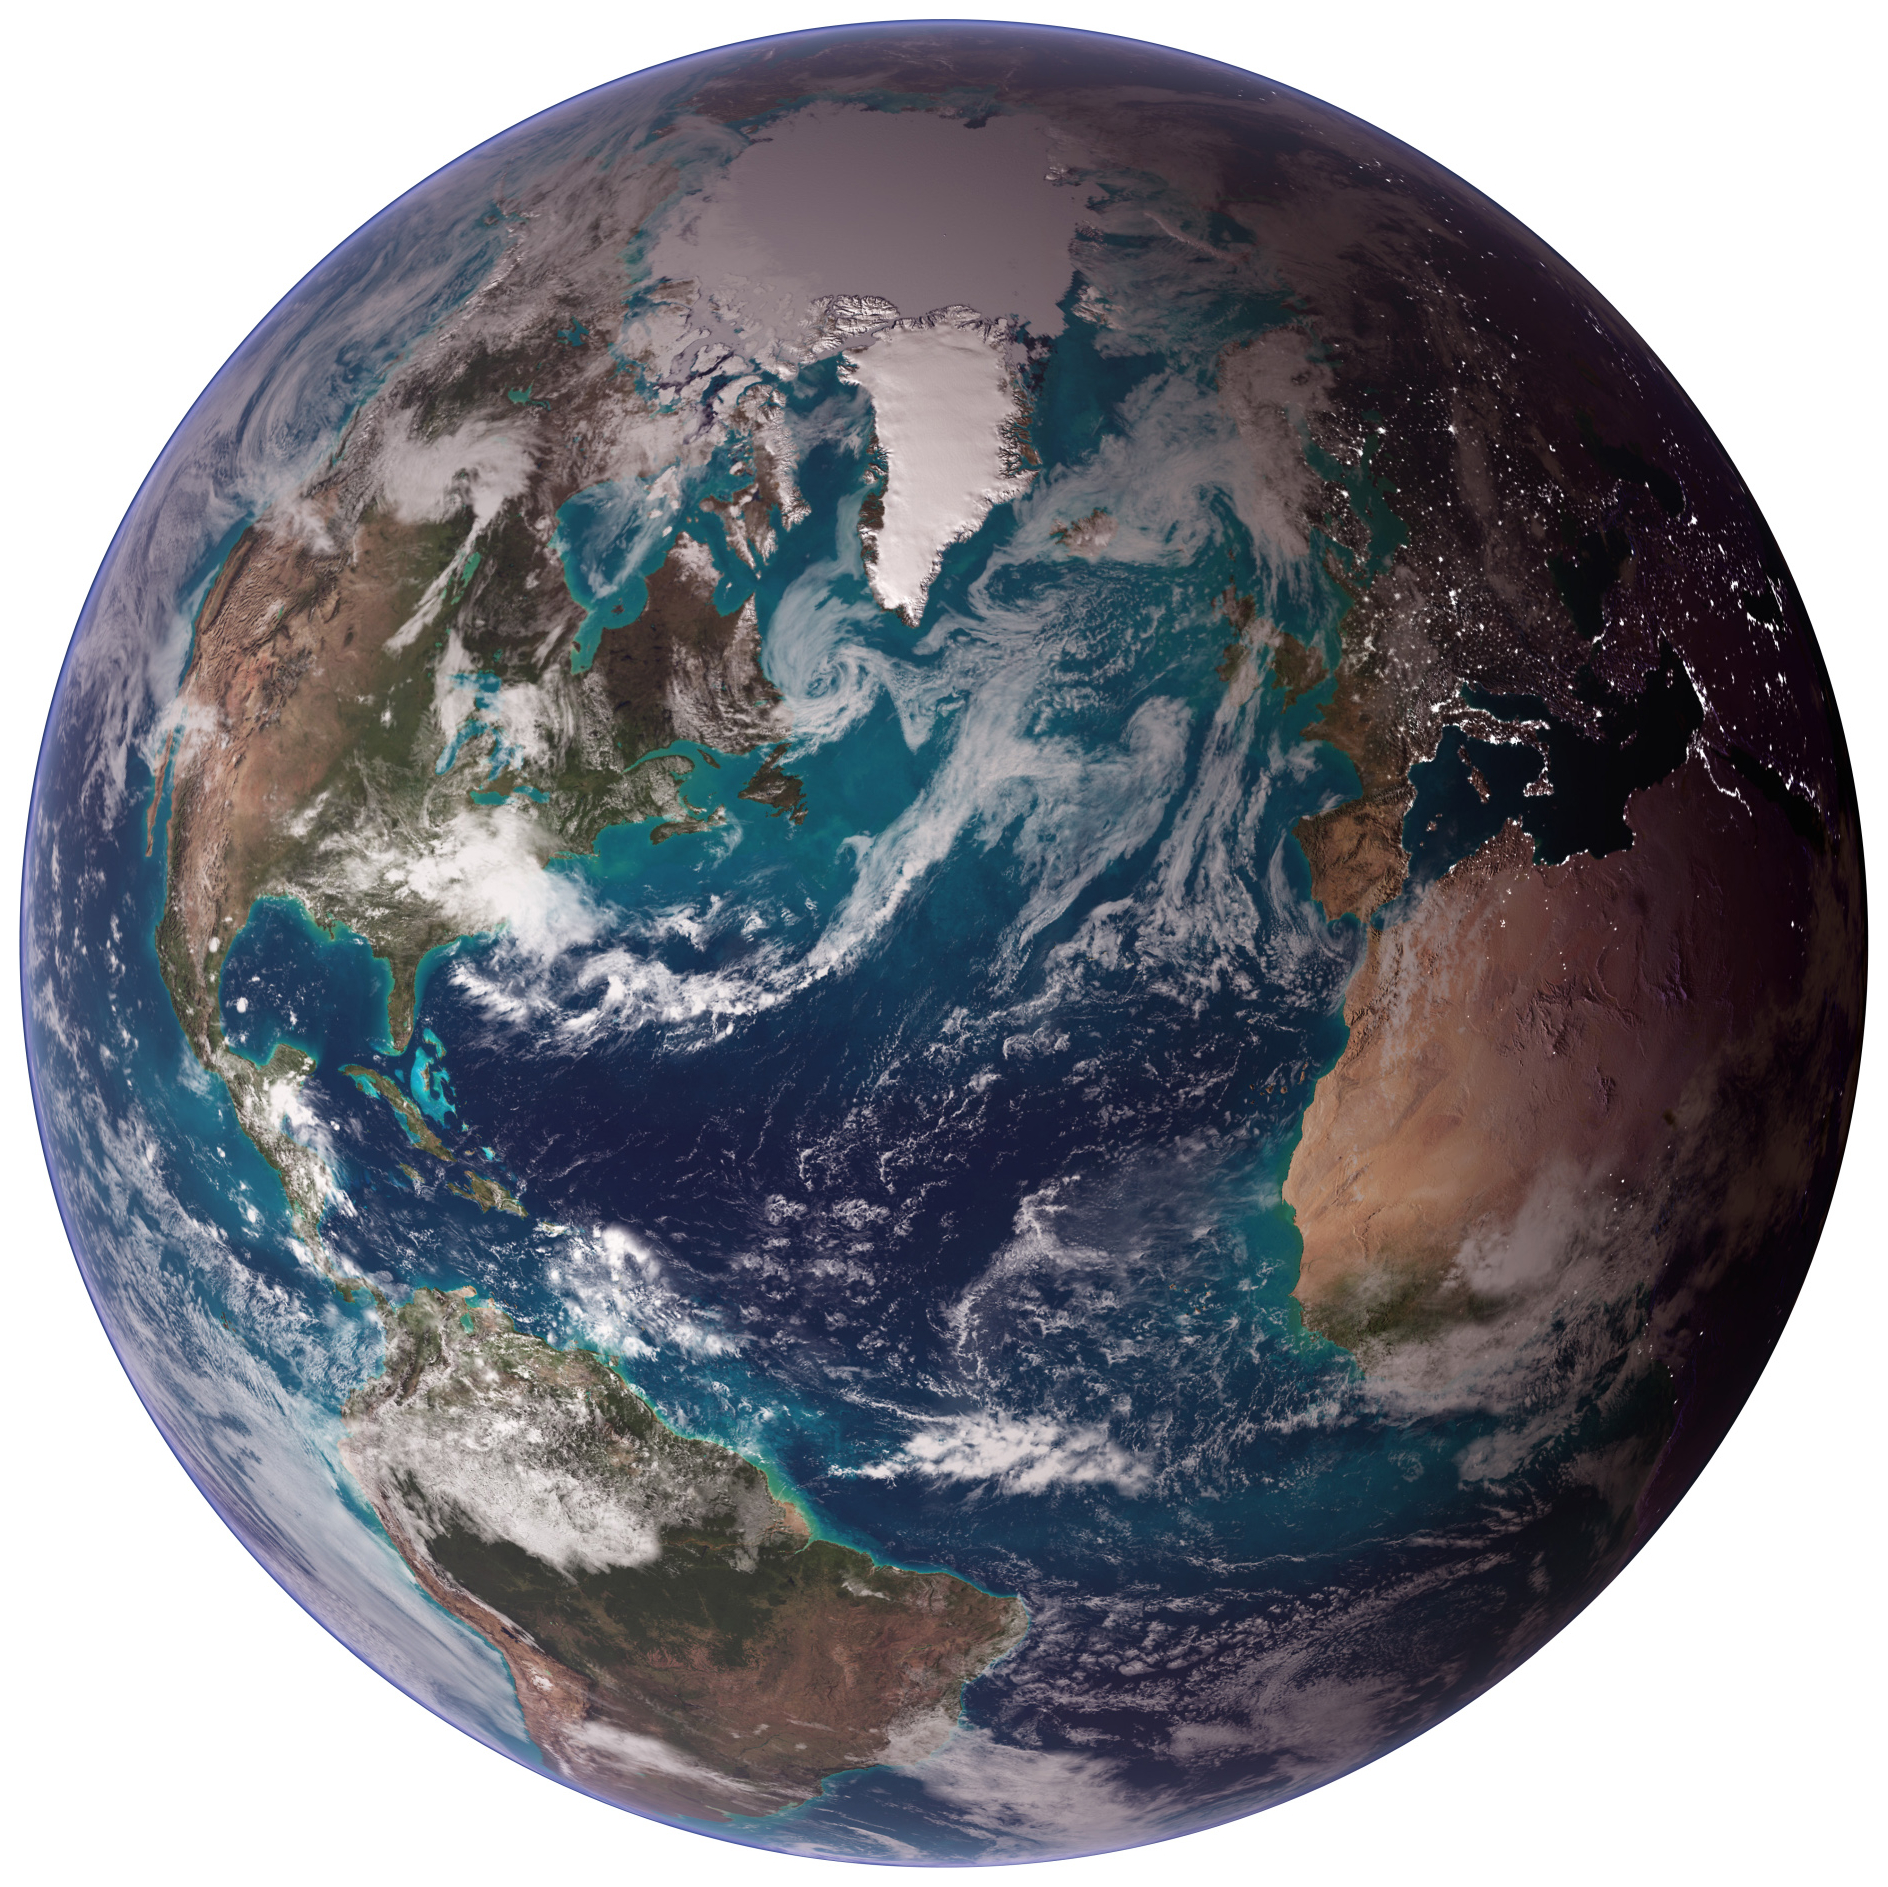
Figure 1Blue Marble Western Hemisphere (Stöckli, 2007) colour variations in oceans and coastal and inland waters.
The collection of contextualised and geolocated data over a representative period of time without interfering with the hydrosphere still poses a challenge for maritime research. Furthermore, the information contained in these data should be made available in a high-quality, long-term, and secure manner via international databases. Consequently, spaceborne ocean colour sensors are utilised for global remote sensing of the water-leaving spectral distribution of visible solar radiation that emerges from beneath the ocean surface and passes through the sea–air interface. The collected data are subjected to several processing levels to correct for factors such as the attenuating effects of absorbing atmospheric components or scattering losses and validation procedures. This process ultimately reveals ocean colour products, including, for instance, properties of chlorophyll, turbidity, suspended matter, and remote-sensing reflectance (Rrs) (Ibrahim et al., 2024), which can be correlated with local on-site measurements using radiometers. Radiometric reference measurements systems are cost-intensive and require regular maintenance and support by experts; therefore, they are not accessible to the general public. In that regard, a method for determining the colour of natural waters based on an oceanographic colour standard, the Forel–Ule index, was developed by the Royal Netherlands Institute for Sea Research (NIOZ) for use in citizen science (Wernand, 2016). Building on this foundation, additional research has demonstrated that the measurement data obtained through this method are also comparable with radiometric ocean colour observations (Wernand et al., 2013a).
Based on the state of the art of available solutions for citizen science, we address the current requirements regarding hardware and software development using an open-source optical sensor system project for citizen science that enables automatic data acquisition for the measurement and classification of natural water colour. Thus, the main objective of this paper is focused on systematic interdisciplinary product development and documentation for replication as well as on verification and validation, and it provides supplementary depictions and analyses of findings from our previous paper (Rüssmeier et al., 2024). The structure of the paper is as follows: Sect. 2 describes related work and the underlying methods. This overview provides the motivation for various applications and highlights the relevance of our proposed solution for an automated optical sensor system. Section 3 details the conceptual development, design, and system architecture, based on the defined requirements. In Sect. 4, we present the underlying operational and application concepts as well as the required materials. This section also covers the technical implementation of the data processing software, the user interface, and the database interface. Section 5 examines and discusses the functional and technical properties of the modular sensor system as well as the software functionalities and services for uploading data to an international database. Here, the suitability and scientific quality of the data collection and analysis are evaluated through a reproducible laboratory test set-up and an application study focused on usability. The results of the proof of concept for the sensor system conclude the technical development presented in this study. Finally, a summary and outlook on future developments and activities are provided.
2.1 The Forel–Ule scale
The colour of water has been documented by humans since long before Earth observation satellites became available. Different reference systems (colour scales) have been used for this purpose and continue to be employed today. A scale commonly used in both limnology and marine research is the Forel–Ule scale (Novoa et al., 2013, 2014). For this purpose, a water surface is subjectively compared (by the observer) with the Forel–Ule scale (Fig. 2) against the background of a submerged white surface using the Secchi disc (Pitarch, 2020). The present water colour is then assigned to 1 of 21 representative colour values, resulting in the Forel–Ule index (FUI) value. The advantages of this historical method lie in its ease of use, cost efficiency, and long-established application spanning more than 130 years (Wernand et al., 2013a). For the continuation of time series, the observation of water colour is currently still carried out using the same observation methodology. Thus, comparable time series data with several million measurements are presently available. When placed in a scientific context, this dataset can reveal historical or seasonal changes in the environment or ecologically relevant environmental influences. Furthermore, approaches combined with model simulations can help to verify the in situ Forel–Ule data collected over a long period of time (Pitarch et al., 2019) and are, thus, not only suitable but also necessary in order to derive preventive or intervening measures for environmental protection.
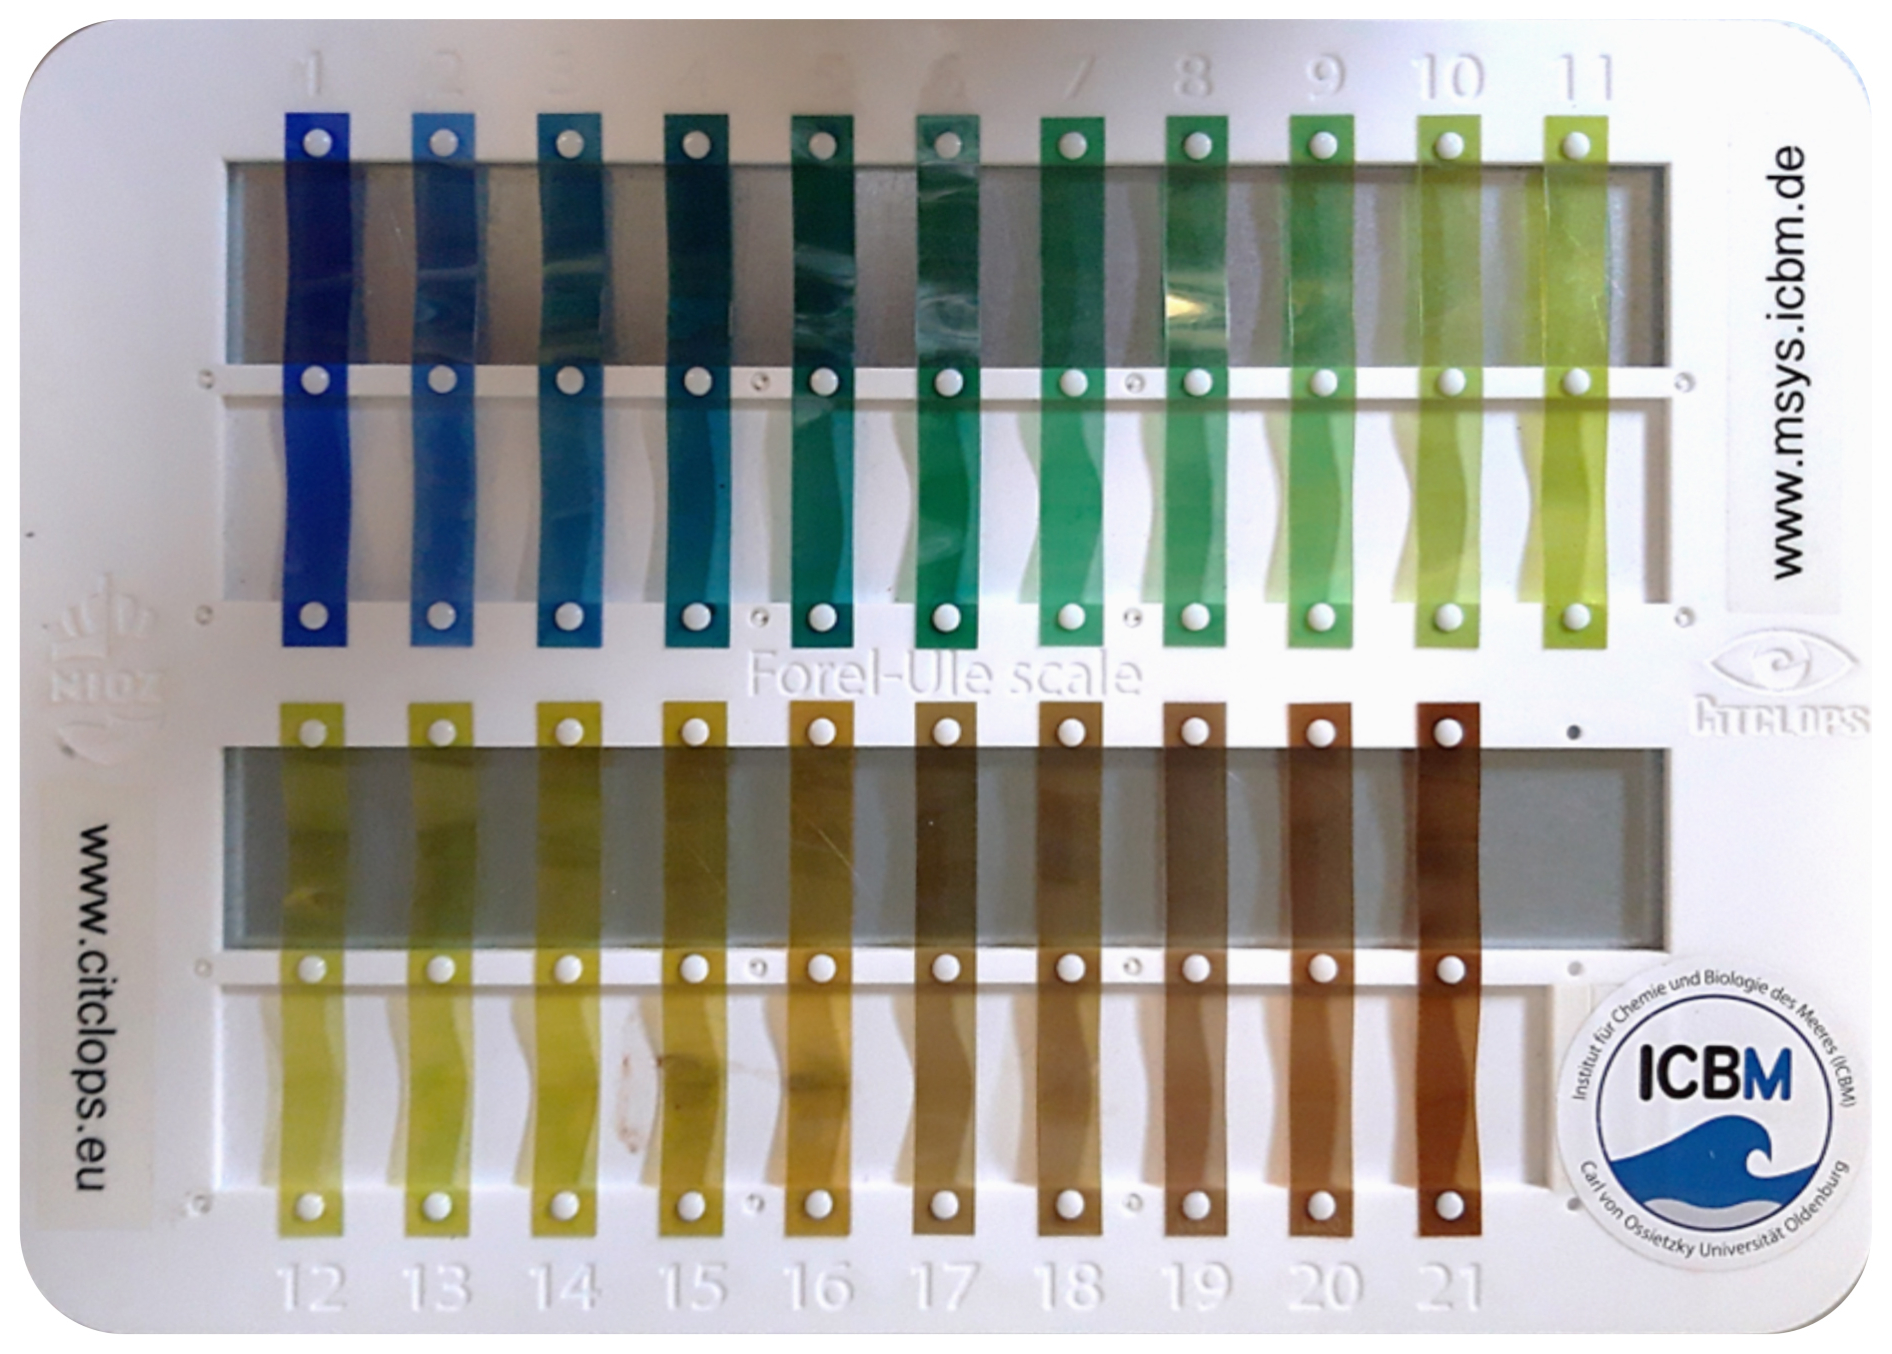
Figure 2Modern Forel-Ule colour scale of 21 index values used to determine the colour of natural waters.
Overall, although a multitude of colour measurements are available, longer time series in individual areas are still relatively rare. An approach to collect more local data could involve citizens in active environmental monitoring as part of citizen science. The Forel–Ule scale serves as a meaningful measure, as it is intuitively understandable for a wider audience and suitable for public relations, dissemination of scientific developments, educational purposes, and the development of citizen science projects on the topics of water quality and the state of the oceans.
However, the time required for manual data collection and documentation according to Forel–Ule and the need for a Forel–Ule scale and a Secchi disc act as obstacles to citizen participation. In addition, the subjective colour impression of the observer can vary due to current environmental factors, such as cloud cover, direct sunlight, or an unsteady water surface caused by wind. Thus, a certain level of practice is necessary for citizen scientists to manually determine the water colour according to the Forel–Ule scale in order to obtain qualitatively evaluable and comparable data. For this reason, smartphone-based apps have been developed and tested (Malthus et al., 2020). This innovation marks the transition from manual data collection to semi-automated smartphone-based water colour assessment by simplifying the measurement method.
2.2 The “EyeOnWater – Colour” smartphone app
Using the EyeOnWater – Colour smartphone app (MARIS B.V., 2024a), a user can capture images of a water surface with a smartphone camera and compare them manually with an associated colour scale on the display, which represents the FUI of the captured water without the need for a physical Forel–Ule scale (Wernand, 2016). The method used to analyse the three colour channels, red, green, and blue (RGB), of an image is based on the so-called WACODI (Water Colour from Digital Images) code (Novoa et al., 2015). Using this method, the images are first converted from the standard RGB (sRGB) colour space into the CIE XYZ colour space coordinates (CIE 1931, Commission Internationale de l' Eclairage) and are subjected to a gamma expansion and an illumination correction, the latter of which takes possible specular reflection at the air–water interface into account. The resulting XYZ values of each individual pixel of the image are converted into x and y colour coordinates and then into a hue angle (αw). Based on the distributions of αw in subareas of the image, an approximation of the intrinsic colour of the water is achieved, and the assignment to 1 of 21 possible Forel–Ule indices is then merged in a correlation table (Novoa et al., 2013). For example, a spectral angle function of 225° can be defined as an FUI of 2 for the intrinsic colour of a water body on the basis of the CIE standard colour system. A corresponding index of the Forel–Ule scale is then suggested to the user for selection via their smartphone display. For subsequent quality control of the measurements, additional information must be provided regarding whether it was raining at the time of the measurement and whether the seafloor was visible in the image (Fig. 3, top). All data are automatically georeferenced by the internal GPS of the smartphone sensor. One advantage of this app is that the data can be freely accessed; moreover, new data can be uploaded to a specially developed website application at https://www.eyeonwater.org/ (last access: 25 September 2024), as illustrated in Fig. 3 (bottom). Thus, the outcome is made freely available to all interested groups via a user-friendly map database. The regression between the αw extracted from reference radiometric data and the αw extracted from digital images was evaluated with a coefficient of determination of r2 = 0.93 (Novoa et al., 2015).
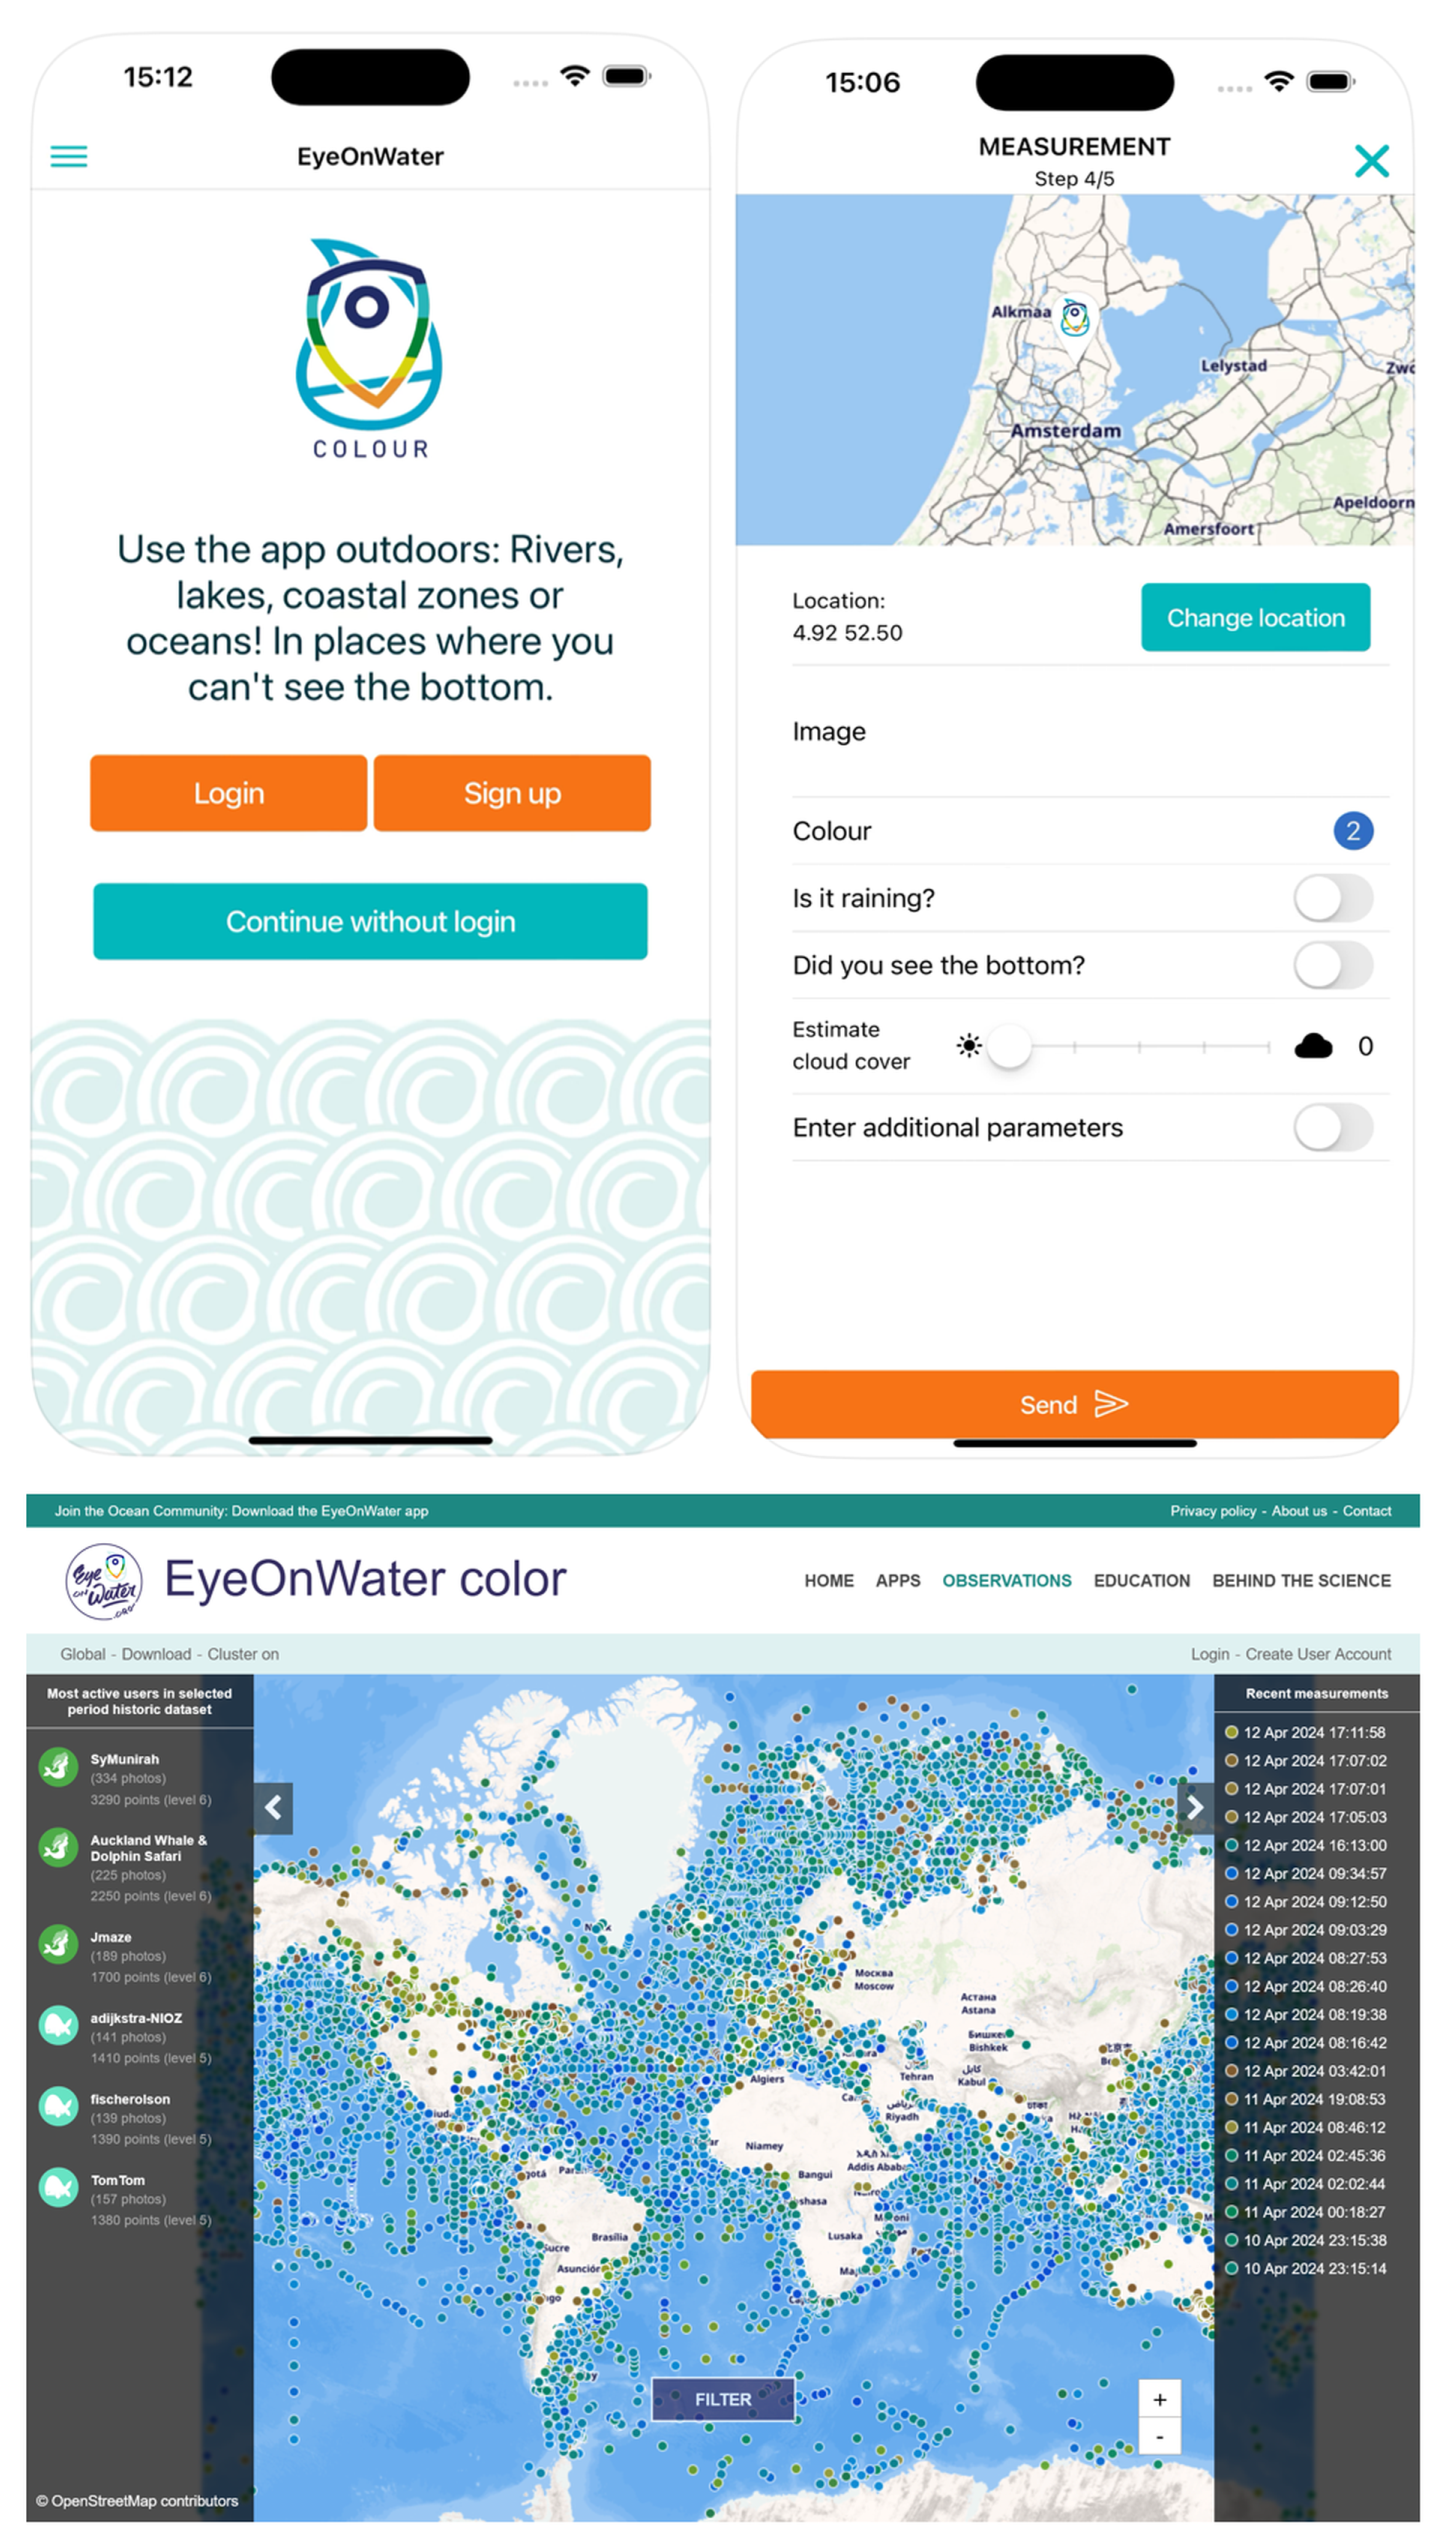
Figure 3User interface of the EyeOnWater – Colour smartphone application (MARIS B.V., 2024a) for citizen science to determine the water colour according to the Forel–Ule index (top). The website application interface (https://www.eyeonwater.org/, last access: 25 September 2024) for citizen science (bottom).
2.3 The “HydroColor: Water Quality” smartphone app
An alternative smartphone app is the HydroColor: Water Quality application (Leeuw, 2024), which offers an advanced approach using a grey card with 18 % reflectance as a reference surface from a separate image for the normalisation of colour values and the correction of the prevailing illumination conditions (Leeuw and Boss, 2018). Using the HydroColor: Water Quality app, three separate but related images are captured of the environment (sky, grey card, and water surface) at the measurement site (as shown in Fig. 4) as well as metadata from the GPS and gyroscope of the smartphone sensors. For the automated analysis, the captured colour images are initially divided into the three wavelength ranges (red, green, and blue); afterwards, the relative radiance values are normalised in relation to the grey-card value. Based on the sky image, an approximate exposure-independent result of the remote-sensing reflectance is computed, providing the same parameter that can be derived from satellite measurement data for water observation. All data are processed and stored on the smartphone, and they consist of a text file including multiple parameters (Rrs, light values, RGB reflectance, turbidity, and chlorophyll concentration) (Goddijn-Murphy et al., 2009). For the HydroColor: Water Quality app, remote-sensing reflectance was specified to be measured in the red, green, and blue parts of the visible spectrum with approximately 26 % the accuracy of a precise radiometer.
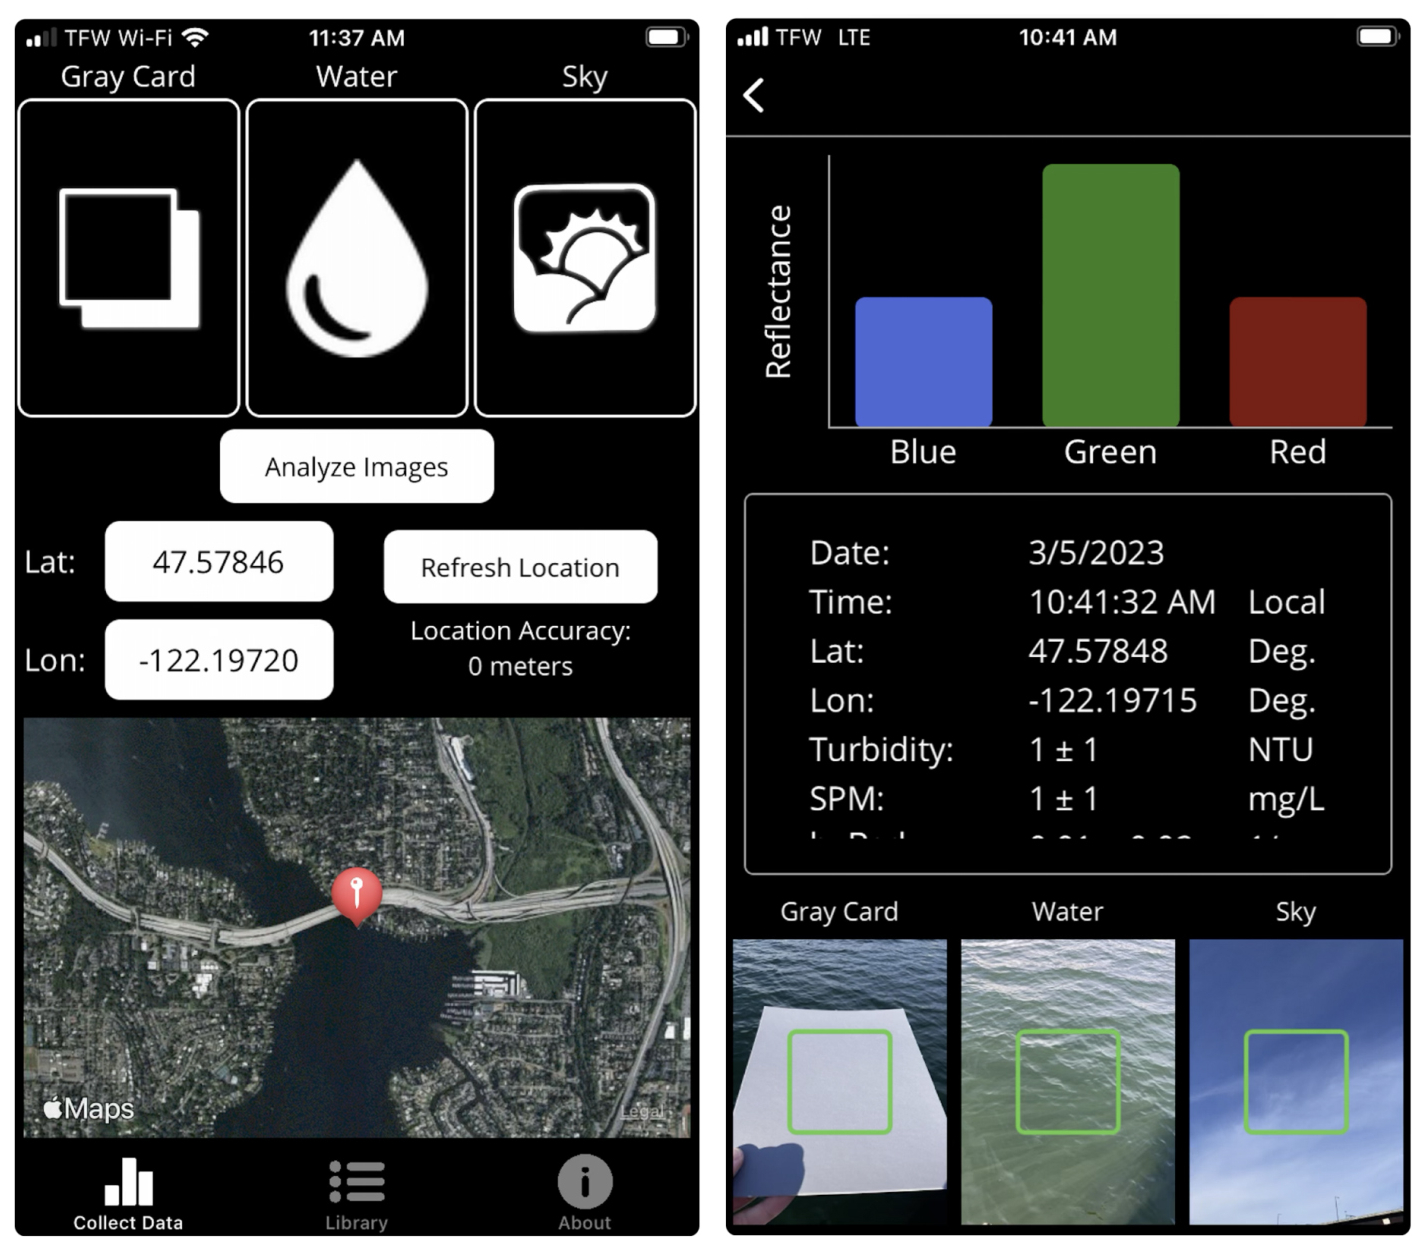
Figure 4User interface of the HydroColor: Water Quality smartphone application (Leeuw, 2024) employed to determine the remote-sensing reflectance. For this purpose, three separate images of the environment were analysed.
In summary, the presented engineered applications provide good examples of various semi-automated approaches that facilitate citizens' involvement in the practical measurement and reporting of environmental water quality parameters. Both applications operate on smartphones, which are widely used, thereby providing easy access. The development of quality-tested applications and data analysis at a scientific level is already well advanced. Through application studies, a variety of challenges have been identified with respect to generating usable images with the apps that shall be investigated in further developments. The main sources of possible inaccuracies and deviations are variable illumination conditions and the white balance of the sensor, roughness of the water surface, or interference that occurs when images are taken manually, meaning that the user may not immediately recognise such problems. In addition, sun glint can occur as a temporary anomaly when sunlight is directly reflected from the water surface into the downward-facing optical sensor. Factors such as the position of the sun, the viewing angle of the optical sensor (camera), the refractive index of the water, cloud cover, and the wind direction and speed influence the effect of the sun glint (Garaba et al., 2012).
These findings mean that, in an automated measurement setting, as envisaged in our development, the possibility of measurement results being falsified by environmental influences, e.g. the roughness of the water surface, cannot be entirely avoided, as the user cannot adopt preventative procedures at the moment of automatic image acquisition. Furthermore, the existing solutions do not provide the opportunity for continuous operation to record data series. Even if this option was available, it is unlikely that most smartphone users would employ an unattended installation of their smartphone in the environment.
Considering smartphone implementation and usage, it is prudent to investigate additional possible systems that provide the functionalities of existing solutions and facilitate straightforward modular extensibility for the engaged community. To this end, an automatic optical sensor system was developed in accordance with the VDI 2206:2021 “Development of mechatronic and cyber–physical systems” guideline (Verein Deutscher Ingenieure, 2021). Consequently, the preliminary phase encompasses the delineation of both technical and non-technical requirements, yielding a concept for a modular design and system architecture. During the iterative hardware and software development process, corresponding test cases serve to verify the functionality and validate the usability of the sensor system.
3.1 Requirements
As an open-source sensor system project, the project is subject to a variety of boundary conditions and restrictions or technological directives, which will have a profound influence on its conception and development. These include potential available hardware components as well as the choice to use certain third-party software libraries with appropriate support. The sensor system is intended for both stationary and mobile applications, whereby series of images and metadata should be automatically captured with the system and computed into the Forel–Ule index via the software in accordance with the scientific measurement standards included in the WACODI code. The collected data should become available via the already established EyeOnWater website and can, thus, provide a useful service for the community. An accuracy of ±2 FUI units is targeted, and correction methods should be implemented for (a) variable illumination conditions and (b) white balance. For this purpose, an additional grey card with a reflectance of 18 % has been adopted as a reference measurement surface. To avoid possible disturbances due to (c) sun glint, quality-oriented data processing steps should be implemented. In order to minimise (d) improper manual image selection by inexperienced users, standardised process steps should be envisaged by which users receive assistance. This involves automatically checking, flagging, and preselecting any inappropriate data for the user. To lower the hurdle for users with minimal technical expertise and simpler equipment to implement the system successfully, affordable materials for the design process and user-friendly handling during field operation must be taken into account. For this open-source project, the single-board Raspberry Pi computer was chosen in advance, as experience had been gained from previous projects, meeting the performance requirements for image data acquisition and processing performance. Through the integration of hardware components and software into an overall system, a prototype sensor system was realised and tested.
3.2 Derived system architecture
A flexible and modular system architecture was chosen with respect to the design of both the hardware and software to serve for citizen science and the maker community. The system architecture featured interfaces for the Raspberry Pi (RPI), energy modules (EMs), energy management via Witty Pi (WPI), a camera module (CM), a geo-localisation module (GPS), and a memory module (MM), all housed within the weatherproof housing of the EyeOnWater Raspberry Pi (EOW–RPI) sensor system, as well as external interfaces to the system software (PC) and the EyeOnWater (EOW) database, as illustrated in Fig. 5. With this modular and, thus, extensible concept, it is possible to create a cost-effective version that includes only the essential functions and hardware components. For this purpose, only the RPI, camera, and the energy module are required. This combination already enables continuous image acquisition on the RPI for stationary operation; however, additional metadata, such as time and location, must be entered manually by the user. The images can then be analysed by our data processing software on the RPI. Conversely, a more advanced and cost-intensive version of the system can also be realised with additional functions and features for enhanced user-friendliness and system quality. Such features include the extension of the WPI, through which redundant internal and external energy sources (EMs), e.g. solar cells, can be utilised and a power management function is implemented. In addition, the GPS extension provides automatic time and position information; thus, users do not have to manually input this information. Through the integration of a memory module (MM), a simple on-site data exchange is made possible at the measurement location at any time. In addition, the user experience with respect to image data analysis will improve when using an external PC that offers superior computational performance.
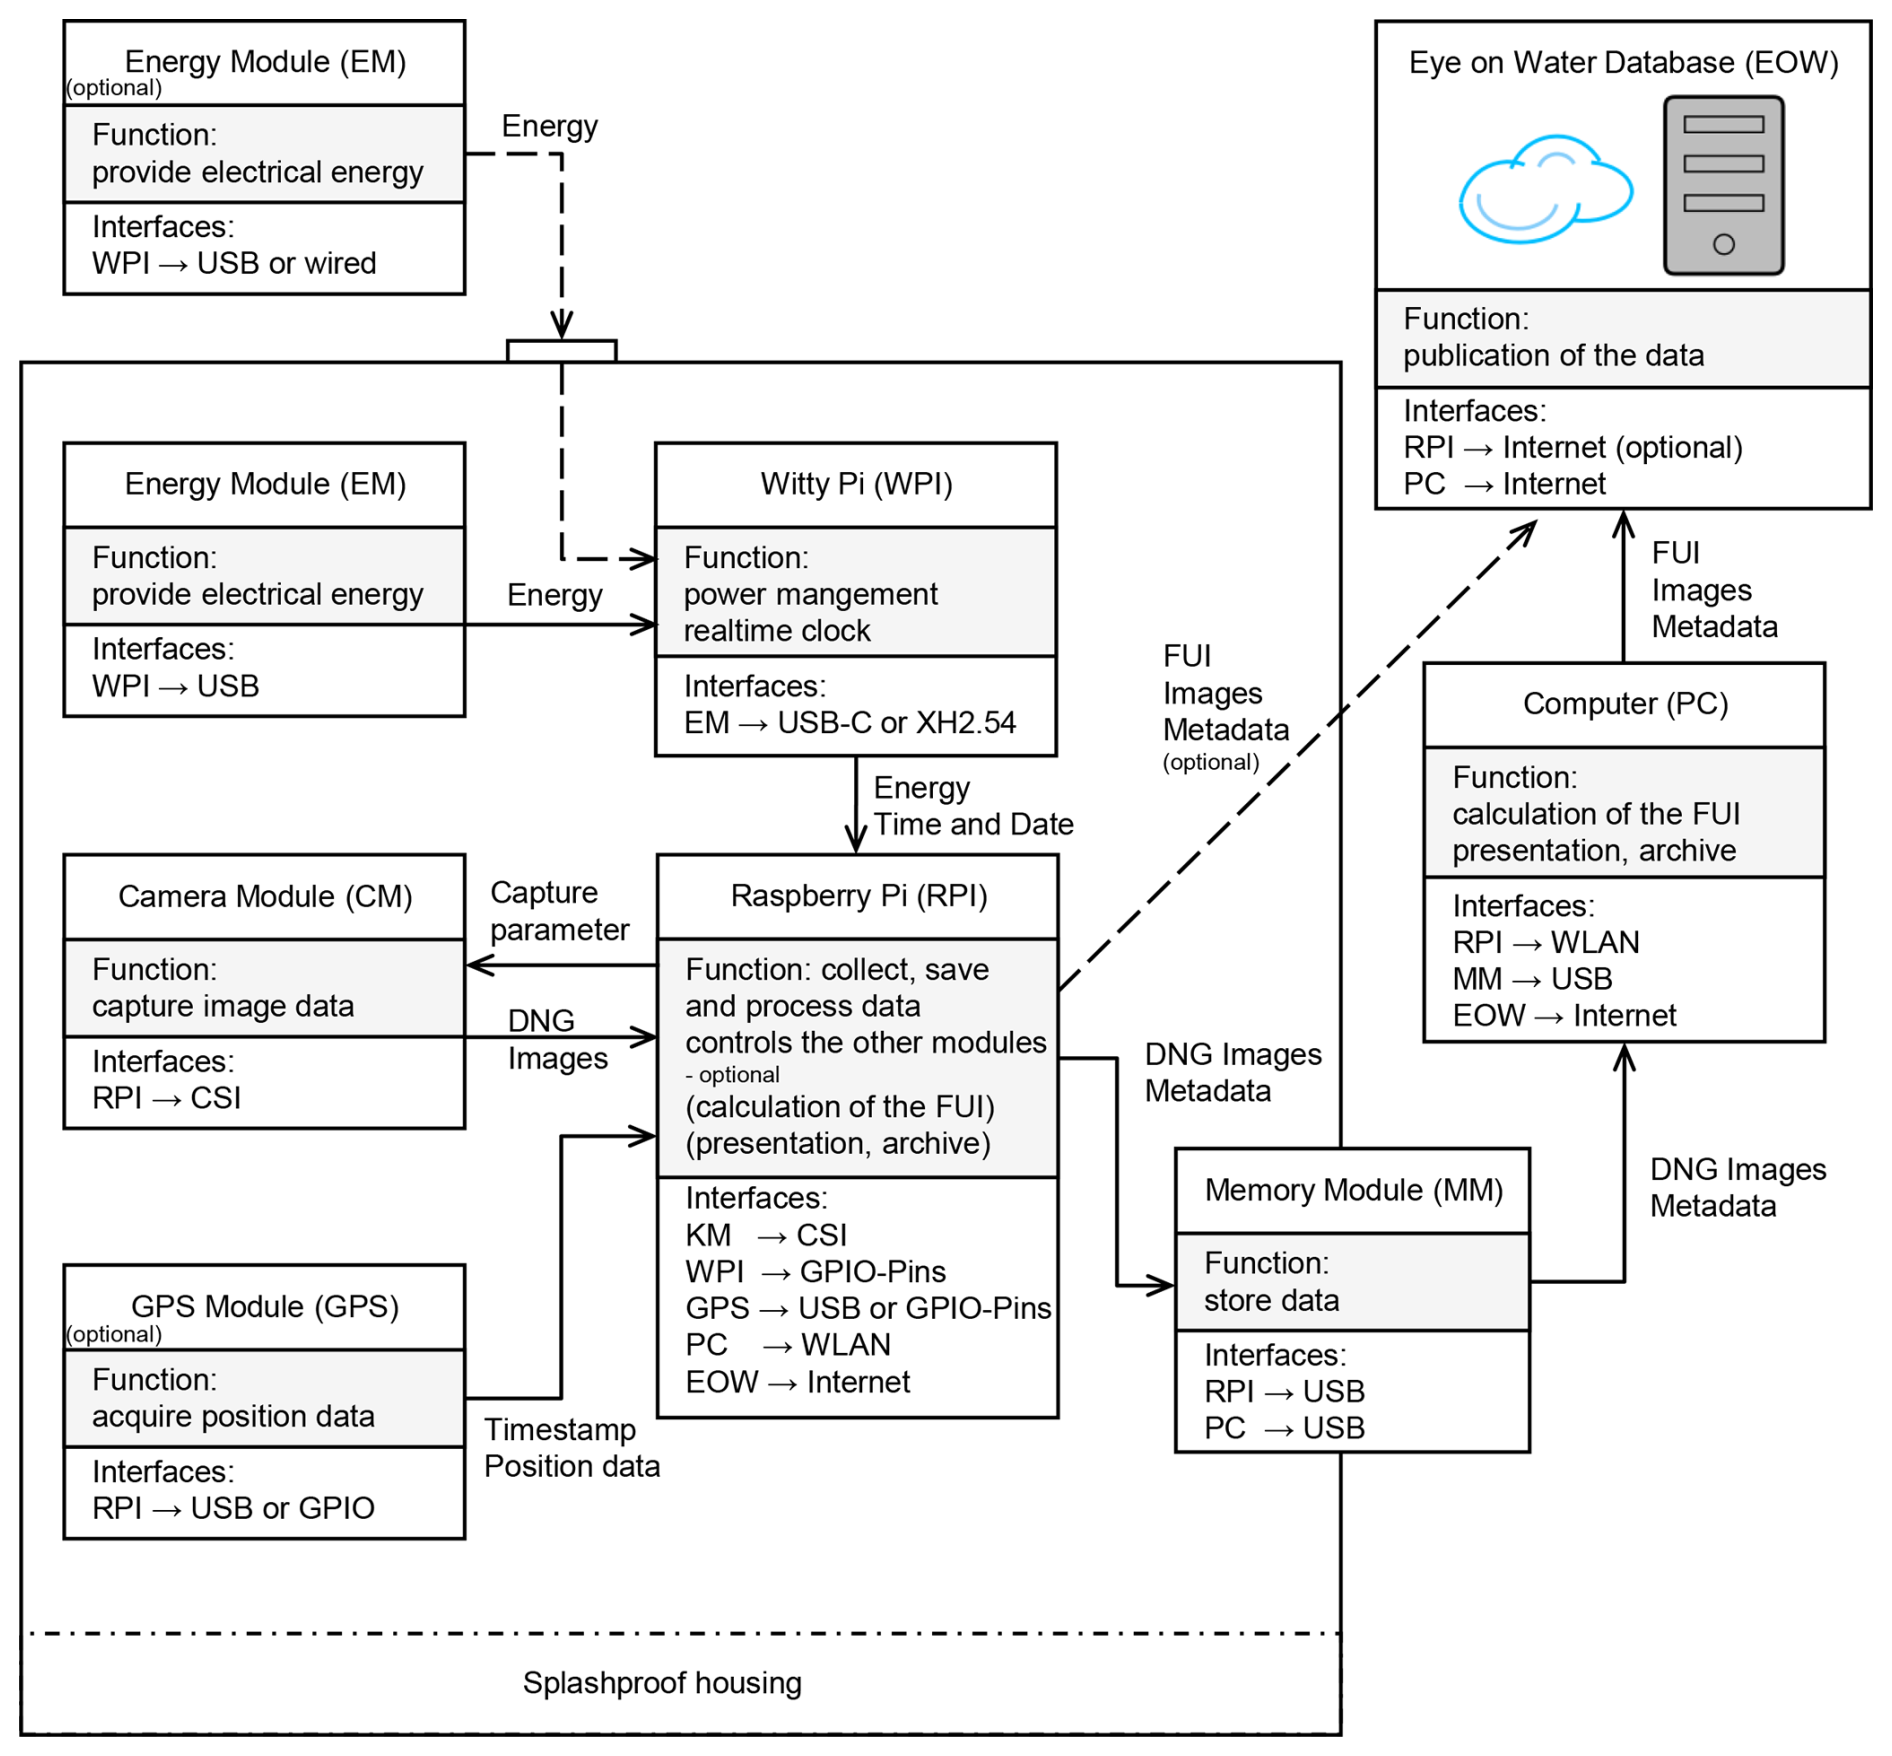
Figure 5System architecture of the EOW–RPI, including the hardware modules and interfaces to the system software and database.
Within the operating and application concept of the EyeOnWater Raspberry Pi, the following phases are differentiated: the preparation to set up the system, its regular use, and the final publication of the data on the EyeOnWater website. The following sections provide an overview of the realised system design, including the development, implementation, and documentation of the hardware (Sect. 4.1); the user interface of the software (Sect. 4.2); and the implemented data processing levels (Sect. 4.3).
4.1 Application concept, materials, and technical documentation
The preparation encompasses the entire process, from the procurement of all necessary parts and the assembly of the mechanical components to the installation and configuration of the software, which is crucial for setting up the EOW–RPI sensor system for a measurement campaign.
The hardware requires at least a Raspberry Pi 4 (model B 2022, 4 GB, Raspberry Pi Fd.), a Raspberry Pi HQ camera (12.3 MP, sensor type Sony IMX477) including a C-mount 16 mm telephoto lens for the HQ camera (PT3611614M10MP, CGL Electronic), a removable external USB data medium, and a power supply (e.g. USB power bank). In addition, a housing, equipped with a commercially available reference white-balance grey card (18 %) for the colour value (128, 128, 128) in the RGB colour space is required, obtainable from local photo shops or manufacturers at a price of EUR 10–30 (e.g. CL-CAM1113, ChromLives). Users can decide for themselves whether they want to use a custom housing made from existing and used materials or produce a new one by rapid prototyping with 3D printing, for which a 3D STEP model file is provided, as depicted in Fig. 6b. The basic structure is modular and, therefore, optionally extensible using a GPS sensor for geo-localisation (e.g. TTL GPS module with a u-blox NEO-6M chipset) or inertial position sensor to receive a heading of the sensor system. A very useful extension (Witty Pi, UUGear, Dun Cat B.V.) offers the option to integrate additional flexible interfaces for external or internal power supplies and its management for deep standby as well as a real-time clock. The system software is preconfigured and made available to users via a ready-to-use SD card image. Figure 6a illustrates the components used to build an EOW–RPI sensor system, whose total cost amounts to approx. EUR 250 if purchased new; however, these materials can be reused in other projects or taken from previous maker projects. Due to the minimal integration effort, all components are well suited for utilisation within the citizen science sensor system.
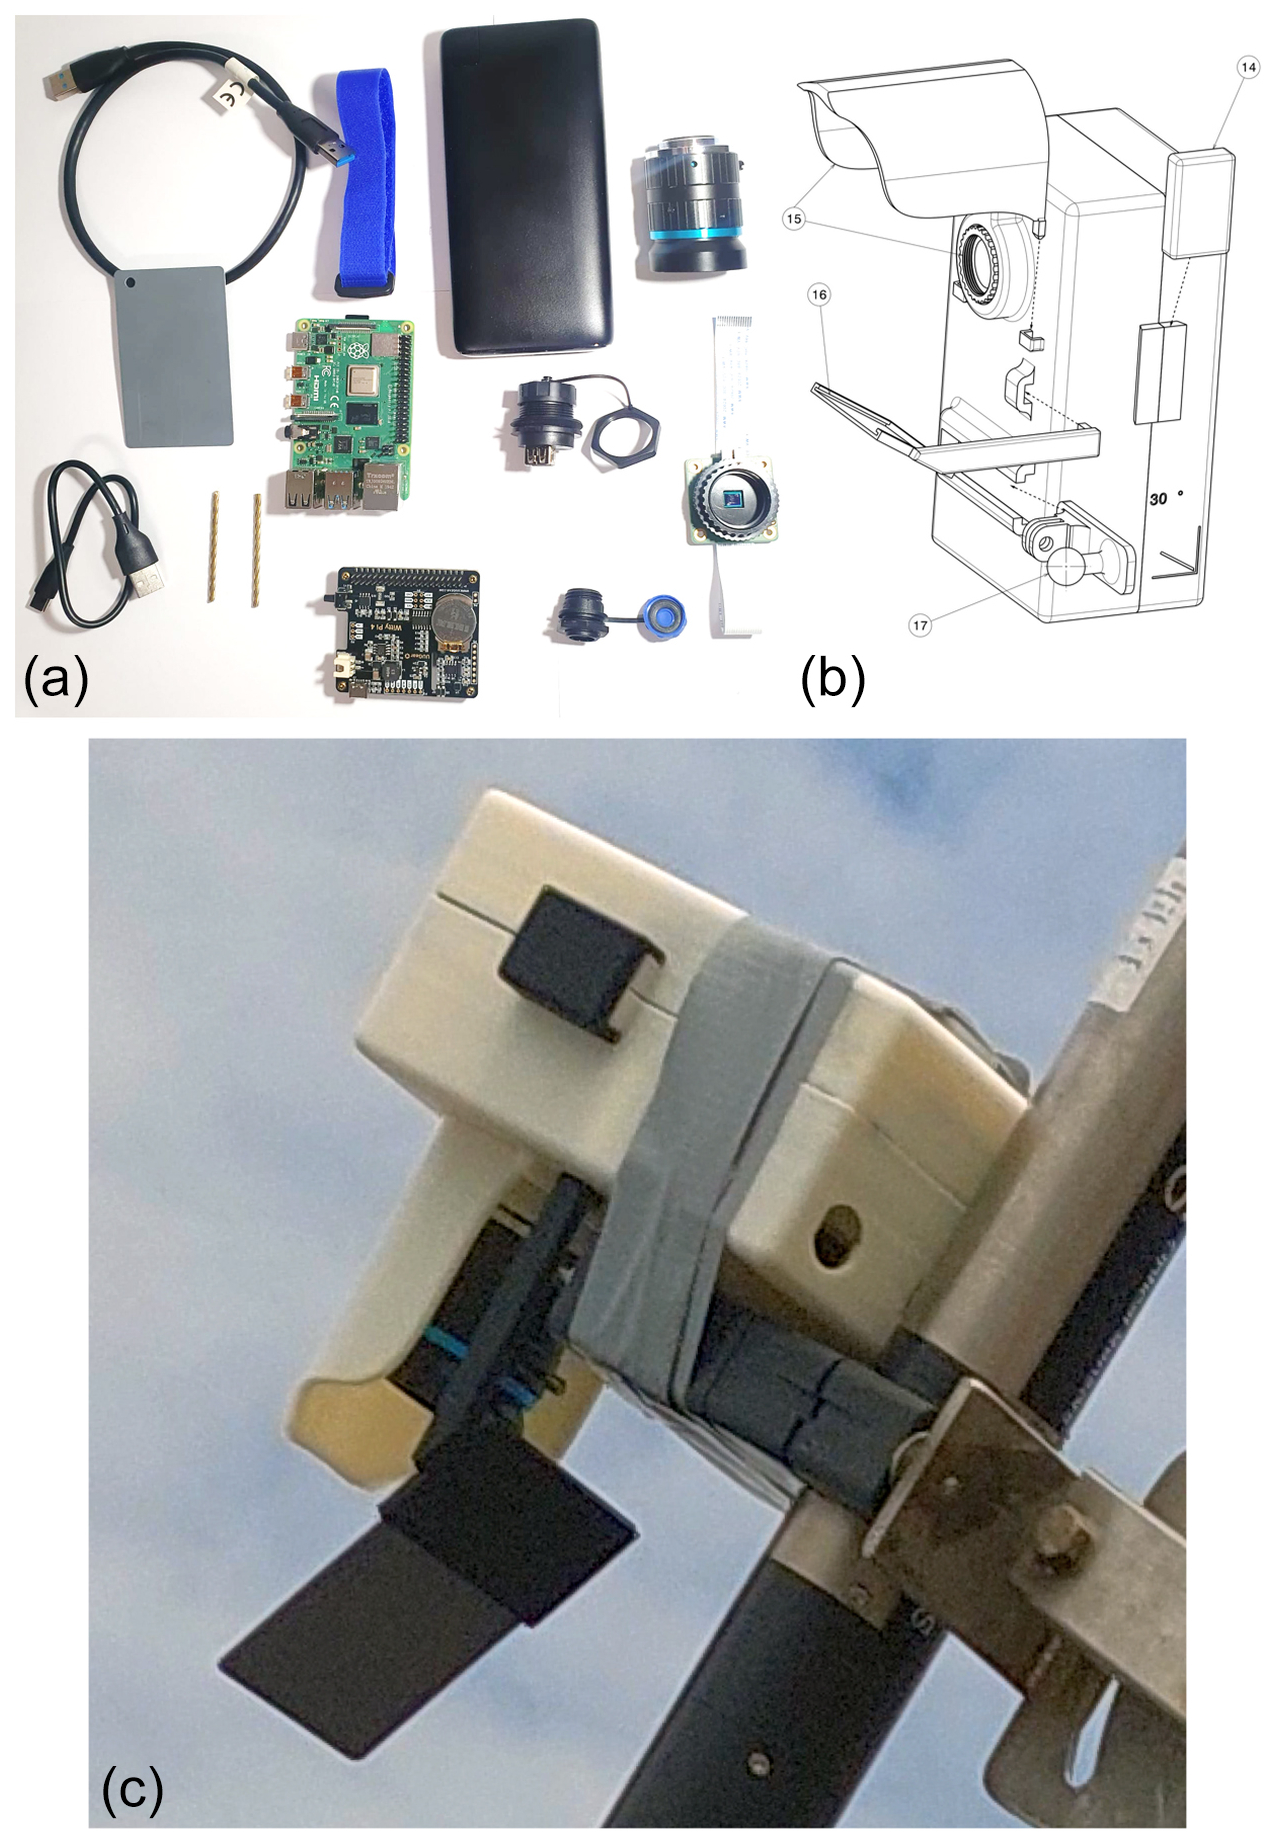
Figure 6The 3D housing model of the EOW–RPI (b) and the components used to build the EOW–RPI sensor system (a). The EOW–RPI prototype of the sensor system in the operational environment (c).
When positioning the camera at its measurement location, it should be set tilted at an angle of 30° to the water surface and oriented northwards, to reduce potential interference from direct sunlight reflections from the water surface. The field-of-view area should only include the grey card and the water surface to be measured, whereas the floor of the water body and other foreign objects such as plants should be excluded.
With respect to on-site operation, lossless digital negative (DNG) format image data, with a native resolution of 4056 × 3040 pixels and 12 bit, and standard exchangeable image file format (EXIF) metadata are automatically captured and stored at user-specified predefined time intervals on the basis of timestamps. The operation can be monitored on demand via a video stream or a terminal output. For a subsequent correction and computation of the white balance, each captured image includes a recognisable segment of the grey card, which is permanently attached to the EOW sensor system via a built-in bracket (Fig. 6c). Consequently, the images are captured with no automatic white balance.
4.2 User interface and application programming interface (API) to the EyeOnWater database
A subsequent computation of Forel–Ule values from a measurement series and their publication on the EyeOnWater website are realised by the data processing software, either directly via the Raspberry Pi or via a separate personal computer. Thus, an automatic processing procedure is carried out that is made accessible to users via a graphical user interface (GUI), as depicted in Fig. 7. In accordance with the system's extensible architecture and modular hardware set-up, the data processing software was programmed using an object-oriented approach, ensuring maintenance-friendly and scalable applications suitable for citizen science. Python 3.7 was chosen as the programming language, with Visual Studio Code (Microsoft) for source code editing and the PyQt (Riverbank Computing) toolkit for GUI development.
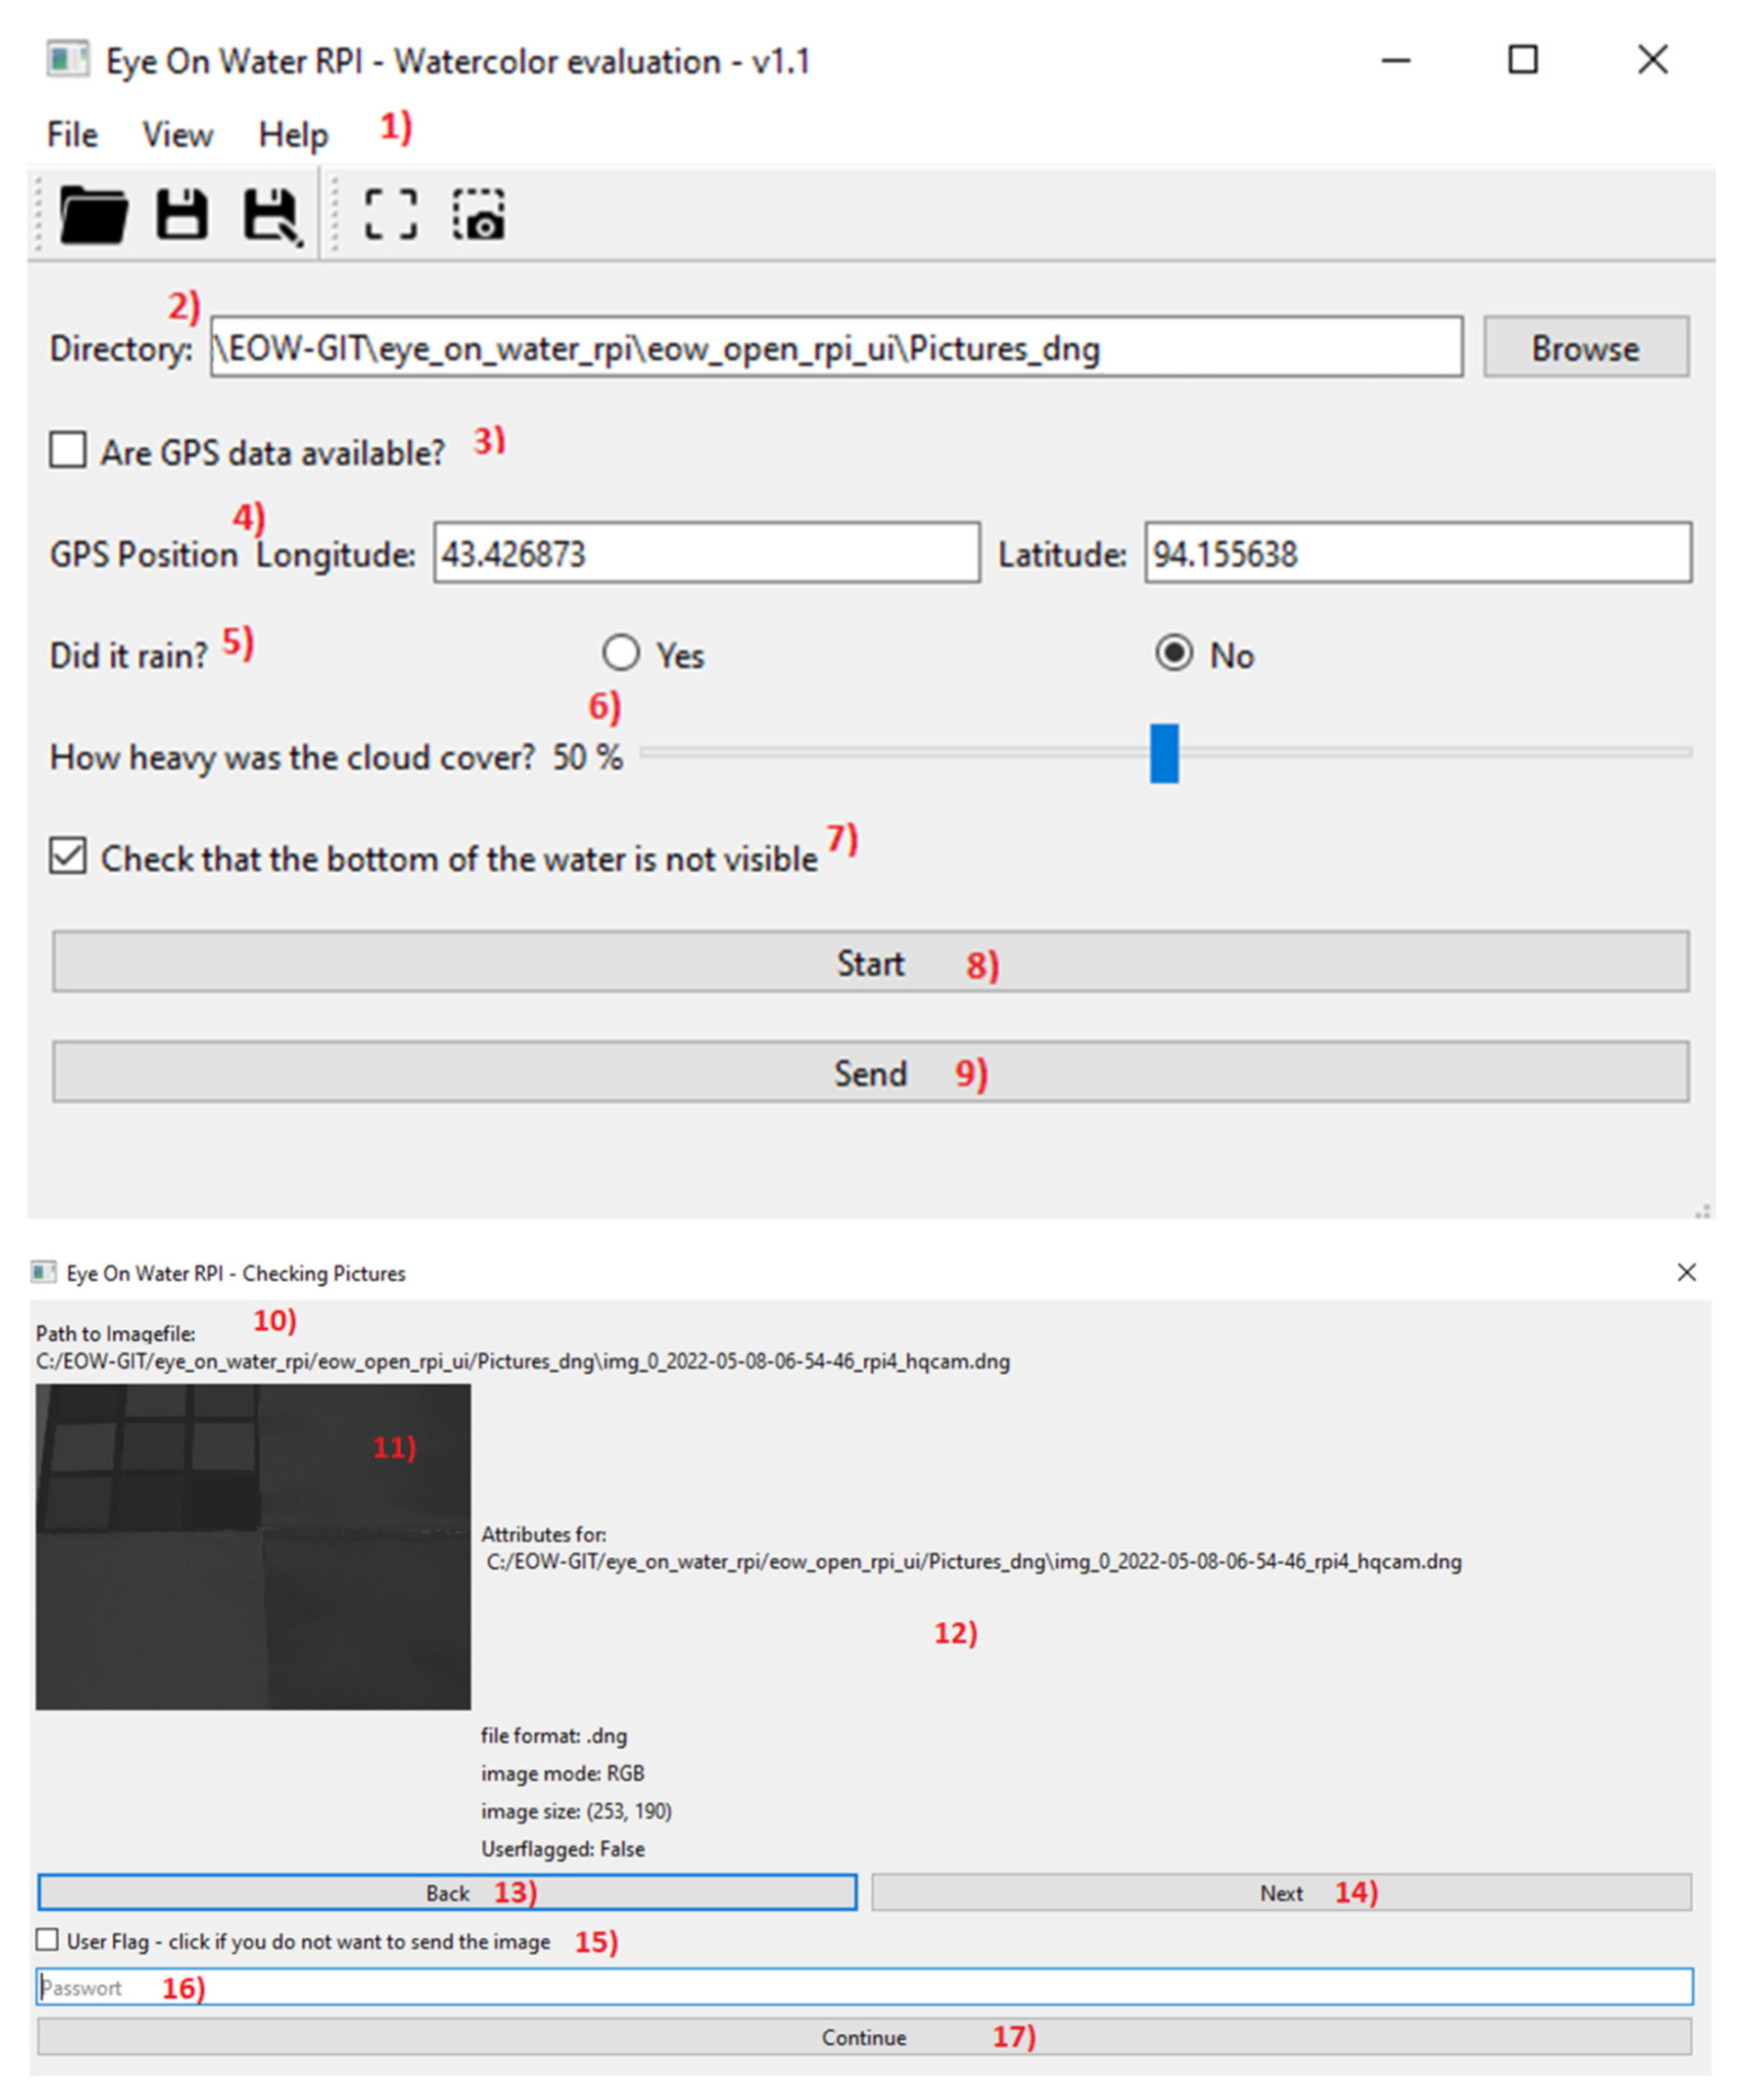
Figure 7The programmed graphical user interface of the EOW–RPI sensor system for user-friendly and intuitive application. The integrated procedure for quality-oriented verification of automatically preselected and flagged measurement data as well as password-secured transfer to the EOW database.
The application guides the user through the required prompts for the data directory as well as the complementary information on location coordinates from the measurement site, which can be manually set if the information was not automatically recorded by the additional GPS sensor extensions. Similar to the EyeOnWater – Colour smartphone application, information on rain and cloud conditions or the visibility of the bottom of the water must also be set before launching the automatic processing. In this context, standardised procedures facilitate a quality-oriented verification of automatically preselected and flagged measurement data by the user, right up to a password-authenticated transfer of measurement data to the EyeOnWater database. All required entries directly correspond to the structured request body form of the EyeOnWater website application programming interface (API).
4.3 Data processing software
The data processing from raw-image data to a standardised and quality-assured comma-separated values (CSV) dataset with Forel–Ule value information and metadata comprises five processing levels that are summarised and illustrated in Fig. 8. Performed on a Raspberry Pi 4, the processing from image acquisition to the final analysis can take up to 3 min.
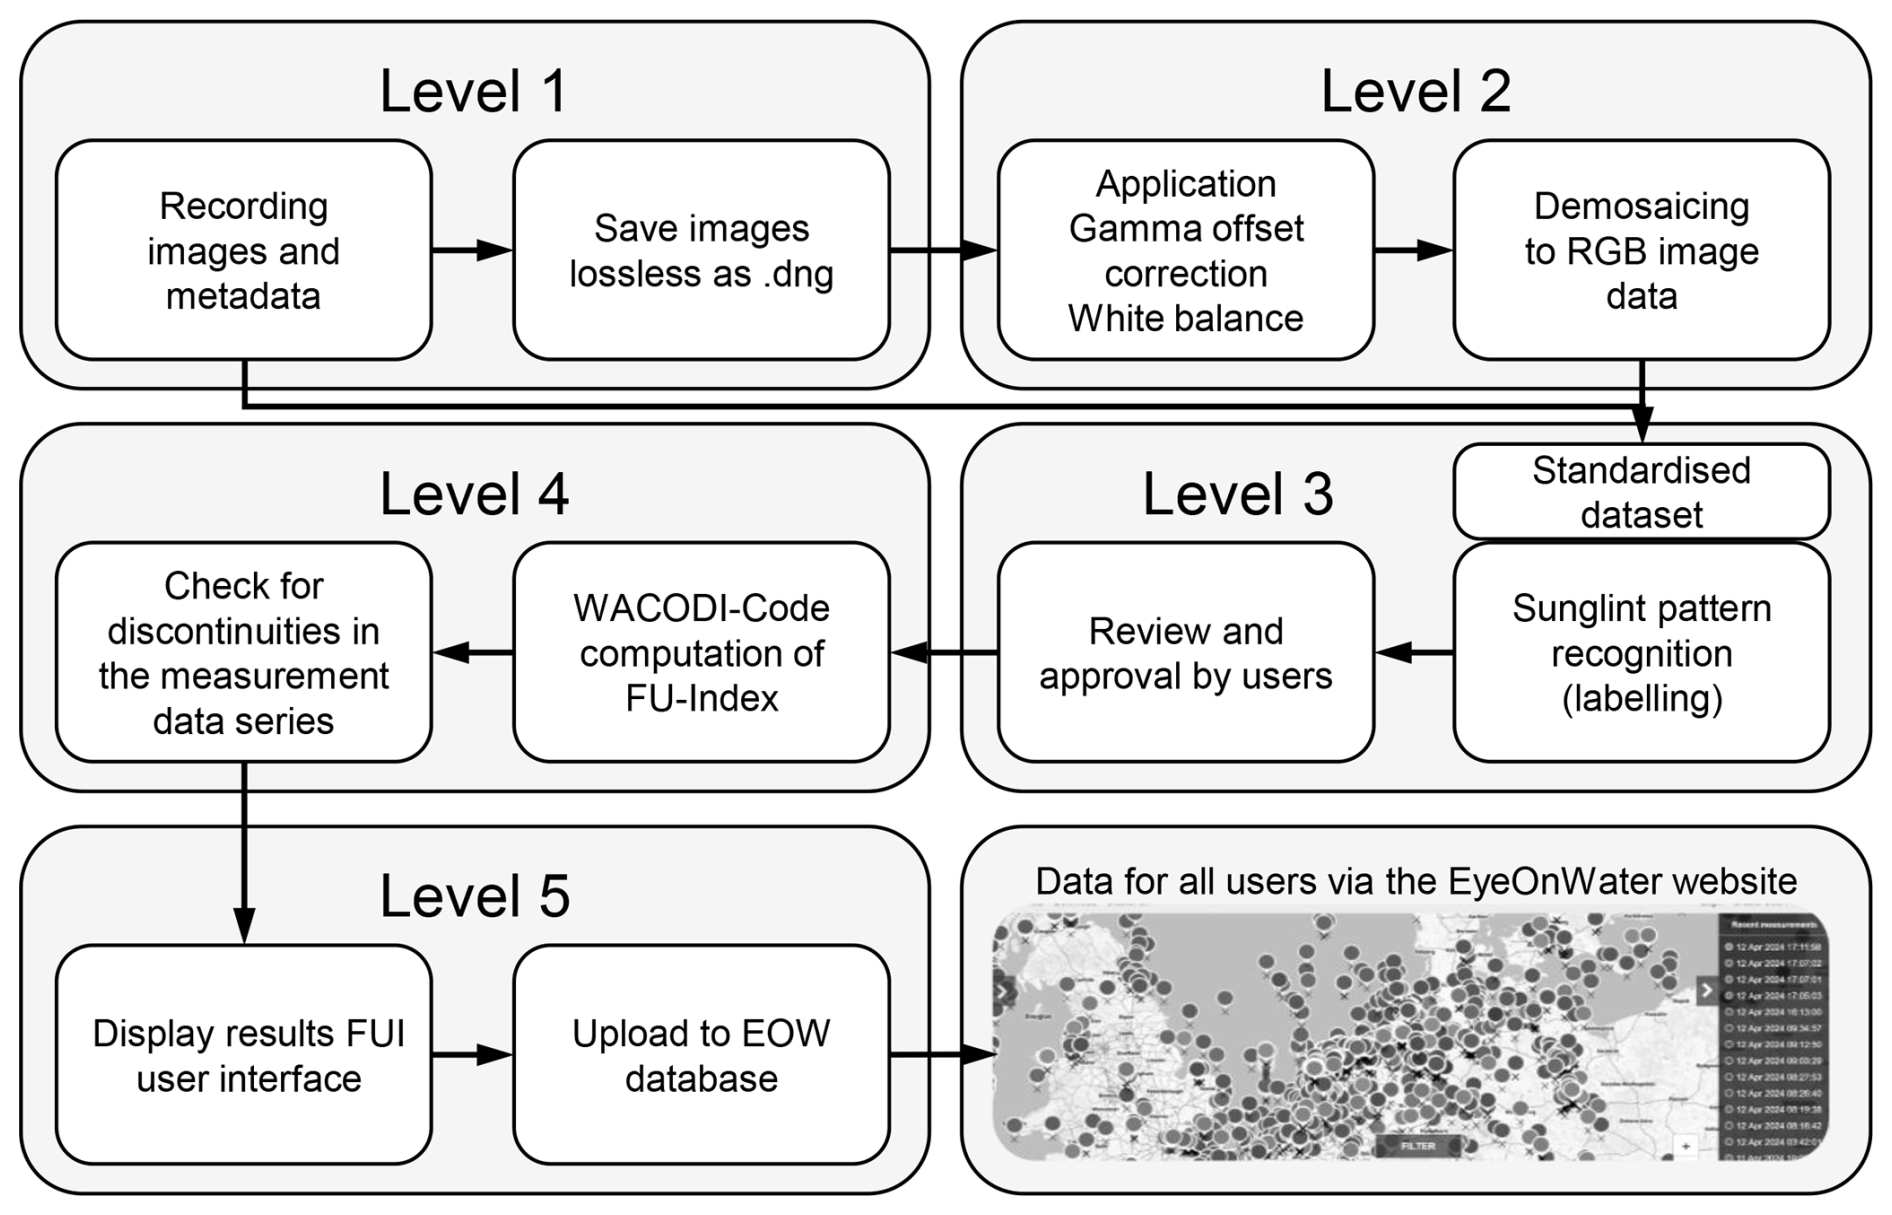
Figure 8Data processing levels from raw-image data to a consistent dataset, including Forel–Ule values and metadata, that is ready to upload to the EOW database.
Based on the DNG raw-image data format and EXIF metadata in level 1, preprocessing takes place in level 2 to convert the raw data into RGB image data via demosaicing encoding. This is preceded by a gamma offset correction based on EXIF metadata and a normalisation of the white balance of all RGB colour channels, which is calculated from the mean colour distribution of the reference grey card. Processing level 2 therefore addresses the requirements with respect to (a) variable illumination conditions and (b) white balance of the sensor. Thus, if the correction is applied successfully, all three colour channels will exhibit uniform intensities for a neutral, homogeneous illumination.
A standardised dataset comprising the preprocessed image and metadata, such as timestamps and position data, is merged at level 3. In addition, images are also analysed for anomalous patterns such as sun glint or whitecaps. The anomaly analysis relies on the evaluated pattern recognition method of Garaba et al. (2012) and is derived from the threshold distribution of the greyscale histogram. In the case of an identified anomaly, a flag will be assigned to the image in the metadata dataset and the data will be excluded from any subsequent analysis steps. This procedure has to be manually confirmed as a quality-aware processing step by the user via the EOW user interface. Thus, processing level 3 addresses the requirements of (c) sun glint and (d) quality-aware processing to overcome an inappropriate manual choice of image made by the user.
The Forel–Ule index is processed at level 4, based on the WACODI algorithm of the EyeOnWater application, which we briefly introduced in Sect. 2.2. In particular, this comprises the computation of the mean values of all existing colour hue angles (αw) within an image region and, finally, the conversion of the FUI in accordance with the αw correlation table.
The authors of the WACODI code report that, in a general case, when an image is acquired without detailed spectrophotometric measurements but the sky conditions are known (either cloudy or sunny), the water colour can still be estimated, although with less accuracy (Novoa et al., 2015). Thus, standard procedures for colour matching using an illumination correction matrix (ICM) are implemented in the WACODI code. The ICM is calculated on the basis of a cone response matrix, which enables significant changes in the red–green band overlap and can either be calculated using the so-called Bradford method or, in our case, using linear scaling. Two generic correction vectors for different chromaticity coordinates (x,y) of the illumination vector are implemented in the WACODI code, either for cloudy or sunny weather conditions (Novoa et al., 2015). As part of our implementation, a linear scaling of the ICM and the chromaticity coordinate vector for sunny conditions were selected. The basic consideration that led to the selection of the correction parameters chosen in our code will be explained in Sect. 5.1 against the background of test case 1. In addition, the software automatically identifies any outliers and flags abrupt deviations in the FUI within a consistent measurement series of measurement data if the deviation from the calculated mean exceeds 2 FUI units. A flag can also be set manually by the user if needed, ensuring that each measurement is verified before it is uploaded to the EOW database. Thus, quality-aware processing in level 4 finally contributes an additional function to realise the requirement (d) to overcome an inappropriate manual choice of image made by the user. During the fifth data processing step, the new FUI values are incorporated into the standardised dataset, which is then prepared for transfer to the EOW database. The results can also be displayed using the developed graphical user interface of the EOW system (Fig. 7) and subsequently uploaded to the EOW database once an authorisation token (password) has been registered by the user. The requests are transmitted using the multipart/form-data HTTP standard, which reduces the number of data required, as one or more data records are summarised in a single bodyshell. Thus, the EyeOnWater Internet of Things (IoT) API allows IoT devices to upload data to the EyeOnWater platform. As part of the project, the developers of the EyeOnWater website (MARIS B.V., the Netherlands) provided support with respect to defining the programming interface in accordance with the OpenAPI 3 standard (https://www.eyeonwater.org/iot-api/, last access: 25 September 2024). Finally, these results become publicly available to all interested users and researchers via the EyeOnWater website.
In the following section, the outcomes of the systematic development process for the project are summarised and discussed based on specific test cases. Test case 1 focused on implementing the WACODI code within the system to verify and evaluate the fundamental functionality of the software. Test case 2 involved comparing various available Raspberry Pi camera modules to assess the system configuration and the behaviour during operation under natural illumination conditions. These initial test cases represent interim steps along the development process. For the final implementation, test case 3 encompassed the complete range of functions, including the implementation of illumination correction with a reference grey card. Finally, test case 4 involved a practical usability study to validate the EOW–RPI sensor system in the field.
5.1 Verification of basic software functionalities – test case 1
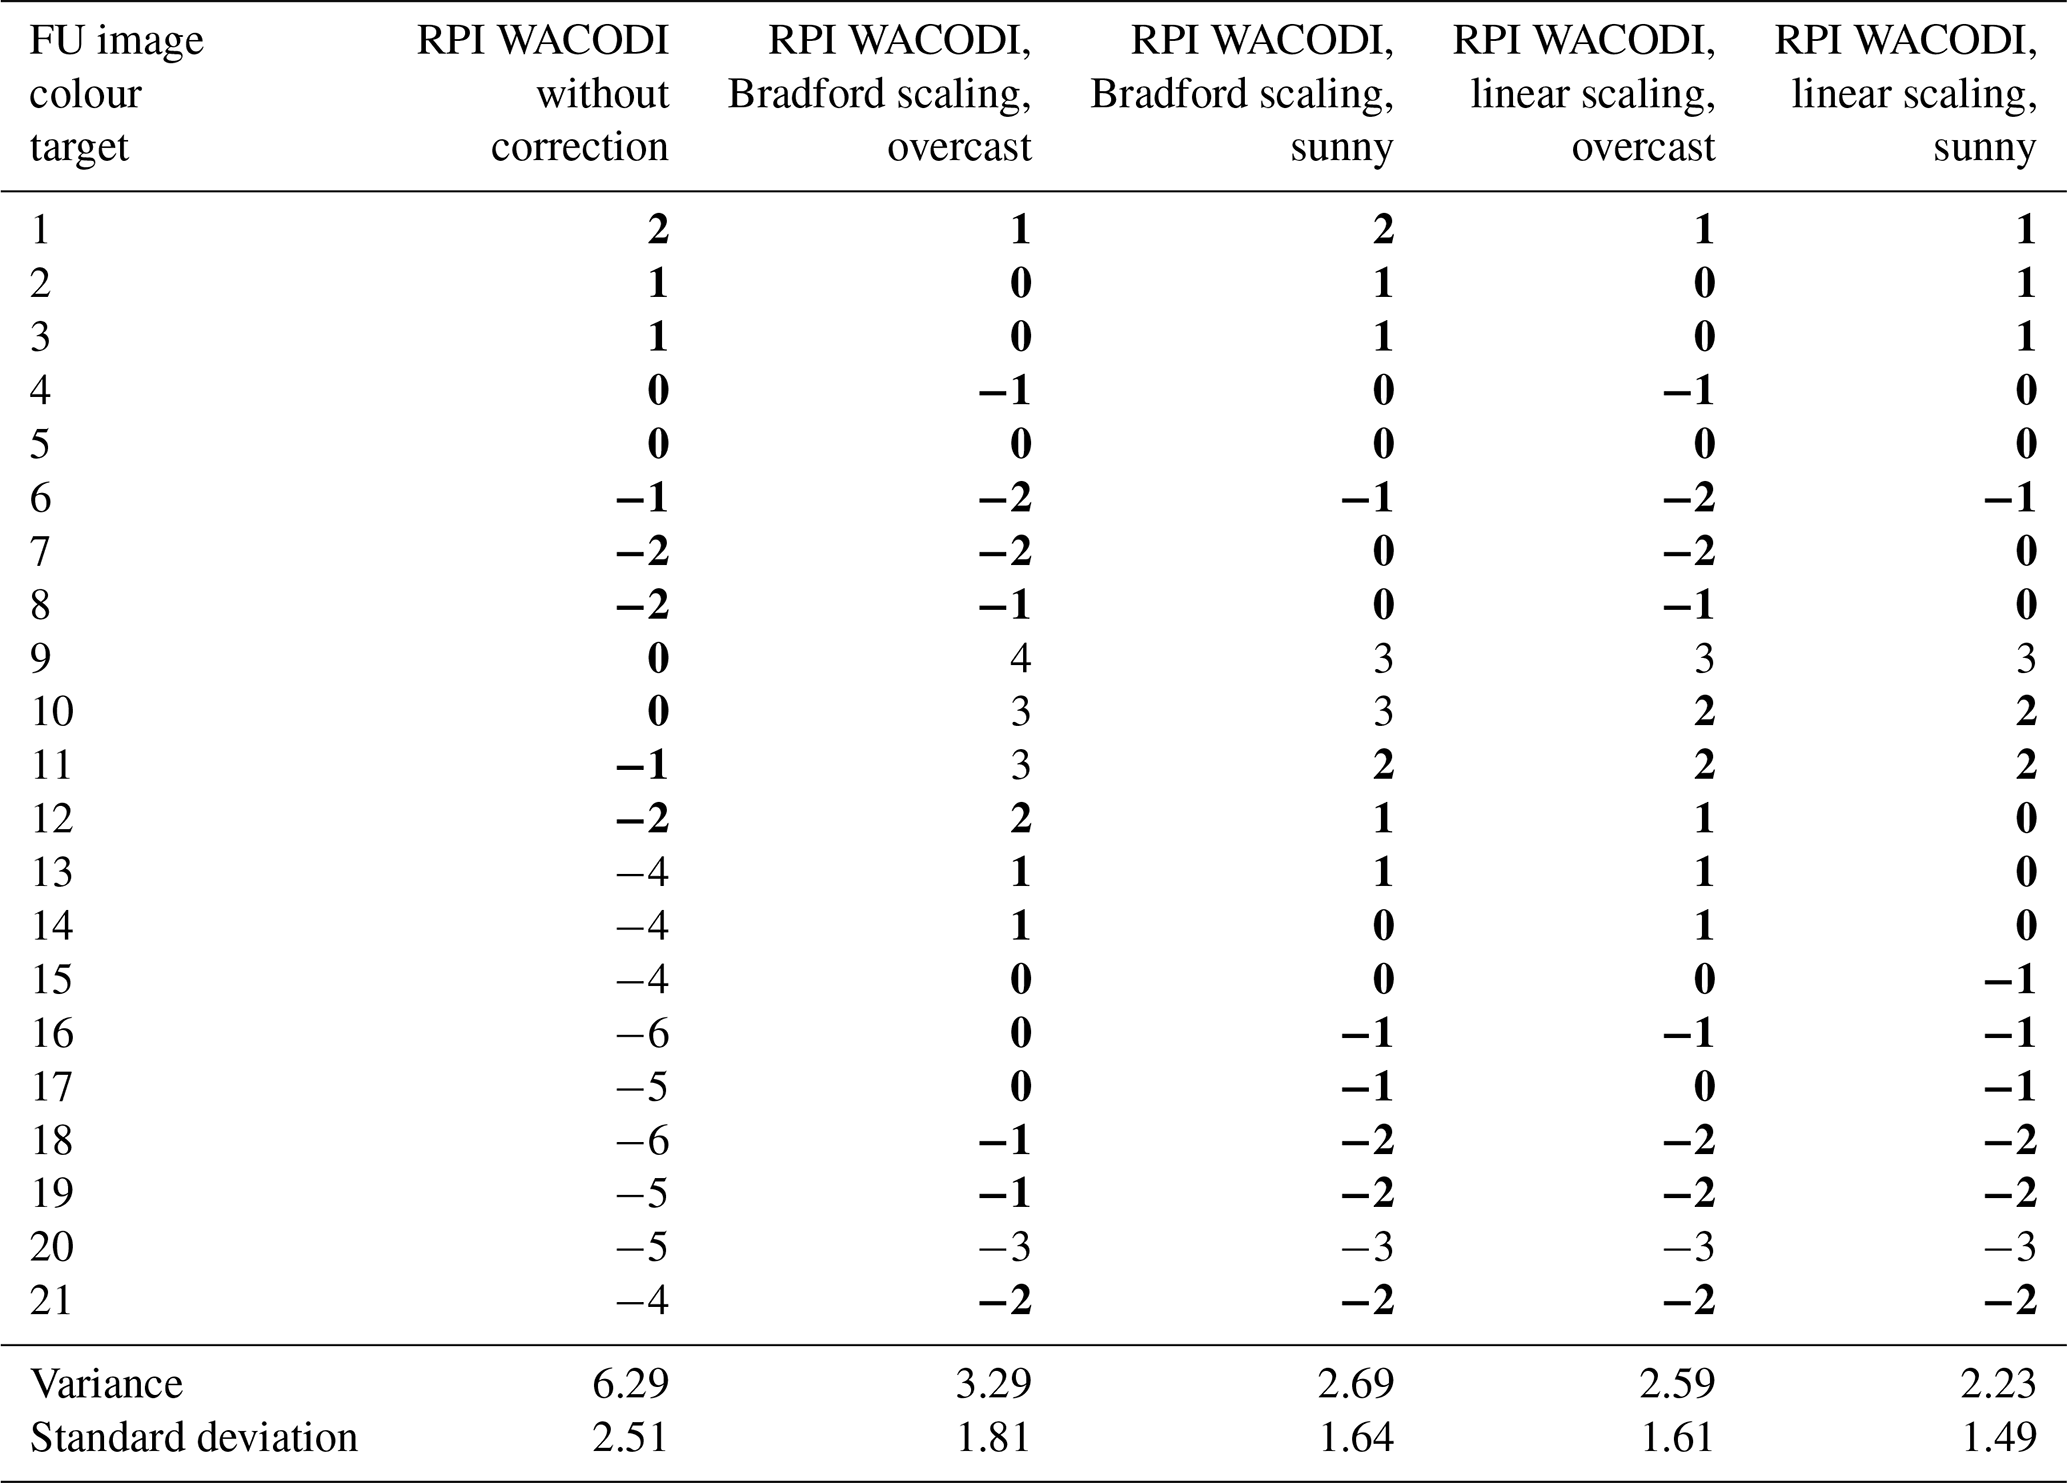
As part of the development process, initially only the implementation of the WACODI code in the system was examined to verify and evaluate the fundamental functionality of the software, irrespective and independent of a specific camera module hardware. To verify the fundamental functionality of the system, specifically the calculation of the Forel–Ule index from image data and the implementation of sky correction methods within the WACODI algorithm, a set of 21 synthetic FUI colour chart images, each with a resolution of 32 × 32 pixels, was utilised. The corresponding RGB values of such a synthetic FUI image file can be created and reproduced using any image editing software based on the existing RGB–FUI correlation table (Wernand et al., 2013b), making them completely independent of the connected camera hardware or environmental illumination conditions. As these synthetic images do not depict inhomogeneous illumination conditions, the computation of white-balance correction with the grey card was deactivated for this test. For the verification, different variants of the sky correction parameters, including ICM calculations (Bradford or linear scaling) and chromaticity coordinate correction parameters (cloudy or sunny conditions) were tested. These parameters, integrated into the fourth processing level (see Sect. 4.3) of the original WACODI code, result in four possible parameter sets for FUI calculation. Additionally, a fifth parameter result set (without correction) was determined, whereby all correction methods were deactivated. The results are presented in Table 1 and show the differences from the target FUI values along with the corresponding variance and standard deviation for each case. Ideally, the calculated differences should be as close to zero as possible. The findings indicate that the largest deviations from the target values occurred in the absence of any correction procedures. Methods employing ICM Bradford scaling and generic correction vectors for sunny or overcast conditions also exhibit higher deviations, particularly between FUI values of 9 and 12. In comparison, the use of linear scaling for the illumination correction matrix (ICM) and the application of correction vectors for sunny or overcast chromaticity coordinates reveal the smallest deviations from the target values. For any combination of the tested parameters, the FUI values of 9 and 20 remain outside of the desired tolerance range of ±2 FUI. As previously mentioned, these results represent interim steps in the development path.
Table 1Calculated FUI results for different standard colour correction methods (ICM; Bradford or linear) and correction vectors (sunny or overcast) for various (x, y) chromaticity coordinates implemented in the WACODI code at processing level 4. Values within the desired tolerance range of ±2 FUI are highlighted in bold.
5.2 Verification of the camera hardware and long-term effects under inhomogeneous illumination – test case 2
Once the basic software functionalities had been verified, the camera hardware was implemented during system integration. Test case 2 was conducted to compare various available Raspberry Pi camera modules for the system configuration and to observe the behaviour during operation over the course of the day under natural illumination conditions, without additional correction techniques by means of the reference grey card. For this purpose, both the Raspberry Pi HQ camera (12.3 MP, sensor type Sony IMX477) including a C-mount 16 mm telephoto lens for the HQ camera (PT3611614M10MP, CGL Electronic) and the Raspberry Pi V2 camera (8 MP, Sony IMX219 PQ CMOS image sensor in a fixed-focus module) were chosen. These cameras are compatible with all Raspberry Pi models and are widely used by the maker and scientific communities. Each of the two cameras was connected to a Raspberry Pi and used in parallel for image acquisition at the maximum resolution without an automatic white balance. Systematic investigations were carried out in a field test on 28 November 2021, local time in Germany, by means of comparative measurements under varying ambient illumination conditions through the use of Forel–Ule reference colour charts (FUI 4, FUI 11, and FUI 18). These colour charts, compiled within the Forel–Ule colour book (Kopelman, 2018) and produced from the existing RGB–FUI correlation table, represent the Forel–Ule colours as closely as possible. The two cameras were positioned with a field of view directed towards the reference colour charts with a tilt angle of 30° in a north-east orientation under sunny conditions. The data collection encompassed the time span from sunrise to sunset, thus yielding approximately 500 images during the 9 h observation period. Figure 9 depicts the temporal progression on the x axis and the calculated FUI on the y axis. The two subplots present the results for the reference targets with regard to FUI 4, FUI 11, and FUI 18. A distinction is drawn between the V2 camera (panel a) and the HQ camera (panel b). To determine the behaviour of the cameras in operation under natural illumination conditions, the relative results from both time series are compared in the following.
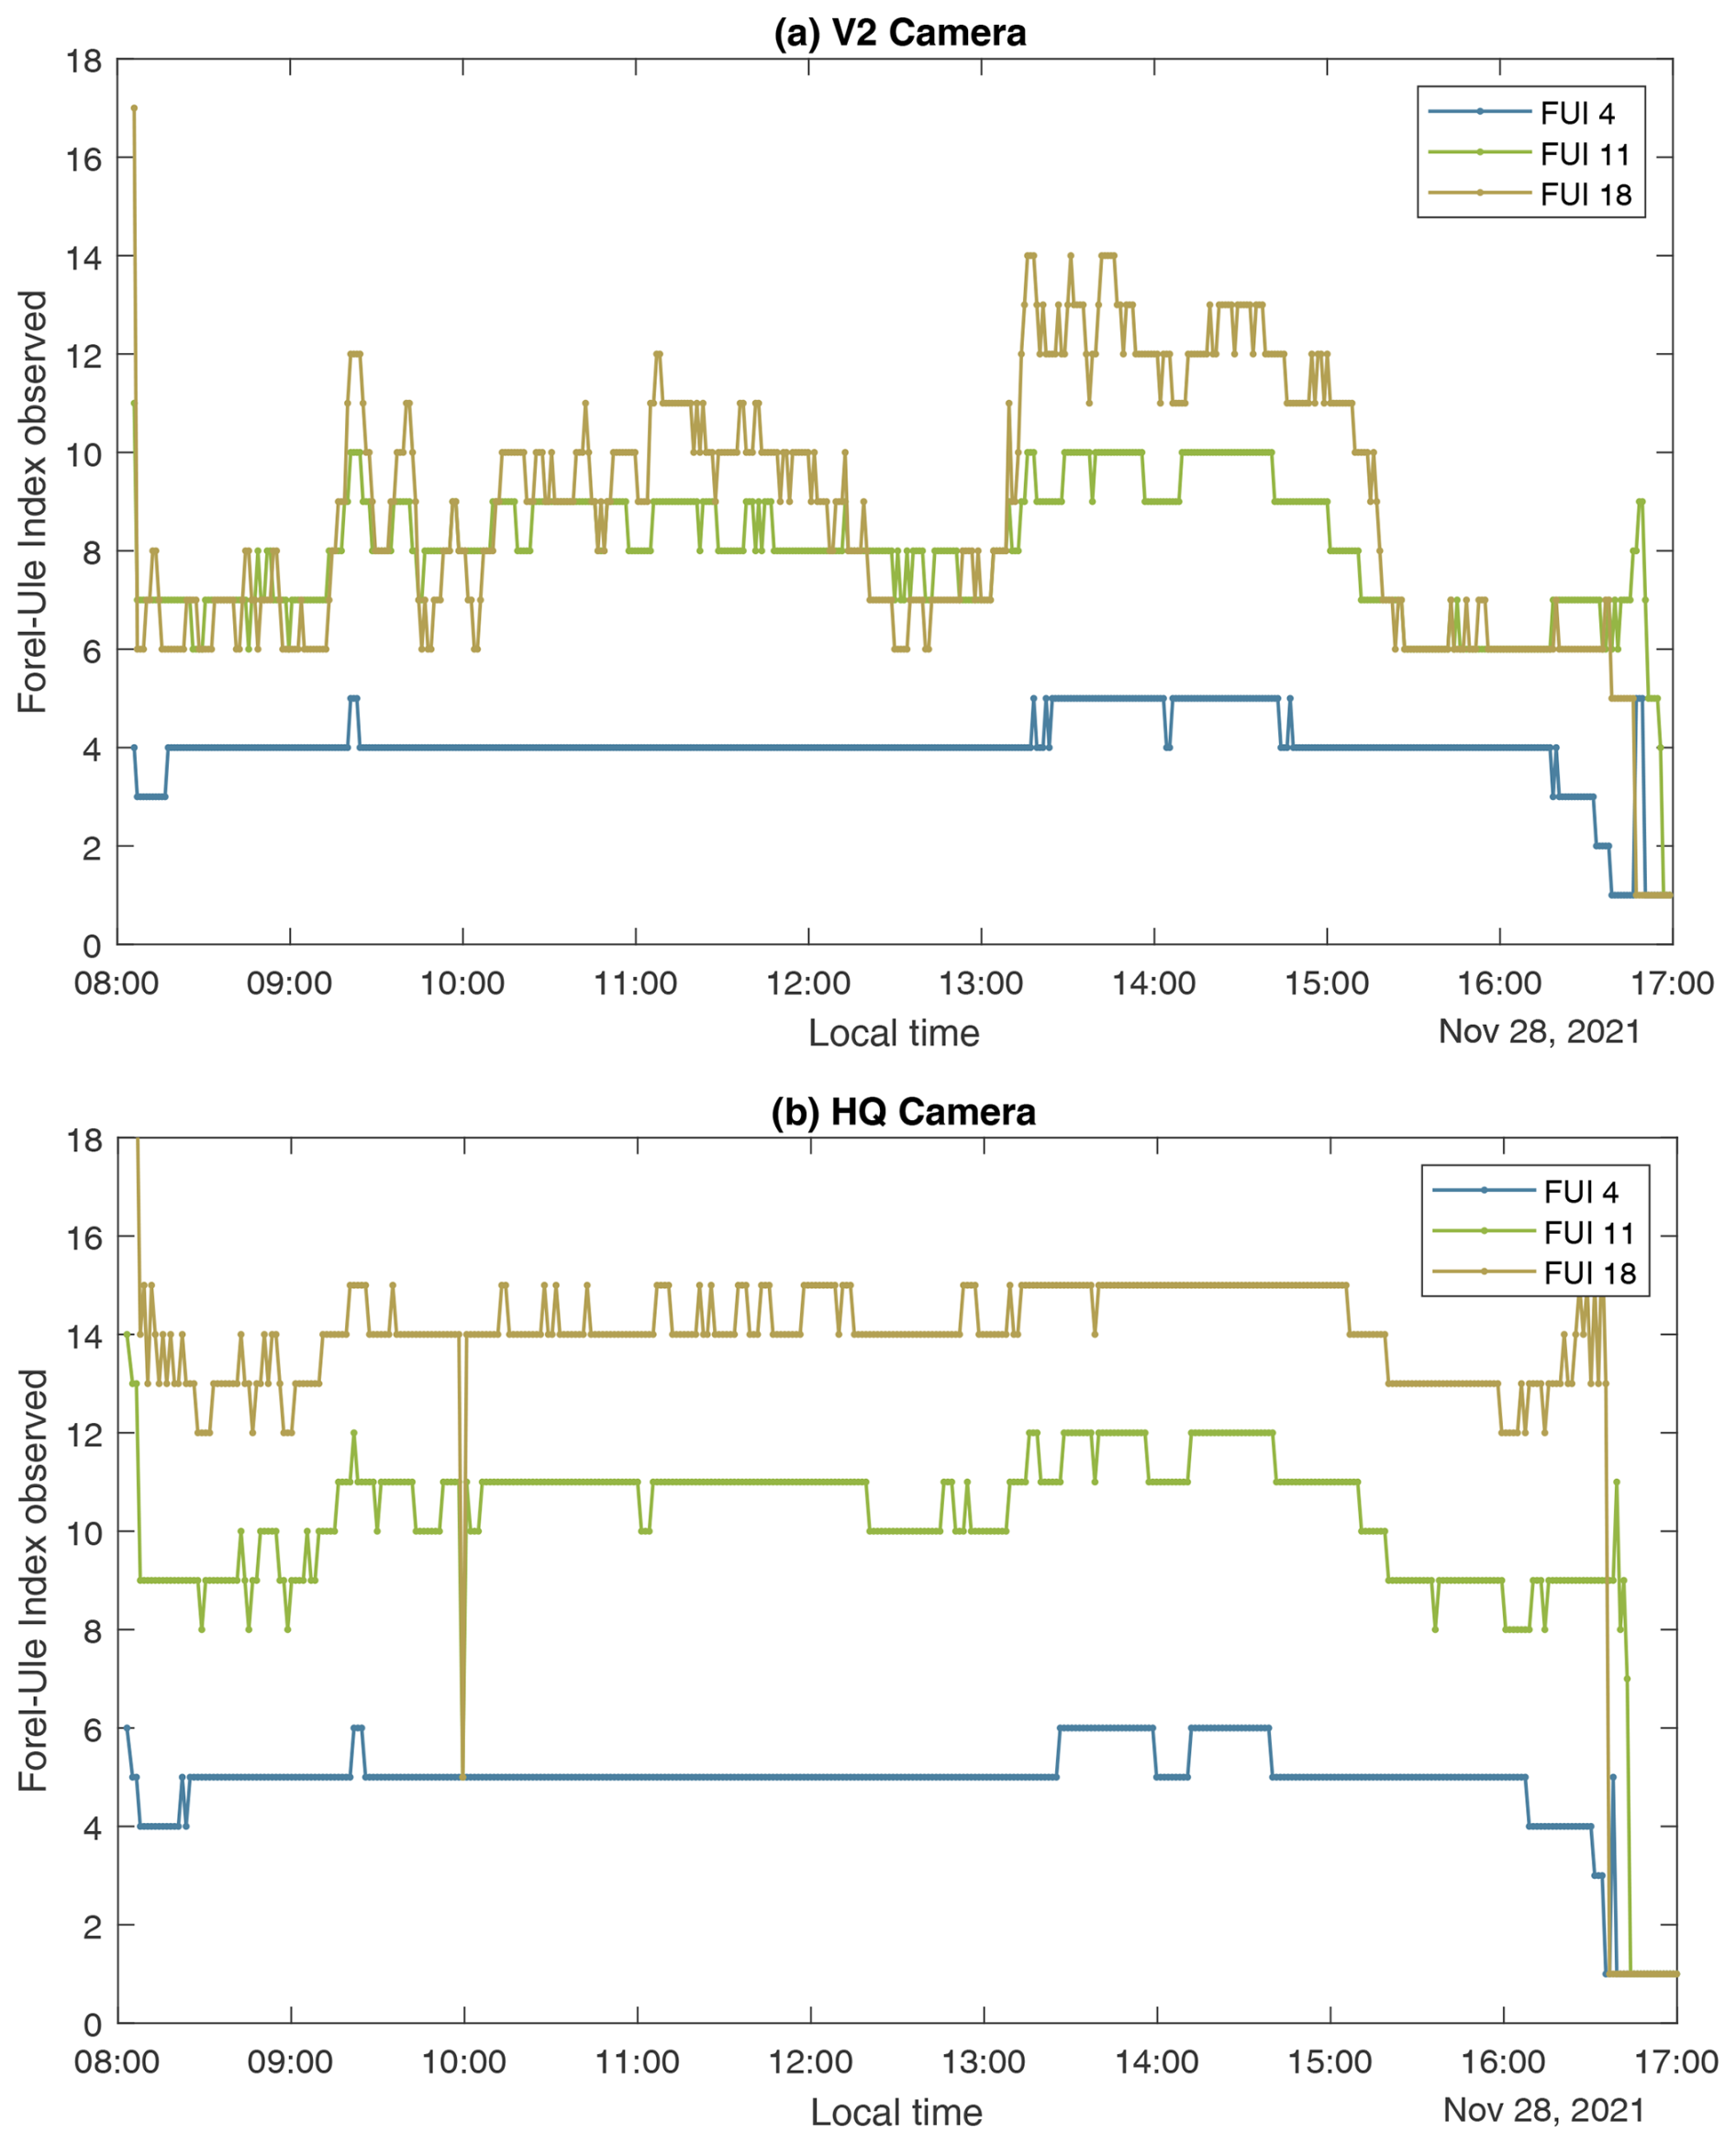
Figure 9Evaluation of two Raspberry Pi camera systems (V2 camera, a; HQ camera, b) using a time series of reference colour charts obtained under natural ambient illumination conditions.
The evaluation of image data from both camera models revealed that relative changes in the FUI occur throughout the day, largely due to variations in ambient illumination. Notably, fluctuations in FUI values are more pronounced for the V2 camera, especially for FUI 11 (up to 4 units) and FUI 18 (up to 8 units), while the HQ camera exhibits comparatively less fluctuation. A significant downward drift in all FUI values occurs around 16:30 LT as dusk approaches, indicating insufficient ambient illumination for effective image acquisition. This trend is particularly evident for the blue colour value (FUI 4), which otherwise exhibits minimal fluctuation. Finally, it was decided to use the HQ camera as the sensor for the RPI sensor system, and additional measurements regarding absolute measurement values were then conducted.
5.3 Verification of white-balance adaption under varying illumination conditions – test case 3
For the final implementation, test case 3 represents the full range of functions, including the applied illumination correction with the reference grey card. For the verification of the white-balance correction function, which is implemented in the second processing level, a reproducible laboratory experiment was carried out in which a ring light source with adjustable colour temperatures was used to vary ambient illumination conditions. The Raspberry Pi EOW camera and its bracket with the reference grey card were positioned centrally relative to the light source, such that the grey card appears in the lower portion of each captured image (Fig. 10). Images were acquired under different colour temperatures at 3200, 3900, 4600, and 5300 K for each of the 21 FUI reference colour values from the Forel–Ule colour book. The FUI of the resulting 84 image variations was evaluated for the white-balance colour correction with the grey-card reference values. Figure 11 presents the results of the laboratory experiment for each set of the four ambient light temperatures.
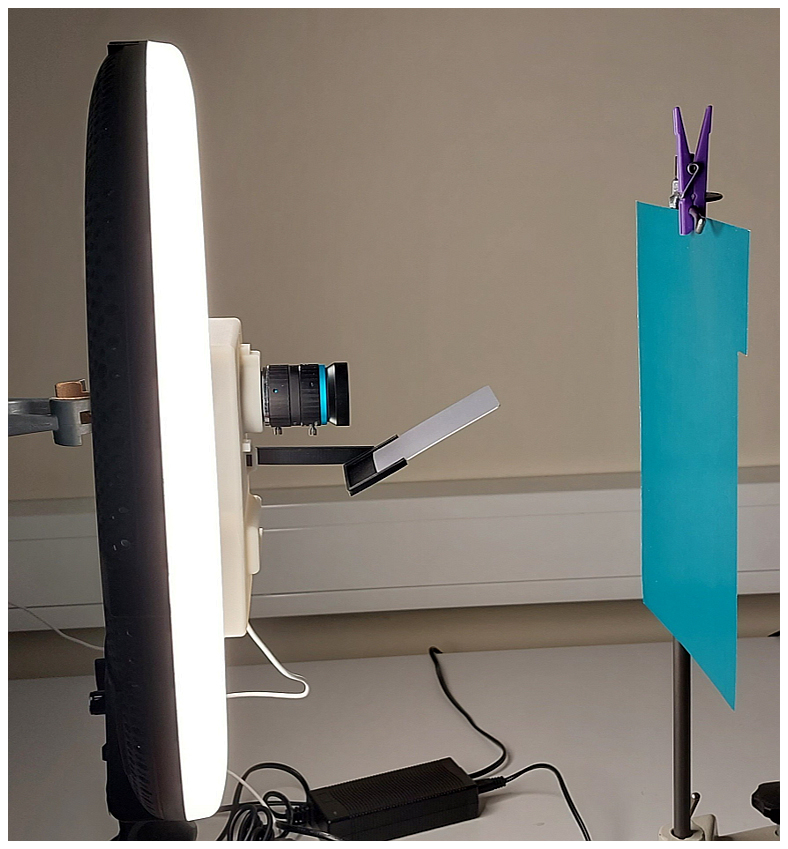
Figure 10The laboratory set-up used to determine the white-balance correction as a function of the ambient light temperature.
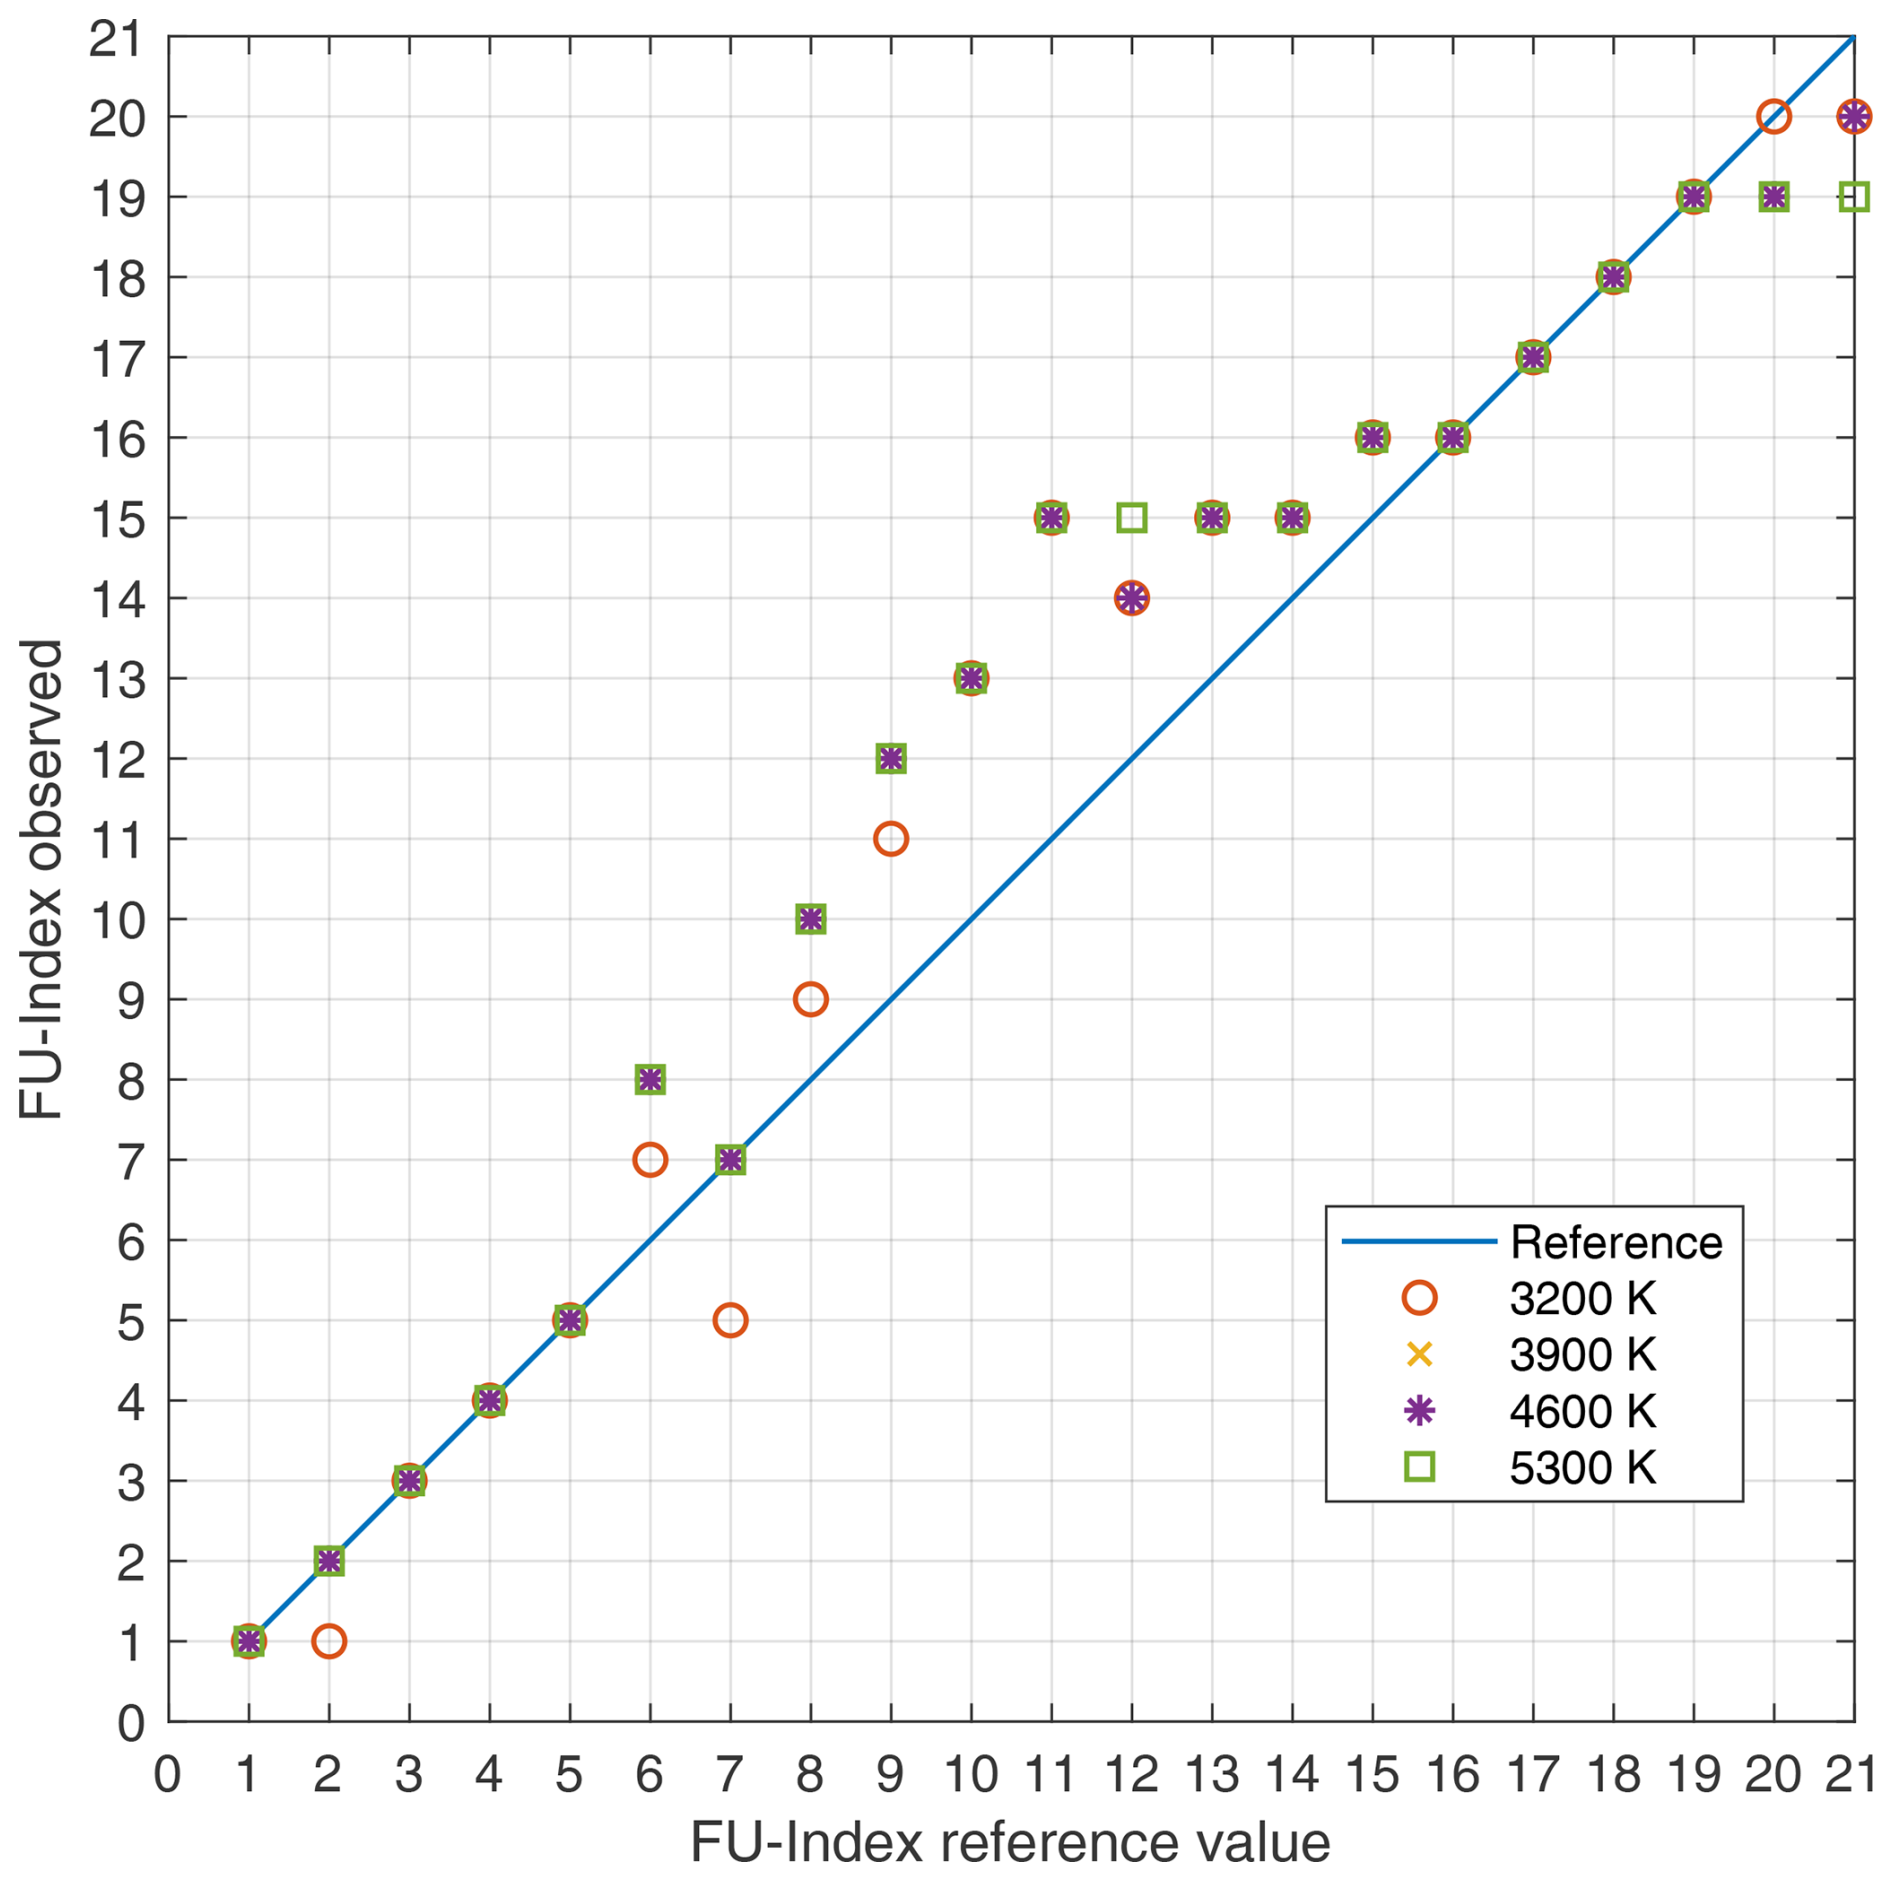
Figure 11Results of the measured Forel–Ule index (FUI) values in the laboratory test at different ambient light temperatures. On the ordinate, the measured FUI values are plotted against the reference FUI on the abscissa; the bisector shows the reference value.
For the purpose of this study, the results can be summarised as follows: the measurement data of 39 analysed images correlate with the assigned reference FUI value. A further 18 values deviate by 1 FUI, and 16 values deviate by 2 FUI, which means they are within the tolerable deviation range of ±2 FUI. For measurements of FUI 9, 10, and 11, a total of 11 measured values reveal greater deviations. By comparing identical colour value charts, only slight deviations are observed amongst the four differing light temperatures. Some exceptions were found for FUI 2 at 3200 K, FUI 6 at 3200 K, and FUI 21 at 5300 K, whereby identical FUI values differ from their counterparts at different colour temperatures. The FUI measurement series also reveals a systematic deviation from the known target value in the range between 6 and 14. The identification of FUI 9–12 proves insufficient, as they exceed the acceptable tolerance interval by 1 FUI unit. Apart from these exceptions, the FUI values determined for a particular colour value can be regarded as homogeneous under varying illumination conditions.
5.4 Validation of practical handling in the field – test case 4
The validation of the practical handling of the EOW–RPI sensor system was carried out using a field test in Germany on 8 May 2023 that took place near the port of Wilhelmshaven (53.515705° N, 8.143474° E) in a north-west orientation under slightly cloudy conditions. The water in this area is characterised by a deep, dark-brown hue, with an estimated FUI of approximately 20–21. As illustrated in Fig. 12, the commissioning process and on-site operation of the EOW system were straightforward and could be carried out with minimal technical effort. The ease of deployment highlights the system's suitability for field use, even by non-expert users. For the observation period, the system software was configured to sequentially capture three images during each 10 min measurement interval. The resulting data were subsequently analysed on a computer using the EOW data processing software. To compare these measurements, a calibrated hyperspectral radiometric reference system was operated simultaneously. This set-up recorded downwelling irradiance using a RAMSES SAM–ACC–VIS sensor, alongside sky-leaving radiance and upwelling radiance, both measured with RAMSES SAM–ARC–VIS sensors (Trios) with a tilt angle of approximately 40°. Radiometric measurements were analysed using MATLAB and the Forel–Ule–MERIS algorithm (Wernand et al., 2013a), which first calculates remote-sensing reflectance and subsequently determines the hue angle (αw) and the FUI. The radiometric measurement results can be regarded as true reference values, yielding a hue angle of 23.1° and an FUI of 21 for all samples collected during the observation period. Figure 13 presents the results from the field test using the EOW–RPI sensor system as a time series of hue angle measurements. The data reveal that the hue angles range from 11.5° to a maximum of 23.1°. According to the FUI–aw correlation table (Novoa et al., 2013), any hue angle below 24.418° corresponds to an FUI of 21. This threshold is delineated in the figure by a dashed dividing line and is indicated on the right-hand side by arrows representing the FUI assignments. The analysis of the EOW system measurements for this field application consistently yields an FUI of 21 across all measurement points. This finding is consistent with both the human perception of dark-brown water and the corresponding radiometric measurement data, thereby supporting its plausibility.
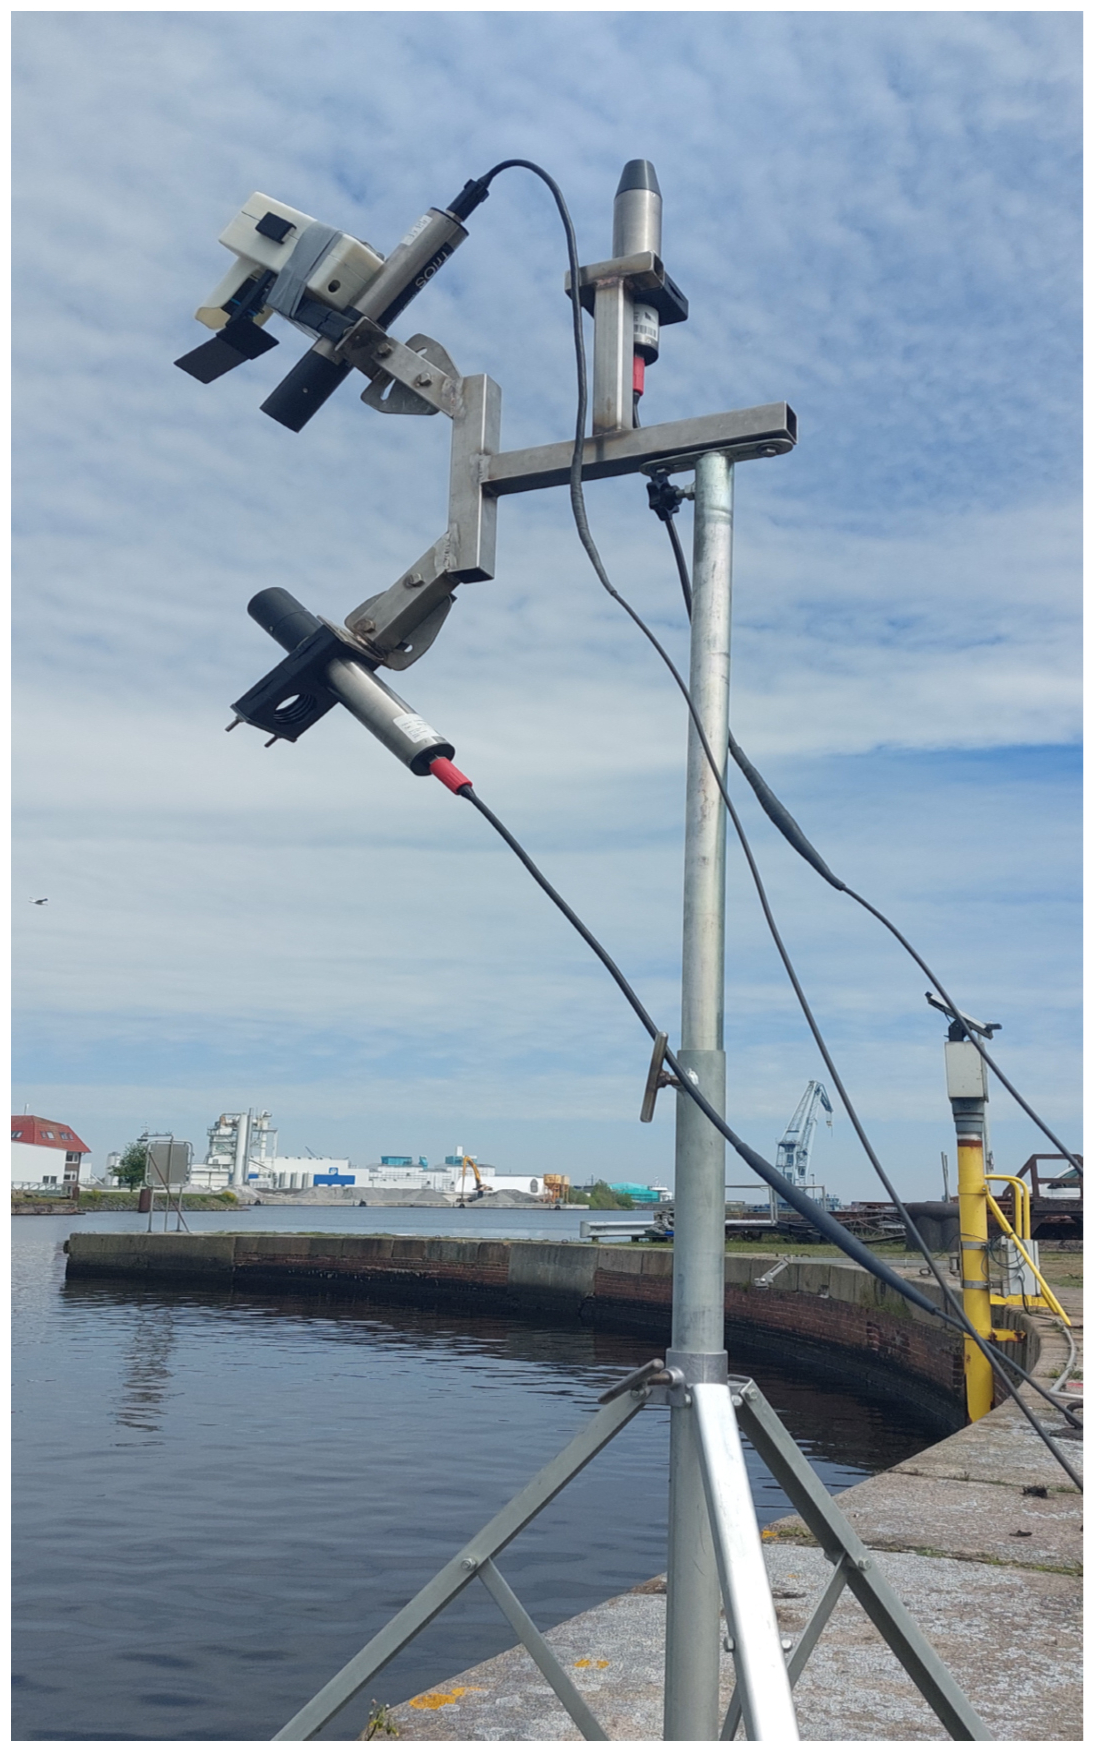
Figure 12System set-up for a practical handling study assessing the field deployment of the EOW–RPI sensor system integrated with a hyperspectral radiometric measurement system.
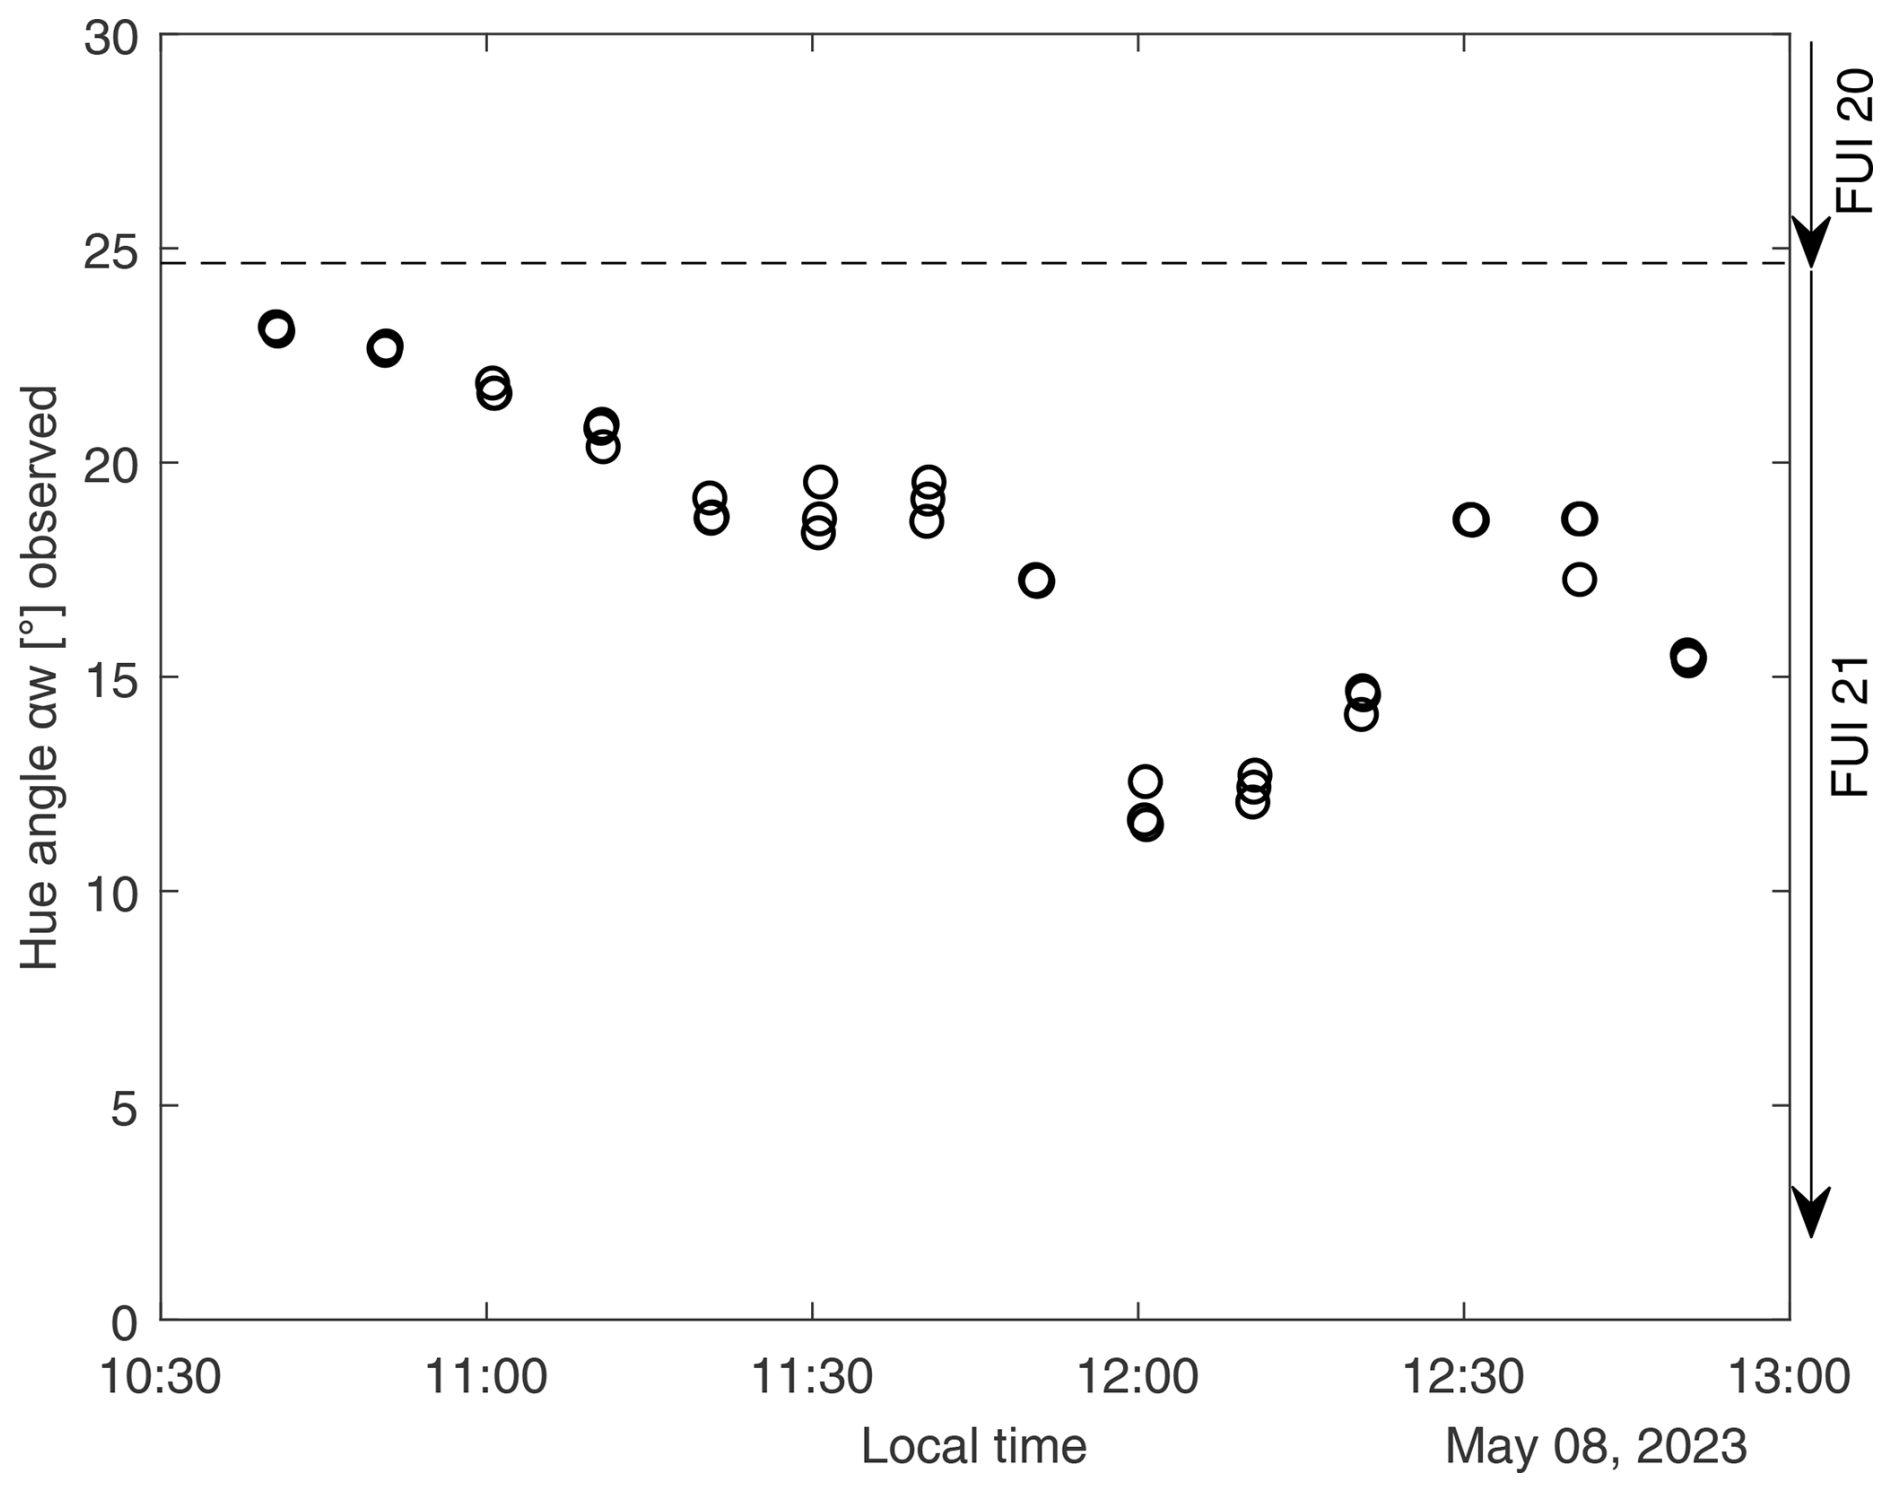
Figure 13Field test results presented as a time series of observed hue angles indicate that angles below 24.418° are associated with FUI 21, as delineated by a dashed dividing line and arrows indicating FUI assignments.
5.5 Evaluation discussion
In summary, the results of test case 1 indicate that the chromatic adaptation method combining linear scaling and the sunny option yields the lowest deviations in the FUI within our implementation of the illumination correction matrix for the WACODI code. Furthermore, it was confirmed that the fundamental functions for FUI calculation across all processing levels have been successfully implemented in our system and that these functions lead to plausible and comprehensible results. Test case 2, which examined the absolute FUI units determined from images obtained by both camera models, revealed systematic offsets between the expected and measured values. Any further interpretation of the presented, purely quantitative results from this test case, which was carried out at an early stage of development of the system and without active white-balance correction, will be limited. Regarding the stability of image data acquisition under varying illumination conditions, it was found that the results obtained with the HQ camera are more consistent than those of the V2 camera. The laboratory experiment conducted in test case 3 demonstrated that the influence of ambient illumination can be reduced by using a reference grey card and via the adaptation of the white-balance correction for each individual image. Some FUI measurement series still show systematic deviations from the target value, which could not be completely resolved during system development. The investigations focussed on verifying the basic functionality and extending the white-balance calibration at the image data processing level. Finally, the application study demonstrated that user-friendly handling is possible in the field. Compared to the radiometric measurement data, the results of the FUI units of the natural water colour showed good agreement. In the field environment, natural environmental factors led to fluctuations in the observed hue angle. The absolute deviation between the best and average hue angle should be less than 10° to achieve the highest quality (Malthus et al., 2020). Relative change of up to 11.6 units was observed in the field test. Hence, an accuracy of ±2 FUI units targeted for the EOW sensor system is specified as a realistically achievable target value.
At the current stage of development, the WACODI code and all incorporated correction coefficients, except for the linear scaling of the illumination correction matrix, have been implemented without any further adjustments. Thus, for further developments in order to overcome the systematic deviations obtained in test case 3 of the EyeOnWater RPI sensor system, it would be promising to individually optimise details of the image data processing with the WACODI code, in particular the chromatic adaptation and the gamma correction. This would have to be realised in conjunction with the applied camera hardware to consider a specific spectral response of the HQ camera in combination with the camera lens, which might be the underlying reason for the observed systematic deviations. For colour adaptation, which is calculated to derive the intrinsic colour vector by applying the illumination correction matrix, individual values of the cone response matrix would have to be determined; thus, significant changes in the overlapping area of the red–green band can be taken into account.
Further, the implementation of an individual absolute radiometric calibration coefficient, created for this specific sensor combination for each RGB channel, would facilitate the conversion of the digital number of pixel values captured by the camera into engineering units of radiance on an individual basis. To preserve such a radiometric calibration of the Raspberry Pi camera, periodic evaluations are required. The calibration interval is contingent upon the desired radiometric precision, camera functionality, and operating conditions. In this context, a comprehensive study on the use and calibration of the Raspberry Pi 3 V2 camera module was published by Pagnutti et al. (2017).
With the pursued interdisciplinary approach for the development of a new automated optical sensor system to measure and classify natural water colour based on the Forel–Ule scale, a system concept of the EyeOnWater RPI was developed and prototypically implemented based on the handling concept for the construction and operation for citizen science. Within the framework of this project, it was possible to prepare comprehensive, freely available documentation for the reproduction of the EyeOnWater RPI. During the discussion of results, it became apparent that some of the measured FUI values deviated systematically from the target value. To address these systematic deviations, further adjustments to the parameters of the WACODI code, particularly the chromatic adaptation of the intrinsic colour vector and gamma correction, should be further investigated. The extensive image datasets in the EOW database can serve as a valuable training resource for this purpose. For long-term stationary deployments or mobile applications, additional application-specific field studies are necessary. In conjunction with this purpose, migrating the EOW sensor system towards to the latest Raspberry Pi operating system “Bookworm” would represent a step forward. Beyond this, optional extensions with wide-angle optics are also conceivable. A wider field of view has the potential to complement the sensor system as part of new remote-sensing operations or structural monitoring applications. Collectively, the data collected by EyeOnWater using the Raspberry Pi can help to improve the knowledge base for research in the fields of limnology and oceanology. The versatile use of the measuring instruments based on the Forel–Ule system and the documentation of these data also help to identify the right areas of focus for a more detailed study of the hydrosphere and ecosystems.
The project code and hardware model and the sensor system project documentation are publicly accessible at https://doi.org/10.5281/zenodo.13828687 (Rüssmeier and Becker, 2024). All contributions to every aspect of the EyeOnWater RPI sensor system are welcome. The sensor data presented in this paper are available upon request from the corresponding author. Finally, conducted measurements from the community are hosted by MARIS B.V., the Netherlands, and made fully accessible at https://www.eyeonwater.org (MARIS B.V., 2024b).
NR was responsible for the main study concept and architecture and designed and wrote the paper, with contributions from all authors. FS reviewed and edited the manuscript. FB contributed to data model engineering, model implementation and technical documentation, and reference measurement and verification.
The contact author has declared that none of the authors has any competing interests.
Publisher's note: Copernicus Publications remains neutral with regard to jurisdictional claims made in the text, published maps, institutional affiliations, or any other geographical representation in this paper. While Copernicus Publications makes every effort to include appropriate place names, the final responsibility lies with the authors.
This article is part of the special issue “Sensors and Measurement Systems 2024”. It is a result of the 22. GMA/ITG Fachtagung Sensoren und Messsysteme 2024, Nuremberg, Germany, 11 to 12 June 2024.
The authors would like to thank Jochen Wollschläger (University of Oldenburg, ICBM) for his support of the project, including insightful discussions about the statistical model and provision of the reference measurement set-up to verify the model. We are also grateful to the student team, for their support during the project; Julian Lührs, for advancements of the WACODI code and contributions to the practical field test; and Dirk Frerichs, for the development of the user interface. We acknowledge support from the DFKI Niedersachsen (DFKI NI), the Lower Saxony Ministry of Science and Culture, and the Volkswagen Foundation (“zukunft.niedersachsen”; grant no. ZN4365). We would also like to express our sincere gratitude to the authors of the original WACODI code (Novoa et al., 2015) (https://bitbucket.csiro.au/projects/ASC/repos/wacodi/browse, last access: 25 September 2024). Finally, the authors are thankful for the constructive dialogue and commitment of the https://www.eyeonwater.org/ (last access: 25 September 2024) website development team (MARIS B.V., the Netherlands) with respect to their contribution to the EyeOnWater Internet of Things API.
This work was supported by the Jade University of Applied Sciences within the framework of a research fund project and the Open Access Publishing Program.
This paper was edited by Rainer Tutsch and reviewed by two anonymous referees.
Ceccaroni, L., Piera, J., Wernand, M. R., Zielinski, O., Busch, J. A., Van Der Woerd, H. J., Bardaji, R., Friedrichs, A., Novoa, S., Thijsse, P., Velickovski, F., Blaas, M., and Dubsky, K.: Citclops: A next-generation sensor system for the monitoring of natural waters and a citizens' observatory for the assessment of ecosystems' status, PLOS One, 15, e0230084, https://doi.org/10.1371/journal.pone.0230084, 2020.
Garaba, S. P., Schulz, J., Wernand, M. R., and Zielinski, O.: Sunglint detection for unmanned and automated platforms, Sensors, 12, 12545–12561, https://doi.org/10.3390/s120912545, 2012.
Goddijn-Murphy, L., Dailloux, D., White, M., and Bowers, D.: Fundamentals of in situ digital camera methodology for water quality monitoring of coast and ocean, Sensors, 9, 5825–5843, https://doi.org/10.3390/s90705825, 2009.
Ibrahim, A., Franz, B., Bailey, S., Werdell, J., Ahmad, Z., and Mobley, C.: Remote sensing reflectance, Goddard Space Flight Center, https://doi.org/10.5067/FQBB0C1K43OJ, 2024.
Kirk, J. T. (Ed.): Light and photosynthesis in aquatic ecosystems, 3rd edn., Cambridge University Press, https://doi.org/10.1017/CBO9781139168212, 2010.
Kopelman, I.: Indexing Water, Notes on Representation, Vol. 9, Roma Publication, Amsterdam, Netherlands, ISBN-13: 9789492811332, 2018.
Kopf, A., Bicak, M., Kottmann, R., et al.: The ocean sampling day consortium, GigaScience, 4, 1–5, https://doi.org/10.1186/s13742-015-0066-5, 2015.
Leeuw, T.: HydroColor: Water Quality App, Version 2.3, App Store [mobile app], https://apps.apple.com/de/app/hydrocolor-water-quality-app/id816427169, last access: 25 September 2024.
Leeuw, T. and Boss, E.: The HydroColor app: Above water measurements of remote sensing reflectance and turbidity using a smartphone camera, Sensors, 18, 256, https://doi.org/10.3390/s18010256, 2018.
Malthus, T. J., Ohmsen, R., and Woerd, H. J. V. D.: An evaluation of citizen science smartphone apps for inland water quality assessment, Remote Sens., 12, 1578, https://doi.org/10.3390/rs12101578, 2020.
MARIS B.V.: EyeOnWater – Colour, Version 2.6.1, App Store [mobile app], https://apps.apple.com/de/app/eyeonwater-colour/id1021542366, last access: 25 September 2024a.
MARIS B.V., EyeOnWater – Colour [database], https://www.eyeonwater.org/observations, last access: 25 September 2024b.
Novoa, S., Wernand, M. R., and Van der Woerd, H. J.: The Forel–Ule scale revisited spectrally: preparation protocol, transmission measurements and chromaticity, J. Eur. Opt. Soc.-Rapid, 8, 13057, https://doi.org/10.2971/jeos.2013.13057, 2013.
Novoa, S., Wernand, M. R., and Van der Woerd, H. J.: The modern Forel–Ule scale: a 'do–it–yourself' colour comparator for water monitoring, J. Eur. Opt. Soc.-Rapid, 9, 14025, https://doi.org/10.2971/jeos.2014.14025, 2014.
Novoa, S., Wernand, M., and van der Woerd, H. J.: WACODI: A generic algorithm to derive the intrinsic color of natural waters from digital images, Limnol. Oceanogr.-Meth., 13, 697–711, https://doi.org/10.1002/lom3.10059, 2015.
Pagnutti, M., Ryan, R. E., Cazenavette, G., Gold, M., Harlan, R., Leggett, E., and Pagnutti, J.: Laying the foundation to use Raspberry Pi 3 V2 camera module imagery for scientific and engineering purposes, J. Electron. Imaging, 26, 013014–013014, https://doi.org/10.1117/1.JEI.26.1.013014, 2017.
Pitarch, J., van der Woerd, H. J., Brewin, R. J., and Zielinski, O.: Optical properties of Forel–Ule water types deduced from 15 years of global satellite ocean color observations, Remote Sens. Environ., 231, 111249, https://doi.org/10.1016/j.rse.2019.111249, 2019.
Pitarch, J.: A review of Secchi's contribution to marine optics and the foundation of Secchi disk science, Oceanography, 33, 26–37, https://doi.org/10.5670/oceanog.2020.301, 2020.
Rüssmeier, N. and Becker, F.: Eye on Water RPI: a Do It Yourself maker sensor system project to measure and classify natural water colors based on Forel Ule, Version v1.0, Zenodo [code], https://doi.org/10.5281/zenodo.13828687, 2024.
Rüssmeier, N., Wollschläger, J., and Becker, F.: Eye on Water RPI – ein Do It Yourself maker Sensorsystem Projekt zur Messung von Wasserfarben für Citizen Science, in: Proceedings of the 22. ITG/GMA–Fachtagung Sensoren und Messsysteme 2024, Nürnberg, Germany, 11–12 June 2024, 438–445, ISBN 978-3-910600-01-0, 2024.
Stöckli, R.: NASA images based on data from NASA and NOAA (Instrument: Terra – MODIS – Earth Observatory): https://earthobservatory.nasa.gov/images/8108/twin-blue-marbles (last access: 25 September 2024), 2007.
Verein Deutscher Ingenieure: VDI/VDE 2206:2021–11–Development of Mechatronic and Cyber–Physical Systems, Beuth, Berlin, Germany, 2021.
Wernand, M. R., Hommersom, A., and van der Woerd, H. J.: MERIS-based ocean colour classification with the discrete Forel–Ule scale, Ocean Sci., 9, 477–487, https://doi.org/10.5194/os-9-477-2013, 2013a.
Wernand, M. R., van der Woerd, H. J., and Gieskes, W. W.: Trends in ocean colour and chlorophyll concentration from 1889 to 2000, worldwide, PLOS one, 8, e63766, https://doi.org/10.1371/journal.pone.0063766, 2013b.
Wernand, M.: The EyeOnWater concept: Marine observations via participative science, in: Proceedings of the IMDIS 2016, 11–13 October 2016, Gdansk, Poland, B. Geofis. Teor. Appl., 57, 228–230, ISSN 0006-6729, 2016.
- Abstract
- Introduction
- Related work and underlying methods
- Proposed solution and approach for an automatic optical sensor system
- Design and system integration of the EyeOnWater Raspberry Pi
- Evaluation and discussion of the EyeOnWater RPI system
- Conclusions and outlook
- Code and data availability
- Author contributions
- Competing interests
- Disclaimer
- Special issue statement
- Acknowledgements
- Financial support
- Review statement
- References