the Creative Commons Attribution 4.0 License.
the Creative Commons Attribution 4.0 License.
 | 18 Feb 2025
Enhancing human–robot collaboration with thermal images and deep neural networks: the unique thermal industrial dataset WLRI-HRC and evaluation of convolutional neural networks
Katrin-Misel Ponomarjova
Thomas M. Wendt
Stefan J. Rupitsch
This contribution introduces the use of convolutional neural networks to detect humans and collaborative robots (cobots) in human–robot collaboration (HRC) workspaces based on their thermal radiation fingerprint. The unique data acquisition includes an infrared camera, two cobots, and up to two persons walking and interacting with the cobots in real industrial settings. The dataset also includes different thermal distortions from other heat sources. In contrast to data from the public environment, this data collection addresses the challenges of indoor manufacturing, such as heat distortions from the environment, and allows for it to be applicable in indoor manufacturing. The Work-Life Robotics Institute HRC (WLRI-HRC) dataset contains 6485 images with over 20 000 instances to detect. In this research, the dataset is evaluated for implementation by different convolutional neural networks: first, one-stage methods, i.e., You Only Look Once (YOLO v5, v8, v9 and v10) in different model sizes and, secondly, two-stage methods with Faster R-CNN with three variants of backbone structures (ResNet18, ResNet50 and VGG16). The results indicate promising results with the best mean average precision at an intersection over union (IoU) of 50 (mAP50) value achieved by YOLOv9s (99.4 %), the best mAP50-95 value achieved by YOLOv9s and YOLOv8m (90.2 %), and the fastest prediction time of 2.2 ms achieved by the YOLOv10n model. Further differences in detection precision and time between the one-stage and multi-stage methods are discussed. Finally, this paper examines the possibility of the Clever Hans phenomenon to verify the validity of the training data and the models’ prediction capabilities.
- Article
(2667 KB) - Full-text XML
- BibTeX
- EndNote


The expectation is that humans and robots will be able to work together without compromising efficiency or safety as collaborative robots (cobots) take on a larger role in manufacturing (Proia et al., 2022). An important trend is human–robot co-working in manufacturing, where the human-collaborative production process will lead to efficient qualitative production (Khosravy et al., 2024). Therefore, robots and cobots must be able to detect humans to collaborate with them. Another emerging trend is the use of autonomous mobile robots (AMRs) potentially with mounted cobots to create dynamic and collaborative workspaces. Some of the challenges in the use of AMRs are dynamic obstacle avoidance, autonomous navigation and path planning (Alatise and Hancke, 2020). Differentiating between humans and robots can lead to increased safety and efficiency in collaborative, dynamic and smart workplaces. Robots must slow down or stop in a dangerous situation when humans are approaching. In the case of approaching AMRs or automated guided vehicles, there is no need to slow down or even stop. Consequently, it is important to know the features of a human to distinguish them from robots or other objects.
This contribution deals with the possibilities of the detection and differentiation between humans and cobots in collaborative workspaces based on their thermal radiation power with the help of convolutional neural networks (CNNs). For this, a new dataset of infrared images in the human–robot collaboration (HRC) workspace was created and attributed to the necessity of data in the manufacturing environment. We examined the dataset and the possible approaches of detecting and differentiating between humans and robots using different types of CNNs such as one-stage and multi-stage detectors.
Fraden (2016) provides an overview of methods to detect human presence. One promising approach is to measure the thermal radiation of humans. Previous work (Himmelsbach et al., 2023) has shown that low-resolution infrared sensors (32×32 px) can detect a human in infrared images using CNNs such as GoogLeNet and MobileNetV2 with up to 99.48 % accuracy. Interfering heat sources are not considered. In addition, the detection of the cobot is another important piece of information in the image to enable further collaboration between humans and cobots. Interfering heat sources in real manufacturing environments and cobots as additional information were considered and evaluated. The most commonly used public datasets for pretraining models are MS COCO (Lin et al., 2015), Pascal VOC (Everingham et al., 2010) and ImageNet (Russakovsky et al., 2015). These datasets do not contain images based on the radiation power of objects. The literature provides multiple datasets in the case of infrared images. There exist published datasets for autonomous cars or robots in public environments (Hanson et al., 2023; Lee et al., 2022) or human presence detection and surveillance in public areas (Noh et al., 2023; Xu et al., 2024; Gebhardt and Wolf, 2018; Maningo et al., 2023). However, there is a need to obtain specific data in order to be able to use infrared cameras in manufacturing environments with robot applications.
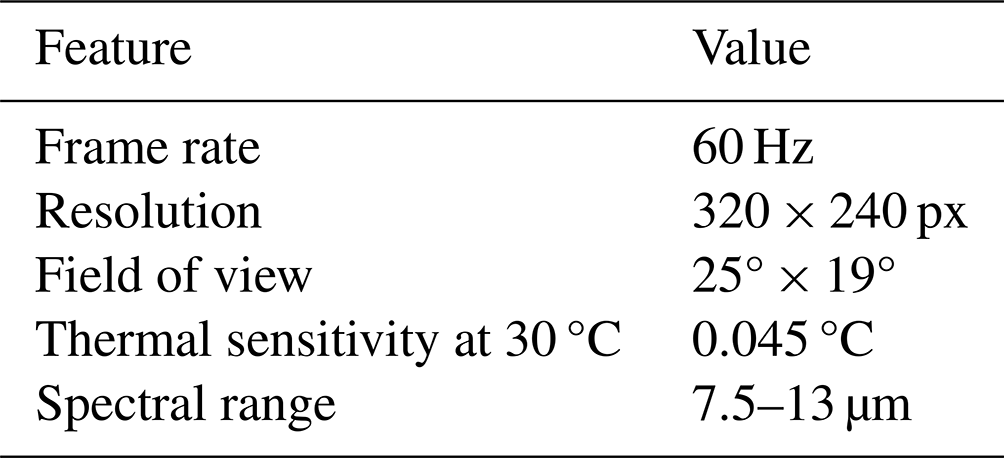
An infrared sensor is needed to gain environmental information about thermal radiation. We selected a FLIR T440 camera to collect data and detect the presence of cobots and humans. The specifications of this infrared camera are listed in Table 1. Training and testing of the CNNs was performed on a Windows 10 system. The system has a 10-core central processing unit (CPU), 64 GB of RAM, and an NVIDIA RTX3080 with 12 GB of integrated graphics processing unit (GPU) memory. Extracting and processing information from the collected infrared images requires computer vision techniques with object detection algorithms. The main task of object detection is to find all interesting objects in the image and determine their positions and sizes, which is also one of the core problems in computer vision (Shf and Zhao, 2020). In 2012, deep convolutional neural networks (DNNs) had a resurrection and were able to represent an image robustly at a high level and detect objects in it. With the introduction of DNNs in object detection, two fields of detectors started to develop, two-stage detectors and one-stage detectors (Zou et al., 2023). The two-stage method generally achieves higher classification and positioning accuracy, while the one-stage method achieves faster predictions (Shf and Zhao, 2020). The main difference is that the two-stage algorithms divide the object detection into two tasks. First, they perform a selective search, where they extract regions of the image (region proposals), and these region proposals are fed into a CNN for further classification. This method was initially proposed by Girshick et al. (2014) in the year 2014, with the algorithm named Regional-CNN (R-CNN). The algorithm was further improved in 2015 with the development of Fast R-CNN (Girshick, 2015). In the same year, the authors of Ren et al. (2015) proposed Faster R-CNN (F-R-CNN), which is an optimized version of R-CNN and tackles the problem of detection speed by getting closer to real-time detection. In this research, the F-R-CNN as a two-stage algorithm was used because real-time capability is critical in HRC. In contrast to the two-stage method, the one-stage algorithm predicts the probability of a category and the position of the object simultaneously without any region proposals, but it suffers in accuracy with small or dense objects (Han, 2022). In 2014, Redmon et al. (2016) proposed the You Only Look Once (YOLO) model with real-time detection capabilities. Since then, the first author has released two improved versions, YOLO9000 (Redmon and Farhadi, 2017) and YOLOv3 (Redmon and Farhadi, 2018). The latest versions are YOLOv5 (Ultralytics, 2021), YOLOv8 (Varghese and M., 2024), and the two algorithms published in 2024 – YOLOv9 (C.-Y. Wang et al., 2024) and YOLOv10 (A. Wang et al., 2024). An advantage of the YOLO versions after YOLOv3 is the scalability in the size of the models, which allows for the consideration of the trade-off between the higher accuracy of larger models and the faster processing time of smaller models.
The presented algorithms, YOLOv5, YOLOv8, YOLOv9 and YOLOv10, with different model sizes, nano (n) or tiny (t), the equivalent to nano in YOLOv9, small (s) and medium (m), as well as the F-R-CNN algorithm with two different backbone structures, VGG16 (Simonyan and Zisserman, 2015) and ResNet in two layer-count sizes, ResNet18 (He et al., 2016a) and ResNet50 (He et al., 2016b), are implemented in this research to evaluate the unique infrared dataset of the industrial environment and are compared to each other regarding their detection performance and speed.
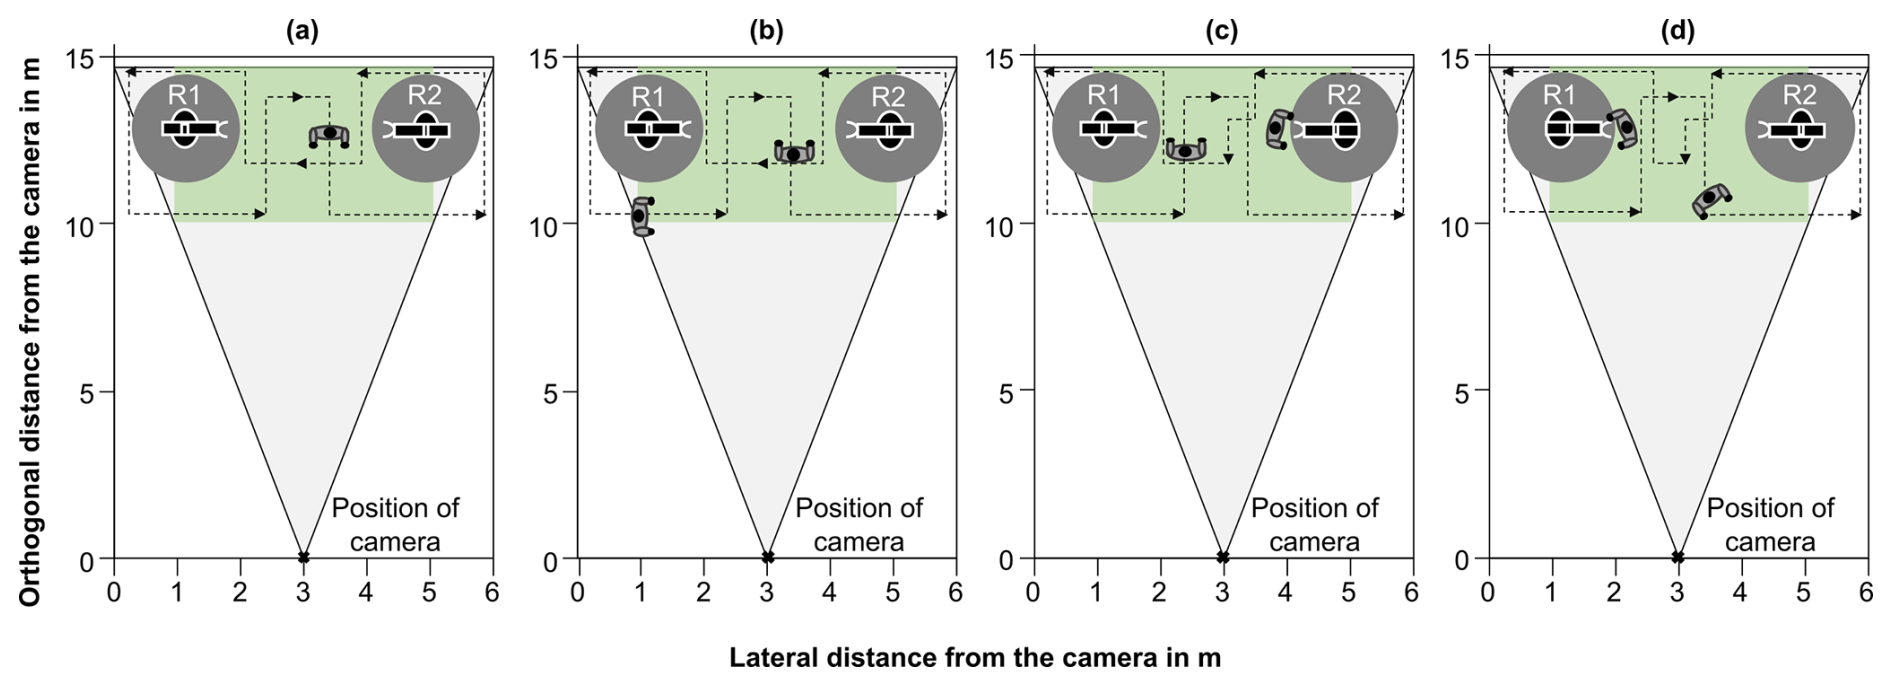
Figure 1The measurement setup for data acquisition was performed in four different scenarios with the interaction area in green and the camera perception in gray. (a) One person randomly walking in and out of the interaction area, (b) two persons randomly walking in and out of the interaction area, (c) one person interacting with R2 and one person randomly walking, and (d) one person interacting with R1 and one person randomly walking (adapted from Süme et al., 2024a).
3.1 Data acquisition and measurement setup
A total of 10 participants (five male and five female) were considered in the data collection. The infrared camera was positioned at a distance of 10 m. This placement allows for capturing a wide range of interactions between humans and cobots. The interaction area measures 4.5 m in length and 4 m in width, as shown in Fig. 1. The setup includes two cobots and up to two humans in a single image. The cobots used are the KUKA LBR iiwa 7 (R2) and the KUKA LBR iiwa 14 (R1). These KUKA models differ in size and payload, with the R2 featuring hand-guiding functionality. Hand guiding enables manipulation of the cobot by applying force to its flange. In this research, we utilized the hand-guiding function to simulate interaction between humans and the cobot, as shown in Fig. 2. Data acquisition was performed in four different scenarios using the same system setup as shown in Fig. 1 and listed below.
- (a)
In the first scenario, one participant randomly walked in and out of the interaction area in a figure-eight-shaped pattern so that the body was visible to the camera from different angles. Additionally, occluded body parts or partially visible body parts were generated because the objects were in a line or the person left the scene laterally.
- (b)
In the second scenario, a second participant joined the interaction area, and both participants were moving in and out of the interaction area randomly, generating images where the participants' bodies overlap.
- (c)
In the third scenario, one participant continues walking randomly in the interaction area, while the other participant interacts with the R2.
- (d)
In the fourth scenario, the third scenario was repeated, but instead of interacting with R2, the interaction between participant and cobot was with R1.
Participants were allowed to perform various movements while walking, including squatting, stretching and other random actions. Additionally, in the second and third scenarios, the second participant was free to interact with the unoccupied cobot. This step was intended to improve the diversification of the data. The cobots moved automatically as the participants walked or moved through the interaction area to avoid a singular pose of the cobot in the dataset. The environmental temperature during the data collection ranged from 21.5 to 22.9 °C. The humidity was at 37 %, and the ambient lighting in the interaction area varied between 908 and 1381 lx.
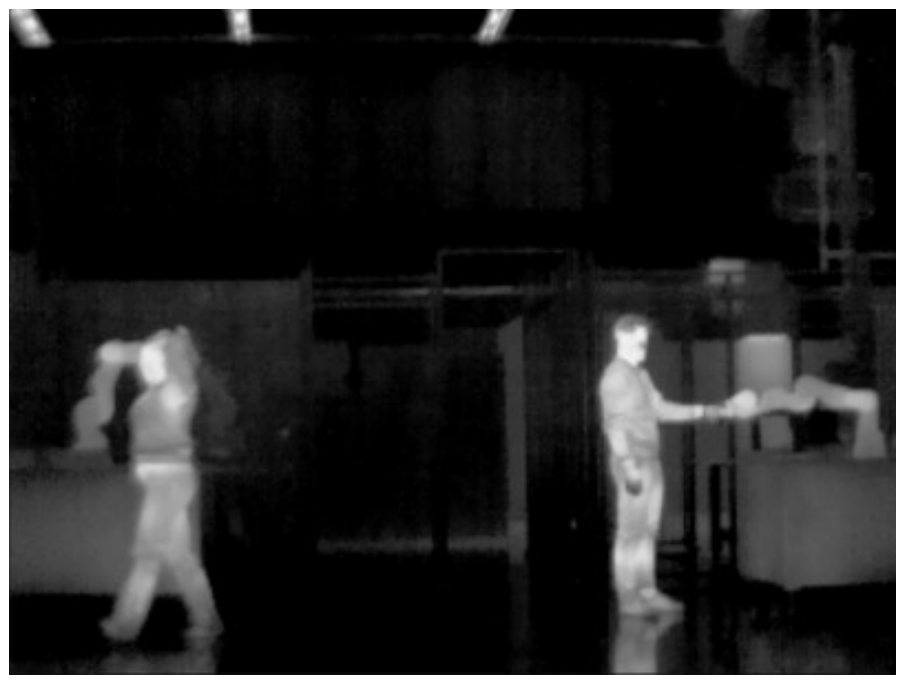
Figure 2Infrared image in industrial settings with two cobots, a walking human on the left and a human interacting by hand guiding the cobot (R2) on the right (adapted from Süme et al., 2024a).
3.2 Data preprocessing
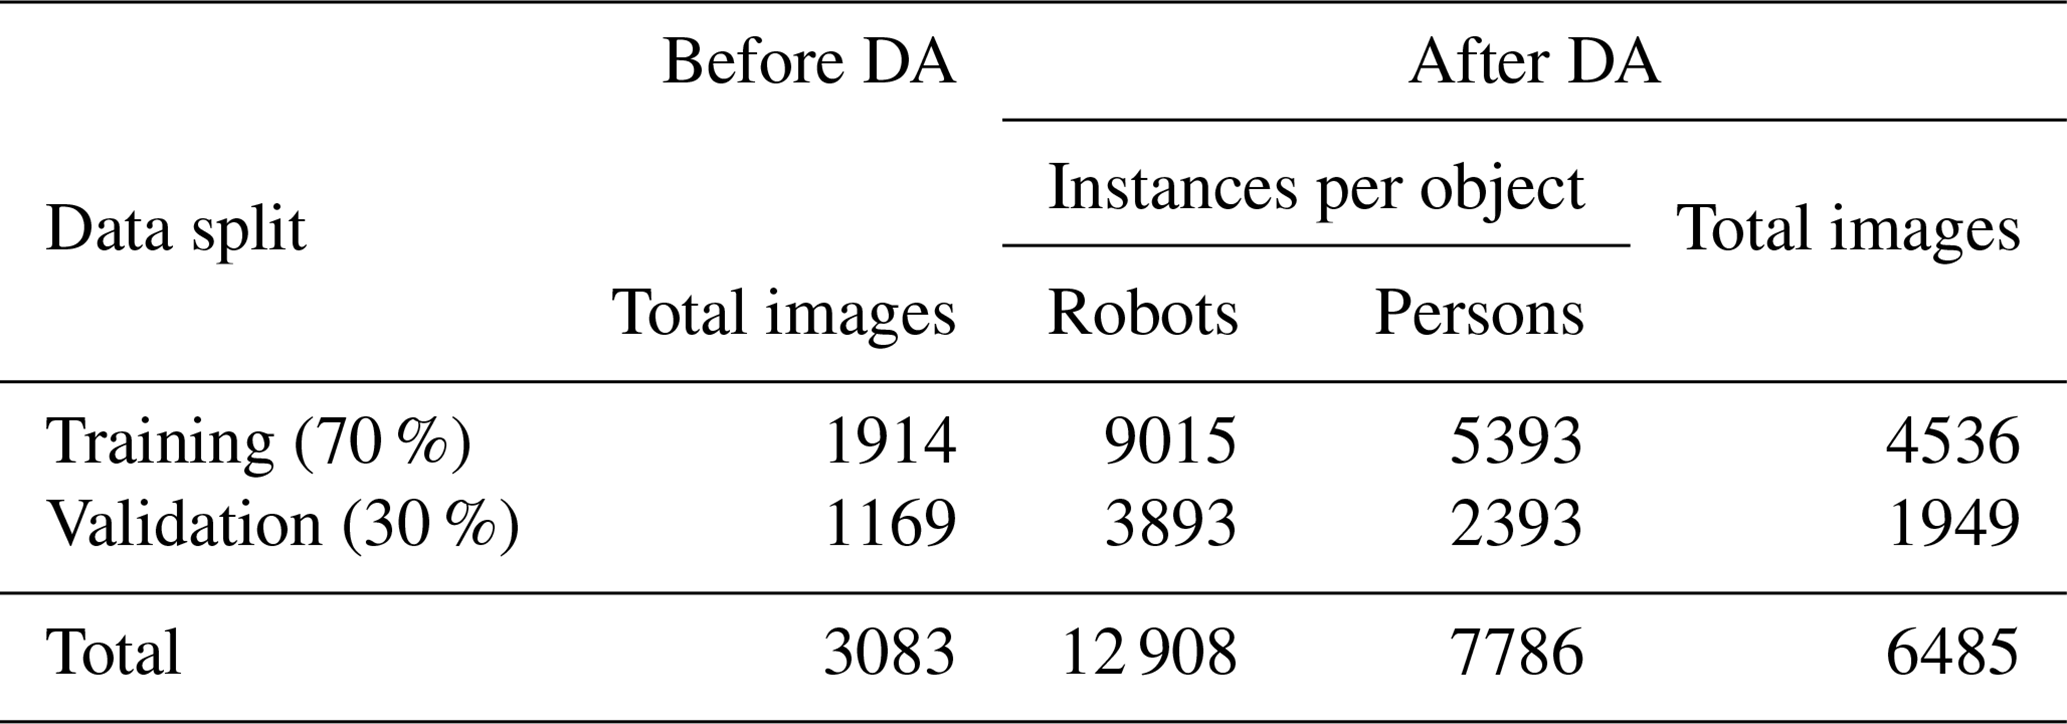
The initial step in data preprocessing involved converting the video stream, based on temperature values, to grayscale. Frames were extracted from the infrared video stream, with one frame taken every second using a Python script, resulting in a total of 3083 images. These images were labeled as either person or robot and randomly divided into 70 % for training and 30 % for validation as shown in Table 2. Data augmentation (DA) techniques, such as cropping out up to 30 %, blurring up to 4.5 px, and adding noise up to 1.9 px in size, were applied. These techniques increased the dataset to 6485 images and helped prevent overfitting. Prior to model training, the datasets were resized from the original resolution (320×240 px) of the FLIR camera to 640×640 px.
Table 2Distribution of training and validation datasets as well as the representation of the classes and their instances after DA.
The images acquired by the infrared camera have the FLIR watermark in the bottom-left corner and may trigger the Clever Hans phenomenon. The phenomenon describes whether a training strategy is valid or the decision is based on a false correlation in the training data, e.g., a static watermark symbol or logo (Lapuschkin et al., 2019). In this case, the model could correctly detect humans and robots in the images provided despite the watermark, but when deployed in a real world setting, the model could fail if no artificial watermark is visible. Based on this, further analysis was made to verify the results of the models and the existence of the Clever Hans phenomenon. The dataset with 1169 images of the validation set was modified by cropping the bottom edge of each image, thus modifying the image dimension to 640×575 px and removing the watermark, as shown in Fig. 3.
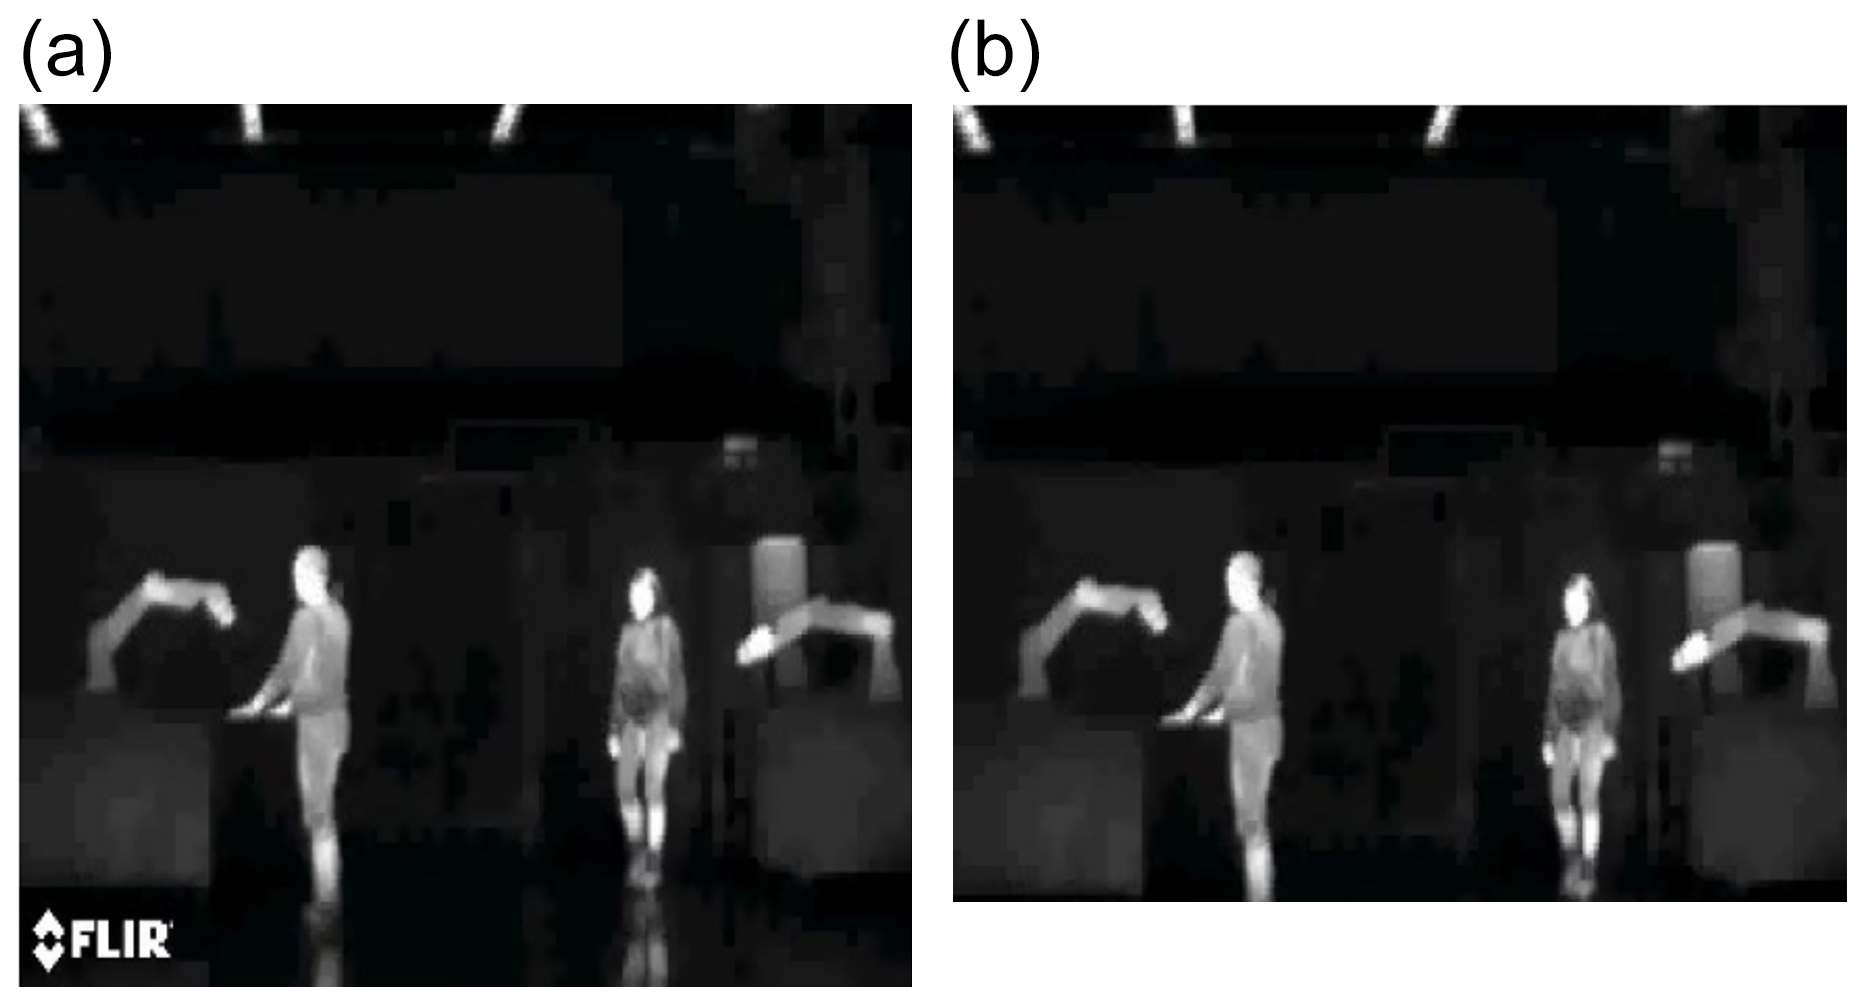
Figure 3(a) Original image size (640×640 px) with the watermark. (b) Cropped image size (640×575 px) without the watermark.
Table 3Results of the evaluated models with the metrics AP50 and AP50-95 of each class and mAP as well as ttotal.
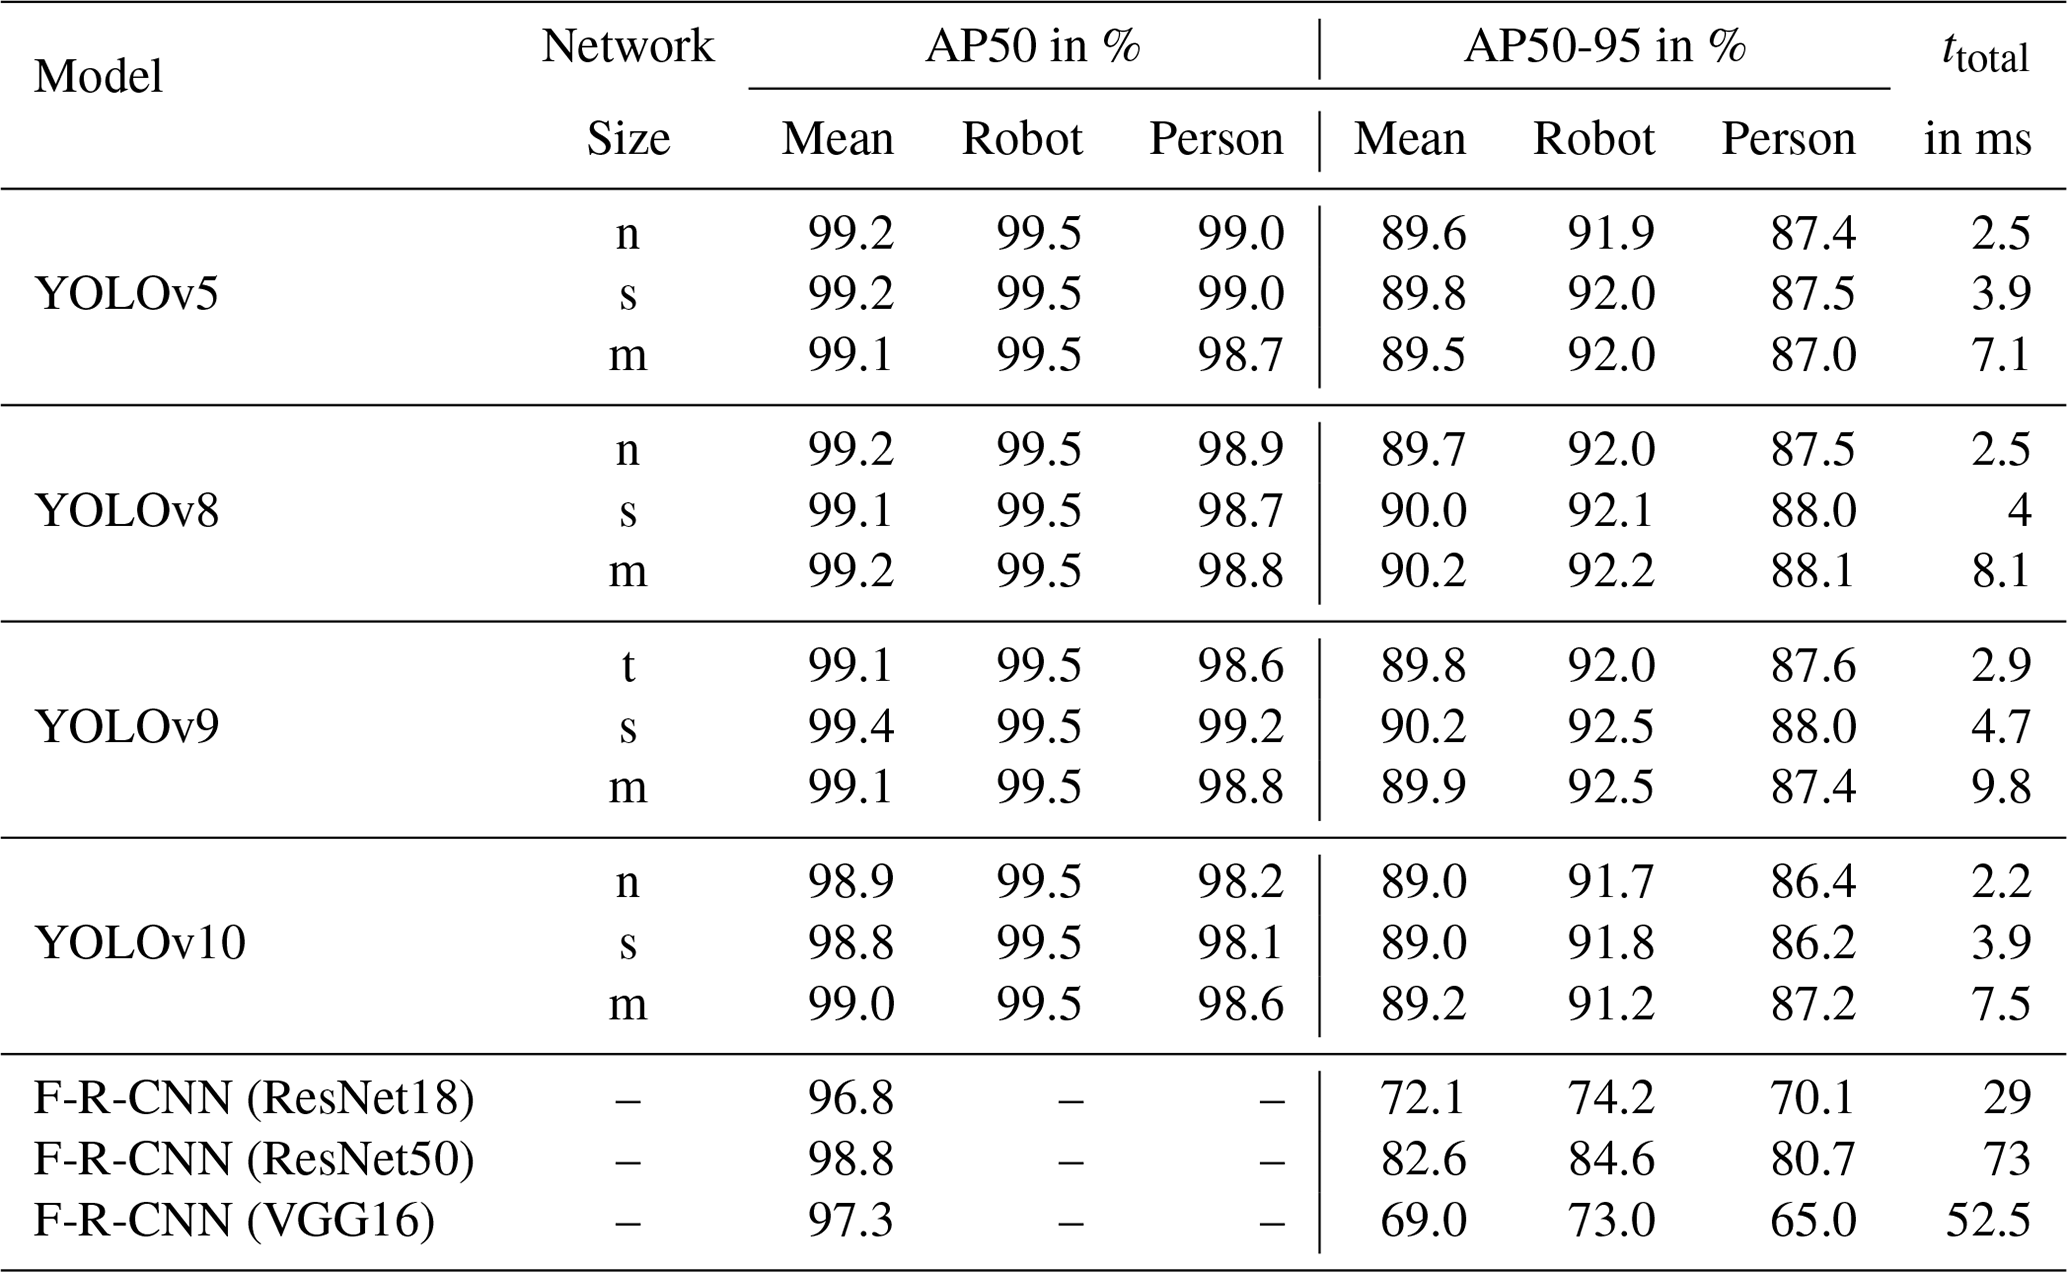
Table 4Comparison between the results of the datasets with and without watermark evaluated with the YOLOv9s model and the metrics AP50 and AP50-95 of each class and mAP.
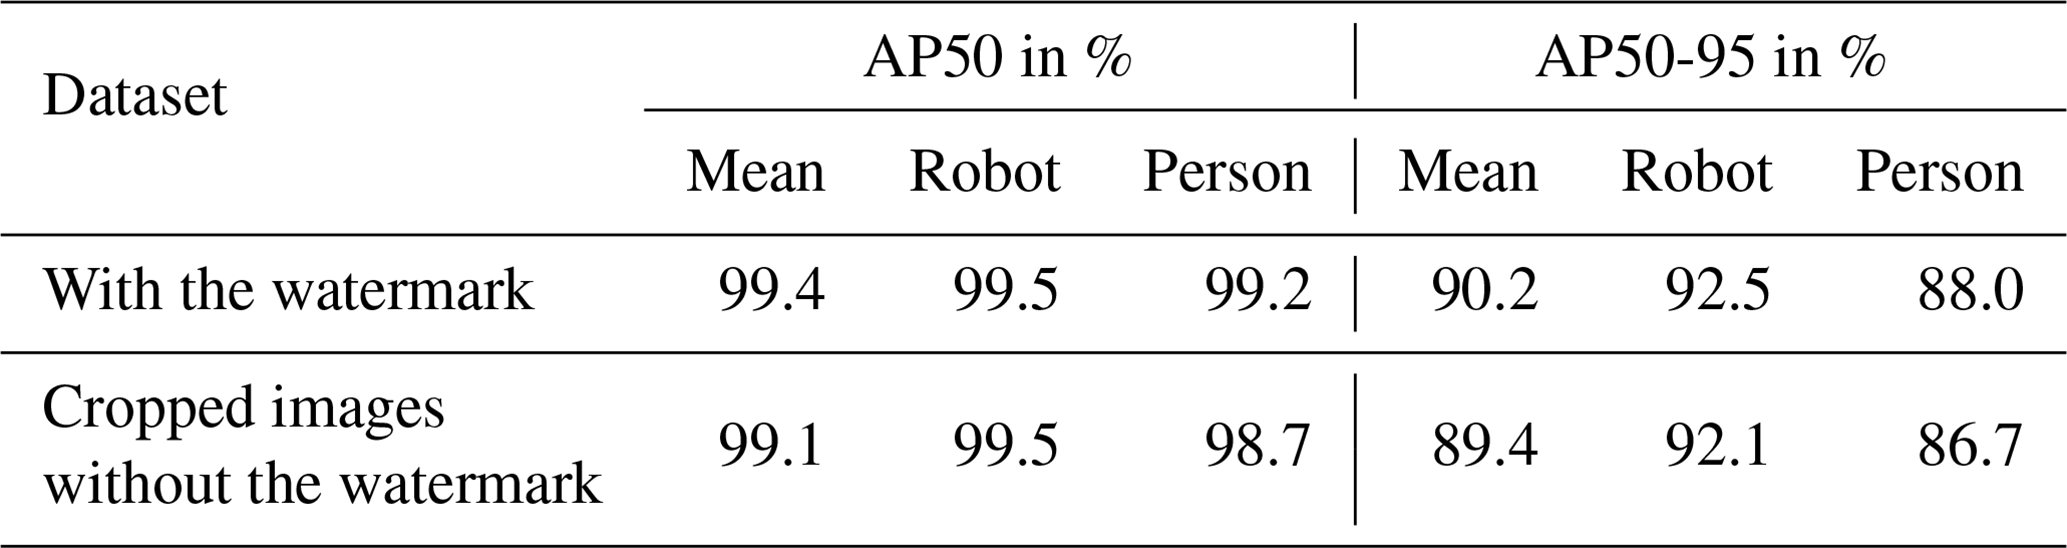
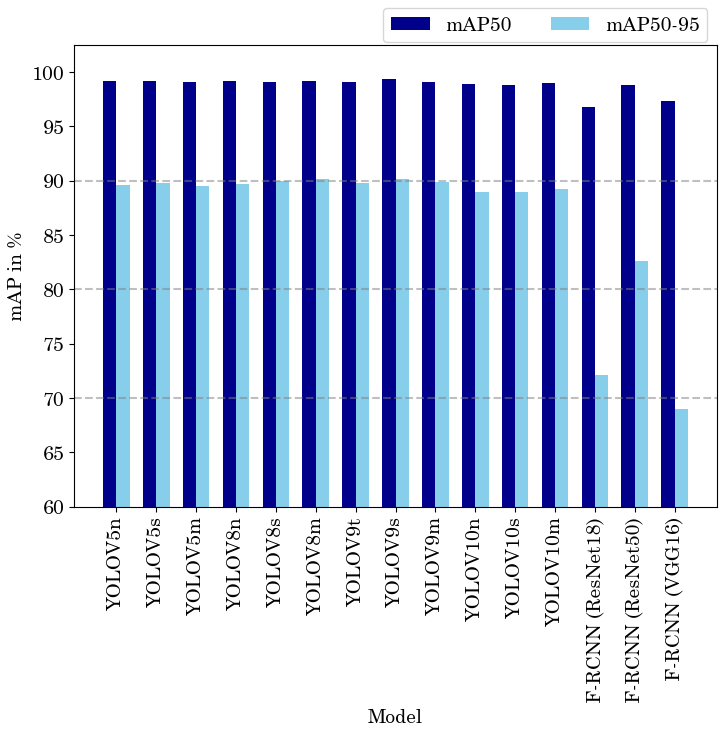
Figure 4Comparison between the mAP50 (dark blue) and mAP50-95 (light blue) results of the evaluated models.
The metrics used in this contribution to evaluate the accuracy of the models on the validation data are average precision (AP) and mean average precision (mAP). For the calculation of the metric AP, the precision (p) and the recall (r) need to be calculated. p is the capability of a model to identify the relevant object and determines the percentage of correct positive predictions, as calculated in Eq. (1). r defines the percentage of correct predictions based on all ground truths, as shown in Eq. (2) (Padilla et al., 2020).
The metric of intersection over union (IoU) allows for determining when a prediction of a bounding box (BB) is correct. The IoU overlays the predicted BB (Bp) on the ground truth BB (Bgt) and divides the intersection area by the area of both boxes, as shown in the following:
If the value exceeds a defined threshold, the prediction will be classified as a true positive. Thus, it is essential to specify the threshold that determines whether a prediction is correct (Padilla et al., 2020). The AP (Salton and McGill, 1983) in Eq. (4) is applied to evaluate the model classification and detection capabilities. For every class, the precision and recall curve is computed. The AP captures the overall shape of the precision/recall curve and is defined as the average precision across 11 equally spaced recall levels (Everingham et al., 2010).
At each recall level r, the precision is determined by interpolation. This is done by taking the maximum precision achieved by a method where the corresponding recall exceeds or equals r, where is the measured precision at recall ):
The mean average precision (mAP) describes the average precision across all classes, as shown in Eq. (6), where N represents the number of classes and APi is the average precision of the ith class. For instance, mAP50 refers to the AP of all classes at an IoU of 50, while mAP50-95 varies the IoU threshold between 50 and 95 in 5 % increments.
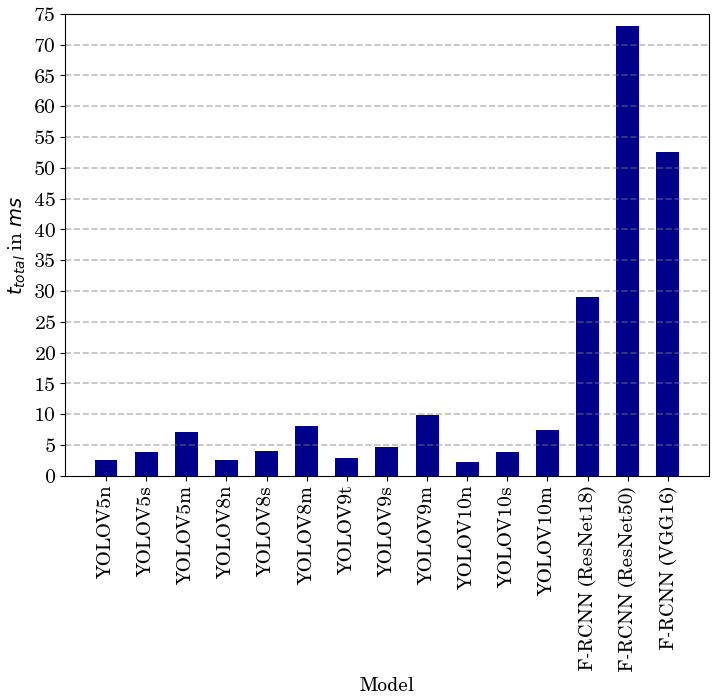
The assessment of real-time performance integrates the times for preprocessing (procpre), inference and postprocessing (procpost) in milliseconds. This will be measured for each model using the test dataset in total processing time (ttotal), as illustrated by
The presented algorithms were trained on the training dataset and deployed and evaluated on the validation dataset, with their best weights obtained during model training, as listed in Table 3. We included an early stop function to avoid overfitting. While all YOLO versions and the F-R-CNN ResNet18 ran for the full 50 epochs, the F-R-CNN ResNet50 and F-R-CNN VGG16 models stopped early because no further improvement was achieved. The best results in mAP50 (99.4 %) and mAP50-95 (90.2 %) values were achieved by the YOLOv9s. The YOLOv8s reaches 90.2 % as well but performs not as well with a mAP of 99.1 %, as plotted in Fig. 4. Regarding human safety, the detection rate of persons at the scene is important. The YOLO models were similar in the detection rate of persons but with a mAP50 of 99.2 % and 88.1 %, YOLOv9s and YOLOv8m, respectively, deliver the best results. The F-R-CNN models achieved similar results in the mAP50 value as the YOLO models but performed worse in terms of mAP50-95. As expected, the smaller model sizes of YOLO are faster (ttotal). The fastest algorithm is the YOLOv10n, with ttotal showing an improvement of 13.75 % in speed to the next best models. With a difference of almost 31 % in speed reduction between the m-sized and the n-sized model, the YOLOv8 model size change has the biggest impact on ttotal. The F-R-CNN models and the method of the two-stage detection cannot reach the detection speed of the YOLO architectures, as shown in Fig. 5. The YOLOv9s model trained on the original dataset and tested on the dataset without a watermark shows no significant change in performance regarding mAP50 and mAP50-95, as presented in Table 4.
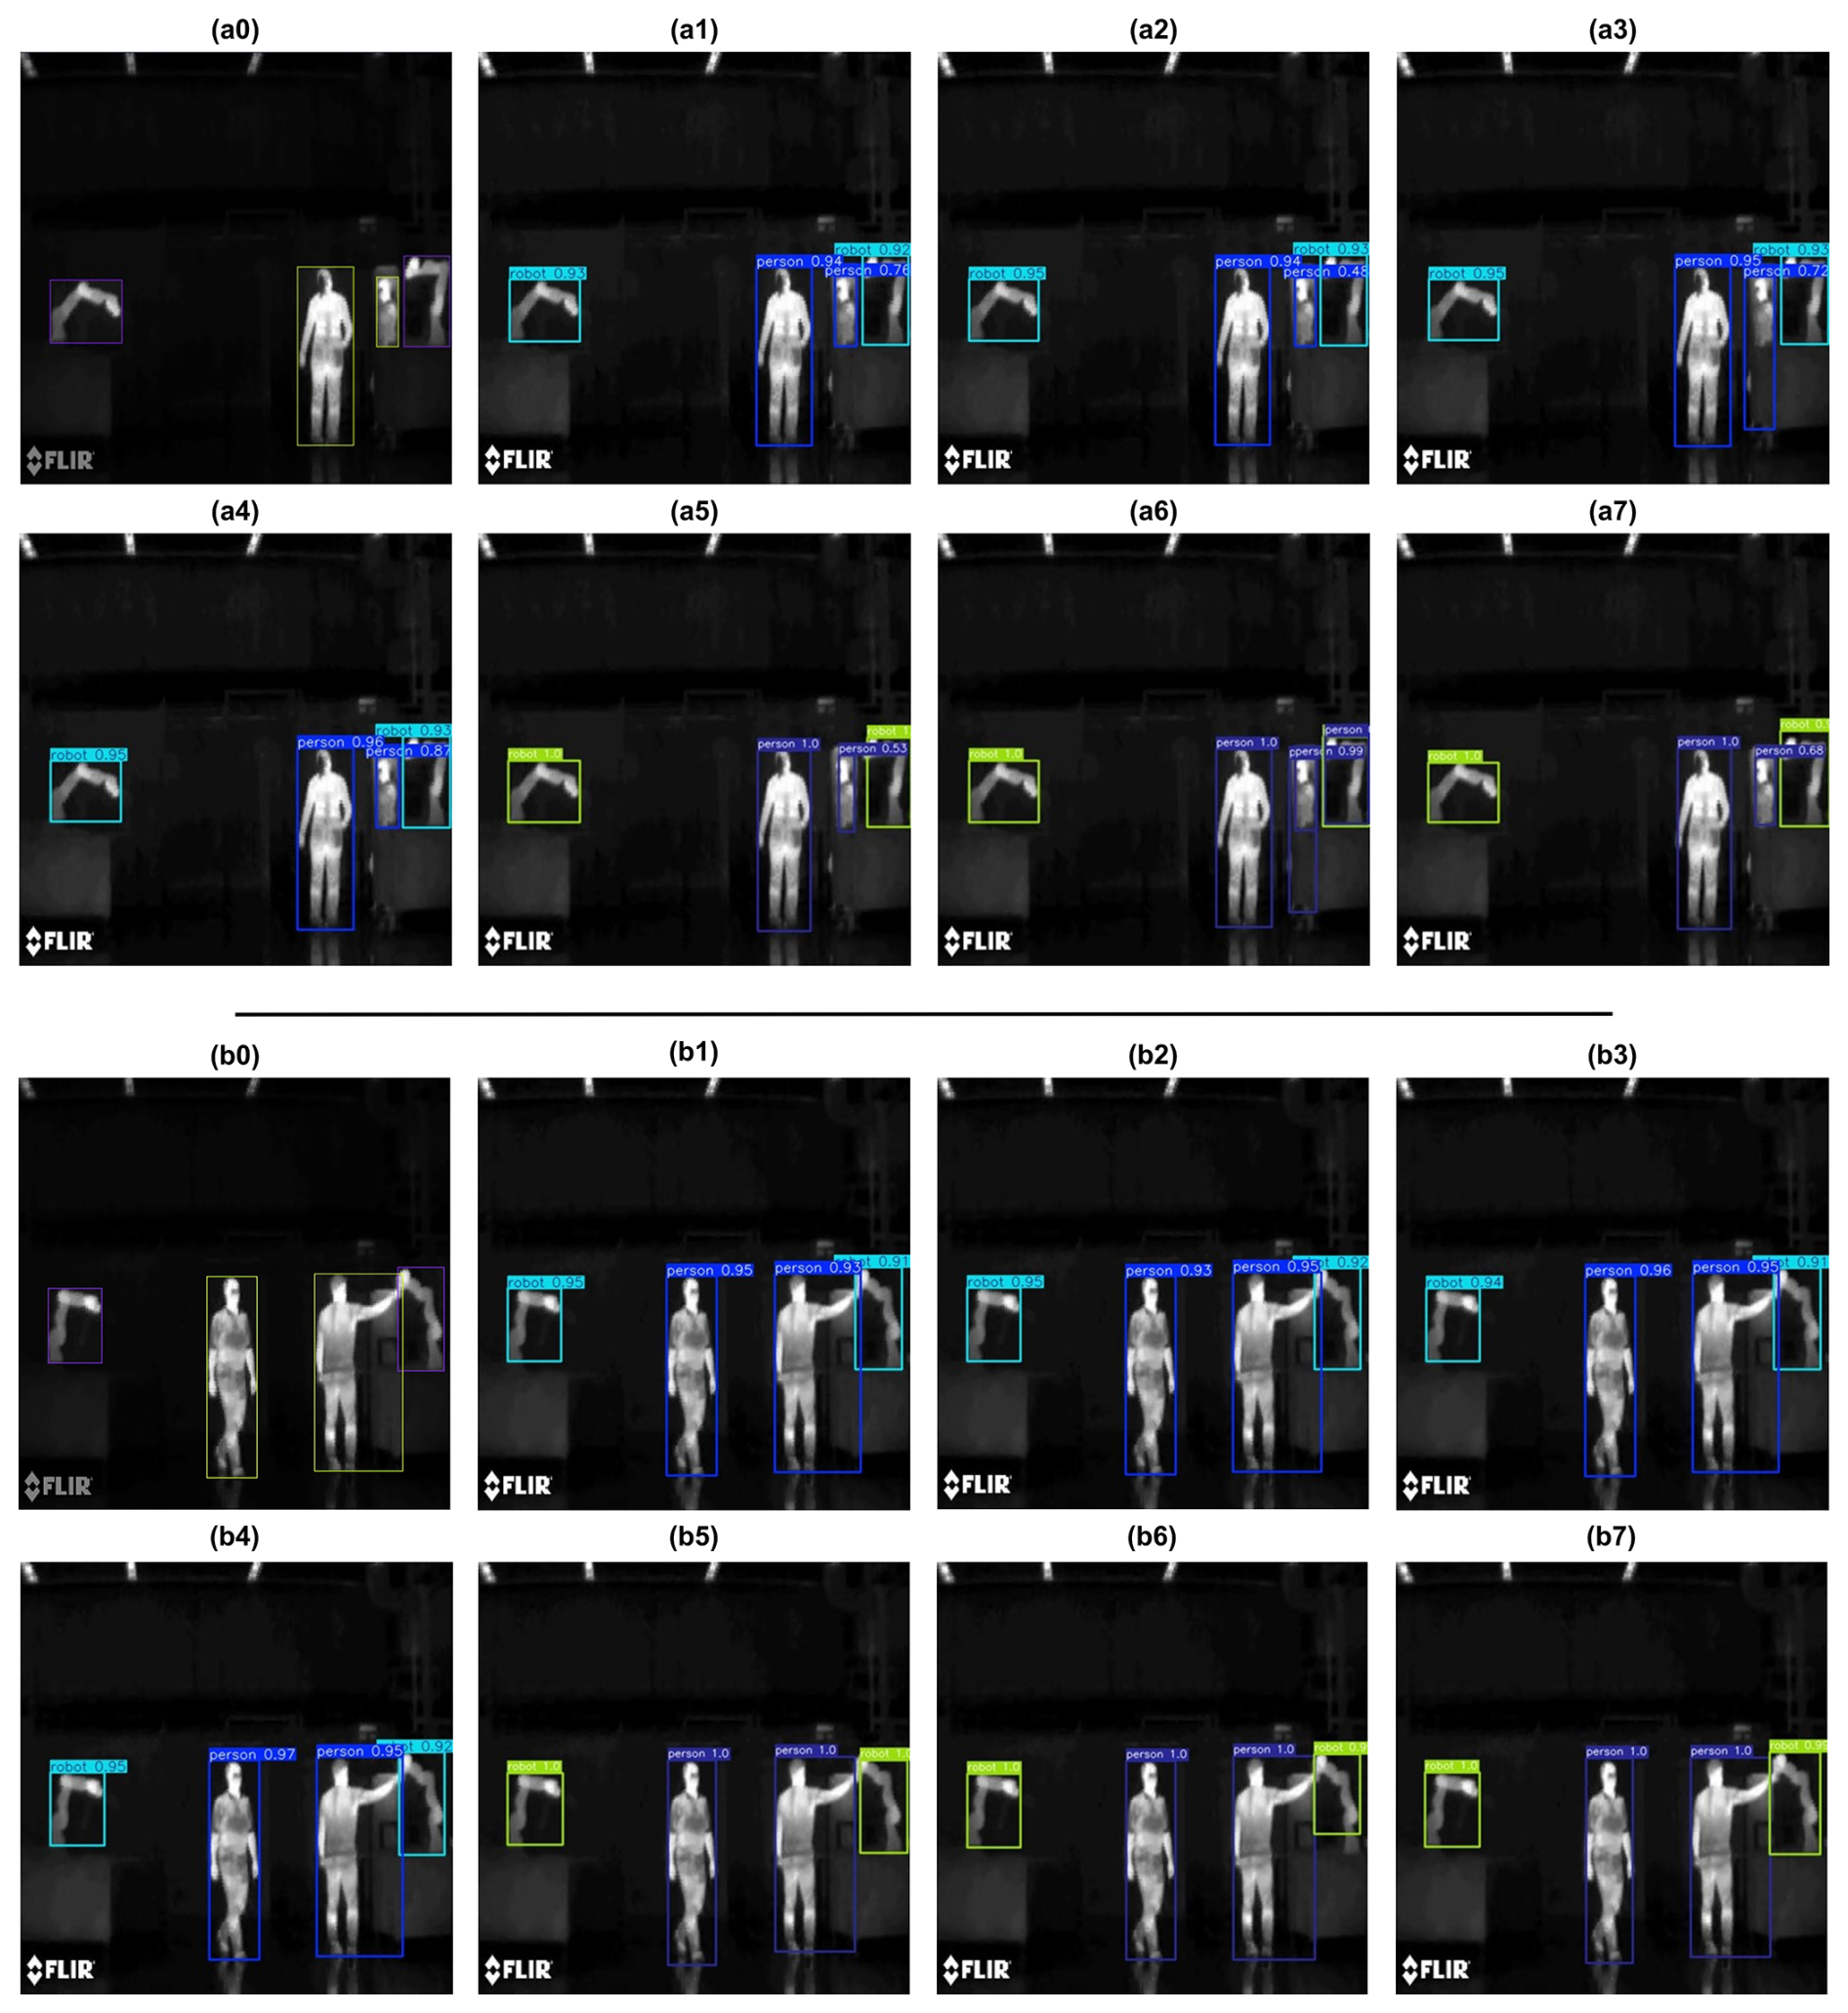
Figure 6Results of two predicted images on the validation dataset with the ground truth annotation (a0, b0), the respective prediction of YOLOv5n (a1, b1), YOLOv8n (a2, b2), YOLOv9t (a3, b3), YOLOv10n (a4, b4), F-R-CNN ResNet18 (a5, b5), F-R-CNN ResNet50 (a6, b6) and F-R-CNN VGG16 (a7, b7).
The pretrained models with the applied DA methods achieved better performance without overfitting. The prediction metrics of the models are generally high, which can be attributed to the optimization of the data during preprocessing, the stationary position and the few objects to be detected in a single image. In particular, the detection of the cobot is reliably high due to the stationary position even with DA methods where the position of the objects can change in an image. It seems that moving the axes of the cobot during data acquisition has little effect on reliable detection. In general, all models predict separated objects in the image with high confidence, as shown in Fig. 6a0–a7. The exception is the F-R-CNN ResNet50 model, which also incorrectly predicts the cobot as a person due to its pose in Fig. 6a6. The predictions of the occluded person vary in not only the size of the BB, but also the confidence of the predicted BB. The YOLOv9t and F-R-CNN ResNet50 models (Fig. 6a3, a6) predict the BB as a whole-body BB and provide high confidence values, while some other models predict the size correctly but exhibit lower confidence levels. This phenomenon could occur if the dataset is not large and diverse enough and there is an imbalance of annotations where the BB was placed as a whole body in similar images. The model learned from these similar images where the person is a bit more visible and labeled as a full-body BB, while in this case, it is only the upper body. Another potential explanation could be the inconsistency in the labeling of the images. This point has been addressed by the authors with clear annotation instructions and labeling examples of this dataset following the guidelines of the VOC challenge (Everingham et al., 2010).
While the YOLO models produce similarly good results in terms of detection performance, the different model sizes do not have a significant impact in the detection accuracy. This suggests that data optimization and grayscaling techniques enable smaller YOLO models to achieve results comparable to those of larger YOLO models. The detection speed decreases up to 33 % between the smallest and biggest YOLO model size. Then again, the F-R-CNN ResNet50 has a significant improvement of 14.5 % for the mAP50-95 compared to the F-R-CNN ResNet18. This improvement can be attributed to the changes from ResNet50v1 (He et al., 2016a) to the optimized network ResNet50 used in this research, while the ResNet18 was not optimized by the authors. The two-stage methods do not perform as well as the one-stage methods with the mAP50-95 results. Nevertheless, the mAP50 value is close to the best results of the YOLO models. This indicates that the F-R-CNN model is able to detect the object but struggles to accurately place the BB of the objects. This issue of BB precision and placement can be seen in Fig. 6, where the original annotated image in Fig. 6b0 shows clear overlapping BBs of the person and the cobot. The YOLO models are able to place the BBs in a similar overlapping position (Fig. 6b1, b2, b3, b4). However, the F-R-CNN18 leaves a gap (Fig. 6b5) and the F-R-CNN ResNet50 (Fig. 6b6) and VGG16 (Fig. 6b7) do not sufficiently overlap the BBs of the objects. This may be due to the fact that the F-R-CNN models are more dependent on color in images and the feature extraction struggles with grayscale, especially on the edges of objects.
The model's prediction confidence decreases with occluded objects, but the models are still able to detect the person and cobot in difficult scenarios. In this case, the detection rate of a person in a manufacturing environment is a key metric for worker safety. The models tend to detect cobots better than persons due to the stationary position mentioned above. The average accuracy of the YOLO models in detecting people is generally high, ranging from 87.0 % to 88.1 % but still not enough to ensure safe recognition as defined by the HRC safety measure. The F-R-CNN models are not competitive in terms of human recognition accuracy, and the recognition speed is also critically low for safety measures, while all the one-stage methods evaluated in this research meet the expectations of the literature and would meet the criteria of detection speed in the safety aspect.
The results show no significant change by evaluating the model on the dataset with the FLIR watermark, suggesting that the model relies on other patterns in the image to make its predictions and that while the watermark does not play a critical role in the model's prediction process. A possible explanation could be that the watermark is present in all images, there are other static visual cues that are also present in the images, such as the tables and light fixtures above. The humans and robots are dynamic, and there are no two images where humans and robots are in the same position. Additionally, data augmentation techniques were used during training to improve robustness, such as random cropping of up to 30 %, ensuring that there are test images where the logo is not present, blurring up to 4.5 px, and adding noise up to 1.9 px in size; therefore, even when the watermark is present, variations of the watermark are introduced. These augmentations aim to mitigate phenomena such as Clever Hans.
A dataset of infrared images to improve HRC in a manufacturing environment was presented. The dataset and the approach to differentiate between humans and robots were evaluated with different CNN methods and model sizes. With 10 participants, equally balanced in gender and varying in scenarios, poses, and clothing, a decent amount of diverse infrared image data was generated. The two approaches (one-stage and two-stage method) lead to fundamentally different results in the detection rate and detection time. The YOLO-models, especially the improved YOLOv9s, deliver overall the best results. The results show that one-stage methods are better-suited for this application than two-stage methods due to the low complexity of the image based on the measurement setup and data preprocessing resulting in better detection rate and speed. The aspect of the placement of the BB is crucial as well to enabling precise collaboration between a worker and a robot. Therefore, this research revealed that YOLO models are capable of precise placement of the BB. The disadvantage lies in the fact that it is not clear which body part is the nearest to the robot. Thus, it is not possible to differentiate whether the worker wants to collaborate with the robot with their hands or whether the worker is in danger because their head is close to the robot. Based on the acquired dataset and findings of this research, future work will explore the possibilities of detecting the human pose in collaborative workspace to enable more specific context-based HRC.
The results emphasize the need to generalize the training environment by adding more diverse scenes to the dataset. In particular, the stationary position of the cobot might significantly affect the detection rate; suggesting further analysis and optimization should be considered when the cobot is placed in different positions in the scene.
The data that support the findings of this study are openly available on Zenodo: “WLRI-HRC – A Dataset of Infrared Images for Human–Robot Collaboration in Manufacturing Environment” at https://zenodo.org/records/14228565 (Süme, 2024).
SiS contributed to conceptualization, data curation, investigation, methodology, software, validation and visualization. K-MP assisted in data curation, software and validation of the studies. TMW and SJR contributed to conceptualization and supervision. SiS prepared the manuscript, with contributions from all co-authors. All co-authors reviewed and edited the publication. OpenAI's ChatGPT-4 was partially employed for grammatical and spelling corrections without adding to or altering the authors initial content.
The contact author has declared that none of the authors has any competing interests.
Publisher’s note: Copernicus Publications remains neutral with regard to jurisdictional claims made in the text, published maps, institutional affiliations, or any other geographical representation in this paper. While Copernicus Publications makes every effort to include appropriate place names, the final responsibility lies with the authors.
This article is part of the special issue “Sensors and Measurement Systems 2024”. It is a result of the 22. GMA/ITG Fachtagung Sensoren und Messsysteme 2024, Nuremberg, Germany, 11 to 12 June 2024.
The publication of this paper was supported by the Open Access Publication Fund of the Offenburg University of Applied Sciences.
This paper was edited by Andreas Schütze and reviewed by two anonymous referees.
Alatise, M. B. and Hancke, G. P.: A Review on Challenges of Autonomous Mobile Robot and Sensor Fusion Methods, IEEE Access, 8, 39830–39846, https://doi.org/10.1109/ACCESS.2020.2975643, 2020. a
Everingham, M., Van Gool, L., Williams, C. K. I., Winn, J., and Zisserman, A.: The Pascal Visual Object Classes (VOC) Challenge, Int. J. Comput. Vis., 88, 303–338, https://doi.org/10.1007/s11263-009-0275-4, 2010. a, b, c
FLIR, C. S.: FLIR T420 & T440, FLIR Commercial Systems, http://www.flirmedia.com/MMC/THG/Brochures/IND_003/IND_003_EN.pdf (last access: 6 August 2024), 2013. a
Fraden, J.: Handbook of Modern Sensors: Physics, Designs, and Applications, Springer International Publishing, Cham, ISBN 978-3-319-19302-1 978-3-319-19303-8, https://doi.org/10.1007/978-3-319-19303-8, 2016. a
Gebhardt, E. and Wolf, M.: CAMEL Dataset for Visual and Thermal Infrared Multiple Object Detection and Tracking, in: 2018 15th IEEE International Conference on Advanced Video and Signal Based Surveillance (AVSS), 1–6 pp., https://doi.org/10.1109/AVSS.2018.8639094, 2018. a
Girshick, R.: Fast R-CNN, in: Proceedings of the 2015 IEEE International Conference on Computer Vision (ICCV), ICCV '15, 1440–1448 pp., IEEE Computer Society, USA, ISBN 978-1-4673-8391-2, https://doi.org/10.1109/ICCV.2015.169, 2015. a
Girshick, R., Donahue, J., Darrell, T., and Malik, J.: Rich Feature Hierarchies for Accurate Object Detection and Semantic Segmentation, in: 2014 IEEE Conference on Computer Vision and Pattern Recognition, 580–587 pp., https://doi.org/10.1109/CVPR.2014.81, ISSN 1063-6919, 2014. a
Han, Y.: Comparison on Object Detection Algorithms: A Taxonomy, in: 2022 3rd International Conference on Electronic Communication and Artificial Intelligence (IWECAI), 204–208 pp., https://doi.org/10.1109/IWECAI55315.2022.00047, 2022. a
Hanson, N., Pyatski, B., Hibbard, S., DiMarzio, C., and Padır, T.: Hyper-Drive: Visible-Short Wave Infrared Hyperspectral Imaging Datasets for Robots in Unstructured Environments, in: 2023 13th Workshop on Hyperspectral Imaging and Signal Processing: Evolution in Remote Sensing (WHISPERS), 1–5 pp., https://doi.org/10.1109/WHISPERS61460.2023.10430802, ISSN: 2158-6276, 2023. a
He, K., Zhang, X., Ren, S., and Sun, J.: Deep Residual Learning for Image Recognition, in: 2016 IEEE Conference on Computer Vision and Pattern Recognition (CVPR), 770–778 pp., https://doi.org/10.1109/CVPR.2016.90, ISSN 1063-6919, 2016a. a, b
He, K., Zhang, X., Ren, S., and Sun, J.: Identity Mappings in Deep Residual Networks, in: Computer Vision – ECCV 2016, edited by: Leibe, B., Matas, J., Sebe, N., and Welling, M., 630–645 pp., Springer International Publishing, Cham, ISBN 978-3-319-46493-0, https://doi.org/10.1007/978-3-319-46493-0_38, 2016b. a
Himmelsbach, U. B., Süme, S., and Wendt, T. M.: Classification of Thermal Images for Human-Machine Differentiation in Human-Robot Collaboration Using Convolutional Neural Networks, in: 2023 20th International Conference on Ubiquitous Robots (UR), 730–734 pp., IEEE, Honolulu, HI, USA, ISBN 9798350335170, https://doi.org/10.1109/UR57808.2023.10202384, 2023. a
Khosravy, M., Gupta, N., Pasquali, A., Dey, N., Crespo, R. G., and Witkowski, O.: Human-Collaborative Artificial Intelligence Along With Social Values in Industry 5.0: A Survey of the State-of-the-Art, IEEE T. Cog. Develop. Syst., 16, 165–176, https://doi.org/10.1109/TCDS.2023.3326192, 2024. a
Lapuschkin, S., Wäldchen, S., Binder, A., Montavon, G., Samek, W., and Müller, K.-R.: Unmasking Clever Hans predictors and assessing what machines really learn, Nature Publishing Group, Nat. Commun., 10, 1096, https://doi.org/10.1038/s41467-019-08987-4, 2019. a
Lee, A. J., Cho, Y., Shin, Y.-s., Kim, A., and Myung, H.: ViViD++: Vision for Visibility Dataset, IEEE Robot. Auto. Lett., 7, 6282–6289, https://doi.org/10.1109/LRA.2022.3168335, 2022. a
Lin, T.-Y., Maire, M., Belongie, S., Bourdev, L., Girshick, R., Hays, J., Perona, P., Ramanan, D., Zitnick, C. L., and Dollár, P.: Microsoft COCO: Common Objects in Context, http://arxiv.org/abs/1405.0312 (last access: 26 August 2024), 2015. a
Maningo, J. M., Amoroso, M. C. C., Atienza, K. R., Ladera, R. K., Menodiado, N. M., Ambata, L. U., Cabatuan, M. K., Sybingco, E., Bandala, A., Española, J., and Vicerra, R. R.: Thermal Imaging Dataset for Human Presence Detection, in: 2023 8th International Conference on Business and Industrial Research (ICBIR), 1159–1164 pp., https://doi.org/10.1109/ICBIR57571.2023.10147404, 2023. a
Noh, D., Sung, C., Uhm, T., Lee, W., Lim, H., Choi, J., Lee, K., Hong, D., Um, D., Chung, I., Shin, H., Kim, M., Kim, H.-R., Baek, S., and Myung, H.: X-MAS: Extremely Large-Scale Multi-Modal Sensor Dataset for Outdoor Surveillance in Real Environments, IEEE Robo. Auto. Lett., 8, 1093–1100, https://doi.org/10.1109/LRA.2023.3236569, 2023. a
Padilla, R., Netto, S. L., and Da Silva, E. A. B.: A Survey on Performance Metrics for Object-Detection Algorithms, in: 2020 International Conference on Systems, Signals and Image Processing (IWSSIP), 237–242 pp., IEEE, Niterói, Brazil, ISBN 978-1-72817-539-3, https://doi.org/10.1109/IWSSIP48289.2020.9145130, 2020. a, b
Proia, S., Carli, R., Cavone, G., and Dotoli, M.: Control Techniques for Safe, Ergonomic, and Efficient Human-Robot Collaboration in the Digital Industry: A Survey, IEEE T. Auto. Sci. Eng., 19, 1798–1819, https://doi.org/10.1109/TASE.2021.3131011, 2022. a
Redmon, J. and Farhadi, A.: YOLO9000: Better, Faster, Stronger, in: 2017 IEEE Conference on Computer Vision and Pattern Recognition (CVPR), 6517–6525 pp., https://doi.org/10.1109/CVPR.2017.690, ISSN 1063-6919, 2017. a
Redmon, J. and Farhadi, A.: YOLOv3: An Incremental Improvement, CoRR, abs/1804.02767, https://doi.org/10.48550/arXiv.1804.02767, 2018. a
Redmon, J., Divvala, S., Girshick, R., and Farhadi, A.: You Only Look Once: Unified, Real-Time Object Detection, in: 2016 IEEE Conference on Computer Vision and Pattern Recognition (CVPR), 779–788 pp., https://doi.org/10.1109/CVPR.2016.91, ISSN 1063-6919, 2016. a
Ren, S., He, K., Girshick, R., and Sun, J.: Faster R-CNN: Towards Real-Time Object Detection with Region Proposal Networks, IEEE Trans. Pattern Anal. Mach. Intell., 39, 1137–1149, https://doi.org/10.1109/TPAMI.2016.2577031, 2015. a
Russakovsky, O., Deng, J., Su, H., Krause, J., Satheesh, S., Ma, S., Huang, Z., Karpathy, A., Khosla, A., Bernstein, M., Berg, A. C., and Fei-Fei, L.: ImageNet Large Scale Visual Recognition Challenge, Int. J. Comput. Vision, 115, 211–252, https://doi.org/10.1007/s11263-015-0816-y, 2015. a
Salton, G. and McGill, M. J.: Introduction to modern information retrieval, McGraw-Hill computer science series, McGraw-Hill, New York, ISBN 978-0-07-054484-0, 1983. a
Shf, P. and Zhao, C.: Review on Deep based Object Detection, in: 2020 International Conference on Intelligent Computing and Human-Computer Interaction (ICHCI), 372–377 pp., https://doi.org/10.1109/ICHCI51889.2020.00085, 2020. a, b
Simonyan, K. and Zisserman, A.: Very deep convolutional networks for large-scale image recognition, 3rd International Conference on Learning Representations (ICLR 2015), https://ora.ox.ac.uk/objects/uuid:60713f18-a6d1-4d97-8f45-b60ad8aebbce (last access: 18 August 2024), 2015. a
Süme, S.: “WLRI-HRC” – A Dataset of Infrared Images for Human-Robot Collaboration in Manufacturing Environment, Sensors and Measuring Systems; 21th ITG/GMA-Symposium, Zenodo [data set], https://doi.org/10.5281/zenodo.14228565, 2024. a
Süme, S., Ponomarjova, K.-M., Wendt, T. M., and Rupitsch, S. J.: A1.3 – Differentiation of Human and Robots with Thermal Images and Convolutional Neural Network for Human-Robot Collaboration, Vorträge, 32–36 pp., https://doi.org/10.5162/sensoren2024/A1.3, 2024a. a, b
Ultralytics: YOLOv5: A state-of-the-art real-time object detection system, https://docs.ultralytics.com (last access: 8 August 2024), 2021. a
Varghese, R. and M., S.: YOLOv8: A Novel Object Detection Algorithm with Enhanced Performance and Robustness, in: 2024 International Conference on Advances in Data Engineering and Intelligent Computing Systems (ADICS), 1–6, https://doi.org/10.1109/ADICS58448.2024.10533619, 2 pp.024. a
Wang, A., Chen, H., Liu, L., Chen, K., Lin, Z., Han, J., and Ding, G.: YOLOv10: Real-Time End-to-End Object Detection, ArXiv, https://doi.org/10.48550/arXiv.2405.14458, 2024. a
Wang, C.-Y., Yeh, I.-H., and Liao, H.-Y. M.: YOLOv9: Learning What You Want to Learn Using Programmable Gradient Information, ArXiv, https://doi.org/10.48550/arXiv.2402.13616, 2024. a
Xu, X., Wei, X., Xu, Y., Zhang, Z., Gong, K., Li, H., and Xiao, L.: InfPose: Real-Time Infrared Multi-Human Pose Estimation for Edge Devices Based on Encoder-Decoder CNN Architecture, IEEE Robo. Auto. Lett., 9, 3672–3679, https://doi.org/10.1109/LRA.2023.3303070, 2024. a
Zou, Z., Chen, K., Shi, Z., Guo, Y., and Ye, J.: Object Detection in 20 Years: A Survey, Proc. IEEE, 111, 257–276, https://doi.org/10.1109/JPROC.2023.3238524, 2023. a