the Creative Commons Attribution 4.0 License.
the Creative Commons Attribution 4.0 License.
 | 11 Oct 2018
Gas sensors for climate research
Louisa Scholz
Alvaro Ortiz Perez
Benedikt Bierer
Jürgen Wöllenstein
Stefan Palzer
The availability of datasets providing information on the spatial and temporal evolution of greenhouse gas concentrations is of high relevance for the development of reliable climate simulations. However, current gas detection technologies do not allow for obtaining high-quality data at intermediate spatial scales with high temporal resolution. In this regard the deployment of a wireless gas sensor network equipped with in situ gas analysers may be a suitable approach. Here we present a novel, non-dispersive infrared absorption spectroscopy (NDIR) device that can possibly act as a central building block of a sensor node to provide high-quality data of carbon dioxide (CO2) concentrations under field conditions at a high measurement rate. Employing a gas-based, photoacoustic detector we demonstrate that miniaturized, low-cost, and low-power consuming CO2 sensors may be built. The performance is equal to that of standard NDIR devices but at a much reduced optical path length. Because of the spectral properties of the photoacoustic detector, no cross-sensitivities to humidity exist.
- Article
(2248 KB) - Full-text XML
- BibTeX
- EndNote


The Earth's climate is influenced by a complex interplay of processes occurring on land, ocean, and in the atmosphere (Bouwman, 1999). Numerous observations currently imply that the recent, anthropogenic release of large quantities of greenhouse gases (GHGs) into the atmosphere has shifted the balance related to natural biogeochemical cycles. Closely associated with this is the strengthening of the greenhouse effect which has triggered an increase in the global mean temperature (Schuur et al., 2015; Solomon et al., 2009). This has led to a rapidly changing climate on local, regional, and global scales commonly referred to as climate change. It is further believed that climate change is even accelerating, with significant influences on the current way of life and global ecosystems. In recent years many attempts have been made to assess climate change and its impact on a local, regional, and global scale with the aid of computer simulations (Moss et al., 2010). However, the spread in future climate scenarios resulting from state-of-the-art earth system models (ESMs) is large due to shortcomings in the constraining and parameterizing of associated variables. A common approach to make predictions more reliable is based on the development of models relying on ground truth data.
Currently a lack of adequate measurement technologies makes it hard to track the influencing factors and effects of climate change in a reliable fashion. Particularly, the composition of the atmosphere is an indicator of the overall condition of the Earth's climate, and data on the atmospheric concentration levels of GHGs are of great interest in climate science. Among the various relevant GHGs, carbon dioxide (CO2) and its dynamics stand out because of its comparatively high average concentration of the order of 400 ppm. Today's measurement strategies involve the determination of local concentration values via in situ (point) measurements and micrometeorological measuring stations (Wang et al., 2013). Additionally, data from such near-ground measurements are supplemented by data gathered from remote sensing via planes and satellites (Lees et al., 2018). However, all of these methods only partially meet the demands placed on data of GHG concentrations in terms of spatial and temporal resolution, leading to a shortage of suitable datasets. They are restricted in their spatial resolution because the sampling is associated with large efforts in terms of infrastructure expenditure by deploying laboratory-grade devices in the field. The related high costs result in poor surface coverage and coarse spatial resolution.
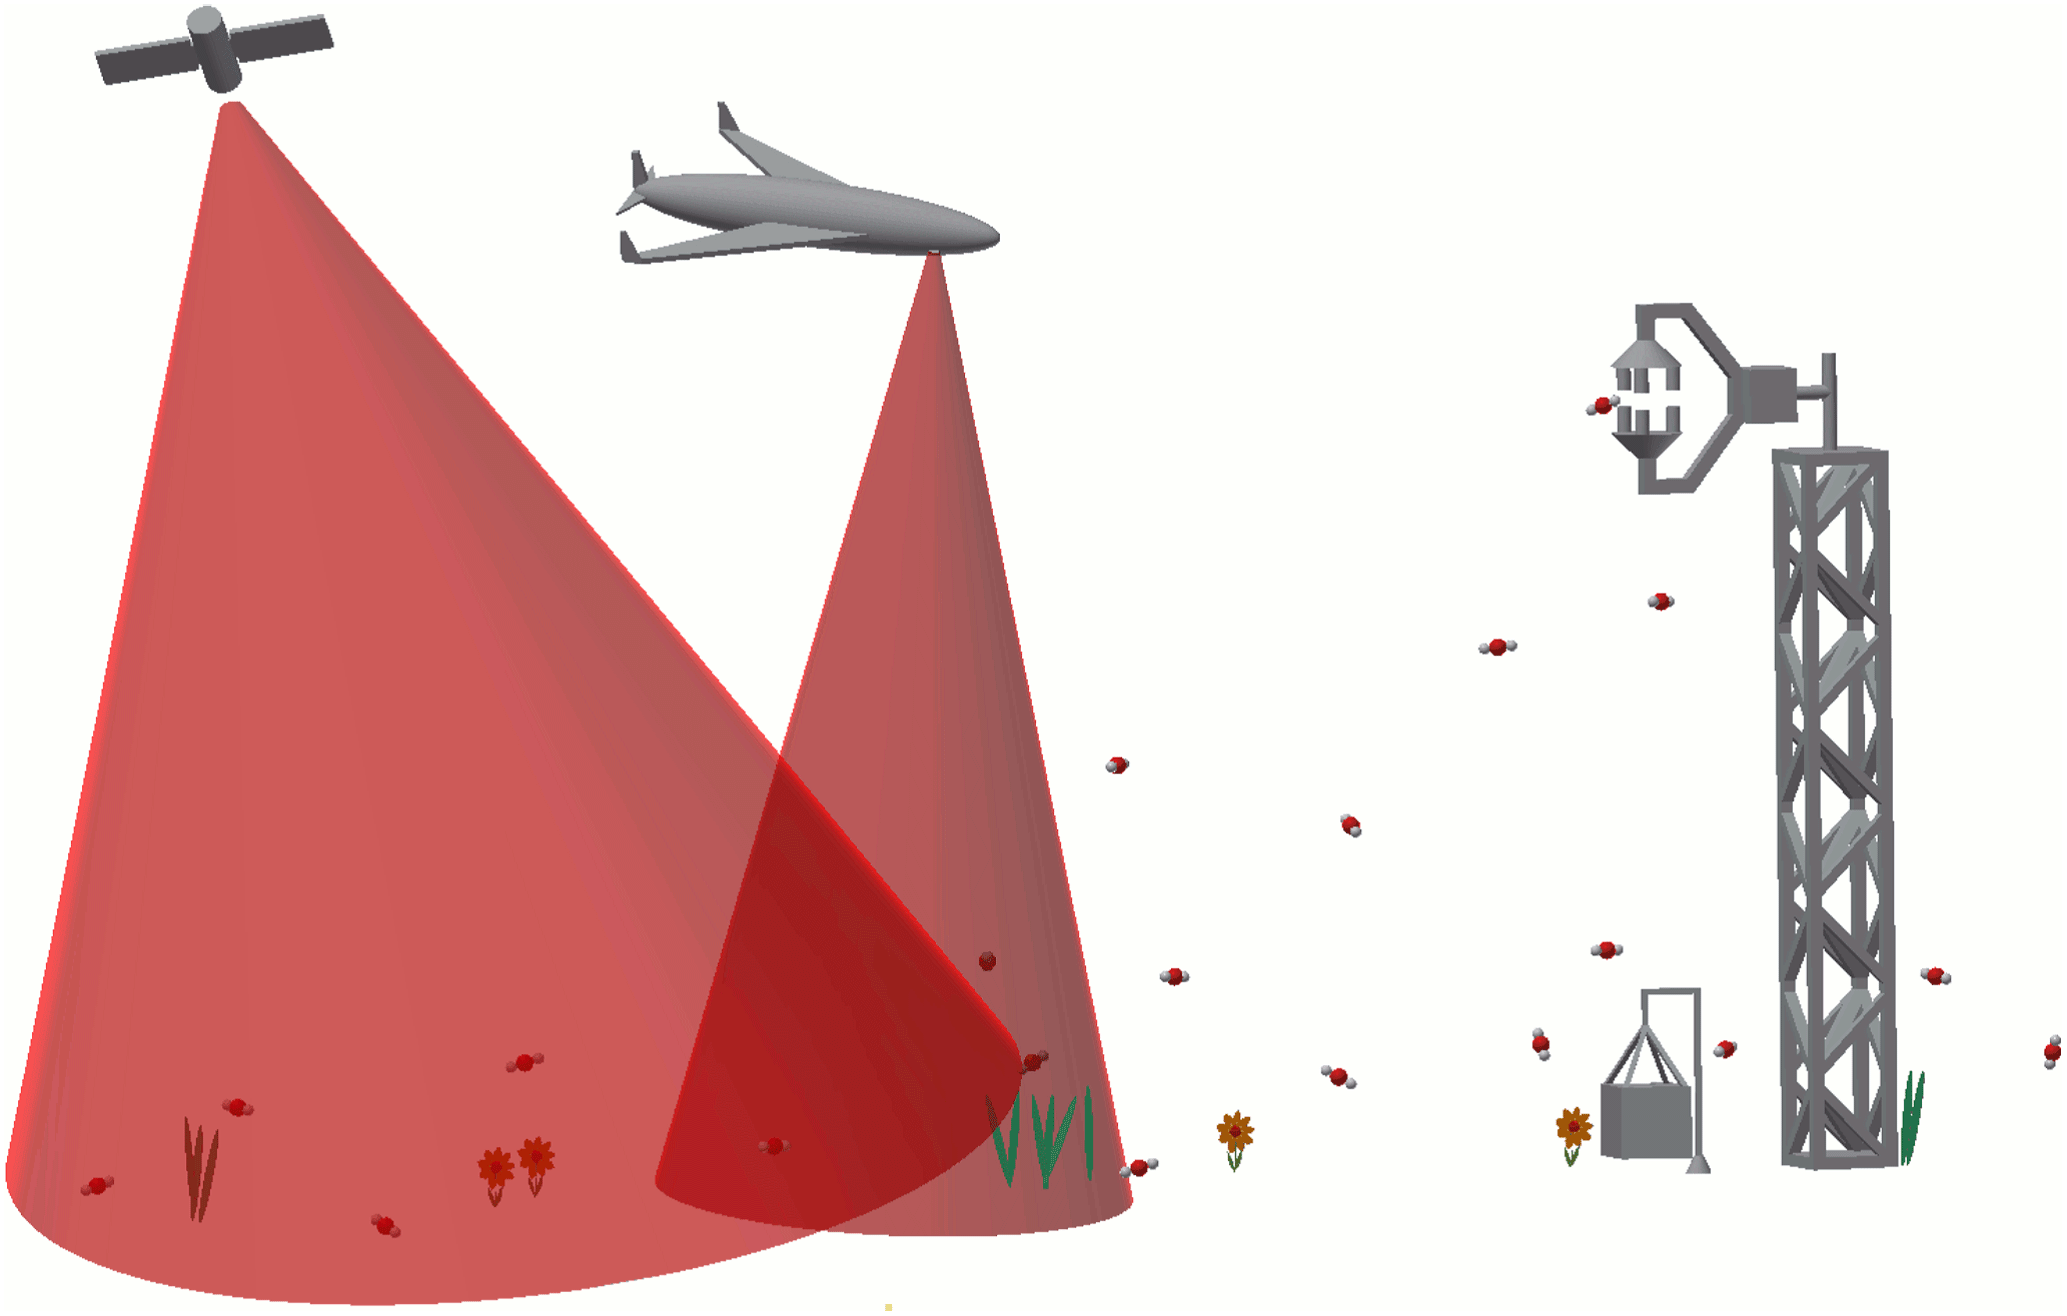
Figure 1Current state-of-the-art approaches for greenhouse gas monitoring to a large extend rely on deploying bulky and expensive laboratory devices in the field. In order to cover large areas remote sensing is currently the only viable option albeit at poor temporal resolution.
In this contribution, an optical sensing technology using so-called non-dispersive infrared absorption (NDIR) spectroscopy and employing a photoacoustic detector is proposed as a central building block for ground-based, wireless gas sensor networks by which current restrictions could be overcome. The sensing concept enables low-cost production of robust, small, and reliable gas detection technology. This way, variations of the gas concentration levels may be monitored in situ and in real time at arbitrary spatial resolution by adjusting the mesh size of the network. The gas detection scheme is intimately related to the original URAS design (Lehrer and Luft, 1942), but considerably simplifies the setup. While in the past highly sensitive and sophisticated, photoacoustic-based approaches have been demonstrated (Bernhardt et al., 2010; Elia et al., 2009; Rey and Sigrist, 2007, 2008; Wu et al., 2017), only recently has the potential for simple yet reliable devices started to gain attention. An early setup to miniaturize the URAS was demonstrated about a decade ago using pressure sensors to gauge the light intensity (Schjølberg-Henriksen et al., 2008). Since then, both thermal emitters as well as light-emitting diodes (LEDs) have been used in combination with gas-based detectors to build gas sensors (Bierer et al., 2018; Knobelspies et al., 2016; Köhring et al., 2015; Kuusela et al., 2009; Scholz et al., 2017; Scholz and Palzer, 2016; Wittstock et al., 2017; Uotila, 2007; Lindley et al., 2007; Chen et al., 2005; Karioja et al., 2010) for various applications. Additionally, we present a simulation comparing the sensitivity of standard NDIR and photoacoustic-based NDIR to highlight the potential for miniaturization when using a gas-based detector. Employing a single channel device consisting only of a light source, a waveguide, and a photoacoustic detector, we show that temperature variations may be compensated for to enable long-term stable operation. Because of the working principle of the device, no cross-sensitivities towards humidity are detected.
The sensor concept is based on a combination of NDIR spectroscopy and photoacoustic signal generation. This combination may be employed for other infrared-active gases, but here its functionality for applications in environmental monitoring is demonstrated using CO2. The sensor consists of a LED1 as a light source, an infrared waveguide simultaneously acting as a measurement cell, and a small cell filled with pure target gas (CO2) at 1 bar pressure that forms the light detector. The relevant spectra are illustrated in Fig. 2b. The emission spectrum of the employed LED at 4.25 µm (2350 cm−1) in the mid-infrared (MIR) spectral range covers the ν3 CO2 absorption band as shown. The MIR is particularly suitable for the formation of a strong photoacoustic signal because the conversion process of optical energy into kinetic energy of the gas molecules is very efficient in this spectral region. Additionally, the MIR features strong absorption lines to promote sensitivity. The detector has an IR transparent window by which the LED radiation can enter the cell. A reflector in the form of an ellipsoidal waveguide realized at an optical path length of z=36 mm is used to guide the LED radiation to the detector. Due to the geometry of the reflector, LED and detector may be arranged in a plane. The bottom of the reflector is open and accessible for ambient air to enable in situ measurements of the CO2 concentration relying on diffusion of ambient CO2 into the probe volume. The setup does not involve filtering membranes that could potentially influence the diffusion process and thus we assume it to be a true in situ device, measuring the CO2 concentration at its position. Relying on diffusion only, no further inlet mechanisms such as pumps to promote the gas exchange are used in the setup. The detector cavity has a cylindrical shape with a length of 3 mm and a diameter of 1.5 mm. The simplicity of the sensor design and the use of low-cost components only are intended to support the production in microsystems technology for mass fabrication.

Figure 2A schematic drawing of the basic setup of NDIR devices, which consist of a light source, an optical path enabling the interaction between light and gas molecules and a light detector to gauge the intensity. In case of no absorption the detected light intensity is at maximum. Absorption consequently leads to a decrease in detected light intensity in accordance with the Beer–Lambert law. The LED emission profile is sensitive to variations in temperature. The emitted intensity decreases with increasing temperature and the LED profile also shifts in position and width. In the top panel on the right, the LED profile in the range between 5 and 35 ∘C relative to the normalized signal at 20 ∘C is shown. In the right bottom panel, the spectral lines of CO2 and H2O are shown for an optical path of 36 mm for a concentration of 400 ppm CO2 and 70 % rel. humidity at 30 ∘C, respectively.
The working principle of the detector is based on the photoacoustic effect, which is why the LED intensity has to be intensity modulated in order to trigger a photoacoustic signal in the detector (Scholz et al., 2017; Scholz and Palzer, 2016). The strength of the detector signal depends on the spectral overlap of the incident radiation at the detector and the absorption characteristics of the detector which determines the sensitive range of the sensor:
where denotes the wavenumber-specific absorption cross section, the number density of the ambient CO2, and z the optical path length. As displayed in Fig. 2, the detector signal decreases when target gas molecules cause an attenuation of the emitted light via absorption on the path between LED and detector. The signal itself is a soundwave at the intensity modulation frequency and is recorded with the MEMS microphone incorporated in the detector cell. To gauge the amplitude of the soundwave, the signal is converted into a digital signal, which is evaluated using the Goertzel algorithm (Goertzel, 1958). In comparison to a thermal emitter (Knobelspies et al., 2016), the use of a LED provides means for fast modulation of arbitrary shapes and a reduction in power consumption. Due to the free choice of the modulation frequency, the signal can be adapted to the best possible operating conditions.
Comparison to standard NDIR
For a gas-based detector filled with the pure target gas at ambient pressures, the spectral response function of the detector is highly similar to the spectral profile of the ambient gas if measuring at ambient pressures. Only those parts of the LED emission spectrum that are resonant with the gas filling may actually be converted into a photoacoustic signal because the signal depends on the absorption properties of the gas molecules enclosed in the detector cell. This characteristic feature is ultimately responsible for the optimized sensor sensitivity. The change in the signal amplitude results from the spectral overlap in both cases. Hence, the signal change is more significant for a sensor employing a gas-based detector in comparison to an identical NDIR sensor on the basis of a detector technology that responds across a broad spectral range under otherwise equal conditions. A simulation of the spectral profiles giving rise to the respective signal strengths for standard NDIR and photoacoustic NDIR is illustrated in Fig. 3. It depicts the spectral profiles of the spectral components for a standard NDIR sensor employing a photodetector and that of a photoacoustic NDIR device.
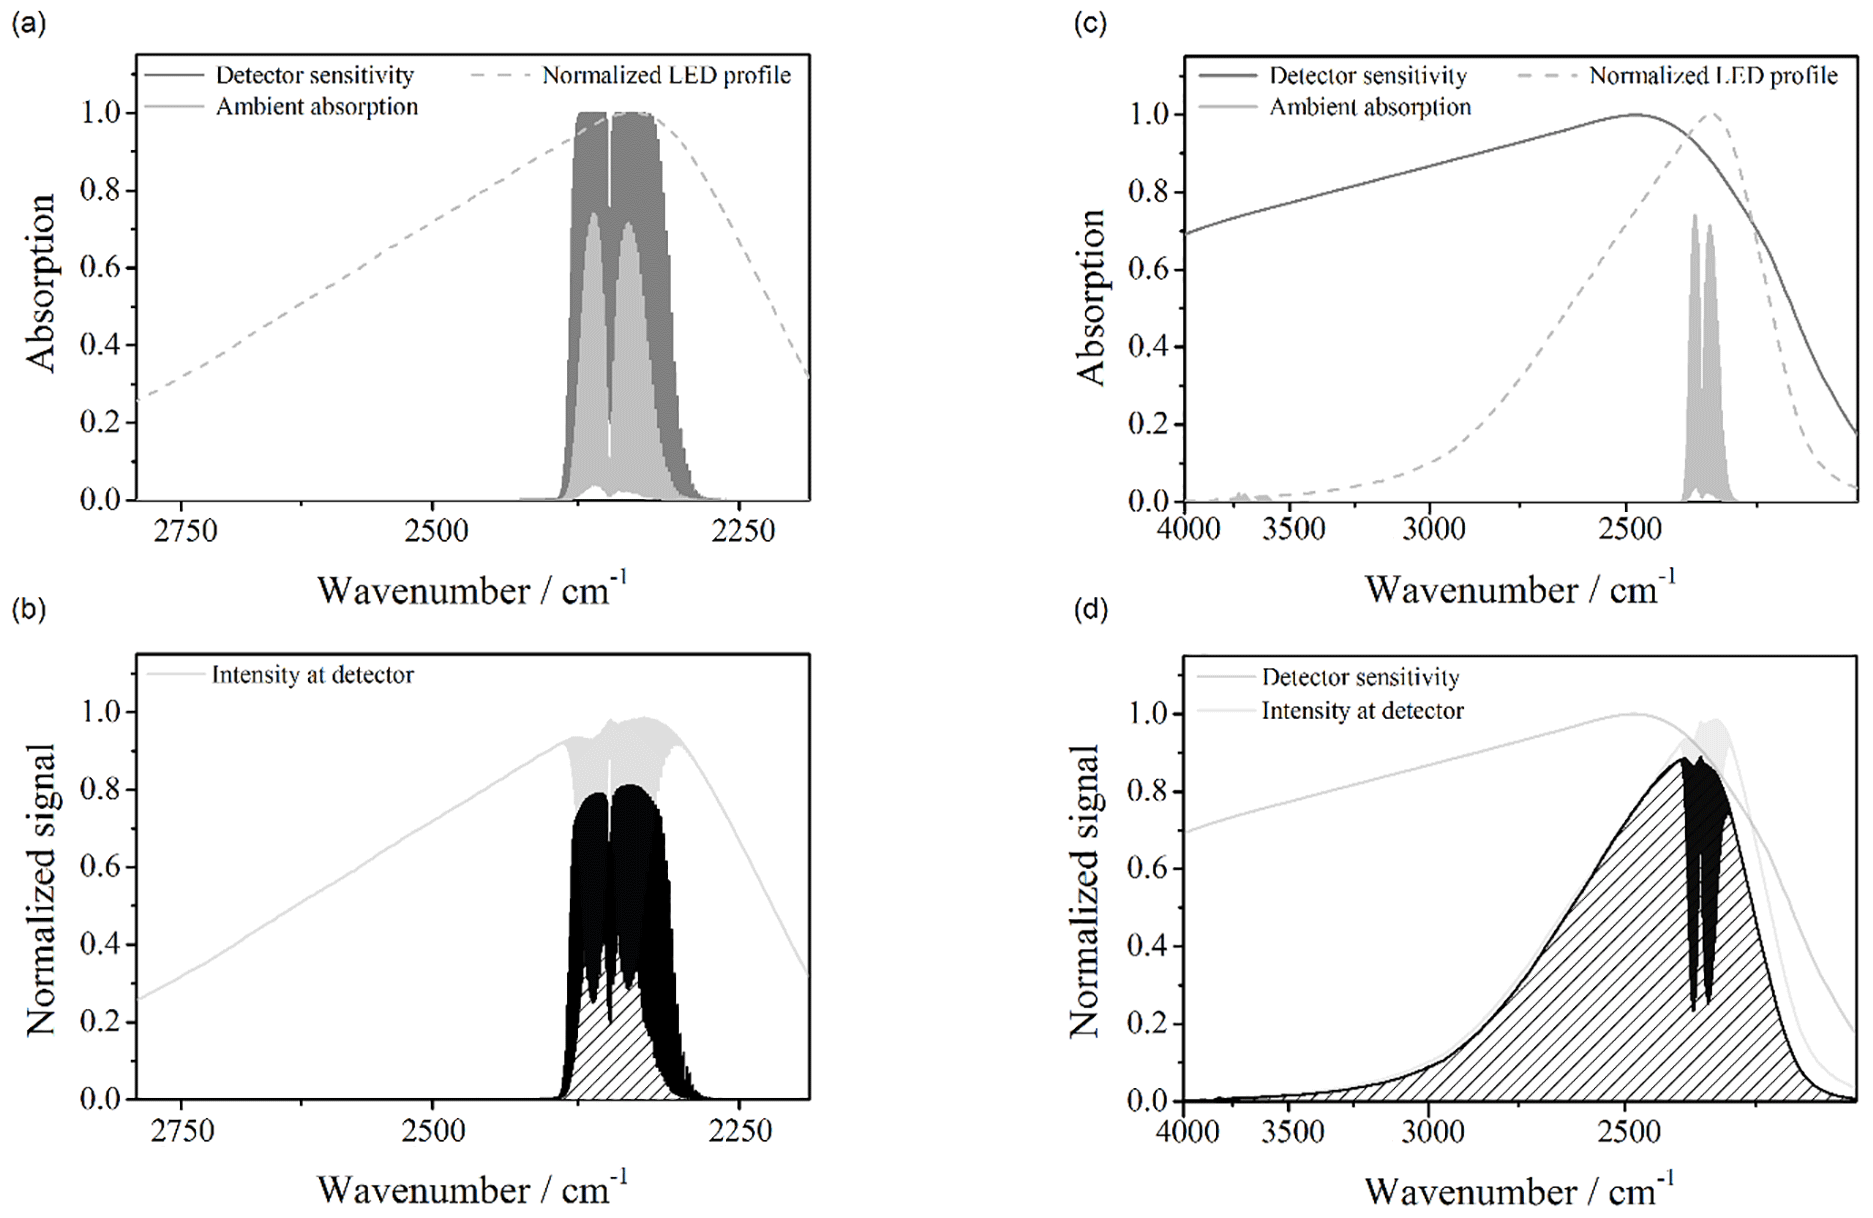
Figure 3(a) The LED's emission profile as well as the simulated absorption spectra of the detector filling and the absorption caused by 1000 ppm along the optical path of 36 mm. (b) The corresponding change in signal strength caused by the absorption is depicted as the black shaded area. (c) The corresponding spectra of a standard NDIR device consisting of the same LED and the same optical path and concentration but using a photodetector to gauge the light intensity. Note the different scale of wavenumbers. (d) The corresponding signal is caused by the same absorption as in the photoacoustic detector, but now the relative change is much smaller.
In the case of the photoacoustic detector the spectral response of the sensor device is the convolution of the LED profile and the absorption lines of CO2. That means that the detector's signal strength is much less affected by spectral portions of the LED spectrum that do not contain information about the CO2 concentration in the optical path. Still, any CO2 absorption will diminish the soundwave amplitude, thus leading to a signal. On the contrary, in the case of a photodetector photons outside the CO2 absorption band will cause a signal. Absorption caused by CO2 will still lead to a diminishing photodetector signal, but the relative change is about 1 order of magnitude lower (see Fig. 4). The enhanced sensitivity can thus be used to realize sensors with much reduced overall size. The sensor response here is defined as
where and A(0) are the soundwave amplitudes and photodetector signal strengths in the presence and absence of CO2, respectively. At higher concentration values and dependent on the optical path length, saturation effects are anticipated that lead to a slight tilt in the sensor response.
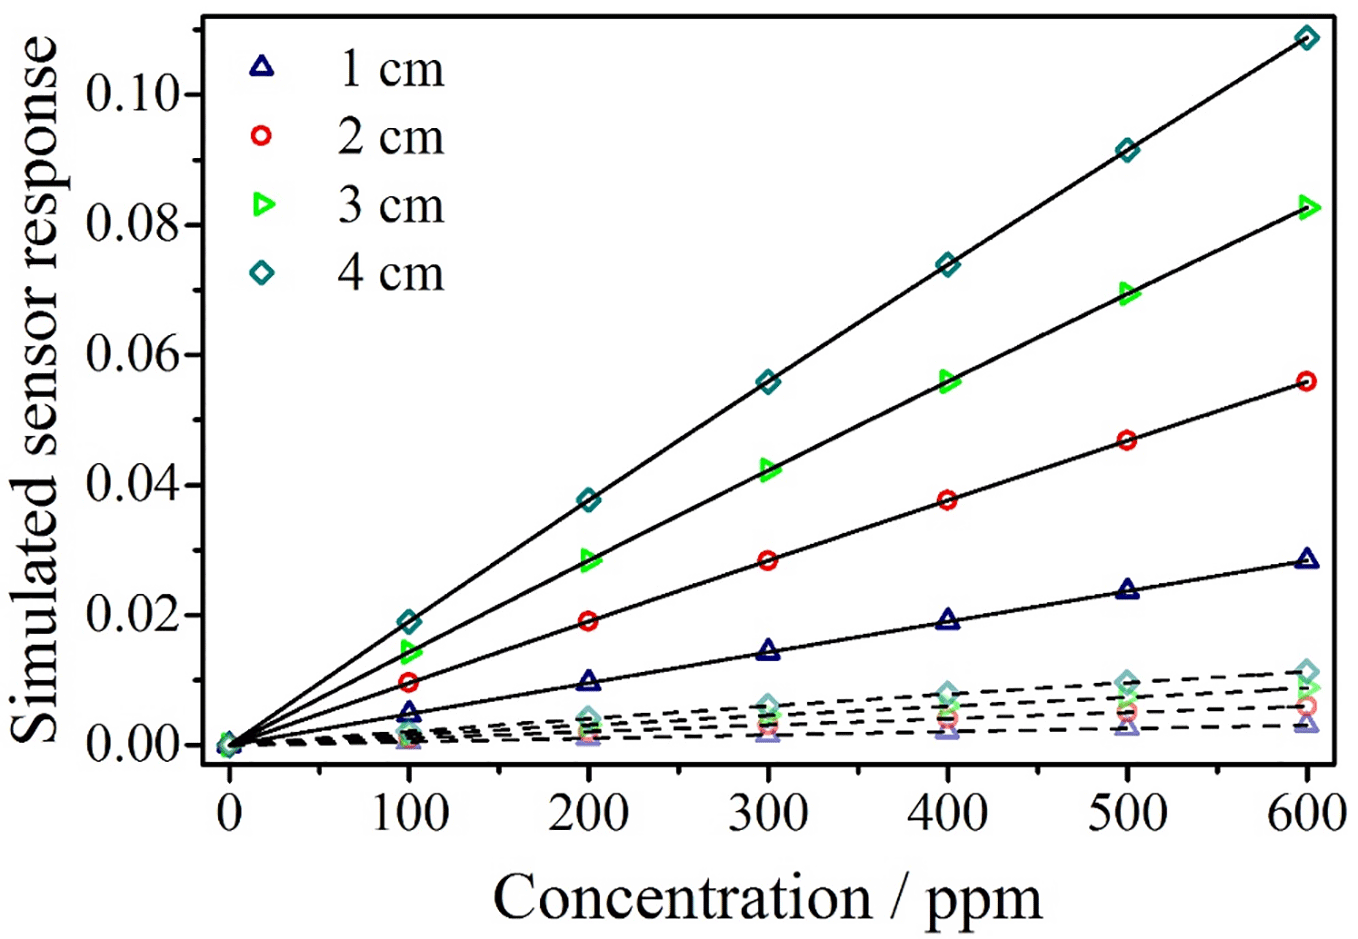
Figure 4Result of the simulated sensor response for various optical path lengths and concentrations in the case of using a photoacoustic detector (solid lines) and in the case of a photodetector (dotted lines). The sensitivity increases by about 1 order of magnitude. E.g. while 600 ppm cause a sensor response of > 5.5 % at 2 cm optical path using a photoacoustic detector, the same optical path results in a change of about 0.6 % using a photodetector.
The requirements for a suitable sensor in environmental monitoring are high with regard to the stability against changing ambient conditions. The sensor should be prepared for various situations, including rain, snow, wind, and temperatures in the range of at least −30 up to +50 ∘C. Besides, they have to cope with different levels of humidity and the probable influence of other ambient gases. One of the major difficulties in optical sensing today is, however, an instable light detector signal under varying temperatures mainly caused by the temperature dependency of the light-sensing element. State-of-the-art detector technology often requires temperature stabilization, which triggers high energy expenditure, costs, and efforts. The signal amplitude of the sensor developed in this contribution also shows a behaviour that correlates with temperature. Although the photoacoustic effect is basically temperature-driven, the main influence results from the temperature dependency of the LED emission profile (Wittstock et al., 2017). As displayed in Fig. 2, the LED output power as well as the position and width of the LED spectrum shift with temperature, whereas the shift in the CO2 absorption spectrum of the detector filling is only minor. Due to a change in the overlap between the spectral profile of the LED and that of the photoacoustic detector, an influence on the sensitivity is anticipated. However, it was found that the temperature dependency is well described by a polynomial relation and can thus be easily corrected for. Consequently, the ambient temperature is measured in parallel to the sensor signal. The sensor does not require any kind of active temperature control, which is a major step forward to the goal of the development of a sensor that is free of environmental influences or that can easily cope with them.
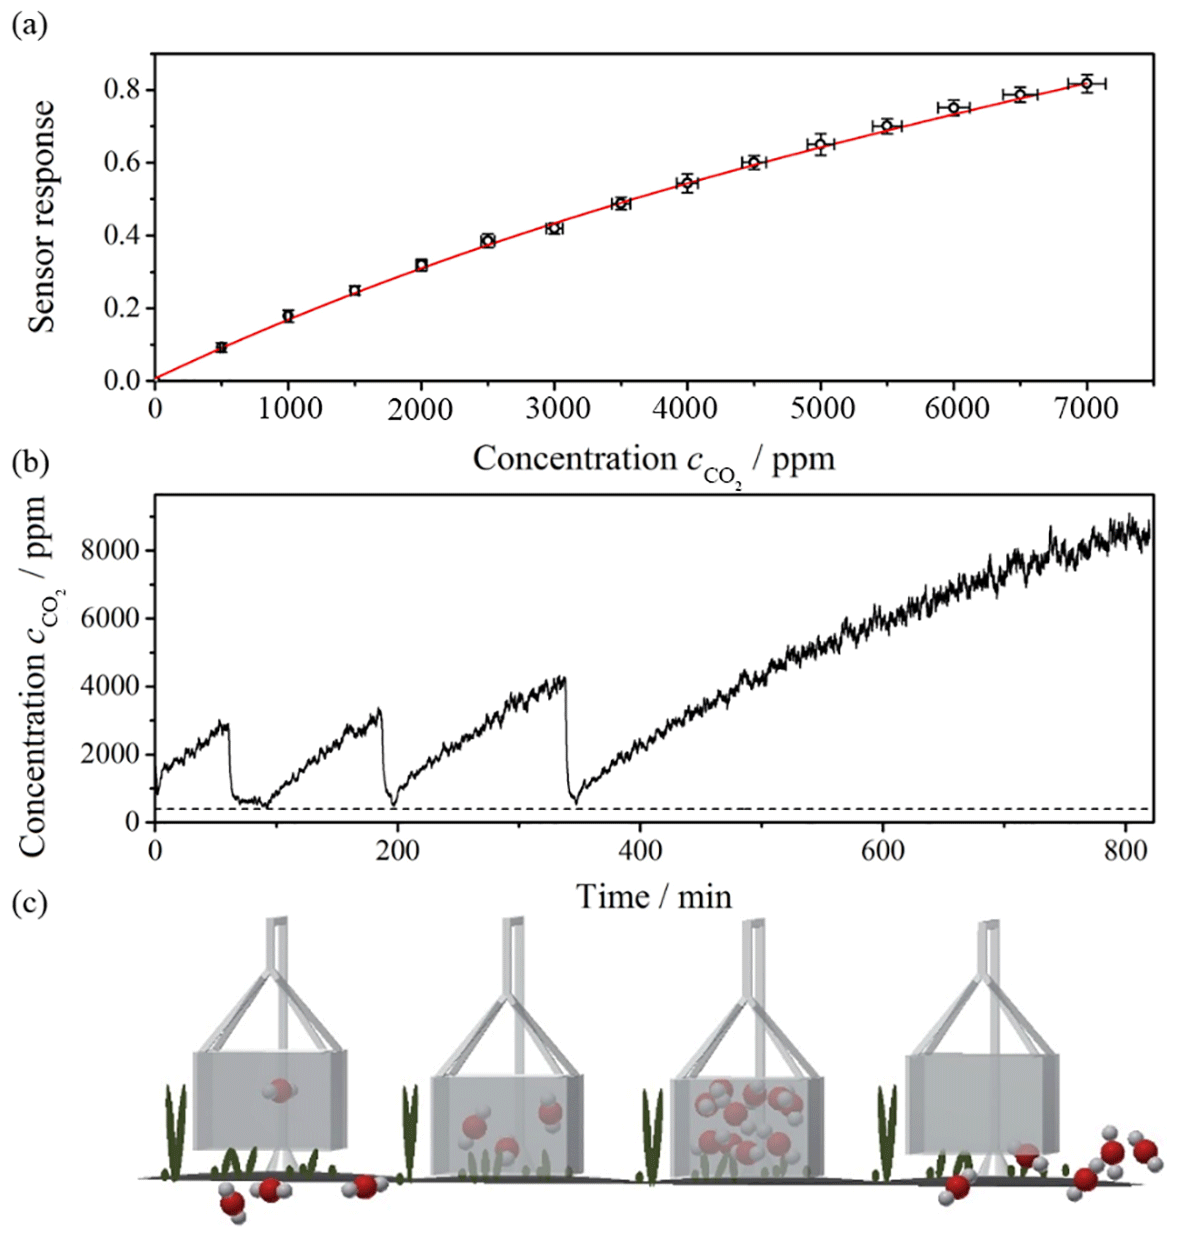
Figure 5Calibration of the experimental CO2 photoacoustic NDIR device and proof-of-principle measurement. The calibration measurement reveals a non-linear sensitivity, which limits the resolution capabilities in the high concentration range. The proof-of-principle measurement demonstrates the capability of the sensor device to monitor the dynamics of plant respiration with an adequate temporal resolution.
The presence of other absorbing gases apart from the target gas can affect the strength of the sensor signal when they have absorption lines within the spectral overlap of the LED emission profile and the sensitive range of the detector. In general, the influence of other gases can be suppressed or at least minimized by the choice of a suitable spectral range in which other probably expected gases do not absorb. In environmental monitoring, the most important interfering species is that of water vapour because it absorbs almost throughout the whole infrared spectral range. In this regard, the spectral range between 3 and 5 µm forms an exception and is therefore perfectly suited for gas detection with almost zero cross-interference by humidity. As can be seen in Fig. 2, the spectral lines of CO2 and water do not overlap within the LED spectrum. This is why no influence is observed (Scholz et al., 2017). However, moisture can affect the performance of a sensor under condensation conditions. In this case, water droplets may accumulate at the surface of the sensor components, which reduces the radiation at the detector due to scattering. This can be countered by the use of a water-repellent but gas-permeable membrane within the sensor design. In order to demonstrate the suitability of the sensor, measurements were performed in the laboratory for calibration purposes as well as in simulated field conditions.
The relation between sensor response and concentration has been used to calibrate the sensor signal using an apparatus to control test gas concentrations in the laboratory (Kneer et al., 2014). The absolute precision of the system used to control individual mass flows is 0.3 %. The concentration of the certified CO2 gas cylinder used in the experiments is stated as (39 900 ± 800) ppm. With a total gas flow of 1 L min−1, this leads to a maximum deviation of 140 ppm from the set concentration value which is taken into account when calculating the sensor response. Figure 5a shows the sensor calibration measurement for concentrations in the range of 500–7000 ppm CO2. Each value has been calculated as the average of the last 300 measurement values from each concentration step in order to ensure constant, steady-state CO2 concentrations inside the measurement chamber. The corresponding measurement error was calculated using the standard deviation . Each individual measurement value is calculated using the Goertzel algorithm as described in Scholz et al. (2017). This allows for a possibly high measurement frequency and enables the device to monitor rapid changes in the CO2 concentration. A cubic fit was used to approximate the sensor response. Using 3.3× the average of the measurement errors, a limit of detection of 345 ppm has been calculated for the linear part of the fit near 0 ppm. The average resolution in the range up to 7000 ppm has been determined to be 560 ppm (3σ). The underlying, temperature-corrected measurement is based on a sensor with an LED drive current of 80 mA electronically modulated at fMod=300 Hz and a duty cycle of 50 %. The power requirements of the sensor operated this way are only 65 mW, which is also mainly governed by the LED. The calibrated sensor was used to monitor the respiration of a plant enclosed within an opaque box with a volume of 9000 cm3. When the box is closed, CO2 is produced by the plant, leading to an increase in background CO2 level. After a certain time, the box is opened and thereby aired before it is closed for a further measurement cycle again. The setup and conduction of the experiment basically resemble the approach of chamber measurements often used in environmental monitoring for point measurements as illustrated in Fig. 5c (Rochette et al., 1997). As can be seen in the corresponding measurement in Fig. 5b, the box was opened at approximately 200 and 340 min after the beginning of the experiment for a short time in which the CO2 concentration in the box returns to the ambient (background) level at approximately 400 ppm. Afterwards, the concentration increases again in a very similar manner. Among other things, the NDIR detection scheme was chosen because of its scalability with regards to the optical path length. This allows for adaption to the sensitivity of the sensor and the detection limit to a suitable range so that even lower concentrations can be monitored at reasonable resolutions for other measurement tasks.
To support the extensive data collection on the distribution and the dynamics of important greenhouse gases, a low-cost sensor suited for the monitoring of CO2 concentration levels in environmental applications is presented. It allows for analytic, specific, and quantitative gas measurements at high measurement frequencies on the one hand and for reliable measurements under field conditions on the other hand because of the robustness of the detection scheme. Due to its simple design it provides the option for implementation in microsystems technology. Therefore, the suggested technology is almost ideal for manufacturing in large numbers to support a widespread distribution of the sensors. Since the power requirements are in the mW range, the sensor principle is well suited to be combined with a solar panel or similar to form the nodes of an in situ sensor network by which globally comparable data on the concentration levels of a target gas can be assessed on adjustable scales over a long period of time. The sensor principle can be easily adapted to other infrared active gases such as methane.
The underlying measurement data are not publicly available and can be requested from the authors if required.
LS performed the measurements and the related analysis. LS, AOP, and BB designed and improved the system's electronics and firmware. LS and SP designed the experiments and wrote the manuscript.
The authors declare that they have no conflict of interest.
This article is part of the special issue “Sensors and Measurement Systems 2018”. It is a result of the “Sensoren und Messsysteme 2018, 19. ITG-/GMA-Fachtagung”, Nürnberg, Germany, from 26 June 2018 to 27 June 2018.
Stefan Palzer acknowledges funding from the Community of Madrid under grant number
2016-T1/AMB-1695. Benedikt Bierer was supported by scholarship funds from the State
Graduate Funding Program of Baden-Württemberg (DENE).
Edited by: Andreas Schütze
Reviewed by: two anonymous referees
Bernhardt, R., Santiago, G. D., Slezak, V. B., Peuriot, A., and González, M. G.: Differential, LED-excited, resonant NO2 photoacoustic system, Sensor. Actuat. B-Chem., 150, 513–516, https://doi.org/10.1016/j.snb.2010.09.007, 2010.
Bierer, B., Nägele, H. J., Perez, A. O., Wöllenstein, J., Kress, P., Lemmer, A., and Palzer, S.: Real-Time Gas Quality Data for On-Demand Production of Biogas, Chem. Eng. Technol., 41, 696–701, https://doi.org/10.1002/ceat.201700394, 2018.
Bouwman, A. F. (Ed.): Approaches to Scaling of Trace Gas Fluxes in Ecosystems, 1st ed., Elsevier Science, 1999.
Chen, T., Su, G., and Yuan, H.: In situ gas filter correlation: Photoacoustic CO detection method for fire warning, Sensors Actuat. B, 109, 233–237, https://doi.org/10.1016/j.snb.2004.12.055, 2005.
Elia, A., Lugarà, P. M., di Franco, C., and Spagnolo, V.: Photoacoustic techniques for trace gas sensing based on semiconductor laser sources, Sensors, 9, 9616–9628, https://doi.org/10.3390/s91209616, 2009.
Goertzel, G.: An Algorithm for the Evaluation of Finite Trigonometric Series, Am. Math. Mon., 65, 34–35, https://doi.org/10.2307/2310304, 1958.
Karioja, P., Keränen, K., Kautio, K., Ollila, J., Heikkinen, M., Kauppinen, I., Kuusela, T., Matveev, B., McNie, M. E., Jenkins, R. M., and Palve, J.: LTCC-based differential photo acoustic cell for ppm gas sensing, 77260H, https://doi.org/10.1117/12.851854, 2010.
Kneer, J., Eberhardt, A., Walden, P., Ortiz Pérez, A., Wöllenstein, J., and Palzer, S.: Apparatus to characterize gas sensor response under real-world conditions in the lab, Rev. Sci. Instrum., 85, 055006, https://doi.org/10.1063/1.4878717, 2014.
Knobelspies, S., Bierer, B., Ortiz Perez, A., Wöllenstein, J., Kneer, J., and Palzer, S.: Low-cost gas sensing system for the reliable and precise measurement of methane, carbon dioxide and hydrogen sulfide in natural gas and biomethane, Sensor. Actuat. B-Chem., 236, 885–892, https://doi.org/10.1016/j.snb.2016.03.022, 2016.
Köhring, M., Böttger, S., Willer, U., and Schade, W.: LED-absorption-QEPAS sensor for biogas plants, Sensors, 15, 12092–12102, https://doi.org/10.3390/s150512092, 2015.
Kuusela, T., Peura, J., Matveev, B. A., Remennyy, M. A., and Stus', N. M.: Photoacoustic gas detection using a cantilever microphone and III-V mid-IR LEDs, Vib. Spectrosc., 51, 289–293, https://doi.org/10.1016/j.vibspec.2009.08.001, 2009.
Lees, K. J., Quaife, T., Artz, R. R. E., Khomik, M., and Clark, J. M.: Potential for using remote sensing to estimate carbon fluxes across northern peatlands – A review, Sci. Total Environ., 615, 857–874, https://doi.org/10.1016/j.scitotenv.2017.09.103, 2018.
Lehrer, G. and Luft, K.: Verfahren zur Bestimmung von Bestandteilen in Stoffgemischen mittels Strahlungsabsorption, DRP 730, 478, 1942.
Lindley, R. E., Parkes, A. M., Keen, K. A., McNaghten, E. D., and Orr-Ewing, A. J.: A sensitivity comparison of three photoacoustic cells containing a single microphone, a differential dual microphone or a cantilever pressure sensor, Appl. Phys. B., 86, 707–713, https://doi.org/10.1007/s00340-006-2543-0, 2007.
Moss, R. H., Edmonds, J. A., Hibbard, K. A., Manning, M. R., Rose, S. K., Van Vuuren, D. P., Carter, T. R., Emori, S., Kainuma, M., Kram, T., Meehl, G. A., Mitchell, J. F. B., Nakicenovic, N., Riahi, K., Smith, S. J., Stouffer, R. J., Thomson, A. M., Weyant, J. P., and Wilbanks, T. J.: The next generation of scenarios for climate change research and assessment, Nature, 463, 747–756, https://doi.org/10.1038/nature08823, 2010.
Rey, J. M. and Sigrist, M. W.: Differential mode excitation photoacoustic spectroscopy: A new photoacoustic detection scheme, Rev. Sci. Instrum., 78, 063104, https://doi.org/10.1063/1.2746817, 2007.
Rey, J. M. and Sigrist, M. W.: New differential mode excitation photoacoustic scheme for near-infrared water vapour sensing, Sensor. Actuat. B-Chem., 135, 161–165, https://doi.org/10.1016/j.snb.2008.08.002, 2008.
Rochette, P., Ellert, B., Gregorich, E. G., Desjardins, R. L., Pattey, E., Lessard, R., and Johnson, B. G.: Description of a dynamic closed chamber for measuring soil respiration and its comparison with other techniques, Can. J. Soil Sci., 77, 195–203, https://doi.org/10.4141/S96-110, 1997.
Schjølberg-Henriksen, K., Schulz, O., Ferber, A., Moe, S., Lloyd, M., Müller, G., Suphar, K. H., Wang, D. T., and Bernstein, R. W.: Sensitive and Selective Photoacoustic Gas Sensor Suitable for High-Volume Manufacturing, IEEE Sens. J., 8, 1539–1545, https://doi.org/10.1109/JSEN.2008.923588, 2008.
Scholz, L. and Palzer, S.: Photoacoustic-based detector for infrared laser spectroscopy, Appl. Phys. Lett., 109, 041102, https://doi.org/10.1063/1.1150114, 2016.
Scholz, L., Ortiz Perez, A., Bierer, B., Eaksen, P., Wöllenstein, J., and Palzer, S.: Miniature low-cost carbon dioxide sensor for mobile devices, IEEE Sens. J., 17, 2889–2895, https://doi.org/10.1109/JSEN.2017.2682638, 2017.
Schuur, E. A. G., McGuire, A. D., Schädel, C., Grosse, G., Harden, J. W., Hayes, D. J., Hugelius, G., Koven, C. D., Kuhry, P., Lawrence, D. M., Natali, S. M., Olefeldt, D., Romanovsky, V. E., Schaefer, K., Turetsky, M. R., Treat, C. C., and Vonk, J. E.: Climate change and the permafrost carbon feedback, Nature, 520, 171–179, https://doi.org/10.1038/nature14338, 2015.
Solomon, S., Plattner, G.-K., Knutti, R., and Friedlingstein, P.: Irreversible climate change due to carbon dioxide emissions, P. Natl. Acad. Sci. USA, 106, 1704–1709, https://doi.org/10.1073/pnas.0812721106, 2009.
Uotila, J.: Comparison of infrared sources for a differential photoacoustic gas detection system, Infrared Phys. Technol., 51, 122–130, https://doi.org/10.1016/j.infrared.2007.05.001, 2007.
Wang, K., Liu, C., Zheng, X., Pihlatie, M., Li, B., Haapanala, S., Vesala, T., Liu, H., Wang, Y., Liu, G., and Hu, F.: Comparison between eddy covariance and automatic chamber techniques for measuring net ecosystem exchange of carbon dioxide in cotton and wheat fields, Biogeosciences, 10, 6865–6877, https://doi.org/10.5194/bg-10-6865-2013, 2013.
Wittstock, V., Scholz, L., Bierer, B., Perez, A. O., Wöllenstein, J., and Palzer, S.: Design of a LED-based sensor for monitoring the lower explosion limit of methane, Sensor. Actuat. B-Chem., 247, 930–939, https://doi.org/10.1016/j.snb.2017.03.086, 2017.
Wu, H., Dong, L., Zheng, H., Yu, Y., Ma, W., Zhang, L., Yin, W., Xiao, L., Jia, S., and Tittel, F. K.: Beat frequency quartz-enhanced photoacoustic spectroscopy for fast and calibration-free continuous trace-gas monitoring, Nat. Commun., 8, 1–8, https://doi.org/10.1038/ncomms15331, 2017.