the Creative Commons Attribution 4.0 License.
the Creative Commons Attribution 4.0 License.
 | 12 Oct 2018
A customized stand-alone photometric Raman sensor applicable in explosive atmospheres: a proof-of-concept study
Marcel Nachtmann
Shaun Paul Keck
Frank Braun
Hanns Simon Eckhardt
Christoph Mattolat
Norbert Gretz
Stephan Scholl
Matthias Rädle
This paper presents an explosion-proof two-channel Raman photometer designed for chemical process monitoring in hazardous explosive atmospheres. Due to its design, alignment of components is simplified and economic in comparison to spectrometer systems. Raman spectrometers have the potential of becoming an increasingly important tool in process analysis technologies as part of molecular-specific concentration monitoring. However, in addition to the required laser power, which restricts use in potentially explosive atmospheres, the financial hurdle is also high. Within the scope of a proof of concept, it is shown that photometric measurements of Raman scattering are possible. The use of highly sensitive detectors allows the required excitation power to be reduced to levels compliant for operation in potentially explosive atmospheres. The addition of an embedded platform enables stable use as a self-sufficient sensor, since it carries out all calculations internally.
Multi-pixel photon counters (MPPCs) with large detection areas of 1350 µm2 are implemented as detectors. As a result, the sensitivity of the sensor is strongly increased. This gain in sensitivity is primarily achieved through two characteristics: first, the operating principle “avalanche breakdown” to detect single photons is used; second, the size of the image projected onto the MPPC is much bigger than the pixel area in competing Raman-Spectrometers resulting in higher photon flux. This combination enables reduction of the required excitation power to levels compliant for operation in potentially explosive atmospheres. All presented experiments are performed with strongly attenuated laser power of 35 mW. These include the monitoring of the analytes ethanol and hydrogen peroxide as well as the reversible binding of CO2 to amine. Accordingly, the described embedded sensor is ideally suited as a process analytical technology (PAT) tool for applications in environments with limitations on power input.
- Article
(428 KB) - Full-text XML
- BibTeX
- EndNote


Molecular-specific concentration monitoring based on the Raman effect is becoming an inline tool for process analysis technology (PAT) in an increasing number of areas of the chemical industry. Up to now, this function has mainly been operated by spectrometer systems and spectra are recorded over the complete measuring range. However, the wealth of spectral information of a spectrometer is not needed in all applications. In the field of UV–VIS–NIR and fluorescence spectroscopy, photometric concepts have become established in addition to spectrometer systems. These reduce the data throughput considerably, since only bands specific to the process are detected and, for example, forwarded to a process control system (PCS). This paper outlines the development of a Raman photometer for potentially explosive environments as well as some areas of application. A particular focus is on the selection and integration of the sensors used as well as the overall sensor concept (VDI/VDE, 2015; Schwolow et al., 2015; IEC60079-28:2015, 2015; IEC60079-0:2017, 2017).
2.1 Raman theory
The presented photometer utilizes the Raman effect, which describes inelastic scattering of electromagnetic radiation. This photon–molecule interaction can be subclassified into Stokes and anti-Stokes scattering. In the following, the theoretical background is explained in principle by Stokes scattering (Bumbrah et al., 2016; Edwards et al., 2005; Pudlas, 2012).
When exciting a molecule with a laser, it can be raised from the ground state to a virtual energy level. Disexcitation is achieved by photon emission while the molecule returns not to the ground state but to a vibrational excited state. The emitted radiation is called Stokes scattering. Since energy remains in the molecule, the emitted radiation has a lower frequency and thus a higher wavelength compared to the exciting photon. This shift (excitation to scattering) is relative to the excitation wavelength and gives information about the covalent bonds of the excited molecule. Besides other dependencies, the intensity of Raman scattering is directly proportional to the intensity of the excitation laser (Bumbrah et al., 2016; Edwards et al., 2005; Pudlas, 2012). The mathematical correlation of the intensity with the excitation wavelength ν, the excitation power I0, the number of scattering molecules n and polarizability of the molecules are given by the following formula:
2.2 Raman photometers
The main focus of this article lies in the photometric detection of Raman scattering. For the sake of completeness spectrometric applications will only be mentioned when relevant for comparison. An in-depth view of Raman spectrometry can be gained from overview articles such as De Beer (2012) and Rantanen (2007).
The development and production of low-cost Raman sensors has been an ambition of the analytical industry for some time. Several patents have accumulated in relation to laser photometers in general and Raman photometers in particular. Increasingly, since the 1950s, different companies and research groups have published photometric techniques. The state of the art is as follows.
A 2007 patent (US8077309B2) describes a Raman photometer for industrial process control. This is the only product available on the market. It is marketed under the name “RPM® View” by Hamilton Sundstrand. The patent describes some possibilities for the design of a photometer. A main feature of the system is a rotating filter wheel. Different filters are fitted in this component, which guarantee sequential measurements at different wavelengths. This makes it possible to track different peaks or to carry out a reference measurement. However, a rotating wheel stands in the way of a required simultaneous measurement of reference and measuring signal. In chemical reactions, process parameters can change within a very short period of time, which is why a temporal offset is not effective and distorts the measurement. The optical set-up presented in this article differs in its approach, especially to ensure simultaneous measurements of analyte and reference (Brown et al., 2007).
The patent (DE000002103318B) from 1970 deals with the basic design of a scattered light photometer. A collimated laser is focused on a sample by means of optical lenses through an aperture. This separates the radiation scattered at a certain angle from interfering light via a further aperture. An optical lens focuses the light onto another aperture. A collimator lens directs the scattered electromagnetic radiation to a detector unit. The structure is designed for a defined scattering angle. However, the Raman effect occurs in all spatial directions (Kaye, 1974).
Furthermore, there are developments that approach the topic with a spectrophotometer approach. This is described in a 1971 publication by Berenblut and Dawson entitled “The modification of a Cary model 81 Raman spectrophotometer for use with a laser”. The measuring device was built in the 1950s. This photometer consists of a laser cleaned by a narrow bandpass filter at 632.8 nm. The emitted laser beam hits a wave plate. This rotates the polarization direction of the linearly polarized laser light by an undefined angle. A deflecting mirror directs the light onto the sample. The Raman signal generated is imaged onto a detector via a convex lens. A polarization filter removes the excitation radiation. Due to the optical components used, this design cannot be compared with the one presented in this article. In the last 70 years, the development of optical elements has made important progress in coating processes and detector-side sensitivity as well as stabilized, narrow-band laser light sources (Berenblut and Dawson, 1972; Rea et al., 1957; Szymanski, 1967).
Given these facts, the paper presents the development of an updated, state-of-the-art photometer. The main focus of this publication is on a self-sufficient operation in a process-related environment and the general sensor concept.
2.3 ATEX guidelines
Industrial environments impose additional challenges on the applicability of measurement equipment: in chemical plants many flammable liquids and gases in combination with ambient oxygen constitute an explosion risk. During the conception of measurement systems, the existing guidelines have to be considered and the safety concept has to be proved, validated and finally certified by a nominated body. The key idea is to identify dangers (e.g. by electrical or optical power, electrostatic discharge) and subsequently take action to eliminate this hazard in a failsafe manner. In the described development the measurement principle itself requires a relatively high-powered laser source and thus was identified as a relevant danger in an atmosphere where oxygen is present. Depending on the power range and the ATEX Zones, strategies to prevent explosions have to be considered: inertization with nitrogen, the reduction of optical power below a specific limit, the separation of zones and encapsulations for the measurement system as well as electrical grounding of components can be taken into consideration (Directive 2014/34/EU (ATEX), 2014; IEC60079-28:2015, 2015; IEC60079-0:2017, 2017).
To facilitate the safety discussions, measurements were performed below the critical level of 35 mW, which corresponds to material classes IIb and IIc in the temperature classes T1 to T4 (IEC 60079-28:2015). This condition explicitly excludes carbon disulfide. In order to use the laser source permanently in the process environment a certification process has been started to ensure failsafe operation and fulfil optical intrinsically safe (opis) conditions. After a successful validation of the safety concept by a nominated body, an Ex-d pressure-capsulated housing is sufficient to contain the electrical components in combination with a feed-through for optical fibres and electrical wiring.
2.4 Possible applications
A photometric approach for process-suited detection of Raman scattering has manifold potential applications. In their review of Raman spectroscopy as a process analytical technology for pharmaceutical manufacturing and bio-processing Esmonde-White et al. (2017) describe the tracking of specific ethanol and glucose peaks in the fingerprint region. The current photometer set-up is viable for these measurement conditions. Frauendorfer et al. (2016) observed vinyl acetate resin polymerization by tracking both monomer consumption and polymer creation at 1640 and 1730 cm−1. Furthermore, the explosive atmosphere during polymerization required the reduction of optical power to 35 mW. These prerequisites can be met by the presented photometer. Wang et al. (2017) measured Stokes shifts at 1157 and 1516 cm−1 for label-free high-throughput screening of microalgal single cells. The increased photometric detection sensitivity is highly suitable for short integration and accordingly measurement times. Ebrahimi et al. (2017) used Raman spectroscopy for in-line monitoring of hydrogen peroxide in two-phase reactions. Arcis et al. (2017) proposed the application of Raman spectroscopy for monitoring the ionization of boric acid in water for geochemistry, for industrial chemistry and in pressurized water nuclear reactors by measuring Raman shifts at 870 and 930 cm−1. (Arcis et al., 2016; Ebrahimi, 2017; Esmonde-White et al., 2017; Frauendorfer and Hergeth, 2016; Wang et al., 2017)
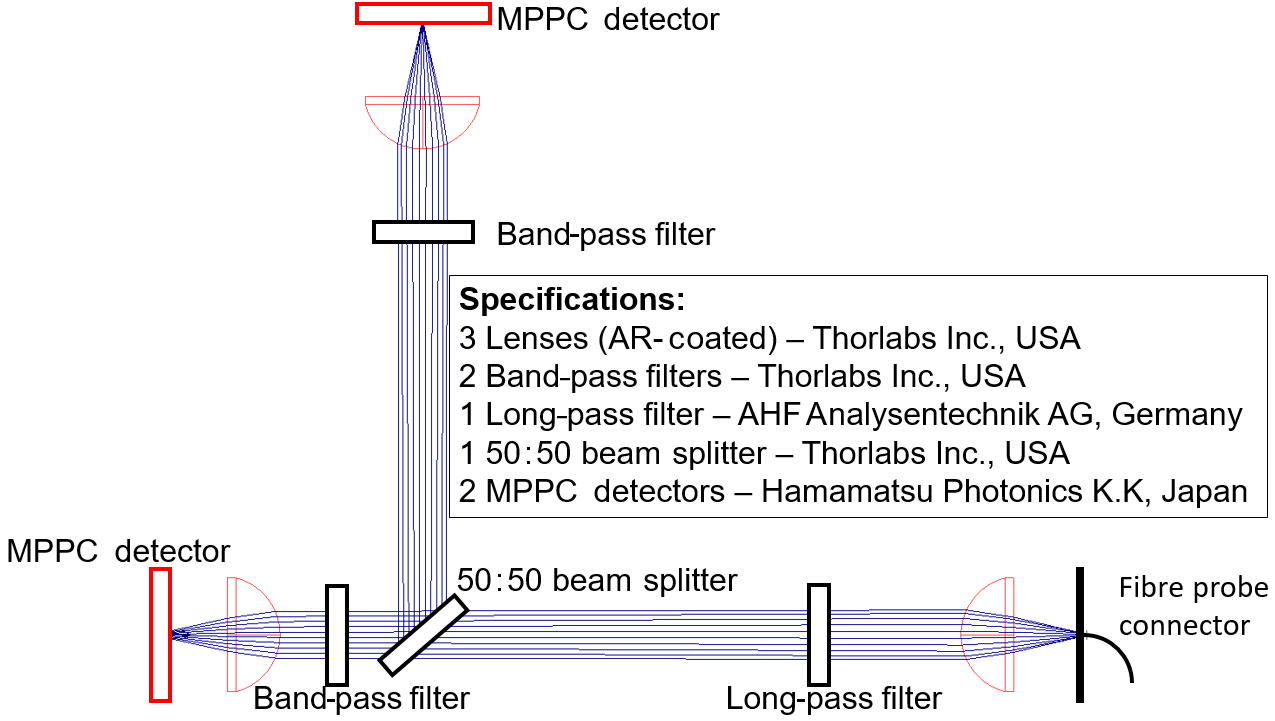
Photometer concepts have not yet been established in Raman measurement technology and most patents only refer to the detection of the Raman effect in exceptional cases. So far only one device is available on the market (see Sect. 2.1). The selection of detectors and filters adapted to the application presents the biggest challenge in the development of a novel Raman photometer. Single-photon avalanche diode detectors (SPADs) and tuneable filters (Semrock, Inc, New York, USA), for a more universal application, were chosen. The replacement of these filters with a fixed filter variant is intended for the following functional pattern. Since very narrow peaks are detected in Raman spectroscopy, filtering of the signals with only one tunable filter is not possible. The combination of two or more filters is shown in Fig. 1 and the principle simultaneous detection is shown in Fig. 2.
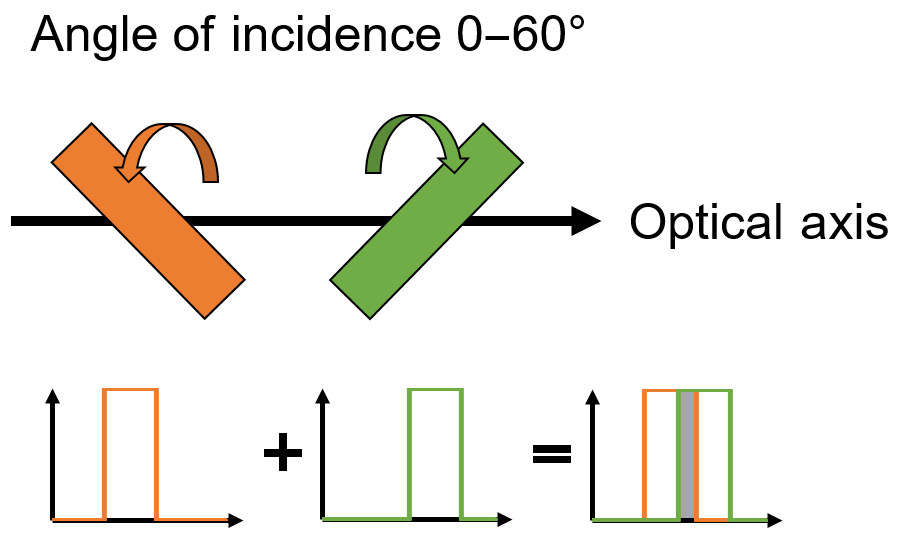
Through skilful combination of two filters with differing angles of incidence to the optical beam path, it is possible to isolate a spectral width of about 80 wave numbers. The transmission of standard filters deteriorates significantly even at low angles. Furthermore, standard filters are not readily available at any desired spectral region with sufficient edge steepness as bulk material.
For all photometer measurements the integration time was set to 1 s with an acquisition of 10 spectra per concentration. For better comparability spectrometer measurements were also performed with an integration time of 1 s.
4.1 Tracking of model analytes
After successful evaluation of the filter unit, linear correlation of concentration and count rate was demonstrated for the complete system by means of serial dilution. Figure 3 depicts exemplary photometric measurements (Fig. 3a) of H2O2 and the corresponding spectroscopic confirmatory measurements (Fig. 3b) with a MultiSpec® Raman system (tec5 AG, Oberursel).
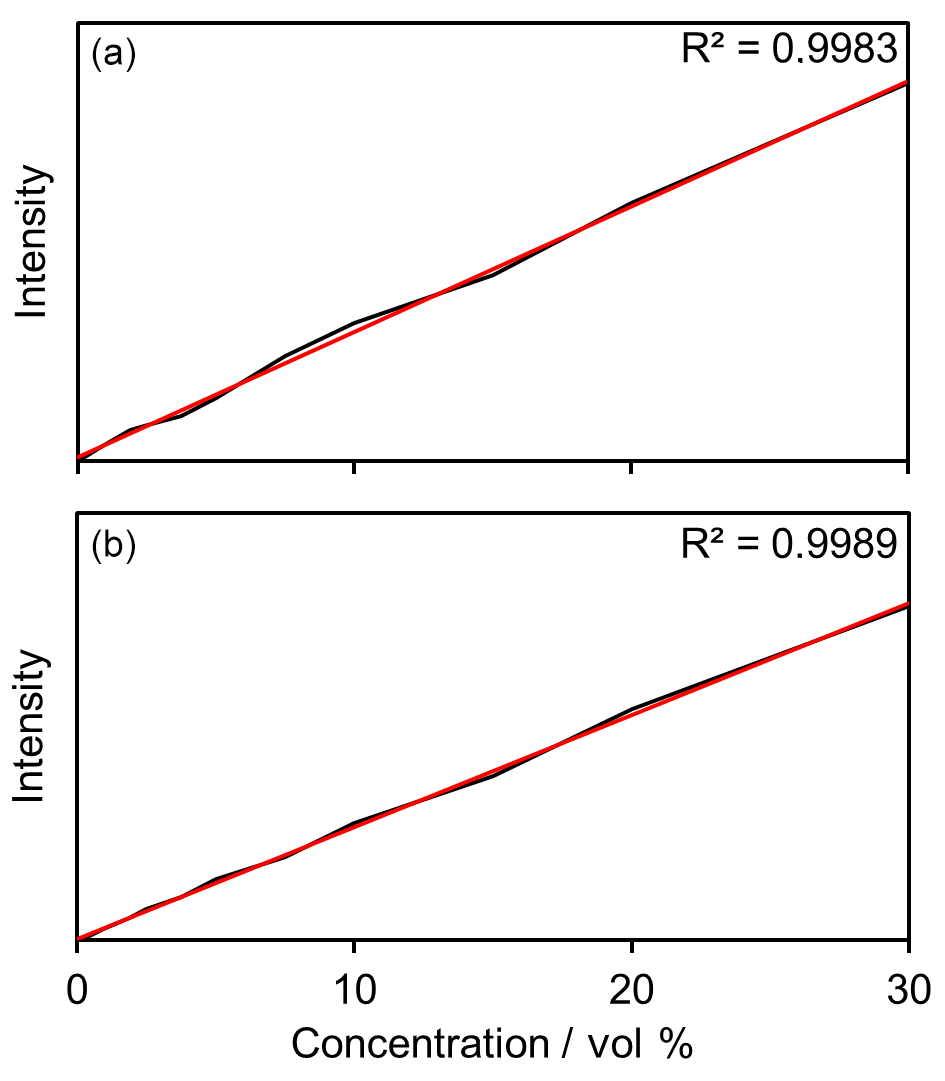
Hydrogen peroxide can be traced over a wide concentration range. The proof of concept of the system was thus produced.
Reaction tracking of an amine wash was evaluated in subsequent tests. In the chemical industry, the separation of CO2 from product streams or exhaust air is of utmost importance. A simple and well-researched method is the scrubbing of gaseous streams by amines. Reversible binding of CO2 to amine can be monitored by Raman spectroscopy (Vogt et al., 2011).
The filter unit in this application is adapted to a specific amine peak at 675 cm−1 for detection in the photometer. The reference channel was set to the adjacent spectral range. The offset of both channels is internally calculated by the photometer. Additionally, a dark current correction is performed. Figure 4a shows the reaction process. Thus, the increase in the amine-CO2 bond can be observed with the measurement method.
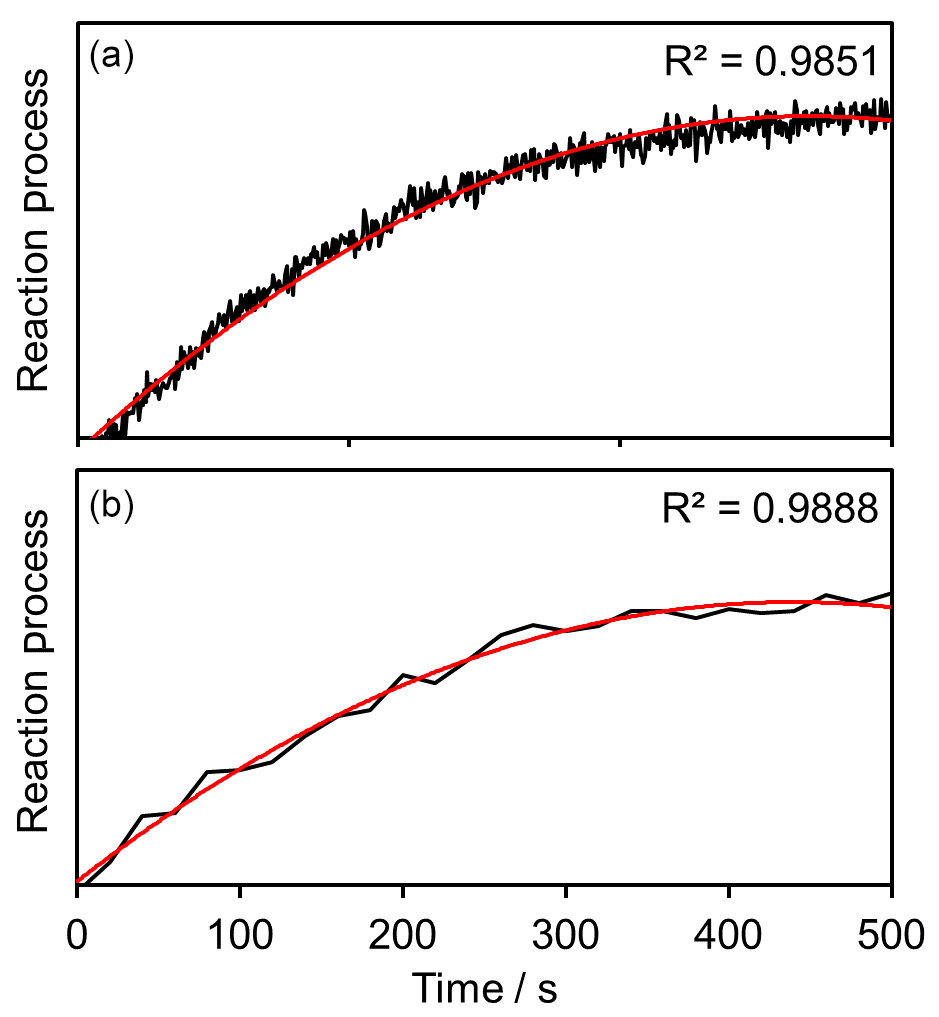
Figure 4Binding of CO2 to amine measurements with photometer prototype (a) and with a spectrometer (b).
The initially high conversion rate of the reaction slows down over time and finally goes into saturation. Highly dispersed CO2 bubbles in the liquid phase cause a significant increase in signal noise in comparison to bubble-free samples. The measuring points align very well with the corresponding trend line. Confirmatory measurements were carried out with a MultiSpec® Raman spectrometer (tec5 AG, Oberursel, Germany). The results are displayed in Fig. 4b.
It also should be noted that reactions can be monitored with a Raman photometer without complete spectral information.
4.2 Concept prototype
Many photometer and spectrometer systems require an intermediate computer to transmit information to a PCS. Thus, these systems are only indirectly integrated. While using computers ensures a certain flexibility, there is the intrinsic disadvantage that components and operating systems from the consumer sector are used instead of real-time operating systems. Increased safety and reliability requirements must be met for use in industrial environments. Measurement data acquisition, processing and communication can be more reliably implemented while adhering to an industrial standard, due to the increase in microcontroller computing power and the availability of data processing components. A modified version of the tecSaaS® embedded platform (tec5 AG, Oberursel, Germany) was integrated into the functional model. So far, the platform enables autonomous operation of optical UV–VIS–NIR spectral measuring systems for process or product quality control. This makes it possible to combine detection, processing and comparison of the measured values with target values as well as transmission to a PCS in one device, using industrial electronics and firmware (Fig. 5). Accordingly, the PCS perceives the multi-channel photometer as a single sensor. Here, the concept of “spectrometer as a sensor” could be transferred to a photometer application in an evaluation model (“photometer as a sensor”). While standard operation is completely autonomous, parameterization and monitoring can be carried out via an Ethernet interface. Combined with the inherent advantages of a “conventional” photometer, namely the increased robustness due to reduced complexity, the concept becomes a candidate for cost-effective and intelligent process sensor technology.

Figure 5Schematic concept of the Raman photometer consisting of the embedded platform, the laser module and the detection unit.
Despite its autonomous mode of operation, the functional model consists of few components. The dashed lines in Fig. 5 represent the exchange of electrical and continuous lines of optical signals. The embedded platform, laser module and detection unit are located in the photometer housing. The measuring probe is connected via glass fibers.
Every additional component potentially has a negative influence on the optical yield and robustness. For this reason, the optical design is reduced to a minimum of necessary components. In addition to minimizing reflections and other optical losses, this reduces manufacturing costs. The installed detectors are multi-pixel photon counter (MPPC) modules (Hamamatsu Photonics, Hamamatsu, Japan). MPPCs are significantly cheaper than SPAD detectors, while maintaining single-photon counting capabilities, and thus are sufficiently sensitive to detect Raman signals. In principle, the selection of a Raman probe is arbitrary and therefore will not be discussed in detail. The laser module is a stabilized 35 mW laser.
In the chemical industry there are many measuring points in potentially explosive atmospheres. In order to operate a device, compliance with special regulations is required. One possibility for electrical equipment to comply with these regulations is a pressure-capsulated enclosure (Ex-d). This means that ignition sparks generated within the unit must not leave the housing. In the event of an explosion within the enclosure, the energy released must also not leave the enclosure abruptly. In order to guarantee this and ensure safe and continuous operation, all electronic components are housed in a pressure-capsulated Ex-d enclosure. Besides the electrical hazards, there is also a danger of focused optical light output as a possible source of ignition. Raman spectrometers are limited by high laser power requirements in process control. In potentially explosive atmospheres, the power output of the laser must be reduced. Considering the most frequently used chemicals and temperature classes, the upper limit may be as low as 35 mW (IEC60079-28:2015, 2015).
However, the intensity of the Raman effect is proportional to the excitation power and inversely proportional to the measurement time. Due to the improved detector sensitivity of single-photon detection, the increased time expenditure can be compensated for by SPAD and MPPC detectors.
4.3 Stability measurement
As an additional benchmark the signal stability must be evaluated. Initially H2O2 was monitored in a laboratory environment. Measuring took place over 5 days with an integration time of 60 s for individual measurements. A simple backscatter probe based on VIS–NIR spectroscopy techniques was immersed in the fluid. Figure 6 exhibits the measurement results. The signal varies by less than ±2.5 % (see marker lines in Fig. 6).
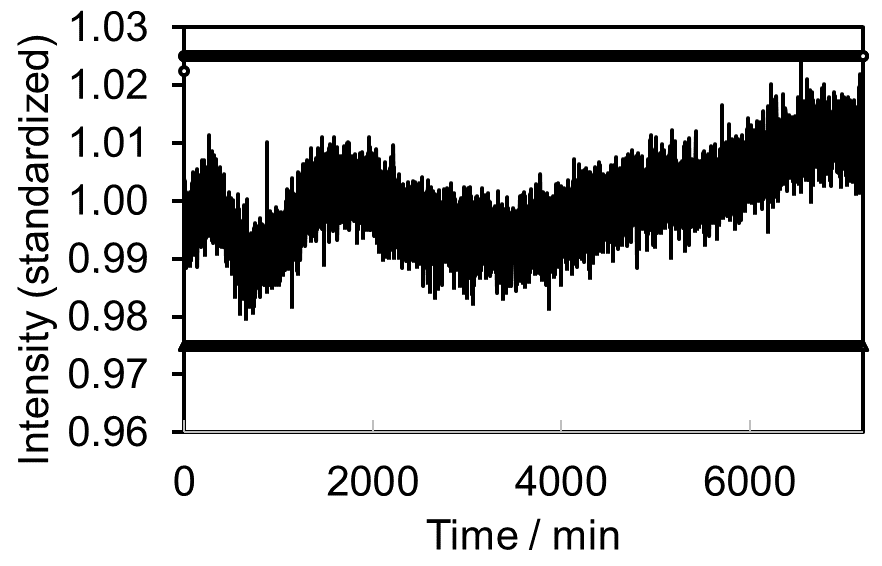
Figure 6Signal stability of concept prototype. Monitoring of 30 % H2O2 in a laboratory environment. Measurements were performed over 5 days with an integration time of 1 min. The signal varies by less than ±2.5 %.
Since the Raman photometer is a prototype for a process instrument, stability measurements under laboratory conditions are an indicator for usability under demanding conditions. For this reason, a similar test was carried out in a continuous pilot plant consisting of a storage tank, a heat exchanger and a centrifugal pump. The plant was operated in a closed circuit with a 33 % ethanol–water mixture for monitoring. Untreated tap water was used instead of de-ionized water, in order to maintain conditions as close to the process as possible. The other parameters, such as integration time and measuring time, were not changed. Figure 7 shows the results of plant monitoring. Signal stability increases in comparison to laboratory conditions, with fluctuations of less than ±2 %. Reference measurements using spectrometers demonstrate comparable signal stability.
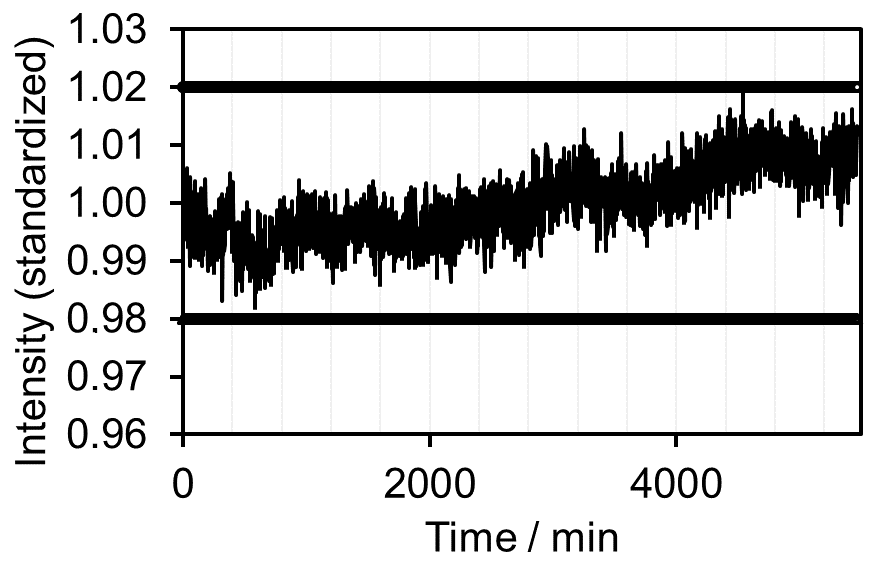
Figure 7Signal stability of concept prototype. Monitoring of 33 % EtOH in a closed-circuit pilot plant. Measurements were performed over 4 days with an integration time of 1 min. The signal varies by less than ±2 %.
Design and construction of a Raman photometer conforming to Ex-d standards has been successfully implemented.
The selection of the measurements resulted from an intersection of frequently occurring measuring tasks in the chemical industry and the suitability for the application of a Raman photometer. The use of photometers is only possible if the spectra in question are not too complex and the individual target molecules can be clearly distinguished through spectral analysis. Under these conditions the use of Raman spectrometers is not necessary. In addition, photometers show the possibility of providing good signal-to-noise ratios with significantly reduced laser powers. This has a positive effect on their applicability in areas with potentially explosive atmospheres and also in the medical technology sector with regard to the respective regulatory systems.
The presented Raman photometer holds advantages over spectrometers and accordingly virtual photometers with regard to sensitivity and thus required excitation power, real-time monitoring and applicability in potentially explosive atmospheres. However, certain drawbacks are also seen: with a spectral resolution of 80 cm−1, specific analyte peaks must stand isolated for this width in the Raman spectrum to be viable for photometric detection. Furthermore, in the current set-up with one reference channel, slopes in the base line caused, for example, by fluorescence cannot be accounted for, which might negatively impact on accessibility to the detection limit. A spectrometer can be used in a much more general way and is better suited for detecting clustered Raman peaks. The spectrometer entrance slit and charge-coupled device (CCD) detection determine the photon flux and thus the detection sensitivity of the system. The slit forms a bottleneck – a larger slit increases the photon flux, but also reduces the spectral resolution (Braun et al., 2016). With a photometer, detection fibres up to the millimetre range can be completely imaged on large area detectors without reducing resolution.
After completion of the functional model and first successful trials with production mixtures, a transfer to chemical plants on a pilot plant scale will be carried out. Here, new challenges have to be overcome and further adaptions of the functional model to the various process environments have to take place. In addition to the monitoring of chemical reactions in batch operation, monitoring and control of continuous production plants is planned. If this is successful, a further transition from pilot plant to production scale is planned.
The raw and meta data cannot be provided at the time of publication due to the confidentiality clause of an ongoing research project. Specific requests can be addressed to the corresponding author Matthias Rädle.
MN and SK contributed equally to the experimental work.
The authors declare that they have no conflict of interest.
This article is part of the special issue “Dresden Sensor Symposium 2017”. It is a result of the Dresden Sensor Symposium 2017, Dresden, Germany, 4–6 December 2017.
We would like to thank Thomas Fritsch of Krohne Innovation GmbH for the many
informative discussions. The projects were funded by the Federal Ministry of
Economics and Energy (funding code: ZF4013705NT5) and the Federal Ministry
for Research and Technology, Germany (funding code:
13FH8I03IA).
Edited by: Günter
Gauglitz
Reviewed by: two anonymous referees
Arcis, H., Ferguson, J. P., Applegarth, L. M. S. G. A., Zimmerman, G. H., and Tremaine, P. R.: Ionization of boric acid in water from 298 K to 623 K by AC conductivity and Raman spectroscopy, J. Chem. Thermodynamics, 106, 187–198, https://doi.org/10.1016/j.jct.2016.11.007, 2017.
Berenblut, B. J. and Dawson, P.: The modificaction of a Cary model 81 Raman spectrophotometer for use with a laser, J. Phys. E Sci. Instrum., 5, 4, https://doi.org/10.1088/0022-3735/5/4/019, 1972.
Braun, F., Schwolow, S., Seltenreich, J., Kockmann, N., Röder, T., Gretz, N., and Rädle, M.: Highly Sensitive Raman Spectroscopy with Low Laser Power for Fast In-Line Reaction and Multiphase Flow Monitoring, Anal. Chem., 88, 9368–9374, https://doi.org/10.1021/acs.analchem.6b01509, 2016.
Brown, G., Burka, M., Cranton, B., Erikson, D., Grassi, J., Hammond, M. P., Shaffer, M. B., and Viellneuve, P.: Chemical Analyzer for Process Control, Patent US8077309B2, 2007.
Bumbrah, G. S. and Sharma, R. M.: Raman-Spectroscopy – Basic principle, instrumentation and selected applications for the characterization of drugs of abuse, Egypt. J. For. Sci., 6, 209–2015, https://doi.org/10.1016/j.ejfs.2015.06.001, 2016.
De Beer, T., Burggraeve, A., Fonteyne, M., Saerens, L., Remon, J. P., and Vervaet, C.: Near infrared and Raman spectroscopy for the in-process monitoring of pharmaceutical production processes, Int. J. Pharm., 417, 32–47, https://doi.org/10.1016/j.ijpharm.2010.12.012, 2011.
Directive 2014/34/EU (ATEX) of the European Parliament and of the Council of 26 February 2014 on the harmonisation of the laws of the Member States relating to equipment and protective systems intended for use in potentially explosive atmospheres (recast), 2014.
Ebrahimi, F., Viell, J., Mitsos, A., and Mhamdi, A.: In-Line Monitoring of hydrogen Peroxide in Two-Phase Reactions Using Raman Spectroscopy, AIChE J., 63, 3994–4002, https://doi.org/10.1002/aic.15754, 2017.
Edwards, H. and Dent, G.: Modern Raman spectroscopy – a practical approach, ISBN 0471496685, John Wiley and Sonst Ltd, Chichester, 2005.
Esmonde-White, K. A., Cuellar, M., Uerpmann, C., Lenain, B., and Lewis, I. R.: Raman spectroscopy as a process analytical technology for pharmaceutical manufacturing and bioprocessing, Anal. Bioanal. Chem., 409, 637–649, https://doi.org/10.1007/s00216-016-9824-1, 2017.
Frauendorfer, E. and Hergeth, W.-D.: Industrial application of Raman spectroscopy for control and optimization of cinyl acetate resin polymerization, Anal. Bioanal. Chem., 409, 631–636, https://doi.org/10.1007/s00216-016-0001-3, 2016.
IEC60079-0:2017 Explosive atmospheres – Part 0: Equipment – General requirements, 2017.
IEC60079-28:2015: Explosive atmospheres – Part 28: Protection of equipment and transmission systems using optical radiation, 2015.
Kaye, W.: Streulichtphotometer, Patent DE000002103318B, 1974.
Pudlas, M.: Nicht invasive Diagnostik in der Regenerativen Medizin mittels Raman-Spektroskopie, Fraunhofer Verlag, Stuttgart, 2012.
Rantanen, J.: Process analytical applications of Raman spectroscopy, J. Pharm. Pharmacol., 59, 171–177, https://doi.org/10.1211/jpp.59.2.0004, 2007.
Rea, D. G.: Report on Cary Model 81 Raman Spectrometer, Abstracts of OSU International Symposium on Molecular Spectroscopy, available at: https://kb.osu.edu/handle/1811/7594 (last access: 10 October 2018), 1946–1959, 1957.
Schwolow, S., Braun F., Rädle M., Kockmann N., and Röder T.: Fast and Efficient Acquisition of Kinietic Data in Microreactors Using In-Line Raman Analysis, Org. Process Res. Dev., 9, 1286–1292, https://doi.org/10.1021/acs.oprd.5b00184, 2015.
Szymanski, H.: Raman Spectroscopy, Plenum Press, New York, https://doi.org/10.1007/978-1-4684-3024-0, 1967.
VDI/VDE – Gesellschaft Mess- und Automatisierungstechnik: Thesen und Handlungsfelder – Technologie-Roadmap “Prozesssensoren 4.0”, 2015.
Vogt, M., Pasel C., and Bathen D.: Characterisation of CO2 absorption in various solvents for PCC applications by Raman Spectroscopy, Energy Procedia, 4, 1520–1525, https://doi.org/10.1016/j.egypro.2011.02.020, 2011.
Wang, X., Ren, L., Su, Y., Ji, Y., Liu, Y., Li, C., Li, X., Zhang, Y., Wang, W., Hu, Q., Han, D., Xu, J., and Ma, B.: Raman-Activated Droplet Sorting (RADS) for Label-Free High-Throughput Screening of Microalgal Single-Cells, Anal. Chem., 89, 12569–12577, https://doi.org/10.1021/acs.analchem.7b03884, 2017.