the Creative Commons Attribution 4.0 License.
the Creative Commons Attribution 4.0 License.
 | 29 Oct 2018
Continuous in-line monitoring of electrolyte concentrations in extracorporeal circuits for individualization of dialysis treatment
Michael Faulstich
Thorsten Perl
Stefan Zimmermann
One objective of dialysis treatment is to normalize the blood plasma electrolytes and remove waste products such as urea and creatinine from blood. However, due to a shift in plasma osmolarity, a rapid or excessive change of the electrolytes can lead to complications like cardiovascular instability, overhydrating of cells, disequilibrium syndrome and cardiac arrhythmias. Especially for critical ill patients in intensive care unit with sepsis or multi-organ failure, any additional stress has to be avoided. Since the exchange velocity of the electrolytes mainly depends on the concentration gradients across the dialysis membrane between blood and dialysate, it can be controlled by an individualized composition of dialysate concentrations. In order to obtain a precise concentration gradient with the individualized dialysate, it is necessary to continuously monitor the plasma concentrations. However, with in-line sensors, the required hemocompatibility is often difficult to achieve. In this work, we present a concept for continuous in-line monitoring of electrolyte concentrations using ion-selective electrodes separated from the blood flow by a dialysis membrane, and therefore meeting the fluidic requirements for hemocompatibility. First investigations of hemocompatibility with reconfigured human blood show no increased hemolysis caused by the measuring system. With this concept, it is possible to continuously measure the plasma concentrations with a relative error of less than 0.5 %.
- Article
(2454 KB) - Full-text XML
- BibTeX
- EndNote


Dialysis is a life-saving therapy, which is used for purifying the blood in the case of kidney failure. In dialysis, blood is pumped via an extracorporeal circuit into a dialyzer consisting of a semipermeable membrane separating blood and the dialysate. Due to concentration gradients across this membrane, waste products such as urea and creatinine can be removed by diffusion and the electrolyte balance can be regulated (Sivalingam and Farrington, 2007). Critically ill patients in the intensive care unit (ICU) with, e.g., sepsis or multi-organ failure, often develop acute kidney injury (AKI), characterized by the rapid loss of kidney function (Zarjou and Agarwal, 2011; Baue et al., 2000; Bellomo et al., 2012; Bagshaw et al., 2008). The mortality rate of such patients exceeds 50 % (Ricci et al., 2006). The treatment of AKI related to critical illness is usually continuous renal replacement therapy (CRRT) with a duration of up to 72 h (Patel et al., 2010; Patschan and Müller, 2015; Ricci et al., 2006; Tumlin et al., 2008). Due to the longer treatment compared to intermitted dialyses (3–4 h every 2–3 days), CRRT enables a slower removal of waste products and regulation of electrolyte balance, resulting in a benefit for unstable patients, as a rapid change of osmotic substances can lead to complications (Patel et al., 2010).
For instance, an excessive or rapid loss of sodium in the blood, and thus an abrupt shift in plasma osmolarity, can result in cardiovascular instability, overhydrating of cells and disequilibrium syndrome with muscle cramps, fatigue symptoms and headaches. Conversely, an inefficient sodium removal and thus sodium accumulation can cause hypertension, increased thirst and pulmonary edema (Stiller et al., 2001; Palmer, 2001; Locatelli et al., 2015; Paula et al., 2004). Another important aspect during the dialysis session is the potassium concentration. Too low a plasma potassium concentration (hypokalemia) and too high a plasma potassium concentration (hyperkalemia) can both lead to cardiac arrhythmias (Kovesdy et al., 2007). However, not only the absolute concentration can be critical but also the rapid removal of plasma potassium may trigger arrhythmias (Buemi et al., 2005). A rapid decline in plasma concentration due to a high gradient between dialysate and blood during the first hours of the treatment can be caused by a large mismatch of the potassium concentration in the dialysate. The rapid drop of potassium in plasma can therefore be avoided by using an exponentially decreasing dialysate concentration with a fixed concentration gradient between blood and dialysate of 1.5 mmol L−1 (Redaelli et al., 1996). This leads to a slower potassium removal and prevents arrhythmia. The concentration of ionized plasma calcium (free calcium) also affects the cardiovascular system. Increasing the ionized calcium in the dialysate and thus increasing the plasma concentration leads to an improvement of the left ventricular contractility, which is particularly interesting for unstable patients (Henrich et al., 1984; Lang et al., 1988).
Furthermore, an important marker for dialysis is urea because it represents the waste products (Keshaviah et al., 1995). For instance, a parameter for evaluating the efficiency of dialysis is the urea reduction ratio (URR) according to Eq. (1):
where Upre is the pre-dialysis urea concentration in blood and Upost is the blood urea concentration measured 5 min after the end of dialysis. It can be shown that URRs less than 60 % are associated with a higher mortality in patients during dialysis (Owen et al., 1993). There are several approaches to determine the efficiency of dialysis treatment using urea as a marker substance, but all of these methods measure the urea concentration in the dialysate, making it difficult to continuously monitor the actual urea concentration in the patient's blood (Lindsay and Sternby, 2001).
In order to ensure a precise control of the dialysis treatment by individualization of the dialysate composition, thus controlling the concentration gradients across the dialysis membrane, it is necessary to continuously monitor the electrolyte concentration in the blood. This allows a precise control of the electrolyte exchange velocity, which mainly depends on the concentration gradients. As mentioned earlier, there are specific recommendations for the concentration gradient of potassium. Therefore, we present a concept for continuous in-line measurement of electrolytes using ion-selective electrodes (ISEs) that meets the fluidic requirements for hemocompatibility. First investigations with reconfigured human blood show no increase in hemolysis. However, it should be noted that further hemocompatibility tests with blood samples are still ongoing and experimental proof of hemocompatibility is pending. In addition, this concept can be extended by a urea sensor to determine the efficiency of dialysis treatment.
Since blood parameters such as electrolyte and urea concentrations are of great medical interest, various monitoring concepts have been developed (Sharma et al., 2016). There are already devices on the market that can determine the URR online by evaluating the conductivity of the dialysate (Diascan® Gambro Hospal GmbH; OCM; Fresenius). Furthermore, the URR can be measured optically by ultraviolet absorbance or near-infrared spectroscopy in spent dialysate (Gál et al., 1983; Cho et al., 2008). The disadvantage of these methods is that only the urea removal can be determined, while it is difficult to derive the current blood concentration. Enzymatic biosensors also allow the urea concentration to be measured. One possibility to realize such a biosensor is to immobilize the enzyme urease on an ammonium- or ammonia-selective electrode. If the urease is immobilized close to the sensitive layer of the corresponding electrode, a urea-dependent voltage between the ISE and the reference electrode is obtained by splitting the urea into ammonia and ammonium ions in aqueous solutions due to the catalytic effect of the enzyme (Eggenstein et al., 1999; Dhawan et al., 2009; Koncki, 2007; Marchenko et al., 2015; Singh et al., 2008). Immobilizing the enzyme on a dialysis membrane can further improve hemocompatibility of the sensor (Schindler and Schindler, 1983).
An optical method to determine the concentration of electrolytes such as sodium and potassium in blood is the flame photometry. Here the blood is sprayed into a nonluminous flame and the intensity and wavelength of the emitted light are measured (Domingo and Klyne, 1949). To eliminate the need for a gas flame, laser-induced breakdown spectroscopy can be used. The measurement principle is similar to flame photometry, except that the gas flame is replaced by a strong laser pulse (Knopp et al., 1996). The disadvantage of this method is the missing in-line measurement capability. An in-line capable solution to determine blood gases and potassium is the Proxima System developed by Sphere Medical Ltd..
Another common method for determining the electrolyte concentrations in the liquid phase is electrochemical potentiometric measurement using ISEs or ion-selective field-effect transistors (ISEFETs). For this, a concentration-dependent voltage is measured between the ISEs and a reference electrode (Mikhelson, 2013; Cammann, 1979). Schindler et al. developed a flow cell for ISEs (Schindler and Schindler, 1983; Schindler and Glich, 1981). However, due to hemoincompatibility, the blood cannot go back into the patient. To reduce the required blood volume, the size of the system can be reduced with the help of microfluidic devices and miniaturized ISFETs (Liao et al., 2006; Johnson et al., 2008; Gumbrecht et al., 1990).
However, for reasons of hemo- and biocompatibility, a direct in-line measurement with ISEs in blood is usually not possible (Gavalas et al., 2006). Proteins can adsorb on the ion-selective membrane of the ISEs, leading to a so-called membrane fouling, causing a time-dependent drift of the sensor signal (Sharma et al., 2016). More importantly, the adsorbed proteins can trigger blood coagulation and hemolysis and thus threaten the patient's life, making direct measurement in blood flow impossible.
For this reason, Schindler et al. used an individual dialyzer in the extracorporeal circuit separating the measuring circuit from the direct blood flow (Schindler and Schindler, 1983). Since each dialyzer produces a certain amount of hemolysis, it is not recommended to insert a second dialyzer into the extracorporeal circuit during dialysis treatment. In addition, this approach requires considerable financial and technical effort.
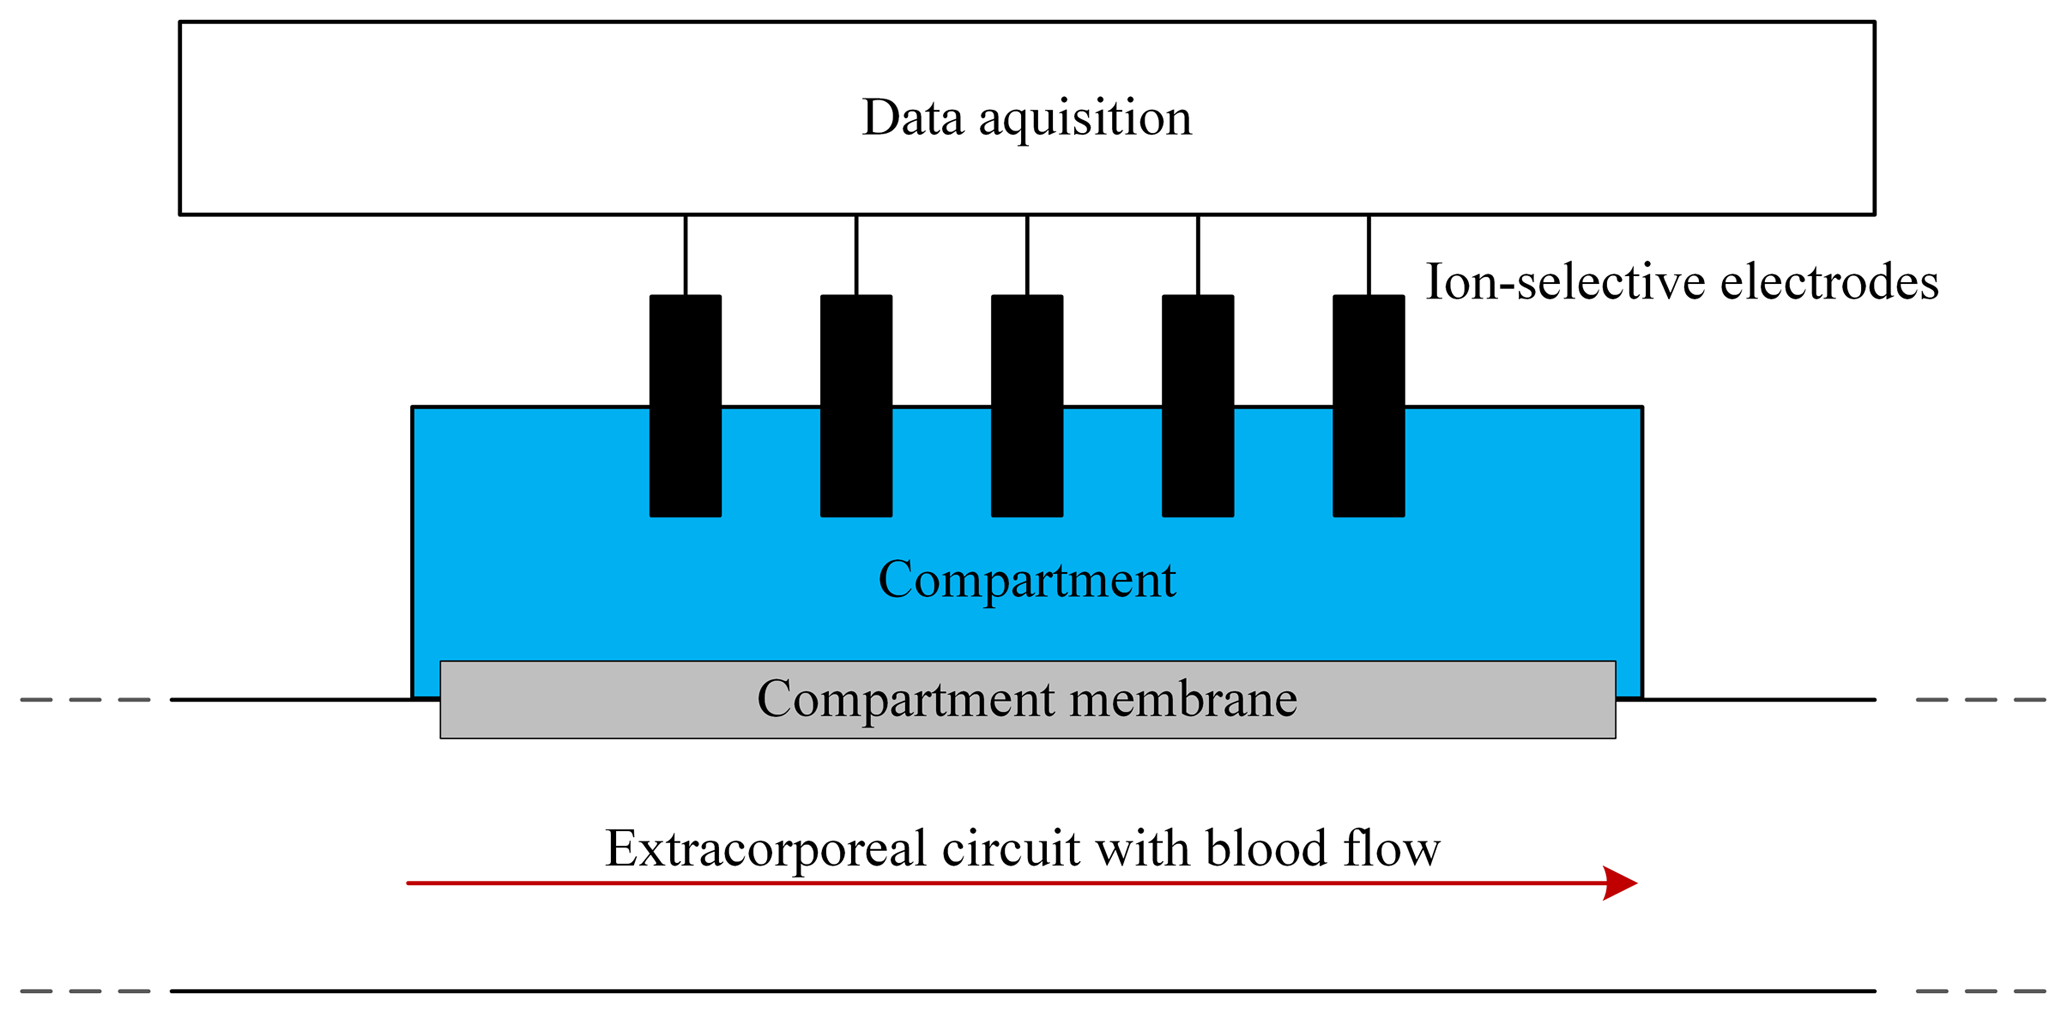
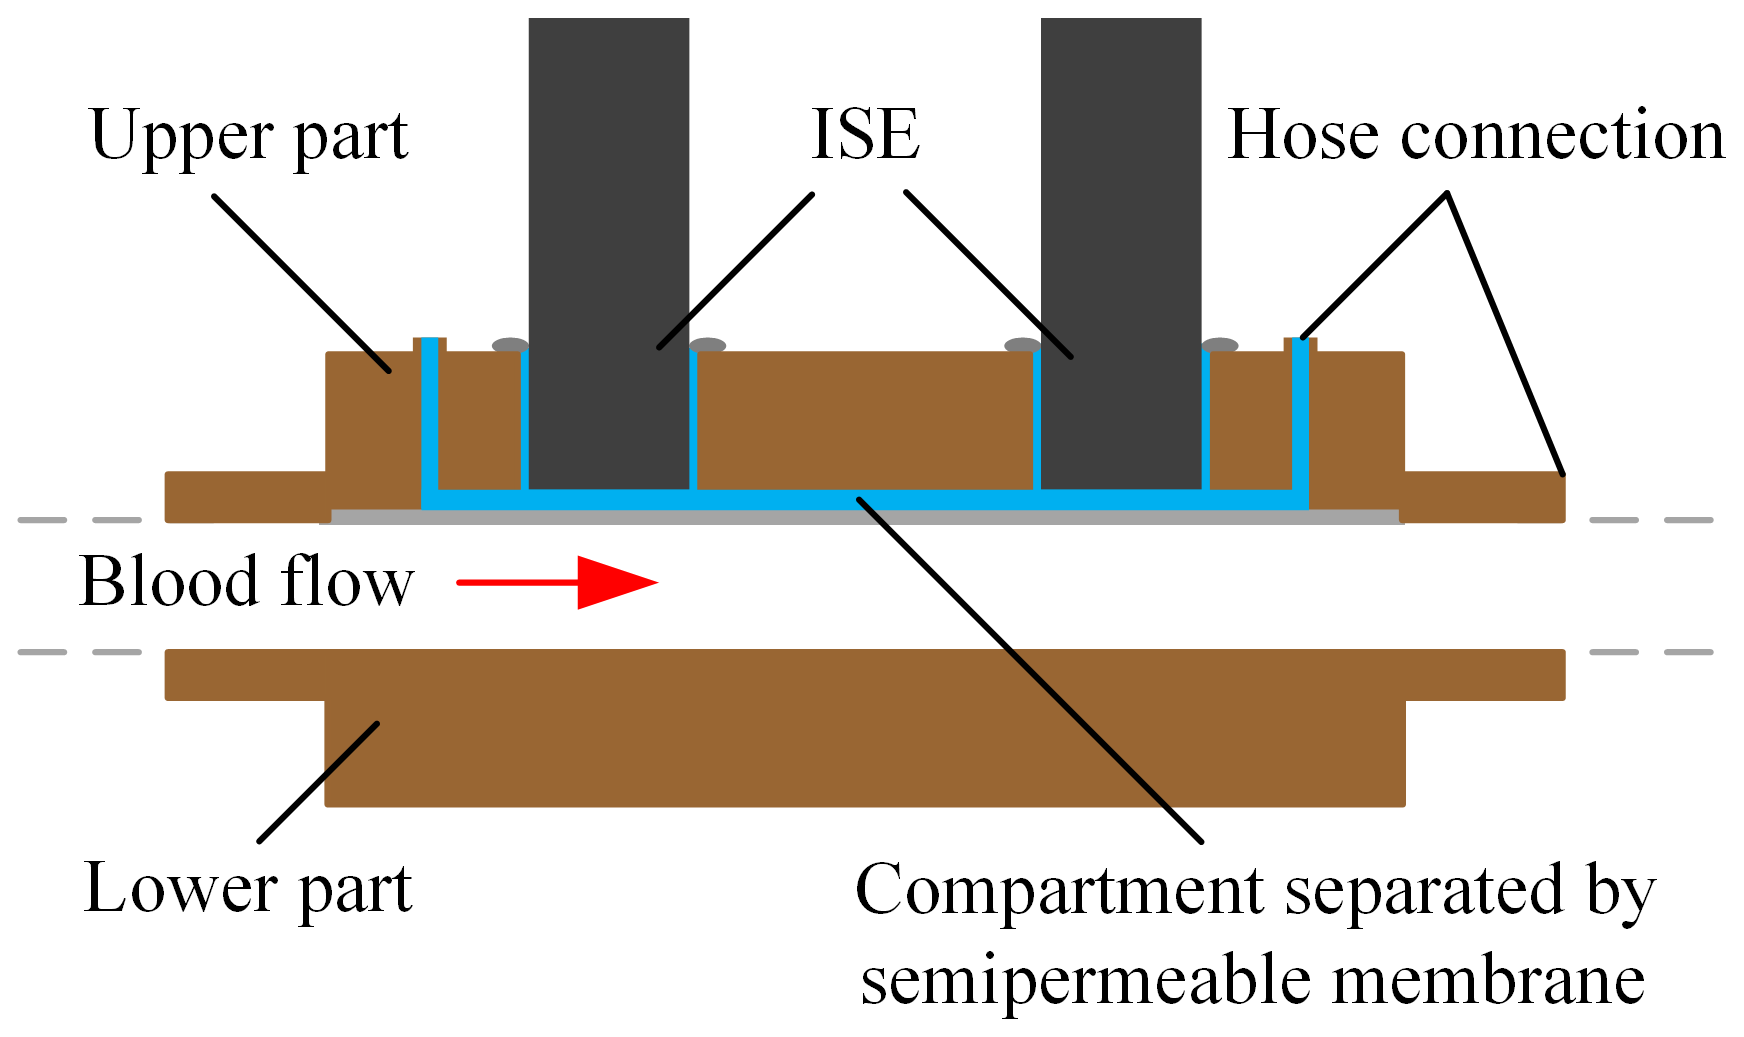
Figure 1Schematic of the in-line concept for measuring blood parameters using ISEs in a liquid-filled sensor compartment separated from the blood flow in the extracorporeal circuit by a dialysis membrane.
Therefore, we insert the ISEs into a compartment filled with physiological electrolyte solution, which is separated from the blood flow in the extracorporeal circuit by a dialysis membrane, which we name “compartment membrane” in the following, as depicted in Fig. 1. Since the blood and liquid-filled sensor compartment are separated, the ISEs are no longer in direct contact with the blood flow. Substances which are larger than the molecular weight cutoff of the membrane, e.g., proteins and cells, are retained and do not get into contact with the sensors. However, electrolytes and urea can diffuse through this membrane, leading to a concentration equalization between the blood and sensor compartment. This offers the possibility of obtaining an in-line flow system for continuous determination of the electrolyte concentrations with less instrumental effort than the above-mentioned approach by Schindler et al. and a flow concept which meets the requirements for hemocompatibility.
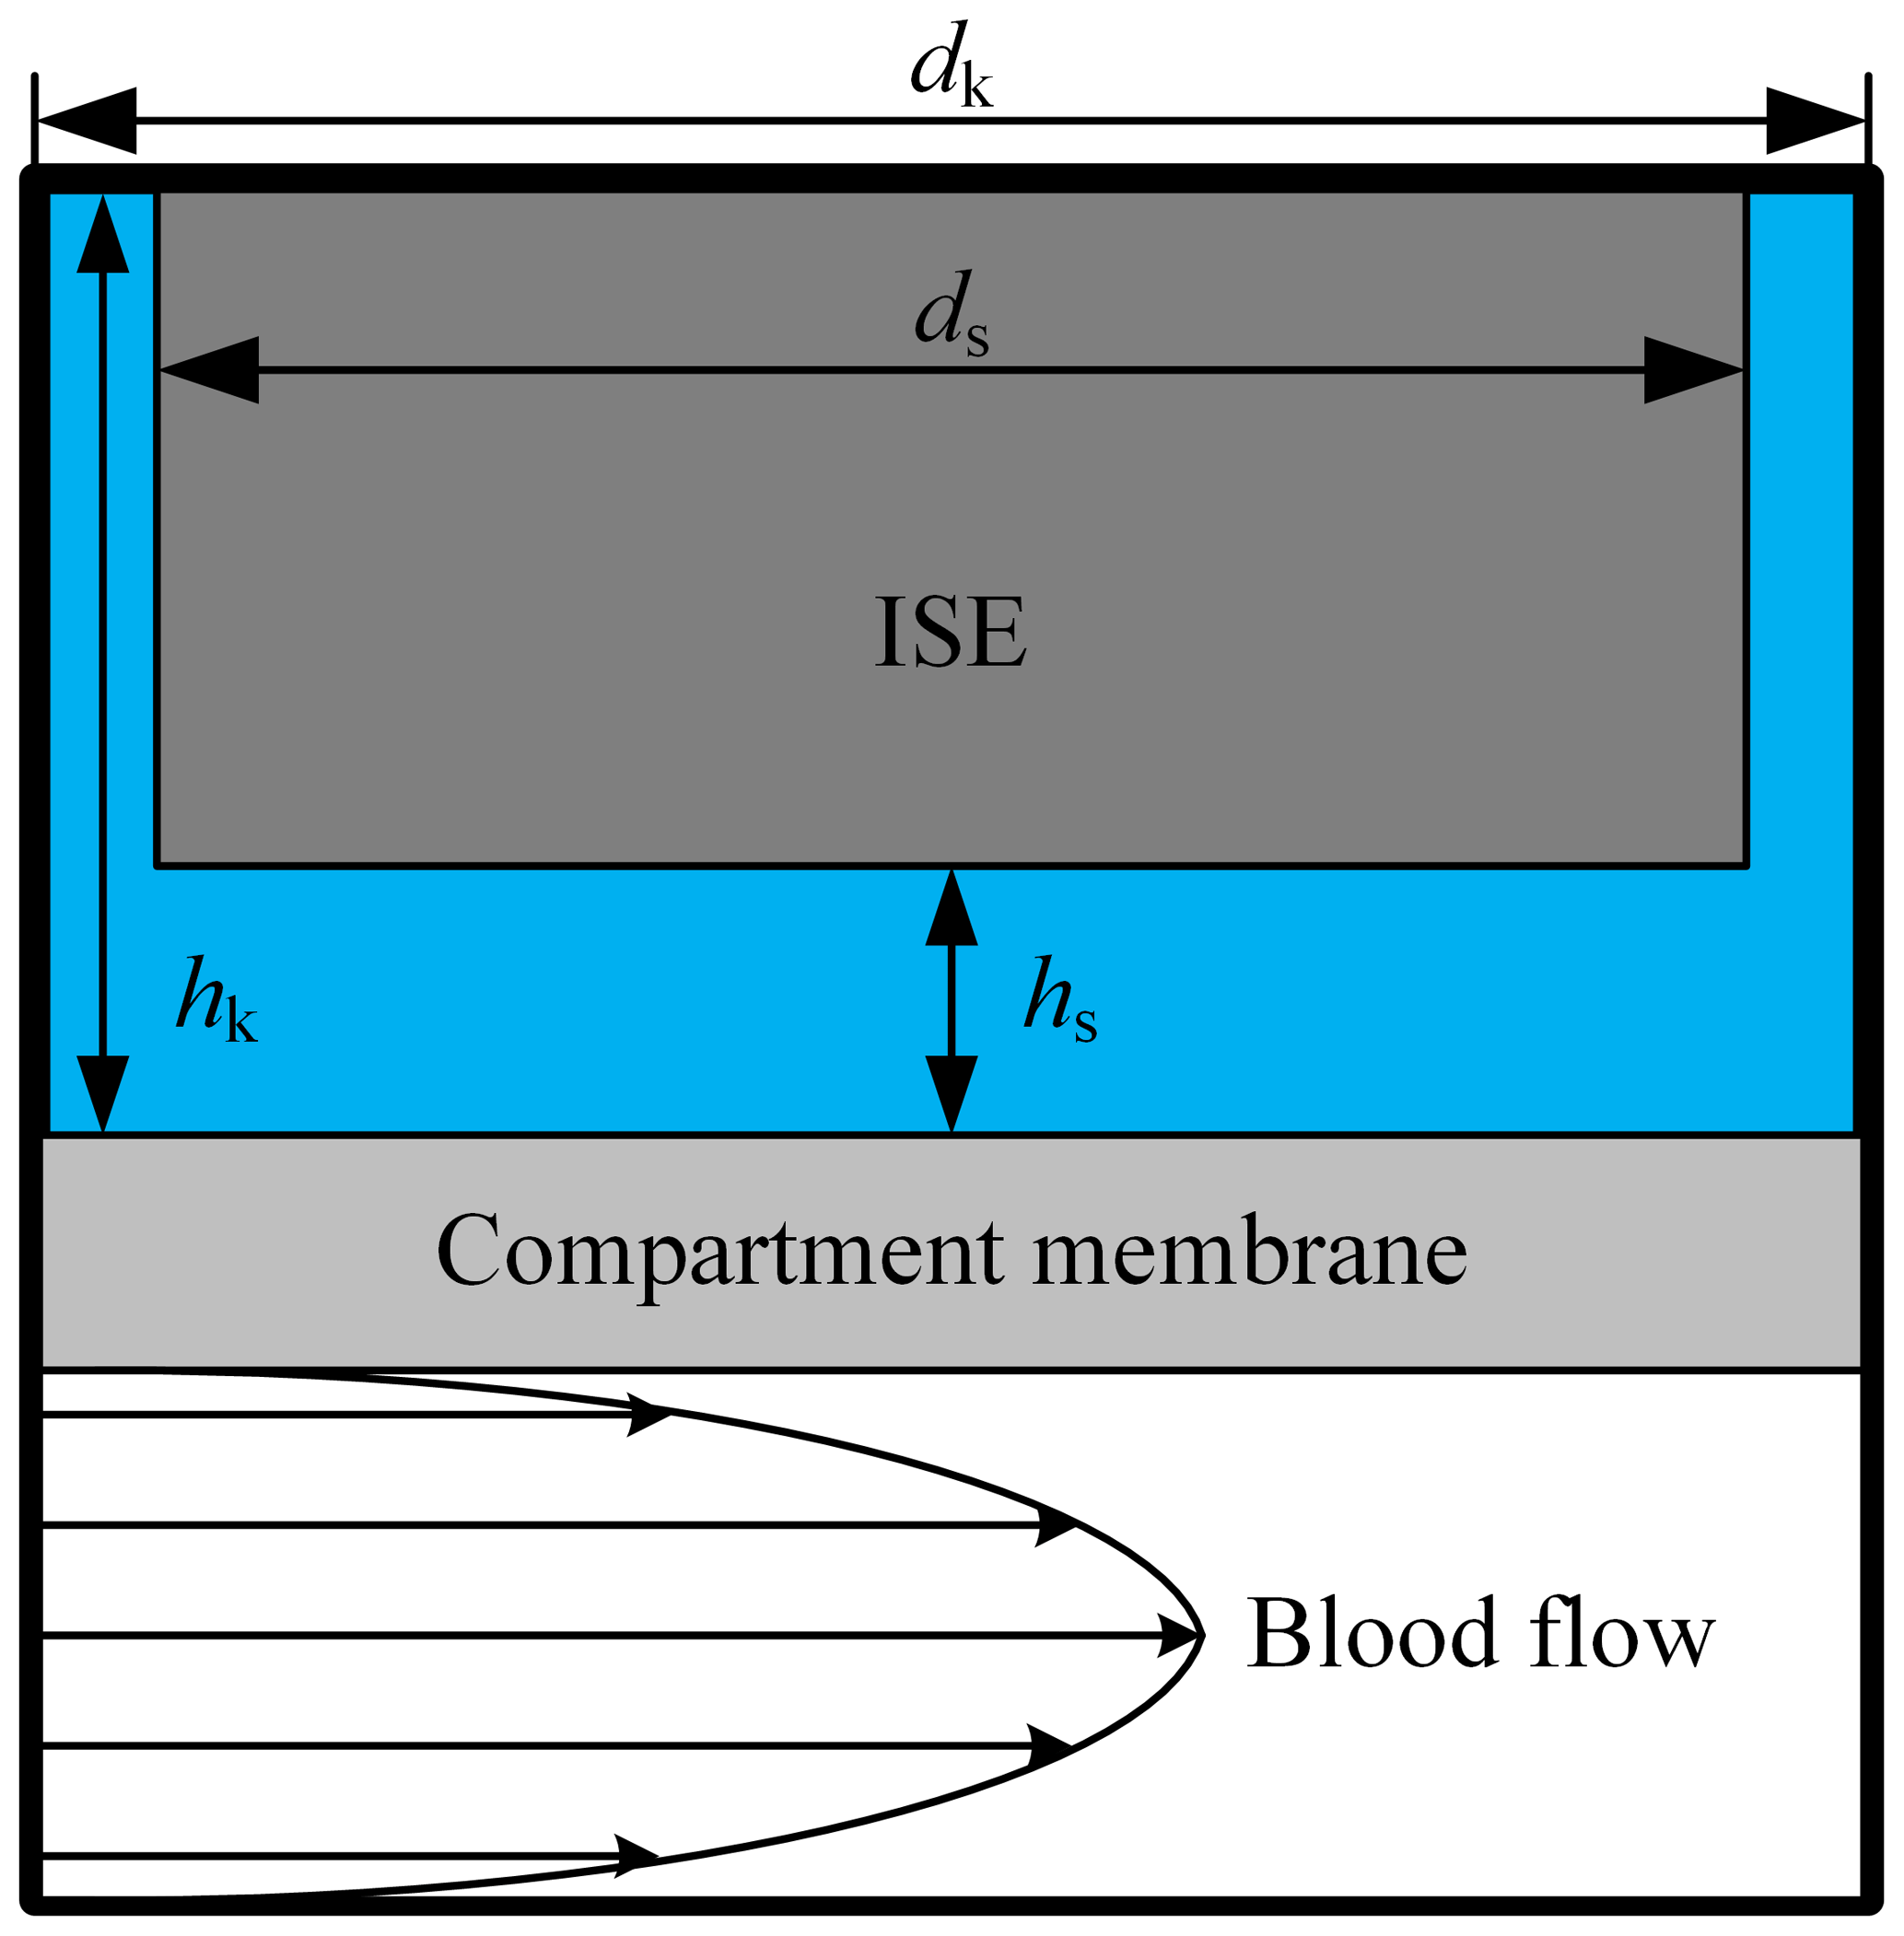
Figure 2Schematic of the used simulation model with a laminar blood flow in the extracorporeal circuit. The liquid-filled ISE compartment has a diameter dk of 12.1 mm and a height hk of 5 mm. The diameter ds of the ISE is 12 mm; hs describes the variable distance between compartment membrane and the sensitive layer of the ISE.
In order to evaluate the time-dependent behavior of this in-line-measurement concept, we used a two-dimensional simulation (COMSOL Multiphysics 5.1). Figure 2 describes the design of the simulation model. In the lower part, the blood of the extracorporeal circulation flows tangentially along the compartment membrane. Since turbulent blood flow can lead to hemolysis, a laminar flow is necessary and the flow geometry of the measuring system has to be designed accordingly. Thus, a parabolic flow profile is assumed for the simulation. The liquid-filled compartment with a diameter dk of 12.1 mm and a height of hk of 5 mm is located above the compartment membrane that is 28 µm thick. Each ISE has a diameter ds of 12 mm and is inserted into the respective compartment. The distance between the ISE and the compartment membrane is hs. At the beginning of the simulation, the concentration in the extracorporeal circuit is increased from zero to c0 in order to obtain the step response of the system. In reality, there are usually no discontinuities in concentration during dialysis treatment. A step in concentration only occurs once at the beginning of the measurement, when the measuring system is introduced into the extracorporeal circuit. In the first simulation, the electrolyte concentration in the compartment is set to zero, corresponding to an initial filling of the compartment with pure water, leading to much higher absolute measurement errors at the beginning of measurement than a filling with physiological electrolyte solution. However, this will give the step response of the system. Inside the extracorporeal circuit, the transport of electrolytes is dominated by convection. In contrast, through the compartment membrane and inside the compartment, diffusion is the only transport phenomenon. Hence, the diffusion coefficients of the different electrolytes and urea are important parameters regarding the time required to reach a concentration equilibrium between blood and the fluid in the compartment. These are specified with approximately DK = 1.9 × 10⁻⁹ m2 s−1 for potassium (Friedman and Kennedy, 1955), DNa = 1.4 × 10⁻⁹ m2 s−1 for sodium (Vitagliano and Lyons, 1956) and DCa = 0.9 × 10⁻⁹ m2 s−1 for calcium (Lyons and Riley, 1954). The diffusion coefficient for urea is approximately DUrea = 1.4 × 10⁻⁹ m2 s−1 (Gosting and Akeley, 1952). These parameters are used in all simulations for the liquid phase and the membrane. Due to similar diffusion coefficients of urea and sodium, only sodium is considered for the following investigation of the diffusion process. It should be mentioned that the response time of the urea sensor does not only depend on the velocity of the concentration equalization between blood and compartment but also on the transport of the urea into the layer of immobilized urease (here, another dialysis membrane is used to trap/immobilize the enzymes). Furthermore, the urea biosensor requires time for the enzymatic conversion of urea into ammonia and ammonium, meaning that higher response times are expected. The response time of an ISE is only a few seconds and can therefore be neglected. In addition to the diffusion coefficient, the distance hs between the compartment membrane and the ISEs has a major effect on the response time, since it mainly defines the diffusion length and volume of the compartment. Figure 3 shows the step response of the calcium concentration in the compartment close to the ISE, after a concentration step in the extracorporeal circuit from zero to c0, for the distances hs = 0.9 mm (blue line) and hs = 3.5 mm (black dashed line). Both graphs are normalized to c0. Figure 3 indicates the strong effect of the distance hs on the required time to achieve a concentration equilibrium between the blood and sensor compartment. Additional simulations have shown that the impact of the height hk can be neglected.
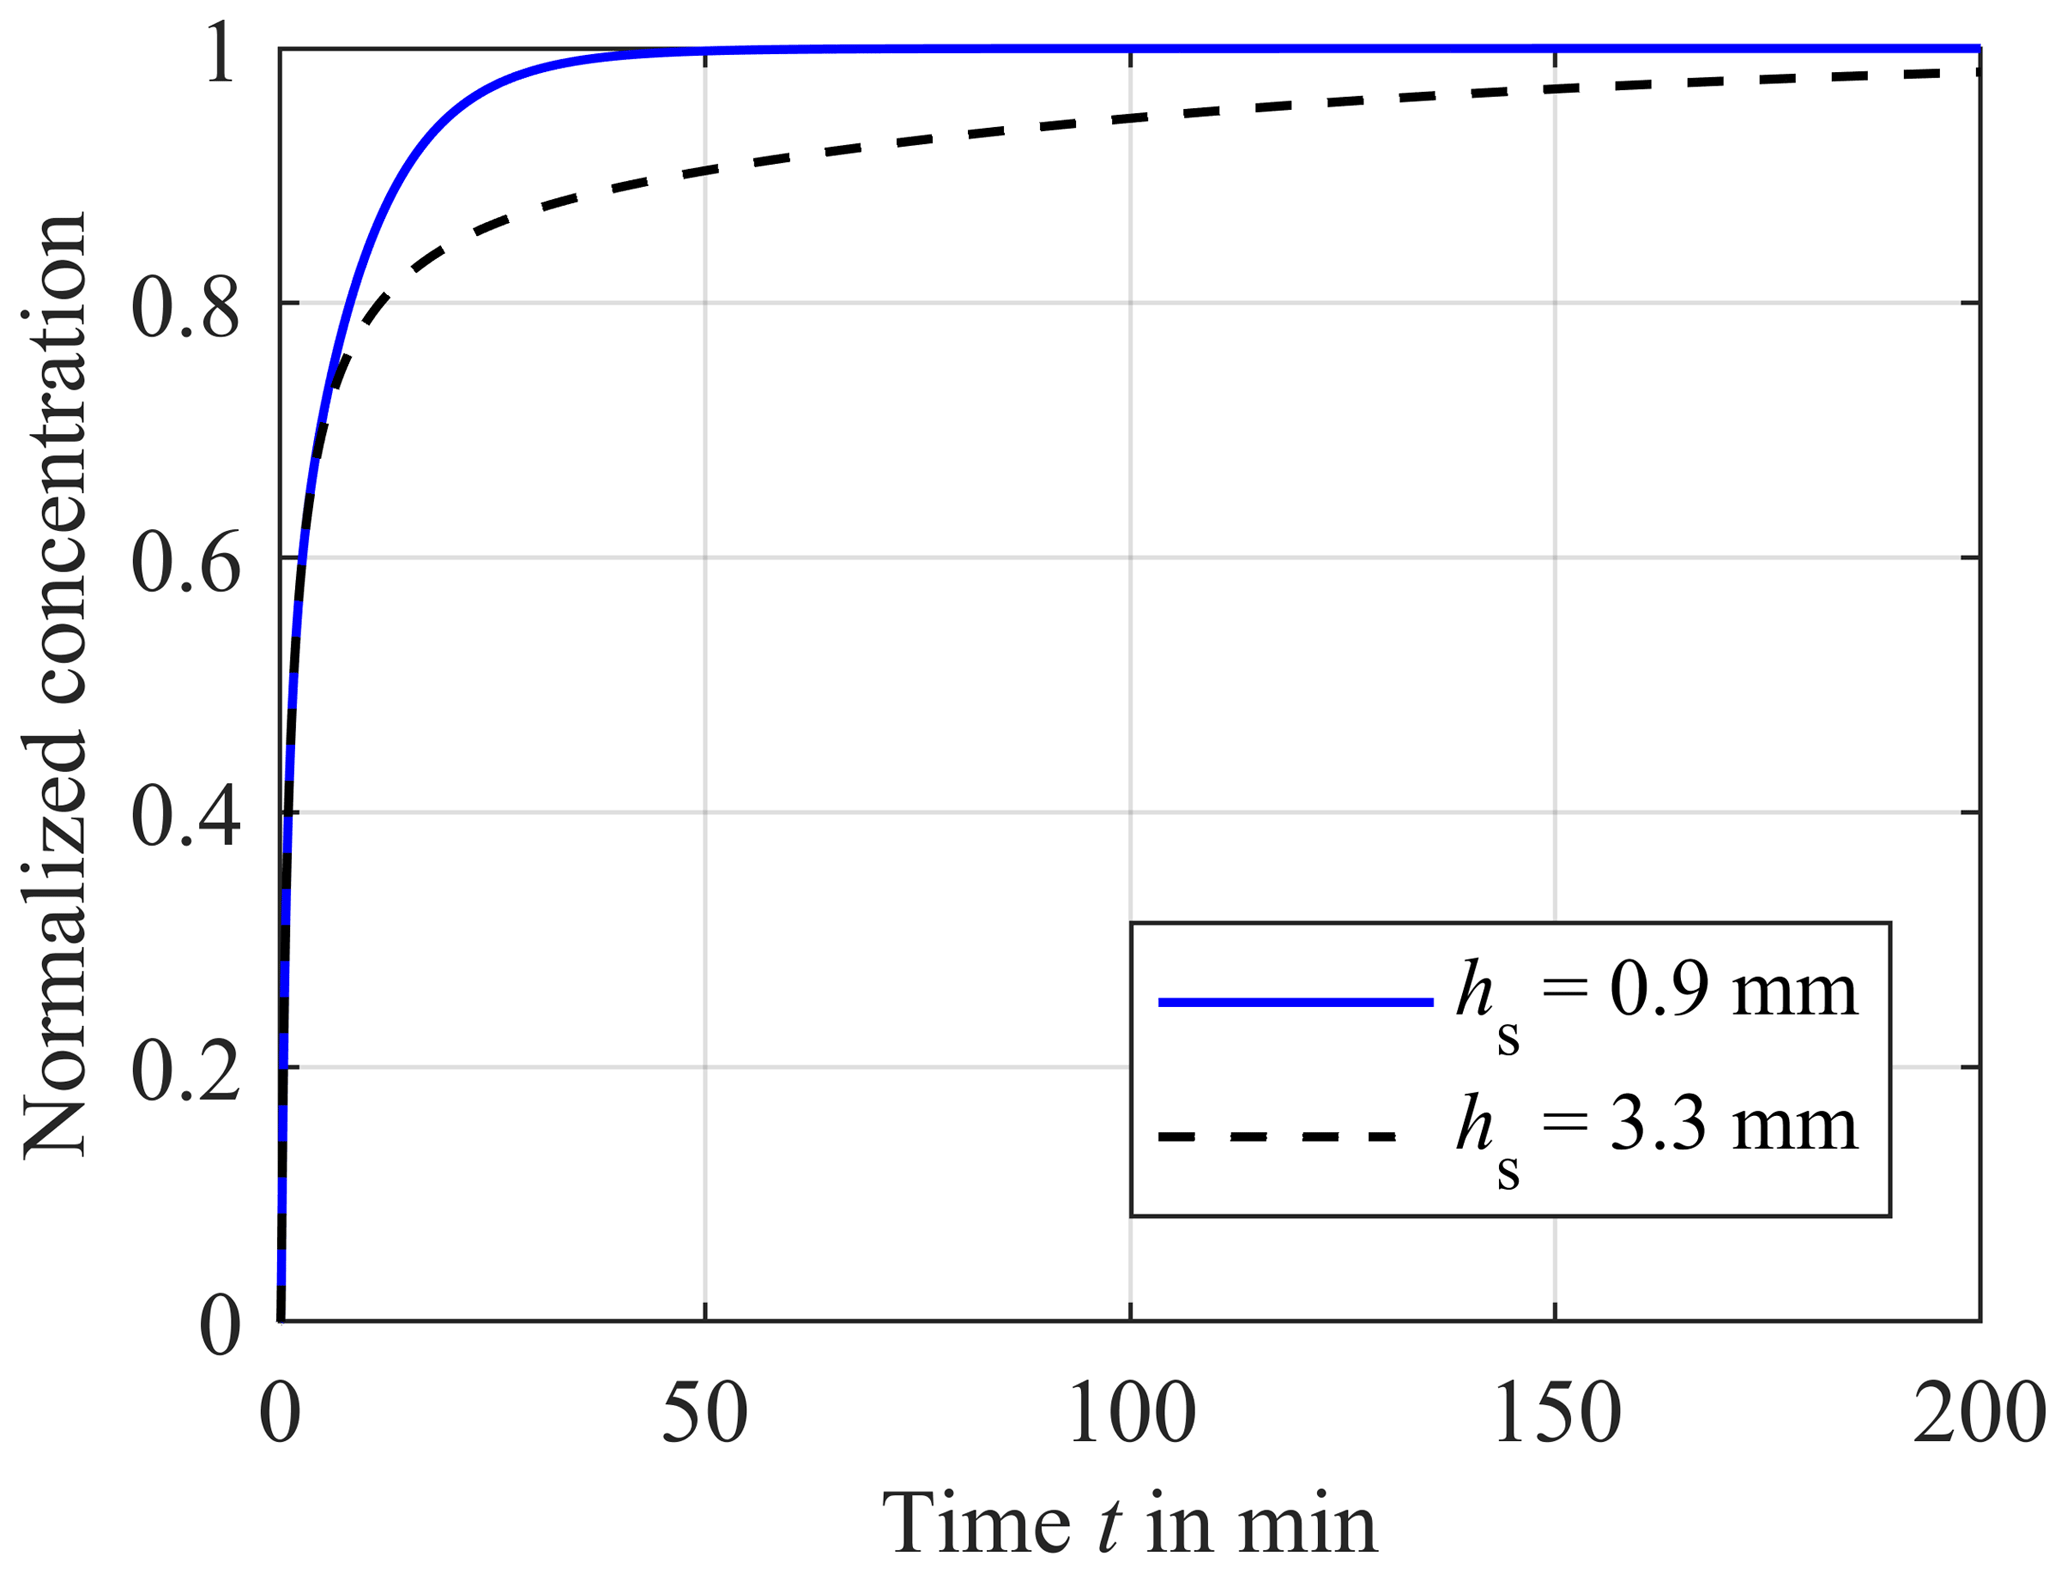
Figure 3Comparison of the concentration in the sensor compartment close to the ISE between hs = 0.9 mm (blue solid line) and hs = 3.3 mm (black dashed line) versus the time t after a step in concentration of the extracorporeal circuit from zero to c0, normalized to the highest concentration c0. The diffusion coefficient is DCa = 0.9 × 10⁻⁹ m2 s−1.
The impact of the diffusion coefficient can be seen in Fig. 4. Here, the concentrations of potassium (red dashed line), sodium (blue solid line) and calcium (black dotted line) normalized to c0 are plotted versus the time after a step in blood concentration from zero to c0. As expected, a higher value of the diffusion coefficient results in a faster equalization. Hence, the equalization rate for potassium is faster than for sodium. The slowest equalization rate results for calcium.
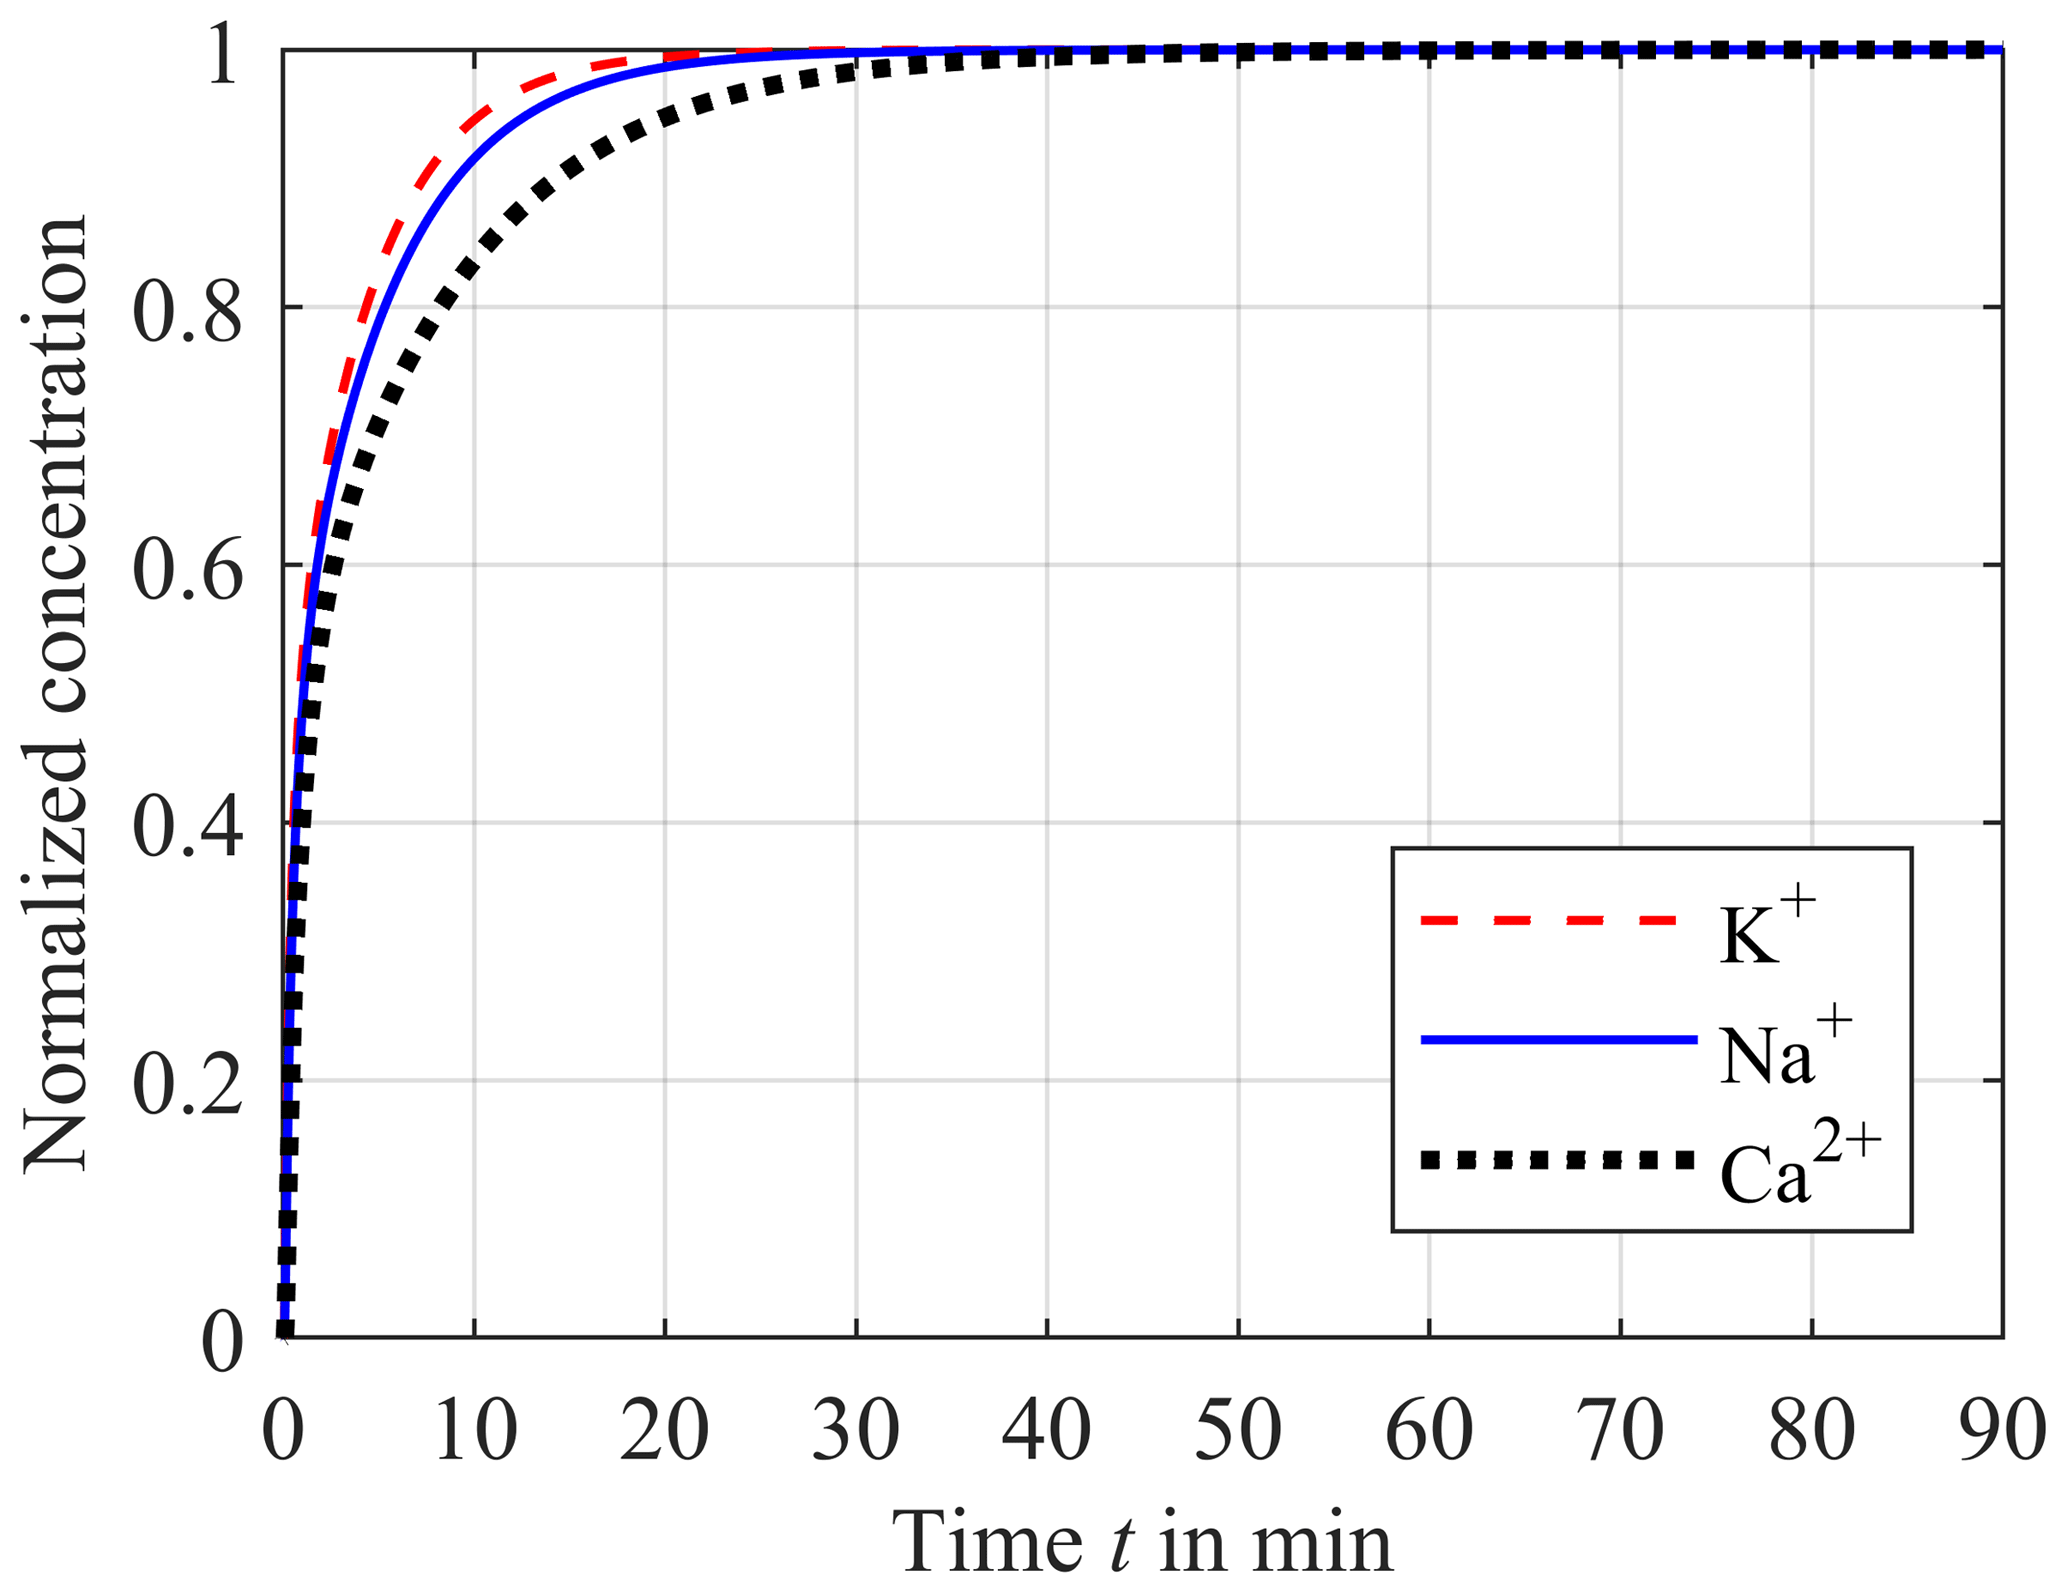
Figure 4Impact of the different diffusion coefficients DK with 1.9 × 10⁻⁹ m2 s−1 for potassium (red dashed line), DNa with 1.4 × 10⁻⁹ m2 s−1 for sodium (blue solid line) and DCa with 0.9 × 10⁻⁹ m2 s−1 for calcium (black dotted line) on the step response of the concentration in the sensor compartment.
Both the impact of D and hs are depicted in Fig. 5. Here, the time t99 required for a concentration equalization of 99 % between the blood and sensor compartment is plotted versus the distance hs and the diffusion coefficients DK (red dashed line), DNa (blue solid line) and DCa (black dotted line) as parameters. Once again, Fig. 5 illustrates the disproportionality between equalization time t99 and hs. Therefore, it is important to reduce hs as much as possible in order to improve the response time of the system. However, an unlimited reduction of hs is not possible as a direct contact between the sensitive layer of the ISEs and the compartment membrane has to be avoided. In addition, the ISEs require a minimum volume of liquid sample. In our first experimental setup hs was set to 0.9 mm. Hence, this case will be investigated in the following simulations.
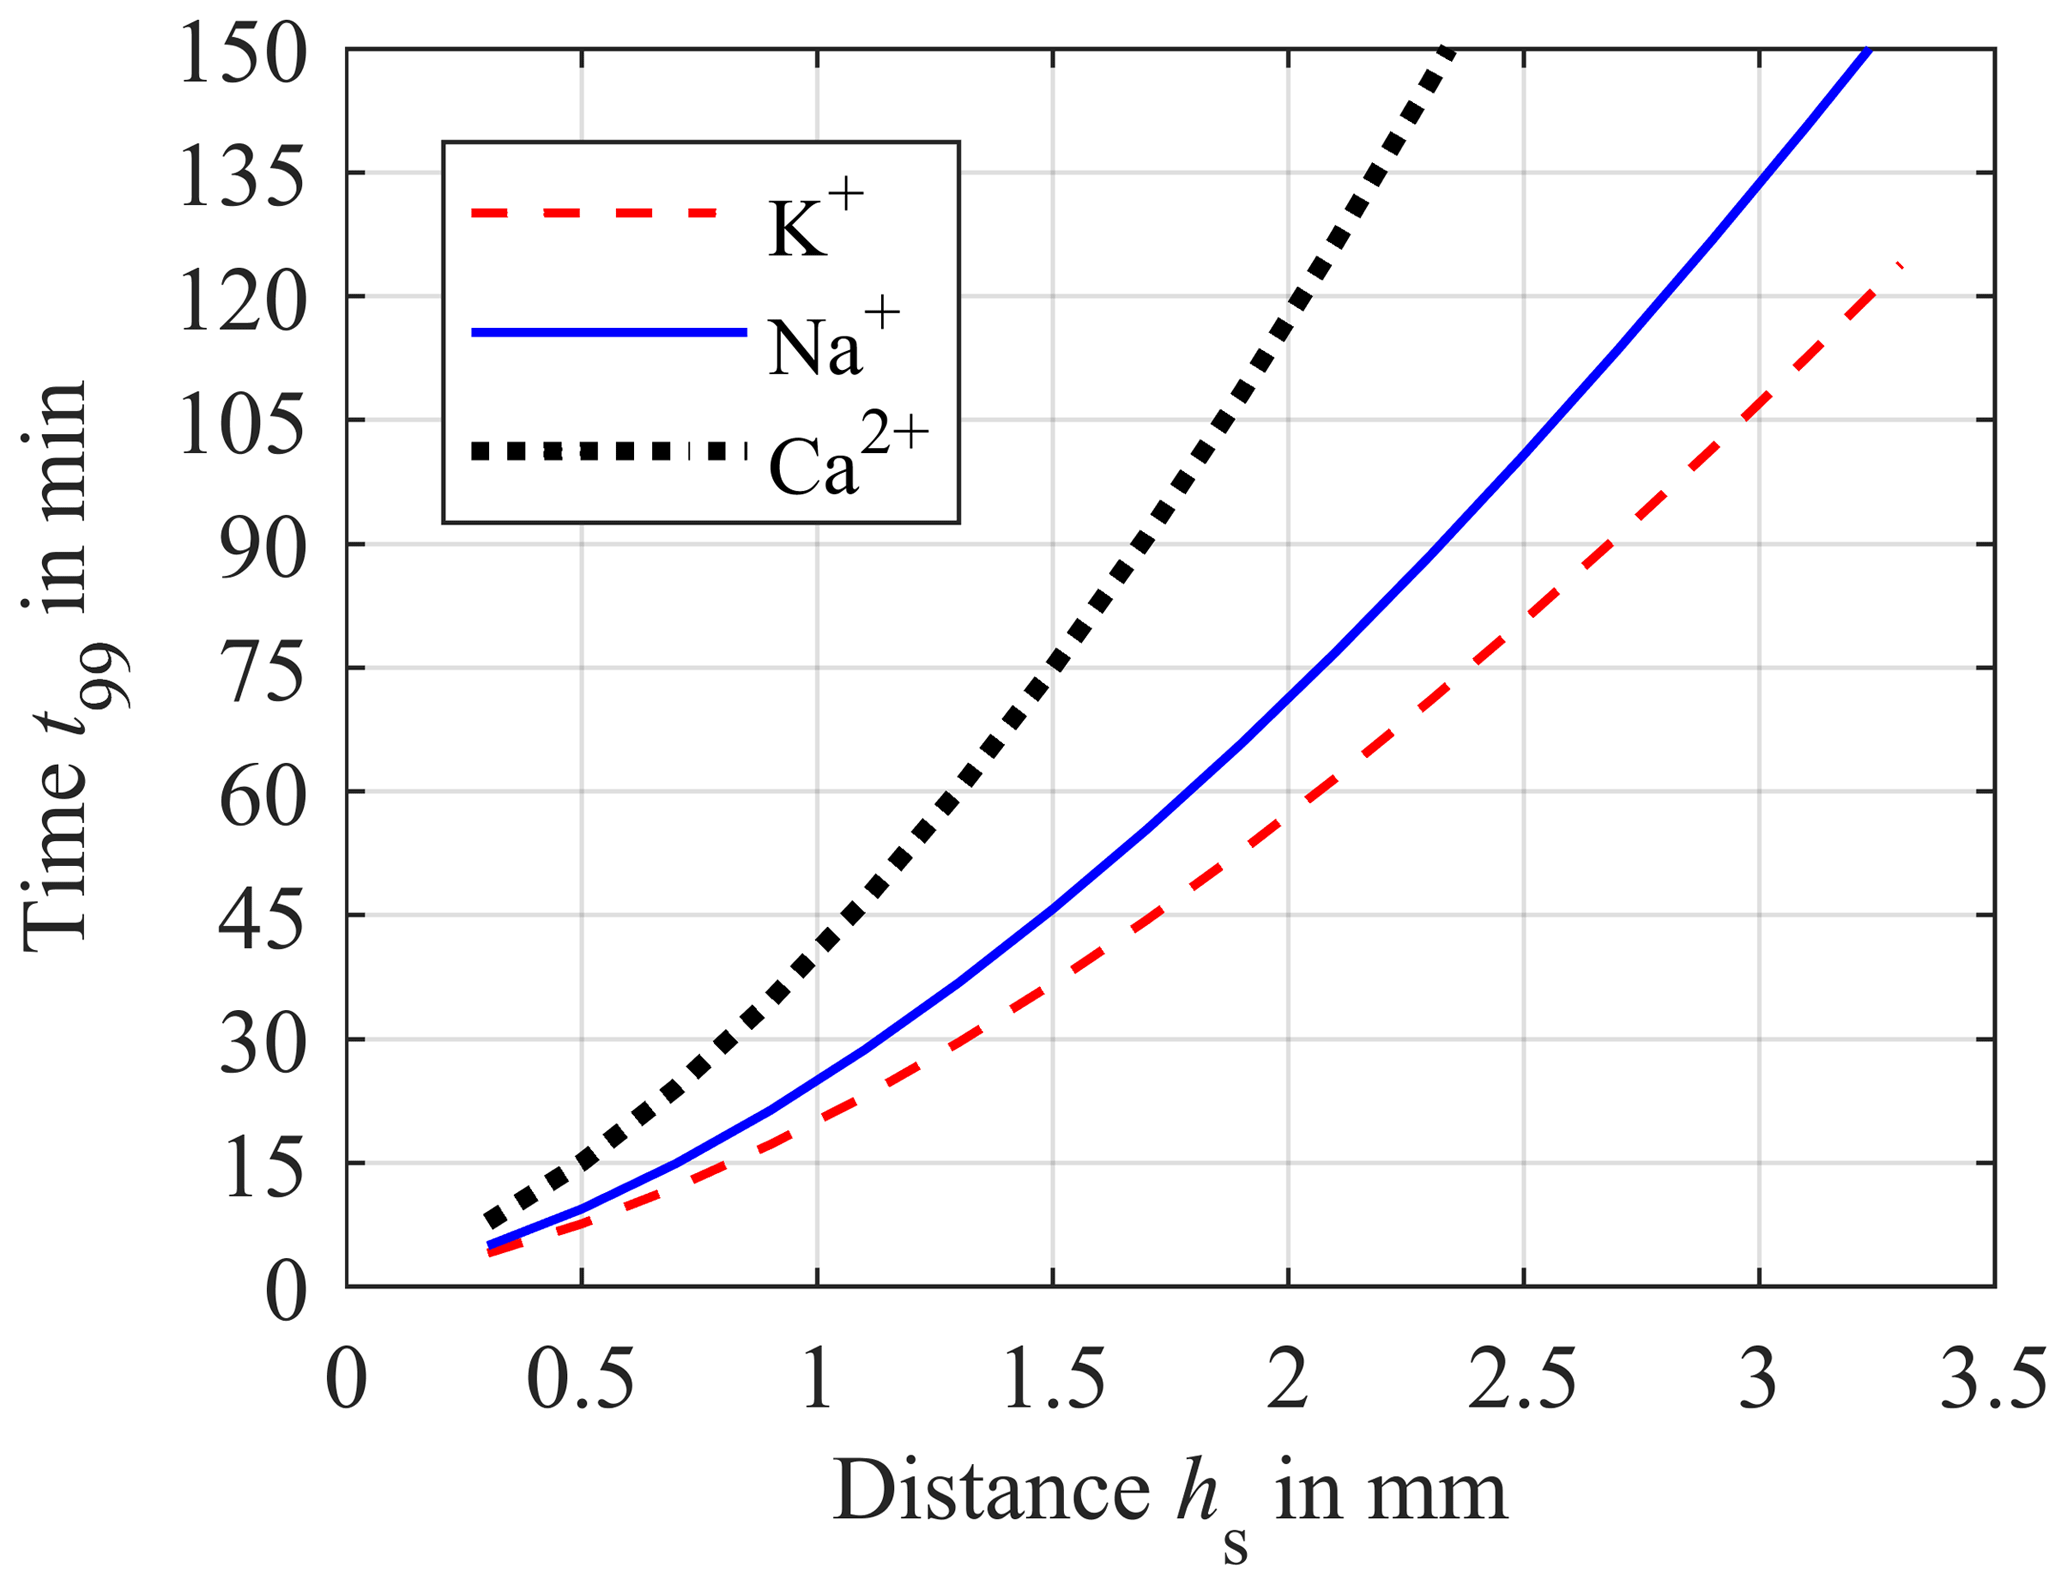
Figure 5Simulation of the required time t99 for 99 % of concentration equalization between blood and sensor compartment versus the distance hs for diffusion coefficients DK = 1.9 × 10⁻⁹ m2 s−1 (red dashed line), DNa = 1.4 × 10⁻⁹ m2 s−1 (blue solid line) and DCa = 0.9 × 10⁻⁹ m2 s−1 (black dotted line).
Since the treatment duration of CRRT is up to 72 h, the exchange velocity of the electrolyte in the plasma is usually slow. In the following simulation an exponentially decrease of the blood concentration cblood−sim in the extracorporeal circuit is assumed according to Eq. (2) and the compartment is now prefilled with a physiological electrolyte solution.
where t is the time in hours, cend is the limit of cblood−sim as t approaches infinity, representing the average of normal blood concentration in healthy humans, and cΔ is the difference between cblood−sim and cend at the beginning of the simulation which decreases with 10 % h−1.
For potassium cend is approximately 4.5 mmol L−1. As a worst case scenario, we assume that cblood−sim for potassium has a maximum of 9 mmol L−1 at the beginning of the dialysis course, resulting in a cΔ of 4.5 mmol L−1. Figure 6 shows cblood−sim (red dashed line) and the corresponding concentration of the compartment ccomp (solid red line). The distance hs between the compartment membrane and the ISE is 0.9 mm. ccomp starts at 4.5 mmol L−1 at the beginning of the simulation since the compartment is now prefilled with a physiological electrolyte solution. Then, the compartment concentration increases up to the cblood−sim. After the intersection of both concentrations at approximately 21 min, ccomp follows the blood concentration. The corresponding absolute error F for potassium is shown in Fig. 7a (red solid line) and is calculated according to Eq. (3):
At the beginning of the simulation, F starts at −4.5 mmol L−1. After the intersection, where F = 0 mmol L−1, the absolute error overshoots to a maximum error of only F = 0.018 mmol L−1 and then decreases exponentially to zero. The corresponding relative error f for potassium according to Eq. (4) is depicted in Fig. 7b (red solid line).
The required accuracies and error bands are obtained from the guidelines of the German Medical Association (Bundesärztekammer, 2014). For potassium, an error band of ±4.5 % has to be ensured, resulting in a settling time of approximately 7.5 min after starting the treatment/measurement. After the overshoot, the maximum relative error f is just about +0.2 % for the rest of the treatment.

Figure 6Response of the sensor compartment potassium concentration ccomp (solid line) to a time-dependent blood potassium concentration cblood−sim for a distance hs of 0.9 mm. The initial compartment concentration is 4.5 mmol L−1. The difference cΔ between the initial value of cblood−sim = 9 mmol L−1 and end value of cblood−sim = 4.5 mmol L−1 decreases exponentially with 10 % per hour.
The same observation can be applied for sodium. Here, however, cend and the initial concentration in the compartment are 140 mmol L−1 and cΔ is 40 mmol L−1, resulting in an initial blood concentration cblood−sim of 180 mmol L−1. Compared to potassium, the intersection of both cblood−sim and ccomp is approximately 4 min later at 25 min. The corresponding absolute error F and relative error f for sodium are depicted in Fig. 7a and b (blue solid line), respectively. The absolute error F starts at −40 mmol L−1. After the intersection point at 25 min, F overshoots, causing a maximum absolute error F of approximately +0.2 mmol L−1. The settling time after starting the treatment/measurement is about 7.2 min for the required accuracy of ±3 %. After the overshoot, the maximum relative error f is just +0.1 % for the rest of the treatment.
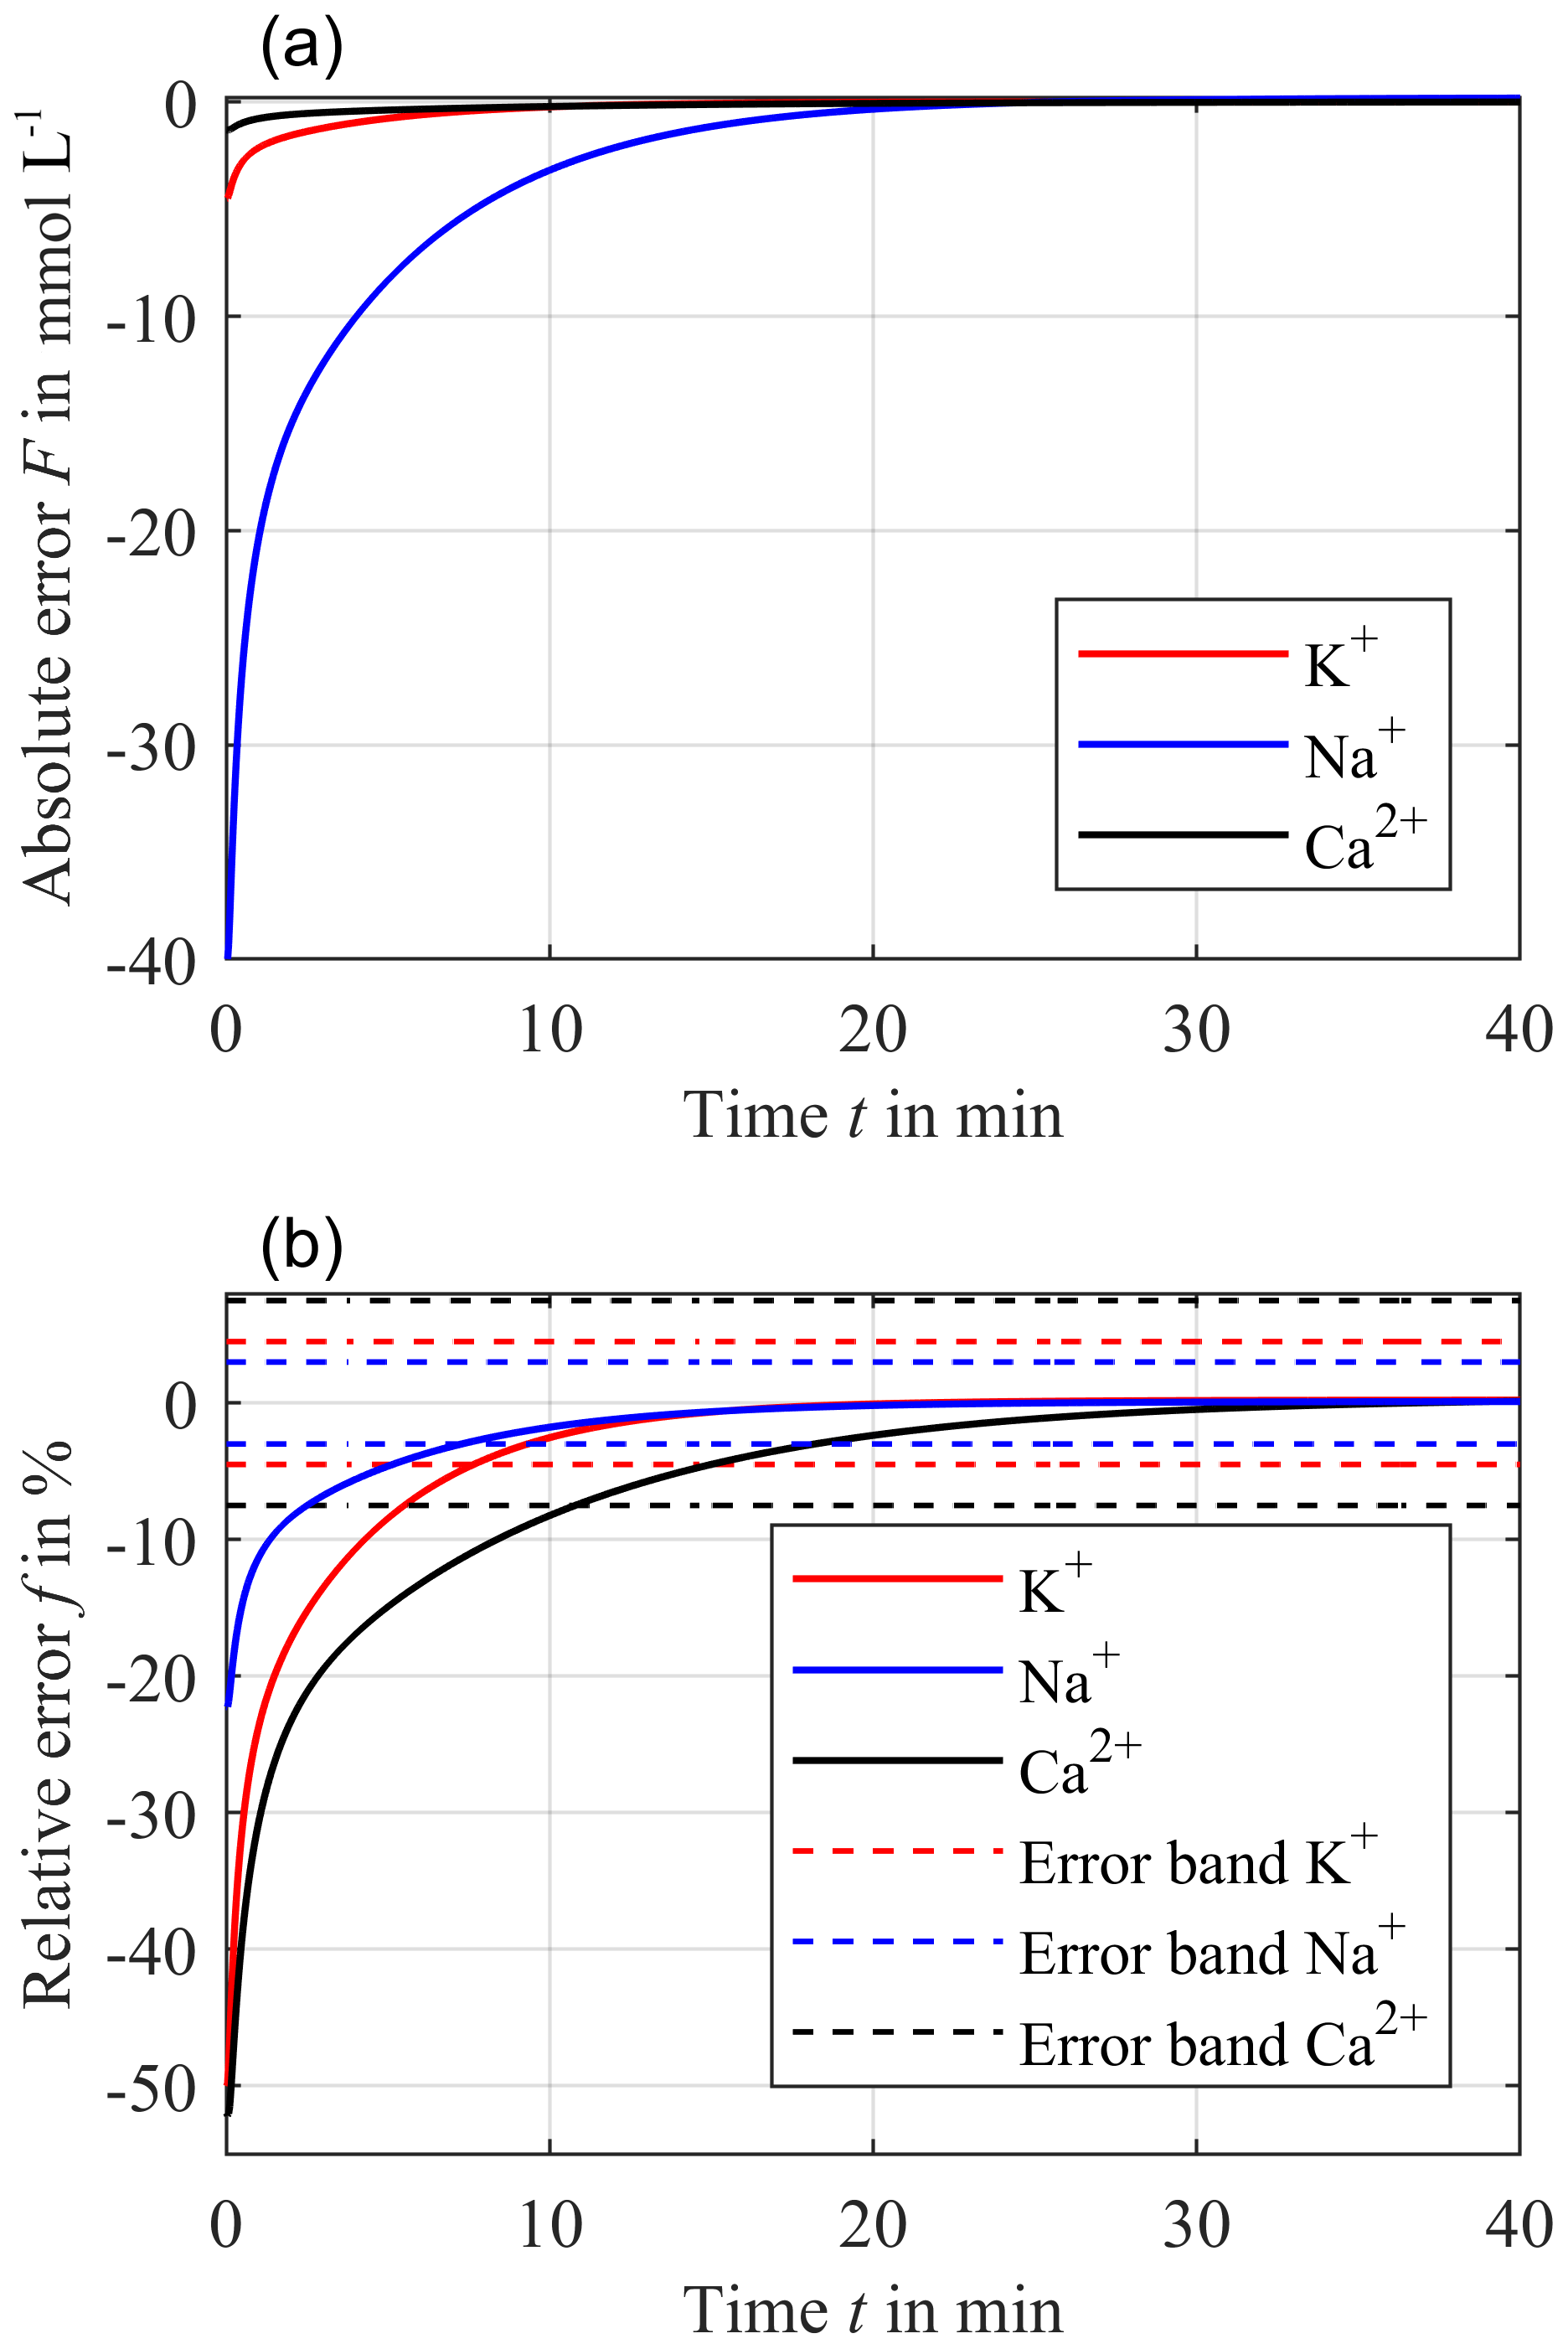
Figure 7Resulting absolute error F between ccomp and exponentially decreasing cblood−sim with 10 % h−1 for a distance hs = 0.9 mm (a) and the corresponding relative error f (solid line) (b) for potassium (red line), sodium (blue line) and calcium (black line). The dashed lines in (b) are the required accuracy of ±3 % for sodium, ±4.5 % for potassium and ±7.5 % for calcium.
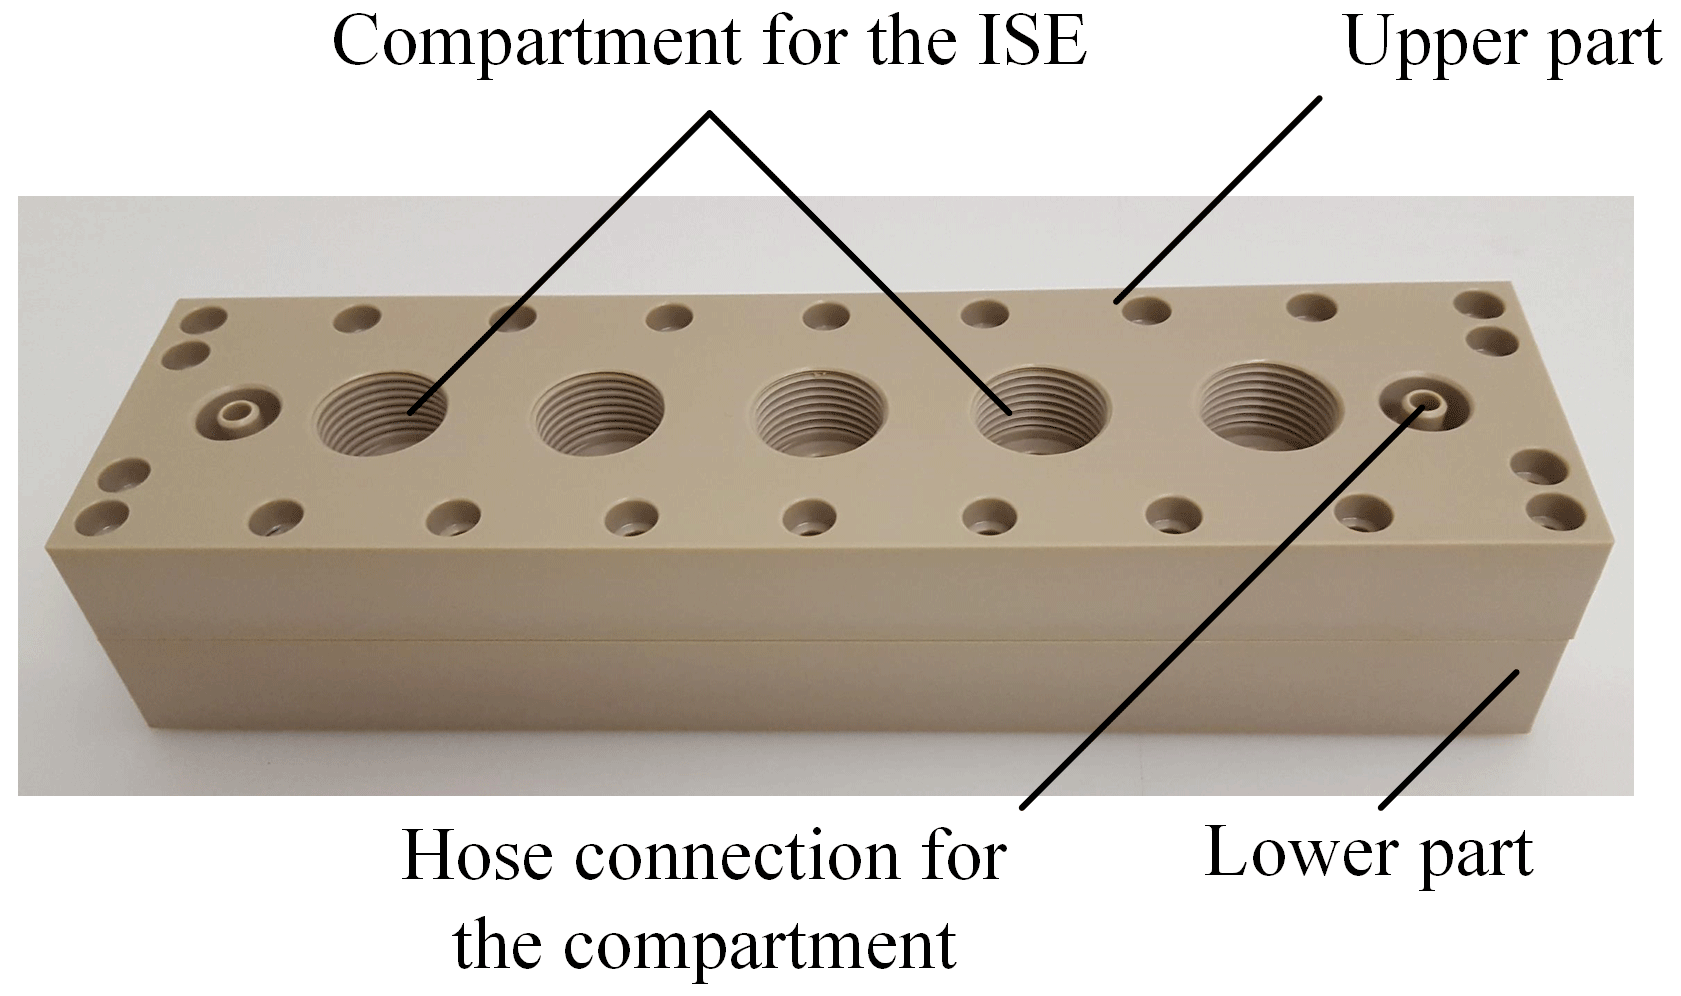
Figure 8Photo of the measuring chamber consisting of two parts made of PEEK. The lower part has the hose connections for the extracorporeal circuit. The upper part contains the compartment for the ISEs and the hose connections for the compartment.
For calcium, cend and the initial concentration in the compartment is 1.2 mmol L−1 and cΔ is 1.3 mmol L−1, resulting in an initial cblood−sim of 2.5 mmol L−1. The lowest diffusion coefficient DCa causes the latest intersection of the two concentrations cblood−sim and ccomp at 36.5 min. After this intersection point, the absolute error F overshoots and has a maximum value of only 9.7 µmol L−1, which can be seen in Fig. 7a (black solid line). Furthermore, the required error band of ±7.5 % can be reached within 10.7 min after starting the treatment/measurement. The maximum relative error f for calcium is just +0.4 % for the rest of the treatment.
In summary, the relative error f after the intersection point of cblood−sim and ccomp is lower than 0.4 % for calcium, 0.2 % for potassium and 0.1 % for sodium. Due to the different accuracies required, the settling time varies from 7.2 min for sodium to 7.5 min for potassium and 10.7 min for calcium after starting the treatment/measurement. This improves the current standard of discrete laboratory analyses significantly, which obtain the results with a delay of several hours. It has to be mentioned that such short settling times of just a few minutes can be neglected for a treatment duration of 72 h.
The demonstrator of the in-line measuring system is similar to the simulation model. Figure 8 shows a photo of the flow cell. The schematic cross section is depicted in Fig. 9. The cell is made of the thermoplastic material PEEK and consists of two components. Two hose connections are located at the lower part of the measurement system on the left and right side, allowing the system to be easily integrated into the extracorporeal circuit independently of the dialysis apparatus used. The lower part is designed to minimize turbulent flows as much as possible by avoiding an abrupt change in the cross section of the flow geometry in order to reduce the mechanical stress on the blood cells and thus prevent hemolysis. The compartment membrane made of regenerated cellulose with a molecular weight cutoff from 10 up to 20 kDa, and a thickness of 28 µm (RCT NatureFlex-NP from Reichelt Chemietechnik) separates the ISEs from the extracorporeal circuit. The ISEs and the reference electrode are placed in the upper part of the system. Via two hose connections in the upper part, the sensor compartment can be prefilled with a physiological electrolyte solution. Furthermore, the ISEs can be calibrated this way. The potassium ISE (201/K) and calcium ISE (201/CA) were purchased from Amel in Italy. As a reference electrode, the InLab Reference electrode from Mettler Toledo was used. For sodium measurement, the polymer membrane electrode from Metrohm was used. The concentration-dependent voltage between the ISEs and reference electrode is recorded by a potentiostat from PalmSens (Polypotentiostat EmStat3 4WE).
In order to investigate the dynamic behavior of the measuring system, we simulate the extracorporeal circuit with a synthetic electrolyte solution, which was pumped from a reservoir into the in-line measuring system via a hose system and then back into the reservoir with a flow rate of 100 mL min−1 by a peristaltic pump (Ecoline VC-380 from ISMATEC). A magnetic stirrer (IKA RCT basic) continuously mixed the reservoir. All chemicals (potassium chloride, sodium chloride and calcium chloride dihydrate) were bought from Sigma-Aldrich Germany.
Hemolysis is an important characteristic of hemocompatibility that needs to be investigated. Therefore, we have built up a further circulation system filled with reconfigured human blood at a flow rate of 100 mL min−1. In order to determine the amount of hemolysis produced by the measuring system, the circulation system was first used without the measuring system for 2 h. After that, the measuring system was integrated into the circulation system filled with new reconfigured blood. Free hemoglobin was used as a marker for hemolysis. The different increase of free hemoglobin in the circulatory system with and without the sensor provides information about the hemolysis produced by the measuring system.
In order to validate the simulation results, we measured the step response of the continuous in-line monitoring system with a synthetic electrolyte solution consisting of the three electrolytes potassium chloride, sodium chloride and calcium chloride in DI (deionized) water. To prevent the ISEs and reference electrode from being exposed to DI water for a longer period of time, the entire extracorporeal circuit and sensor compartment is prefilled with a very low concentrated electrolyte solution (10−5 mol L−1) of sodium chloride, potassium chloride and calcium chloride. It should be noted that these low concentrations are not expected in the later application with real blood. To obtain the step response of the in-line measuring system, the concentrations are raised from zero to c0,Na = 10−1 mol L−1 and c0,K = 10−1 mol L−1 for sodium and potassium and c0,Ca = 10−2 mol L−1 for calcium inside the reservoir. The distances hs between dialyses membrane and ISEs are approximately 0.9 mm. Figure 10 shows the corresponding step response for potassium (red solid line) and sodium (blue solid line) normalized to c0,Na and c0,K and calcium (black solid line) normalized to c0,Ca, respectively. As shown before, the differences of the equalization time are caused by the different diffusion coefficients resulting in the fastest equalization for potassium and the slowest equalization for calcium. Furthermore, Fig. 10 compares the measured and simulated step responses for a distance hs of 0.9 mm. It can be seen that the measured step responses are very similar to the simulated curves. Hence, the simulated error analysis applies to the demonstrator of the in-line measuring system. It should be mentioned that ISEs are not perfectly selective to particular ion species, resulting in cross-sensitivities to other ion species described by the selectivity coefficient kA,B between the target ion A and the interfering ion B in the Nikolsky–Eisenman equation. Due to the different charge number of, e.g., calcium and potassium, the Nikolsky–Eisenman equation results in a nonlinear 3 × 3 equation system for the three electrolytes of interest. Since manufacturers obtain the selectivity coefficients k for each ISE, interferences can be corrected between all measured ions using Newton's method. Furthermore, ISEs are actually sensitive to ion activities and not to ion concentrations. The activity coefficient relates the activity to the concentration. In particular, the activity deviates from the concentration at high electrolyte concentrations. However, if the calibration solutions have similar activities to blood, it is possible to neglect the effect of the concentration-dependent variation of the activity coefficient since the blood concentration can only vary within a limited range. For instance, in the worst case the concentration of potassium can vary between 1.5 and 9 mmol L−1, for sodium between 120 and 180 mmol L−1 and for ionized calcium between 0.6 and 2.5 mmol L−1. It should be noted that ISEs only determine the ionized calcium and not the complexed calcium. In this particular application, the impact of the temperature of the measuring medium on the sensor signal can also be neglected, as the temperature of the blood can only vary within a narrow range. In the worst case the body temperature can be between 33 and 41 ∘C. In addition, the temperature of the extracorporeal circuit is controlled to reduce the fluctuation of the temperature even further. During a 72 h CRRT it is possible that the sensor signal has a drift over the time. However, it is conceivable to recalibrate the ISEs via the hose connection of the sensor compartment and thus guarantee high-precision measurements of the concentrations. At a flow rate of 100 mL min−1 within the extracorporeal circuit, the standard deviation of the voltage between the ISE and the Ag/AgCl reference electrode is about 1.33 × 10⁻⁵ V, leading to a standard deviation of the concentration of 0.05 % for monovalent ions and 0.1 % for divalent ions, which has to be considered in the overall error. This low standard deviation is achieved by averaging the measurement signal using an averaging time of 1 s. In addition, we use a metal housing for shielding, which considerably reduces the noise and thus the standard deviation.
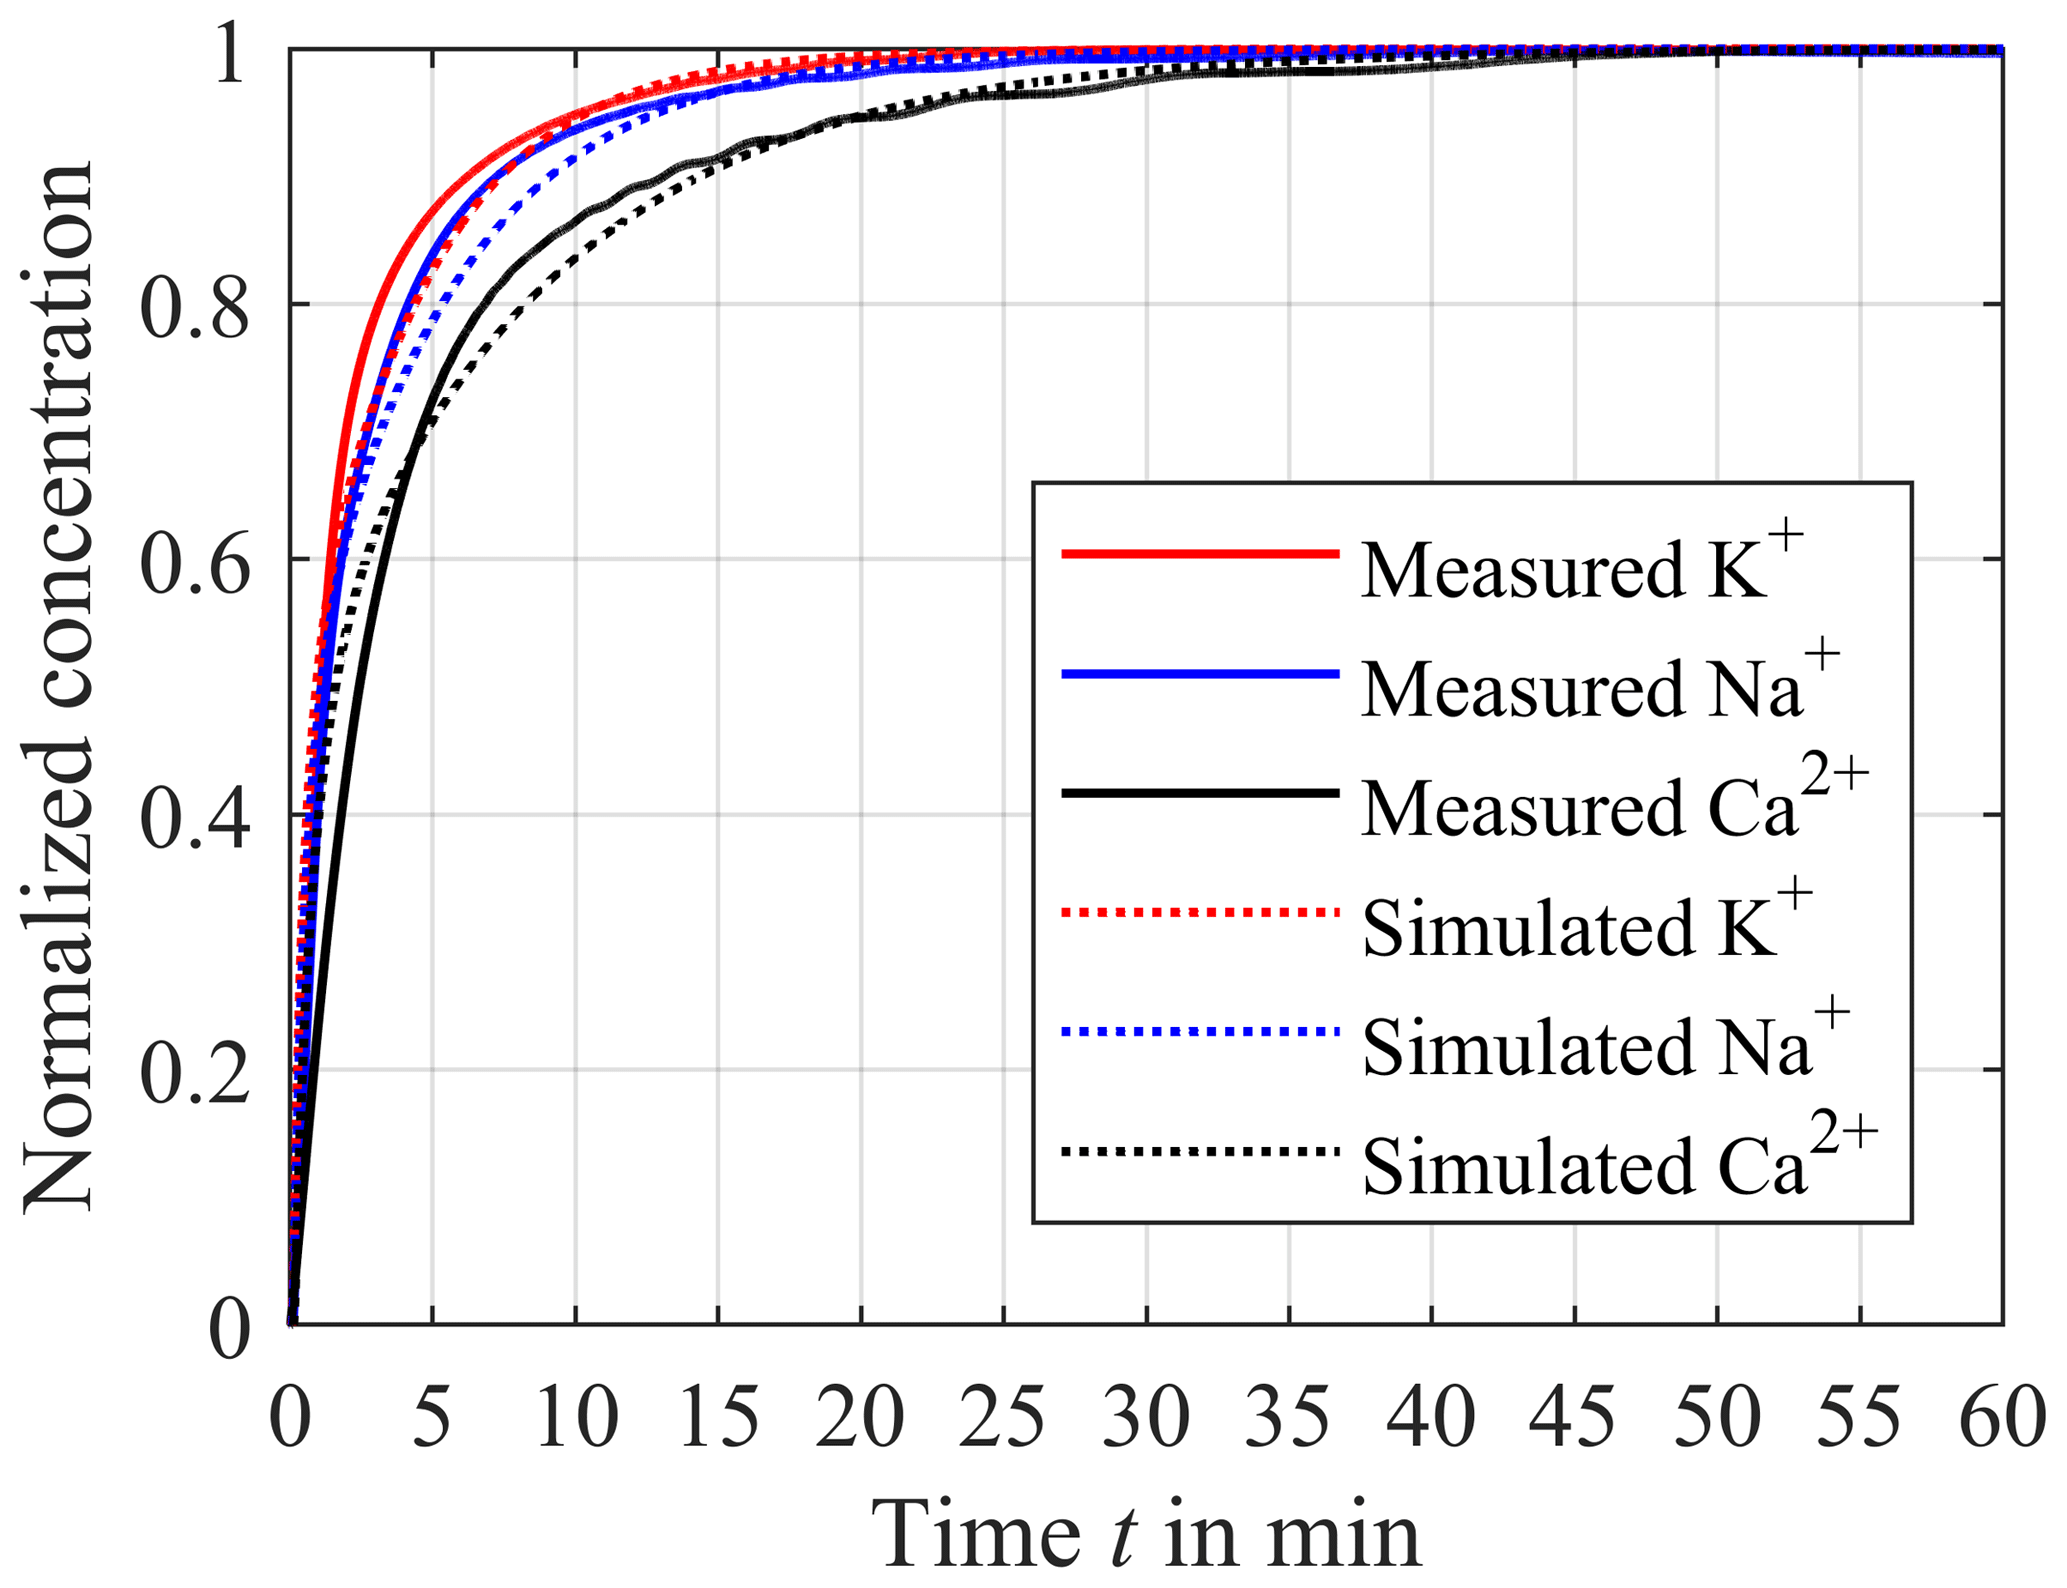
Figure 10Comparison between the measured step response (solid lines) and the simulated response (dotted lines) for potassium (red line), sodium (blue line) and calcium (black line). The distance hs between the ISEs and compartment membrane is about 0.9 mm.
The circulation system filled with reconfigured human blood was used to determine the amount of hemolysis caused by the measuring system at a flow rate of 100 mL min−1. Due to increasing hemolysis of reconfigured blood in the circulation system, the value of free hemoglobin rises continuously during the 2 h measurement. The different amount of free hemoglobin in reconfigured blood between the circulation system with and without the measuring system is therefore a measure of the hemolysis produced by the measuring system. We observed no difference in increasing free hemoglobin between the setup with or without the sensor. Therefore, we exclude significant hemolysis in this first experiment.
In this work, we presented the concept and preliminary investigations of a concept for a continuous in-line monitoring of electrolytes during CRRT that meets the fluidic requirements for hemocompatibility. First investigations of hemocompatibility show no increased hemolysis caused by the measuring system. However, it should be noted that hemocompatibility does not only mean hemolysis. Further tests with real blood (e.g., blood clotting) are still ongoing and experimental proof of hemocompatibility is pending. In this study, the ISEs used are separated from direct blood flow using a dialysis membrane (compartment membrane), preventing the adsorption of, e.g., proteins on the sensor surface. The dynamics of the in-line measuring system is an important factor affecting the resulting measurement error. By reducing the volume of the compartment containing the ISEs, the system dynamics can be improved. With this measuring system, the required accuracy is reached 10.7 min after starting the measurement for calcium, after 7.5 min for potassium and after 7.2 min for sodium. After this short settling time caused by the initial concentration step that only occurs at the beginning of the treatment/measurement, the presented concept enables a continuous in-line measurement with a relative error less than 0.5 % for calcium, 0.25 % for potassium and 0.15 % for sodium, significantly improving the current method of laboratory analysis, which obtains the results with a delay of several hours. Due to the continuous monitoring, the concentration gradients between blood and dialysate can be determined precisely and thus the exchange velocity of electrolytes can be controlled by individualizing the dialysate composition, resulting in a benefit especially for critically ill patients in the ICU, since a rapid change of osmotic substances can lead to complications. Furthermore, the in-line system provides the possibility to be extended by a urea sensor to determine the efficiency of dialysis treatment.
In further work, we will investigate this concept in a clinical study. In addition, we will reduce the size of the measurement system by using miniaturized sensors like ion-selective field-effect transistors (ISFETs). Furthermore, we will investigate the urea sensor. In this study, we use a very simple approach in which the enzyme is retained by another dialysis membrane and thus immobilized close to an ammonium electrode. Hence, the use of toxic chemicals for immobilization can be avoided.
All underlying research data are given in this paper. There is no supplementary or additional underlying material.
The authors declare that they have no conflict of interest.
This article is part of the special issue “Dresden Sensor Symposium 2017”. It is a result of the Dresden Sensor Symposium 2017, Dresden, Germany, 4–6 December 2017.
This research is sponsored by the German Federal Ministry of Education and Research (BMBF)
under grant 13GW0085B.
Edited by: Winfried Vonau
Reviewed by: two anonymous referees
Bagshaw, S. M., George, C., and Bellomo, R.: Early acute kidney injury and sepsis: A multicentre evaluation, Crit. Care, 12, R47, https://doi.org/10.1186/cc6863, 2008.
Baue, A. E., Faist, E., and Fry, D. E.: Multiple Organ Failure: Pathophysiology, Prevention, and Therapy, N, Springer New York, New York, 1, online resource 722, 2000.
Bellomo, R., Kellum, J. A., and Ronco, C.: Acute kidney injury, The Lancet, 380, 756–766, https://doi.org/10.1016/S0140-6736(11)61454-2, 2012.
Buemi, M., Aloisi, E., Coppolino, G., Loddo, S., Crascì, E., Aloisi, C., Barillà, A., Cosentini, V., Nostro, L., Caccamo, C., Floccari, F., Romeo, A., Frisina, N., and Teti, D.: The effect of two different protocols of potassium haemodiafiltration on QT dispersion, Nephrol. Dial. Transpl., 20, 1148–1154, https://doi.org/10.1093/ndt/gfh770, 2005.
Bundesärztekammer: Richtlinie der Bundesärztekammer zur Qualitätssicherung laboratoriumsmedizinischer Untersuchungen, Deutsches Ärzteblatt, 111, A 1583–A 1618, 2014.
Cammann, K.: Working with Ion-Selective Electrodes: Chemical Laboratory Practice, Chemical Laboratory Practice, Springer, Berlin, Heidelberg, 22665 pp., 1979.
Cho, D. S., Olesberg, J. T., Flanigan, M. J., and Arnold, M. A.: On-line near-infrared spectrometer to monitor urea removal in real time during hemodialysis, Appl. Spectrosc., 62, 866–872, https://doi.org/10.1366/000370208785284411, 2008.
Dhawan, G., Sumana, G., and Malhotra, B. D.: Recent developments in urea biosensors, Biochemi. Eng. J., 44, 42–52, https://doi.org/10.1016/j.bej.2008.07.004, 2009.
Domingo, W. R. and Klyne, W.: A photoelectric flame photometer, Biochem. J., 45, 400–408, 1949.
Eggenstein, C., Borchardt, M., Diekmann, C., Gründig, B., Dumschat, C., Cammann, K., Knoll, M., and Spener, F.: A disposable biosensor for urea determination in blood based on an ammonium-sensitive transducer, Biosens. Bioelectron., 14, 33–41, https://doi.org/10.1016/S0956-5663(98)00103-1, 1999.
Friedman, A. M. and Kennedy, J. W.: The Self-diffusion Coefficients of Potassium, Cesium, Iodide and Chloride Ions in Aqueous Solutions 1, J. Am. Chem. Soc., 77, 4499–4501, https://doi.org/10.1021/ja01622a016, 1955.
Gál, G., Gróf, J., and Kiss, E.: Continuous monitoring of the efficiency of haemodialysis by recording the UV transmittance of the dialysis solution, Ac. Chirur. Hung., 24, 231–239, 1983.
Gavalas, V. G., Berrocal, M. J., and Bachas, L. G.: Enhancing the blood compatibility of ion-selective electrodes, Anal. Bioanal. Chem., 384, 65–72, https://doi.org/10.1007/s00216-005-0039-0, 2006.
Gosting, L. J. and Akeley, D. F.: A Study of the Diffusion of Urea in Water at 25∘ with the Gouy Interference Method 1, J. Am. Chem. Soc., 74, 2058–2060, https://doi.org/10.1021/ja01128a060, 1952.
Gumbrecht, W., Schelter, W., Montag, B., Rasinski, M., and Pfeiffer, U.: Online blood electrolyte monitoring with a ChemFET microcell system, Sens. Act. B-Chem., 1, 477–480, https://doi.org/10.1016/0925-4005(90)80253-V, 1990.
Henrich, W. L., Hunt, J. M., and Nixon, J. V.: Increased ionized calcium and left ventricular contractility during hemodialysis, New Egl. J. Med., 310, 19–23, https://doi.org/10.1056/NEJM198401053100105, 1984.
Johnson, R. D., Gavalas, V. G., Daunert, S., and Bachas, L. G.: Microfluidic ion-sensing devices, Anal. Chim. Ac., 613, 20–30, https://doi.org/10.1016/j.aca.2008.02.041, 2008.
Keshaviah, P. R., Ebben, J. P., and Emerson, P. F.: On-line monitoring of the delivery of the hemodialysis prescription, Pediatr. Nephrol., 9, S2–S8, https://doi.org/10.1007/BF00867675, 1995.
Knopp, R., Scherbaum, F. J., and Kim, J. I.: Laser induced breakdown spectroscopy (LIBS) as an analytical tool for the detection of metal ions in aqueous solutions, Anal. Bioanalyt. Chem., 355, 16–20, https://doi.org/10.1007/s0021663550016, 1996.
Koncki, R.: Recent developments in potentiometric biosensors for biomedical analysis, Anal. Chim. Ac., 599, 7–15, https://doi.org/10.1016/j.aca.2007.08.003, 2007.
Kovesdy, C. P., Regidor, D. L., Mehrotra, R., Jing, J., McAllister, C. J., Greenland, S., Kopple, J. D., and Kalantar-Zadeh, K.: Serum and dialysate potassium concentrations and survival in hemodialysis patients, Clin. J. Am. Soc. Nephrol., 2, 999–1007, https://doi.org/10.2215/CJN.04451206, 2007.
Lang, R. M., Fellner, S. K., Neumann, A., Bushinsky, D. A., and Borow, K. M.: Left ventricular contractility varies directly with blood ionized calcium, Ann. Int. Med., 108, 524–529, 1988.
Liao, W.-Y., Weng, C.-H., Lee, G.-B., and Chou, T.-C.: Development and characterization of an all-solid-state potentiometric biosensor array microfluidic device for multiple ion analysis, Lab Chip, 6, 1362–1368, https://doi.org/10.1039/b603364d, 2006.
Lindsay, R. M. and Sternby, J.: Future Directions in Dialysis Quantification, Semin. Dialysis, 14, 300–307, https://doi.org/10.1046/j.1525-139X.2001.00067.x, 2001.
Locatelli, F., La Milia, V., Violo, L., Del Vecchio, L., and Di Filippo, S.: Optimizing haemodialysate composition, C. K. J., 8, 580–589, https://doi.org/10.1093/ckj/sfv057, 2015.
Lyons, P. A. and Riley, J. F.: Diffusion Coefficients for Aqueous Solutions of Calcium Chloride and Cesium Chloride at 25∘, J. Am. Chem. Soc., 76, 5216–5220, https://doi.org/10.1021/ja01649a081, 1954.
Marchenko, S. V., Kucherenko, I. S., Hereshko, A. N., Panasiuk, I. V., Soldatkin, O. O., El'skaya, A. V., and Soldatkin, A. P.: Application of potentiometric biosensor based on recombinant urease for urea determination in blood serum and hemodialyzate, Sensor. Actuators B-Chem., 207, 981–986, https://doi.org/10.1016/j.snb.2014.06.136, 2015.
Mikhelson, K. N.: Ion-selective electrodes, Lecture notes in chemistry, 81, Springer, Berlin, 162 pp., 2013.
Owen, W. F., Lew, N. L., Liu, Y., Lowrie, E. G., and Lazarus, J. M.: The urea reduction ratio and serum albumin concentration as predictors of mortality in patients undergoing hemodialysis, New Engl. J. Med., 329, 1001–1006, https://doi.org/10.1056/NEJM199309303291404, 1993.
Palmer, B. F.: Individualizing the Dialysate in the Hemodialysis Patient, Semin. Dialysis, 14, 41–49, https://doi.org/10.1046/j.1525-139x.2001.00013.x, 2001.
Patel, P., Nandwani, V., McCarthy, P. J., Conrad, S. A., and Keith Scott, L.: Continuous renal replacement therapies: A brief primer for the neurointensivist, Neurocrit. Care, 13, 286–294, https://doi.org/10.1007/s12028-010-9386-6, 2010.
Patschan, D. and Müller, G. A.: Acute kidney injury, J. I. V. R., 7, 19–26, https://doi.org/10.5249/jivr.v7i1.604, 2015.
Paula, F. M. de, Peixoto, A. J., Pinto, L. V., Dorigo, D., Patricio, P. J. M., and Santos, S. F. F.: Clinical consequences of an individualized dialysate sodium prescription in hemodialysis patients, Kidney Int., 66, 1232–1238, https://doi.org/10.1111/j.1523-1755.2004.00876.x, 2004.
Redaelli, B., Locatelli, F., Limido, D., Andrulli, S., Signorini, M. G., Sforzini, S., Bonoldi, L., Vincenti, A., Cerutti, S., and Orlandini, G.: Effect of a new model of hemodialysis potassium removal on the control of ventricular arrhythmias, Kidney Int., 50, 609–617, 1996.
Ricci, Z., Bellomo, R., and Ronco, C.: Dose of dialysis in acute renal failure, Clin. J. Am. Soc. Nephrol., 1, 380–388, https://doi.org/10.2215/CJN.00520705, 2006.
Schindler, J. G. and Glich, M. V.: Zement-Festableitung für ionenselektive und gassensitive Elektroden sowie elektrochemisch-enzymatische Sensoren, Z. Anal. Chem., 307, 105–108, https://doi.org/10.1007/BF00487488, 1981.
Schindler, J. G. and Schindler, M. M.: Bioelektrochemische Membranelektroden, de Gruyter, Berlin, 340 pp., 1983.
Sharma, M. K., Wieringa, F. P., Frijns, A. J. H., and Kooman, J. P.: On-line monitoring of electrolytes in hemodialysis: on the road towards individualizing treatment, Expert Rev. Med. Devic., 13, 933–943, https://doi.org/10.1080/17434440.2016.1230494, 2016.
Singh, M., Verma, N., Garg, A., and Redhu, N.: Urea biosensors, Sens. Actuators B-Chem., 134, 345–351, https://doi.org/10.1016/j.snb.2008.04.025, 2008.
Sivalingam, M. and Farrington, K.: Haemodialysis, Medicine, 35, 461–465, https://doi.org/10.1016/j.mpmed.2007.05.005, 2007.
Stiller, S., Bonnie-Schorn, E., Grassmann, A., Uhlenbusch-Körwer, I., and Mann, H.: A Critical Review of Sodium Profiling for Hemodialysis, Semin. Dialysis, 14, 337–347, https://doi.org/10.1046/j.1525-139X.2001.00086.x, 2001.
Tumlin, J., Wali, R., Williams, W., Murray, P., Tolwani, A. J., Vinnikova, A. K., Szerlip, H. M., Ye, J., Paganini, E. P., Dworkin, L., Finkel, K. W., Kraus, M. A., and Humes, H. D.: Efficacy and safety of renal tubule cell therapy for acute renal failure, J. Ame. Soc. Nephrol., 19, 1034–1040, https://doi.org/10.1681/ASN.2007080895, 2008.
Vitagliano, V. and Lyons, P. A.: Diffusion Coefficients for Aqueous Solutions of Sodium Chloride and Barium Chloride, J. Am. Chem. Soc., 78, 1549–1552, https://doi.org/10.1021/ja01589a011, 1956.
Zarjou, A. and Agarwal, A.: Sepsis and acute kidney injury, J. Am. Soc. Nephrol., 22, 999–1006, https://doi.org/10.1681/ASN.2010050484, 2011.