the Creative Commons Attribution 4.0 License.
the Creative Commons Attribution 4.0 License.
 | 28 Aug 2020
Siloxane treatment of metal oxide semiconductor gas sensors in temperature-cycled operation – sensitivity and selectivity
Caroline Schultealbert
Iklim Uzun
Tobias Baur
Tilman Sauerwald
Andreas Schütze
The impact of a hexamethyldisiloxane (HMDSO) treatment on the response of doped SnO2 sensors is investigated for acetone, carbon monoxide and hydrogen. The sensor was operated in temperature cycles based on the DSR concept (differential surface reduction). According to this concept, the rate constants for the reduction and oxidation of the surface after fast temperature changes can be evaluated and used for quantification of reducing gases as well as quantification and compensation of sensor poisoning by siloxanes, which is shown in this work. Increasing HMDSO exposure reduces the rate constants and therefore the sensitivity of the sensor more and more for all processes. On the other hand, while the rate constants for acetone and carbon monoxide are reduced nearly to zero already for short treatments, the hydrogen sensitivity remains fairly stable, which greatly increases the selectivity. During repeated HMDSO treatment the quasistatic sensitivity, i.e. equilibrium sensitivity at one point during the temperature cycle, rises at first for all gases but then drops rapidly for acetone and carbon monoxide, which can also be explained by reduced rate constants for oxygen chemisorption on the sensor surface when considering the generation of surface charge.
- Article
(2709 KB) - Full-text XML
-
Supplement
(436 KB) - BibTeX
- EndNote


Exposure to siloxane is known to change the properties of metal oxide semiconductor (MOS) gas sensors in terms of response time, sensitivity and selectivity (Williams and Pratt, 1998; Schüler et al., 2015). These changes are caused by the decomposition of the siloxanes on the hot sensor surface leading to the formation of non-volatile reaction products like polymers or silica (Rücker and Kümmerer, 2015) and hence to a decrease in reactivity, e.g. due to a reduction of catalytic activity of the sensor surface. In catalysis this deactivation is called poisoning (Elsayed et al., 2017), a term that is also widely used in the MOS gas sensor community (Korotcenkov and Cho, 2011) even though the effect does not always lead to sensor deterioration. Extensive siloxane exposure decreases the sensitivity of a MOS gas sensor to a wide range of gases except for hydrogen H2 (Williams and Pratt, 1998). MOS gas sensors for volatile organic compounds (VOCs), e.g. for indoor air quality (IAQ) measurement, can therefore be deteriorated by siloxanes (Korotcenkov and Cho, 2011). Testing procedures like DIN EN 50194-1 (10 ppm hexamethyldisiloxane, HMDSO, for 40 min, i.e. a dosage of 400 ppm min) have been introduced to predict the stability. Recent results suggest, however, that this test dosage might not be sufficient (Palmisano et al., 2015) in many applications: siloxanes and especially volatile cyclic siloxanes belong to the most abundant VOCs found in indoor environments (Gaj and Pakuluk, 2015; Tang et al., 2015), originating from numerous sources, e.g. personal care products and cosmetics (Horii and Kannan, 2008; Dudzina et al., 2014). Siloxanes are also widely used in printing inks, several patents can be found (Snyder, 1967; Robbart, 1985; Smith, 2004; Moorlag et al., 2016) and volatile contaminations from mostly siloxane-based stencils can be found on printed matter (Sharpe et al., 2006). Due to the increasing abundance of cyclic siloxanes, the German environmental agency UBA proposed a guideline limit value of 0.4 mg m−3 of cyclic siloxanes in room air (Umweltbundesamt, 2011). With this concentration, the above-mentioned testing dosage of 400 ppm min is already reached after approximately 5 to 11 d, depending on whether the total mass or the total number of molecules is considered. It becomes obvious that the effects of siloxane poisoning cannot be ignored in MOS sensor applications like IAQ. Research studies on better understanding and minimizing the impact of sensor poisoning are therefore highly necessary.
As mentioned above, siloxane treatment usually has a negligible effect on the hydrogen sensitivity, providing a rise in selectivity for this gas. For the preparation of an intentionally H2-selective sensor, often bulky silicon dioxide (SiO2) layers are deposited on the sensing layer, e.g. using chemical vapour deposition (CVD). These layers have been reported to act as a molecular sieve on the surface (Kelleter, 1997; Tournier and Pijolat, 2005) or even as a pre-concentrator (Meng et al., 2019).
Despite the enormous importance, the process of surface deactivation on sensors is poorly understood. Several authors have reported that during a siloxane treatment process a rise in sensitivity is observed at first followed by decreasing sensitivity (Williams and Pratt, 1998; Meng et al., 2019). In this work, we want to improve the understanding of siloxane treatment effects on the sensing layer using a special temperature variation technique called differential surface reduction (DSR), which allows the determination of rate constants for gas reactions on the sensor surface. In other publications we already presented this method for highly sensitive quantification and identification of reducing gases like VOCs (Schultealbert et al., 2017, 2018; Baur et al., 2018). In this study, a MOS gas sensor is exposed to high dosages of HMDSO (up to 600 ppm h or 36 000 ppm min) in several steps, while rate constants for acetone, carbon monoxide, hydrogen and oxygen are evaluated. The findings are evaluated in terms of sensitivity and hydrogen selectivity.
2.1 Sensor model
The classical model for a gas sensor's sensitivity is based on energy barriers at grain–grain boundaries resulting from surface charges in the form of and O− and the mass action law (Madou and Morrison, 1989). Therefore, the steady-state sensitivity to a certain gas is given by the equilibrium between oxygen oxidizing the sensor surface,
and gases reacting with adsorbed oxygen O−, which is the reactive species according to Madou and Morrison (1989), reducing these surface sites (reducing gases R):
The blocking of surface sites by SiO2 will inhibit the surface oxygen adsorption, Eqs. (1) and (2), as well as the gas reaction with surface oxygen, Eq. (3). Depending on the relative extent of these inhibitions, this could result in an overall increase or decrease in sensitivity.
Using the DSR method we are able to observe oxidation and reduction processes independent of each other during temperature-cycled operation (TCO) (Schultealbert et al., 2017; Baur et al., 2018). On the other hand, the two different oxidation processes according to Eqs. (1) and (2) are not distinguished, and only the combined process is observed. Therefore, we will call the overall process of Eqs. (1) and (2) the generation of surface charge with the rate constant kox and the process according to Eq. (3) surface reduction with the rate constant kred. This also accounts for the fact that the type of surface oxygen taking part in the reaction (which was stated above to be O−) and specific reaction processes depend on the sensor temperature and are still discussed in the literature (Barsan and Weimar, 2001; Gurlo, 2006), so we want to emphasize that kox and kred can also represent other reaction processes resulting in generation or reduction of surface charge.
The procedure for the DSR method is derived from the Sauerwald–Baur model for SnO2 sensors in TCO, which is described in detail in Schultealbert et al. (2017) and Baur et al. (2018). The mentioned generally accepted assumption of Schottky barriers with an energy barrier built by surface charge is used and the surface processes taking place during and after temperature changes are modelled to characterize the conductance of the sensitive layer. In contrast to physical adsorption of molecules on surfaces, the total surface charge in thermal equilibrium increases with temperature and is limited by the maximum allowable band bending induced by the resulting space charge region. Therefore, after a fast change from high to low temperature the surface is charged highly above equilibrium, because the surface processes, i.e. the relaxation of surface charge, are significantly slower than the performed temperature change. The reaction of any reducing gas in the surrounding gas atmosphere with this surface charge according to Eq. (3) will be dominant compared to the generation of surface charge, Eqs. (1) and (2), and can be observed as an exponential relaxation of the sensor conductance G. For low concentrations of reducing gases and short times after the temperature jump, this exponential process can be simplified using a Taylor series so that the following relation applies:
which allows determination of the effective rate constant kred for the surface reduction. On the other hand, for a fast change from low to high temperature the inverse reaction (generation of surface charge) is dominant on the surface, because the sensor is coming from a state with lower surface charge at lower temperature. Since this is often a fast process due to the high temperature and because the oxygen concentration in air is high compared to reducing gases, the resulting time constant is evaluated by an exponential fit instead of the linear approximation in Eq. (4), similar to the evaluation method for high concentrations of reducing gas presented by Schultealbert et al. (2018). In contrast to the slope as the first element of a Taylor series, the evaluation of a time constant has the additional advantage of being independent of the initial energy barrier. Due to the fast equilibration at high temperature, we can always assume to be in equilibrium before a step change from high to low temperature, i.e. starting from the same surface charge, so the linear approximation according to Eq. (4) is appropriate for the low-temperature surface reduction. Reaching equilibrium conditions at lower temperatures to be in a defined state before changing to high temperature would take significantly more time and, moreover, is strongly dependent on the concentration of reducing gases. Corresponding to the DSR method, this process is denoted as differential surface oxidation (DSO). The full process of the DSR and DSO methods at grain level, the observable sensor conductance ln (G) as well as the relevant sections for the data evaluation are summarized in the schematic overview in Fig. 1. The graphic also includes the definition of the quasistatic conductance, which means that the signal is extracted from the dynamic operation during temperature cycling but at a distinct time within the cycle, where the conductance has reached a constant value on the respective temperature step, i.e. equilibrium surface coverage is achieved, and the evaluated signal is therefore comparable to steady-state operation, where the sensor is constantly kept at one temperature.

Figure 1Schematic overview of the working principle for the DSR and DSO method: top shows the observed trace of ln (G) over one temperature step from high to low temperature as indicated in the middle. Regions for data evaluation in the form of exponential fit (for DSO) and linear approximation (for DSR) as well as the relevant data points for extraction of the quasistatic conductance are indicated. The bottom shows the working principle on grain level: two neighbouring grains representing the MOS sensor layer are displayed; the amount of surface charge and the corresponding depletion layer which is responsible for the energy barrier are indicated by the size of the lighter region in each state of the temperature cycle.
This model behind the used temperature cycle is of course a simplified view of MOS sensors, but from our experience it is highly useful under many circumstances and for a broad range of SnO2-based sensors. Nevertheless, it is important to understand that there can be deviations from the idealized derived behaviour as described here if some or all of the underlying assumptions (one-stage reaction processes, constant donor density, only one dominant oxygen species taking part in the reaction, etc.) are invalid.
2.2 Sensor and operation mode
The investigations were performed with a commercially available SnO2-based MOS gas sensor (UST GGS 1530, UST Umweltsensortechnik GmbH; the exact composition of the sensitive layer is unknown, as it is for most commercial sensors). From our experience it is possible to apply the sensor model described in Sect. 2.1 and the DSR method also for other commercial sensors based on SnO2. As described above, gas measurements between the conditioning steps are performed in TCO: temperature changes are performed from high-temperature plateaus at 450 ∘C down to five low-temperature phases (150, 200, 250, 300, and 350 ∘C) for DSR measurements. The duration of each high-temperature phase is 30 s, while the lower-temperature phases have a duration of 120 s, each resulting in a total cycle duration of 750 s.
During the HMDSO treatments, the sensor was operated at constant temperature (300, 400, 500 and 700 ∘C). The temperature during treatment was increased every few steps to investigate temperature-dependent effects and higher SiO2 coverage. The treatment at 700 ∘C was based on a previous work (Kelleter, 1997), where a Pd-doped SnO2-based MOS sensor was treated with 5000 ppm HMDSO for 8 min. In this work, due to concentration limits, the sensor was treated at 700 ∘C with 2500 ppm HMDSO for 16 min to achieve the same dose.
Table 1Overview of the complete HMDSO treatment process with treatment steps after which gas measurements were conducted.
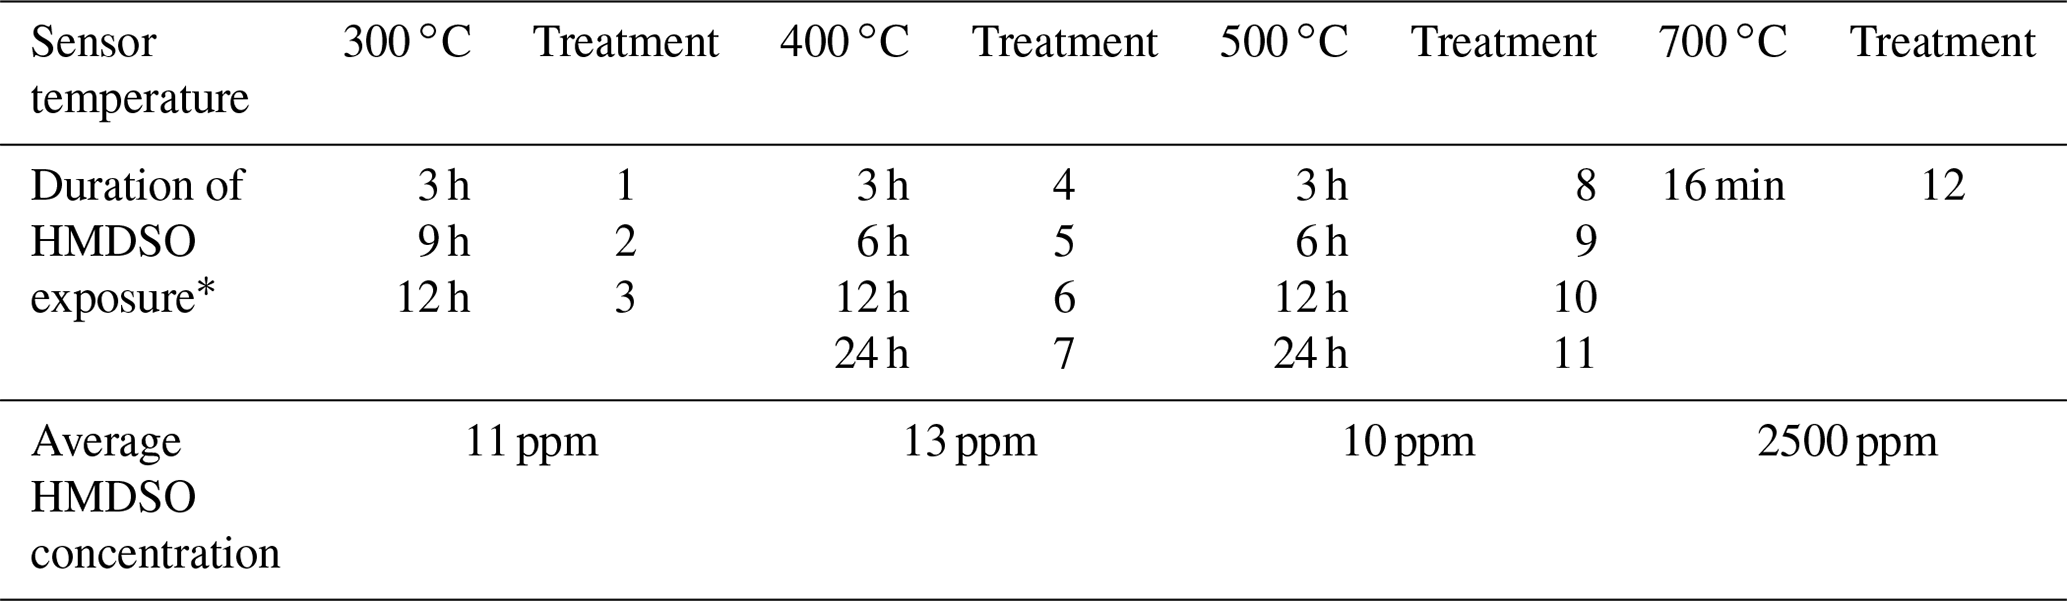
* Accumulated treatment time at this temperature, after which a gas measurement was conducted.
To discriminate between both modes, we will use the notations TCO temperature and treatment temperature below. The full course of ln (G) during a temperature cycle will be denoted as a TCO cycle.
For data acquisition a modified commercial sensor system (SensorToolbox, 3S GmbH) with a logarithmic amplifier (LOG112, Texas Instruments) was used to record the sensor conductance (Baur et al., 2015). In this setup, the sensor temperature is controlled via the integrated heater in a Wheatstone bridge with a digital potentiometer.
2.3 Gas mixing and sequence
The gas measurements were realized with a custom-designed gas-mixing apparatus (GMA, similar to the systems described in Helwig et al., 2014, and Leidinger et al., 2018) consisting of several mass flow controllers (MFCs) and valves. Prior to and in between treatments, the sensor was exposed to 2 ppm acetone and 2 ppm carbon monoxide, as representatives for typical reducing gases, and to 2 ppm hydrogen, which is not influenced by HMDSO poisoning on MOS sensors. The total flow was set to 200 mL min−1 and the humidity was held constant at 50 % RH supplied by a water bubbler at 20 ∘C. The test gases were added from pressure cylinders by MFCs to the humidified carrier gas of zero air. Zero air was supplied from a zero air generator (GT Plus, VICI AG International) with a dew point of −70 ∘C and catalytic conversion to also remove small hydrocarbons and hydrogen from the compressed air. Between gas exposures and after each HMDSO treatment the whole system was thoroughly flushed with zero air for at least 1 h.
The treatments with HMDSO were performed at 4.5 % RH for a certain time (see Table 1) subsequently at the four mentioned sensor temperatures. The HMDSO vapour was generated via an isothermal bubbler at 20 ∘C with a constant flow rate of 0.5 mL min−1 through the liquid. Due to the high vapour pressure, this vapour was diluted by 2 L min−1 of zero air. This diluted vapour flow is then added to the constant sensor flow of 200 mL min−1 to achieve a concentration of approximately 10 ppm, resulting in a total flow rate of 2.2 L min−1 during the HMDSO treatments. The concentration of HMDSO was determined gravimetrically from the mass loss of the bubbler and the total carrier gas flow (see Table 1). An overview of the schematic setup of the GMA can be found in Schüler (2016).

Figure 2TCO cycles under zero air (before treatment) and under 2 ppm of acetone, carbon monoxide, and hydrogen respectively at different stages of the treatment process: (a) before any treatment, (b) after treatment 3, (c) after treatment 6, and (d) after treatment 10.
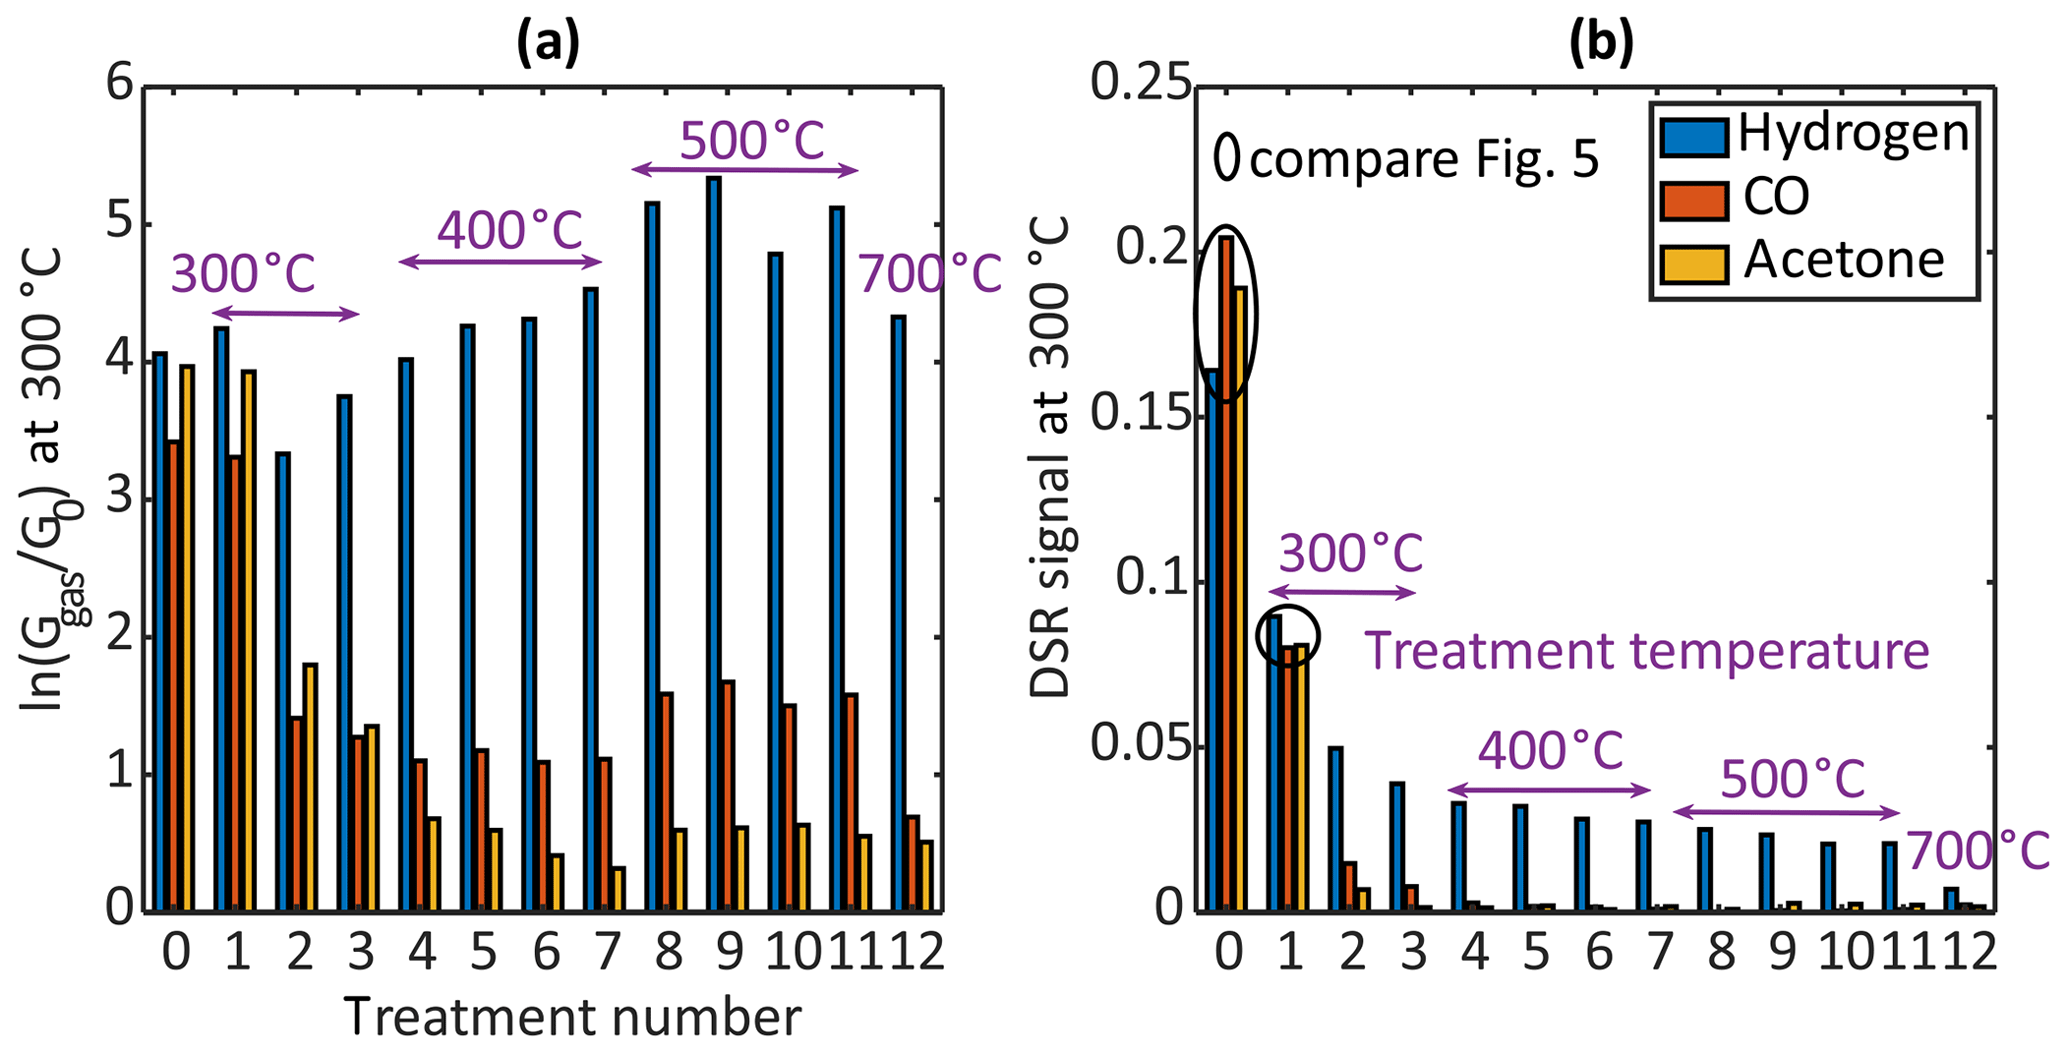
Figure 3(a) The quasistatic sensor response at the end of the 300 ∘C phase for the three measured gases at 2 ppm over the treatment process. (b) The DSR signal at 300 ∘C sensor temperature plotted for the three measured gases at 2 ppm over the treatment process.
3.1 Sensitivity
TCO cycles (full sensor cycles) at different treatment stages under the measured gas atmospheres (zero air, acetone, carbon monoxide and hydrogen) are shown in Fig. 2. Figure 2a shows the sensor signal prior to the HMDSO treatment. Under reducing gases, the sensor shows a strong and fast relaxation process during the high-temperature phases, while the relaxation during the lower-temperature phases is strongly dependent on the TCO temperature and gas type allowing discrimination of different reducing gases. The TCO temperature during the first low-temperature phase (150 ∘C) is too low to yield a significant reduction of surface charge by acetone and hydrogen, so a significant relaxation is only observed for carbon monoxide. In some of the low-temperature phases (250–300 ∘C) the relaxation even exceeds the conductance value at high temperature: the reduction of surface charge, i.e. the grain–grain energy barrier at the sensor surface caused by reducing gases (especially hydrogen), at this temperature exceeds the temperature effect of the semiconductor. After the various HMDSO treatments (Fig. 2b–d) the surface reduction during the low-temperature phases decreases strongly and the low-temperature phases are more and more represented by one constant conductance value instead of a relaxation process. This effect is strongest during the first treatments (Fig. 2b represents treatment 3 after 132 ppm h) but can further be observed also in the following treatments (Fig. 2c and d, corresponding to 288 and 564 ppm h respectively), especially for carbon monoxide. The same can also be observed for the relaxation on the high-temperature phases, where the relaxation results in sharp, high peaks before any treatment (Fig. 2a) which become slower with reduced height during the subsequent treatments (Fig. 2b–d).
The quasistatic sensor response (compare Fig. 1) in terms of was evaluated for all gases to test the previously reported behaviour of at first ascending and later descending sensitivities after HMDSO exposure. The sensor response at the TCO temperature of 300 ∘C to 2 ppm acetone, carbon monoxide and hydrogen for each treatment step is shown in Fig. 3a. Compared to the initial state (treatment 0), the sensor response is nearly constant after the first HMDSO treatment for all gases; a small increase in sensitivity can be observed for hydrogen. For acetone and carbon monoxide the response decreases rapidly with the second treatment, whereas for hydrogen the response shows only a slight decrease. For subsequent treatments, the trend is quite different for the three reducing gases: while the response to carbon monoxide stays nearly constant, it continues to decrease for acetone up until treatment 7. For hydrogen, on the other hand, the response increases even beyond the original response without treatment.
After the first HMDSO treatment at a treatment temperature of 500 ∘C (treatment step 8) an increase in sensitivity can be observed for all gases which then stays practically constant for the subsequent treatments (treatments 9–11). The final treatment at 700 ∘C with increased HMDSO concentration results in significantly reduced sensitivity for carbon monoxide and slightly reduced sensitivities for acetone and hydrogen.
On the other hand, the trends of the DSR sensor signal, i.e. the slope of the logarithmic conductance shortly after the temperature change from high to low, are much easier to interpret when comparing the different gases as well as the overall trend during the treatment steps. Figure 3b shows the DSR signal for all three gases after the step from 450 to 300 ∘C over the various HMDSO treatments. For all three tested gases, a monotonous decrease is observed, but the change, i.e. the degree of poisoning, depending on the treatment step is quite different. While the decrease is fast for acetone and carbon monoxide, nearly reaching zero after two to five treatments, for hydrogen the signal is reduced by half during the first step followed by a much slower reduction compared to the other two gases. The sensor signal after treatment 11 (corresponding to 684 ppm h) still reaches 13 % of the original signal before HMDSO treatment. The final HMDSO treatment at a treatment temperature of 700 ∘C then shows a strong further decrease in the DSR signal.
The results for the other measured TCO temperatures (both in quasistatic evaluation as well as in DSR evaluation) are similar. For low TCO temperatures the hydrogen sensitivity is rather low from the beginning, and the same is true for carbon monoxide at high TCO temperatures; therefore, we chose a medium and commonly used TCO temperature for the DSR evaluation of 300 ∘C to demonstrate the observed effects more clearly. For the other TCO temperatures, the reader is referred to the Supplement.
In the first high-temperature phase during the TCO cycle, an exponential function of the form was fitted to the observed sensor conductance to determine the time constant to reach the equilibrium surface charge. This process is independent of the gas exposure as long as the surface charge was reduced significantly during the previous low-temperature phase; i.e. the relaxation during the high-temperature phase can be clearly observed and the assumptions of the underlying sensor model (Schultealbert et al., 2017) are valid. The results for every treatment step are shown in Fig. 4. The time constant increases continuously during the HMDSO treatment process; i.e. the reaction rate kOx∝b (similar to the DSR signal evaluated for the reducing gases) decreases significantly also for the generation of surface charge. This result explains the seemingly inconsistent results from measurements at constant temperature where rising sensitivities are observed as these result from the competition between surface charging and reduction. In some cases (depending for example on temperature) the reaction rate for hydrogen is affected less than for the generation of surface charge, so the overall sensitivity towards hydrogen rises due to siloxane treatment. However, this does not indicate increased reactivity to hydrogen on the sensor surface as is sometimes concluded. This finding can also help to compensate the sensor poisoning resulting in an instable DSR signal after siloxane exposure, as we will discuss in Sect. 4.
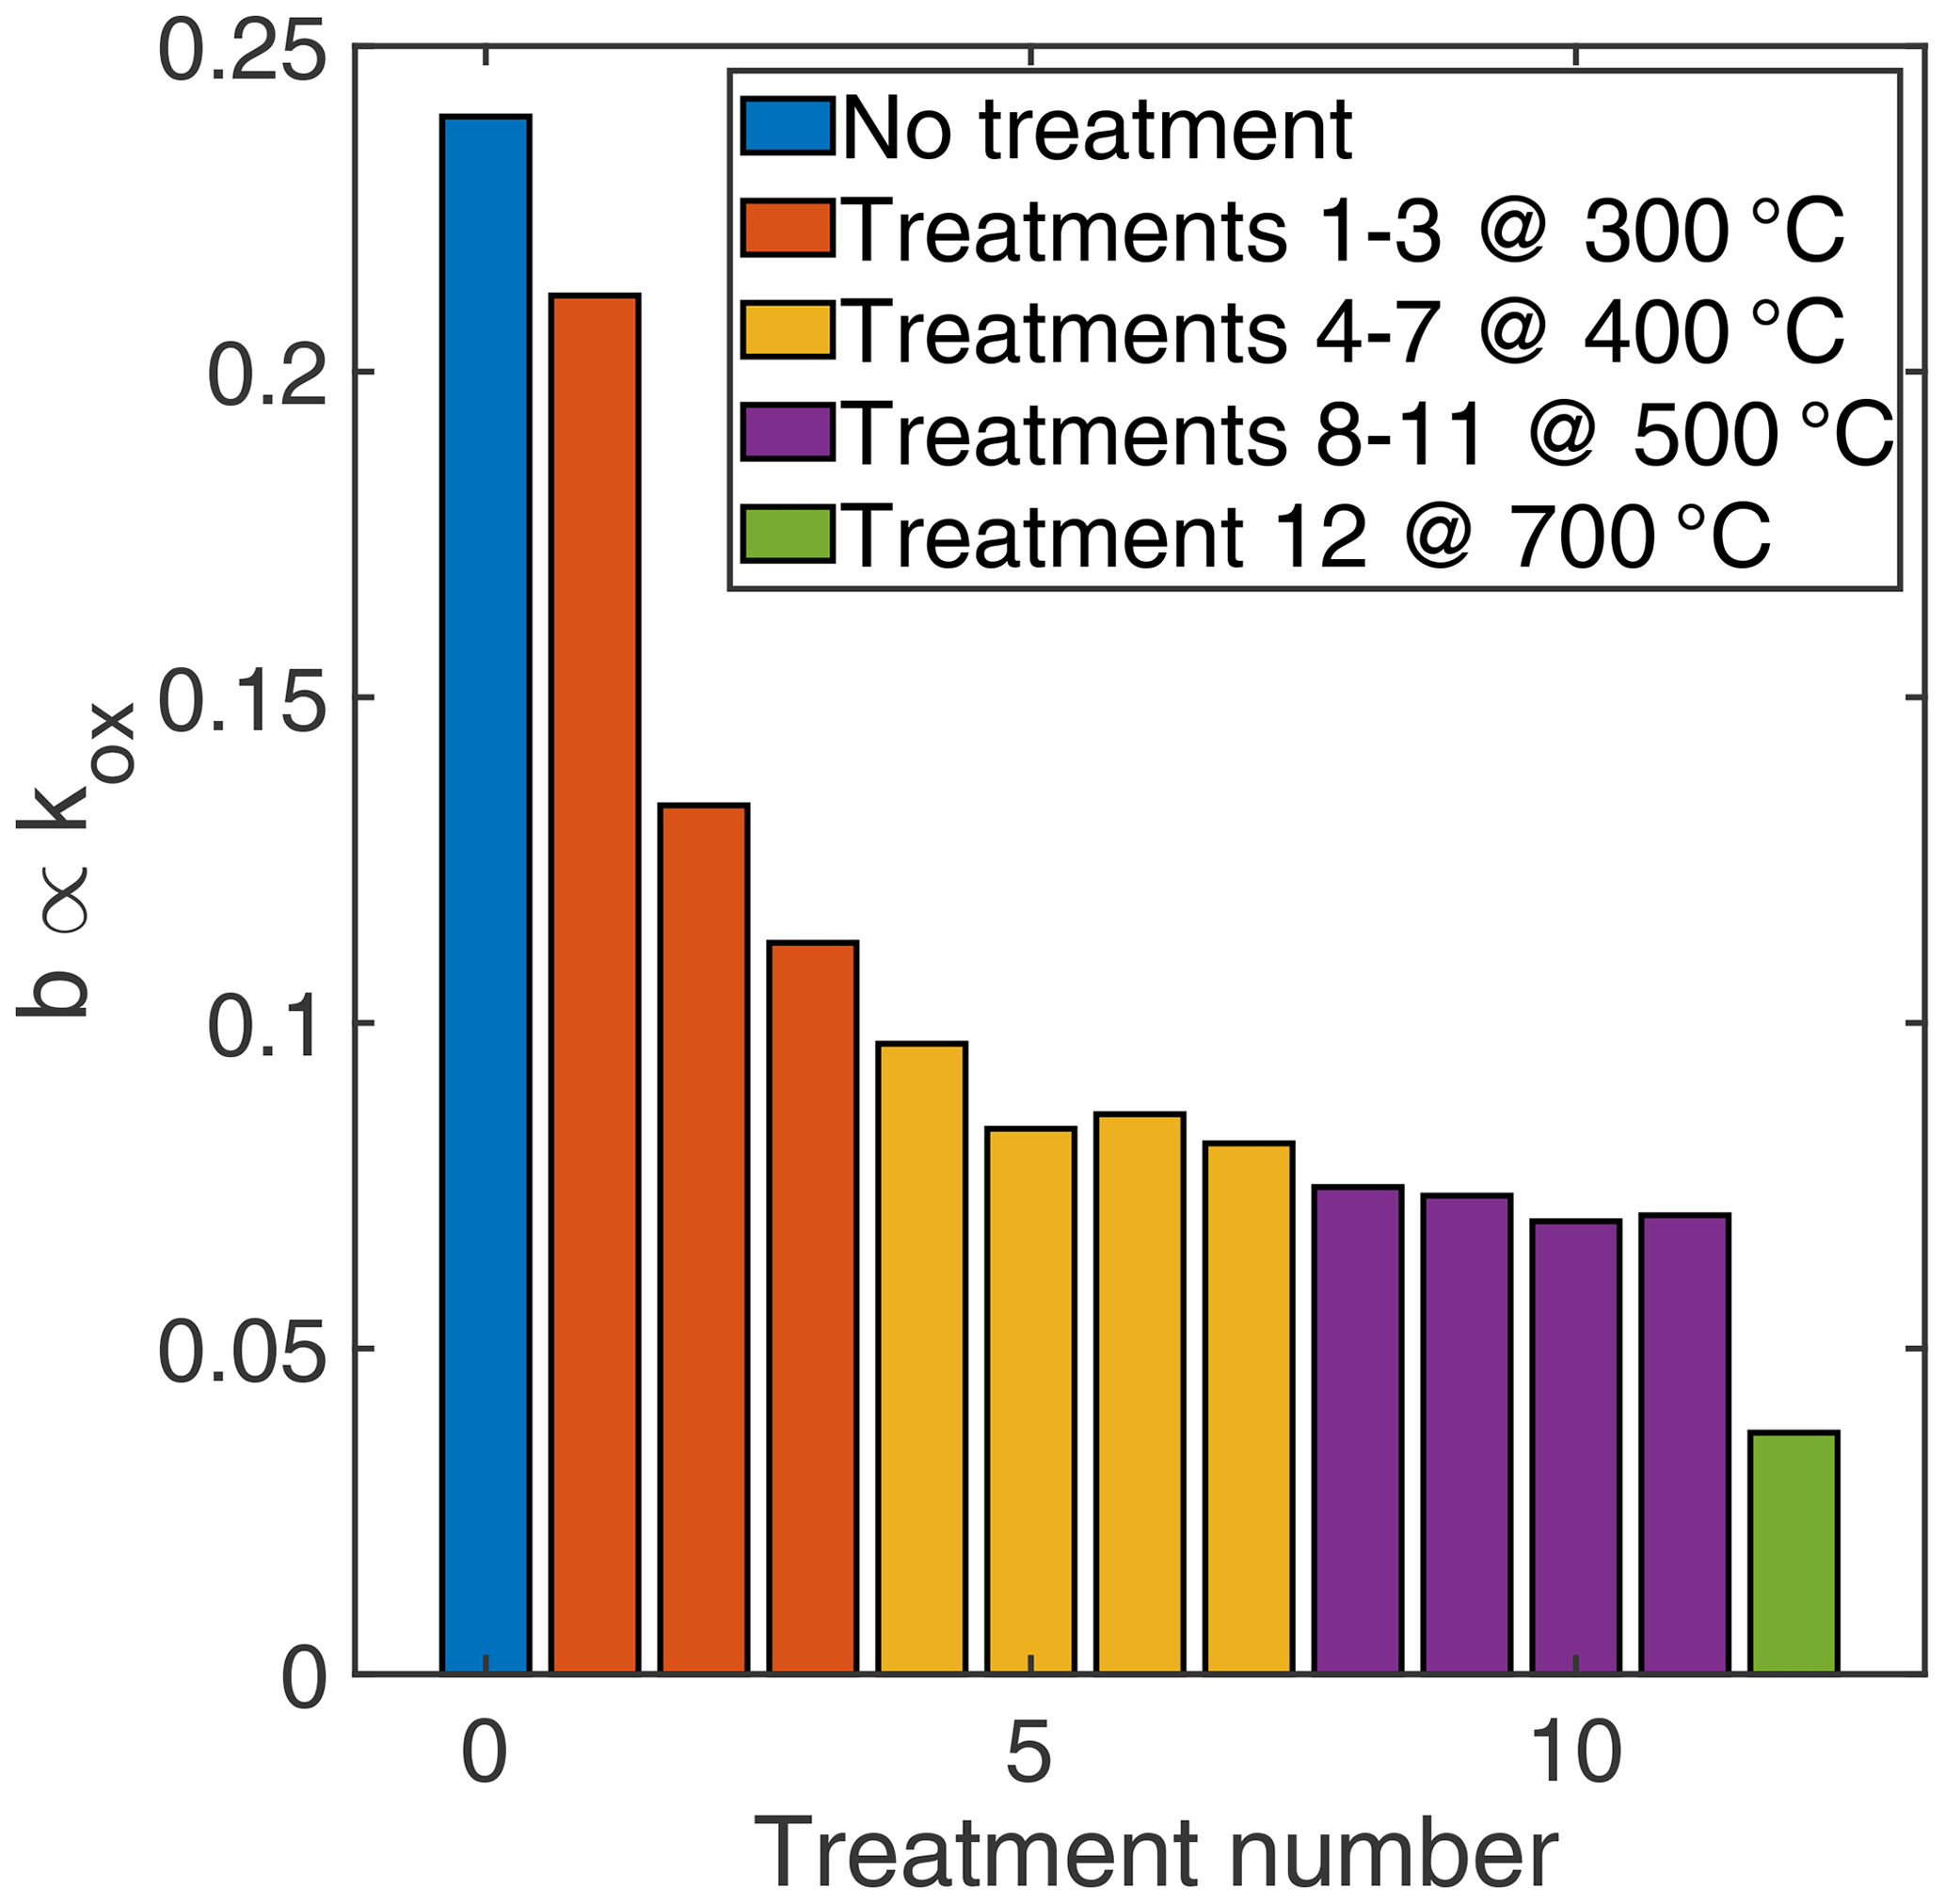
Figure 4The surface charge generation rate evaluated through an exponential fit during the first high-temperature phase over the treatment process.
3.2 Selectivity
The DSR signal at different TCO temperatures can be used for identification of gases, and pattern recognition is often applied for this purpose (Bastuck et al., 2018). Figure 5 shows the DSR patterns, i.e. the DSR signals over the various temperature steps in the cycle, of the three measured gases before HMDSO treatment and after the first treatment step (3 h at 300 ∘C). While initially especially the two highest TCO temperatures (300 and 350 ∘C) help to discriminate hydrogen from the other two gases, acetone and carbon monoxide can be discriminated at the lowest temperature, where only carbon monoxide shows any significant signal at all. After this first treatment (dotted lines), these DSR patterns have changed. While carbon monoxide is still the only gas showing a significant response at the lowest temperature, acetone and hydrogen now show nearly parallel patterns, making it very hard to discriminate both gases with pattern recognition techniques.
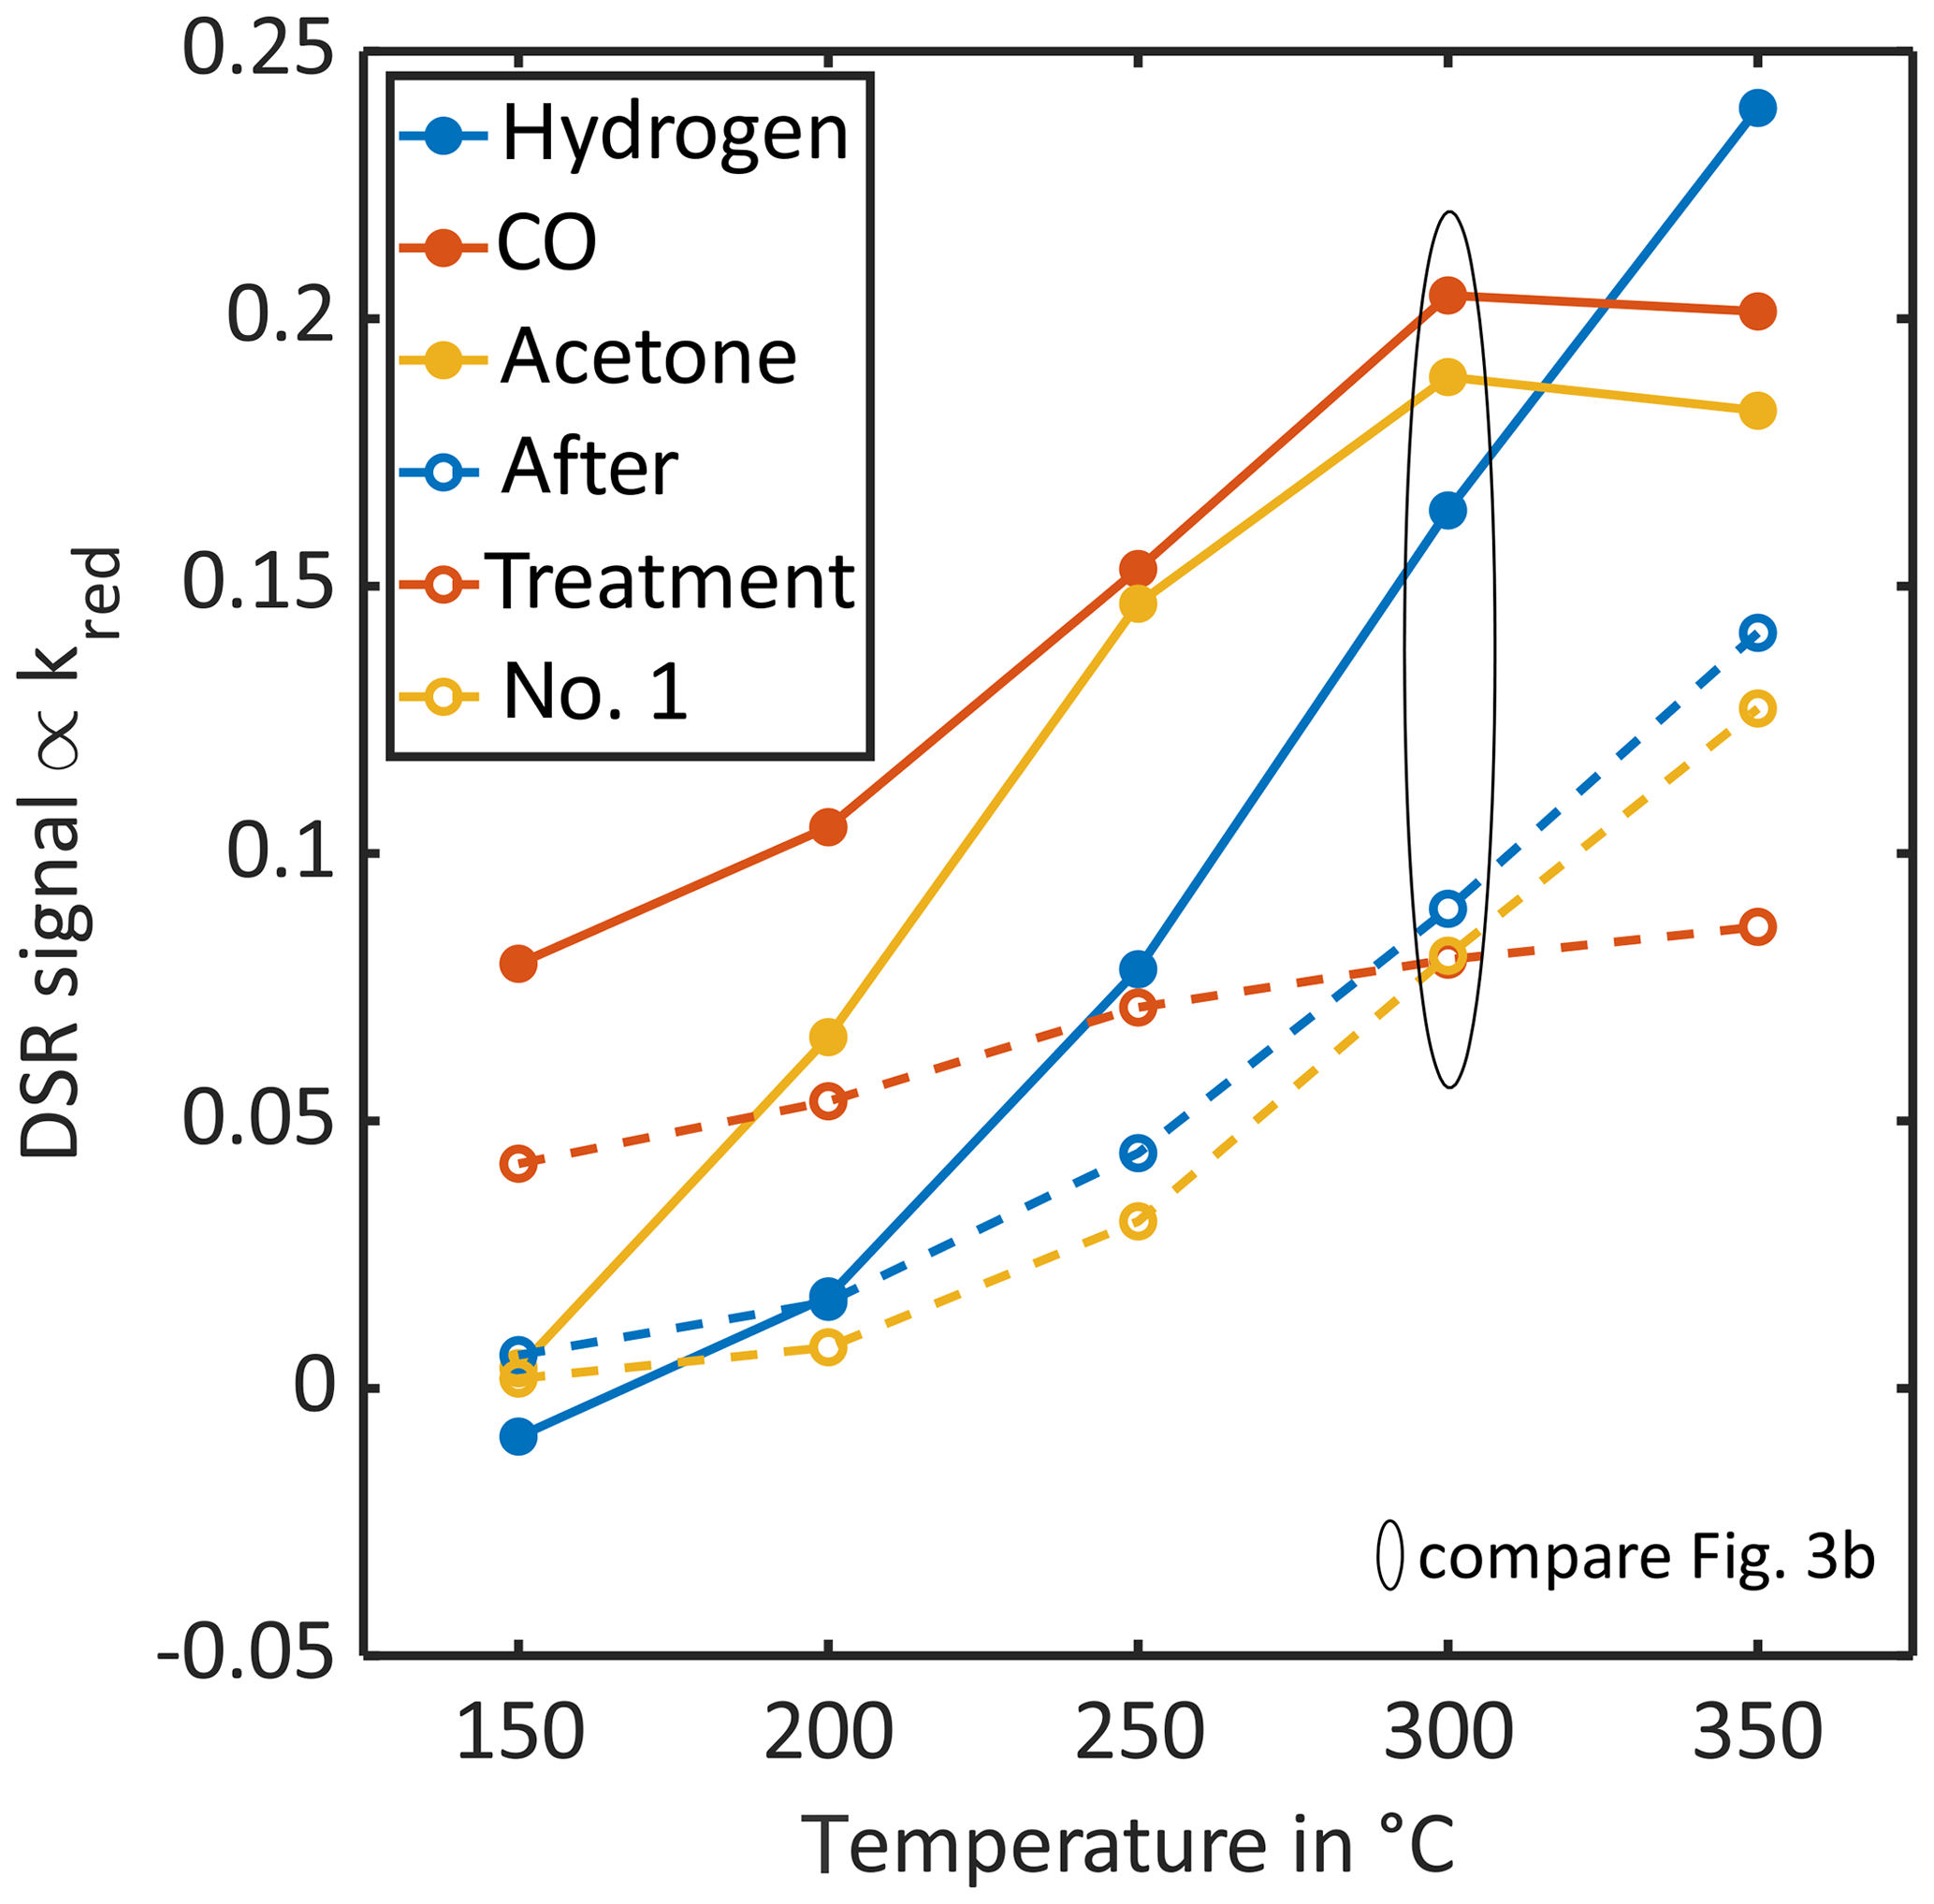
Figure 5The DSR signal pattern over temperature for the three measured gases (blue: hydrogen, red: carbon monoxide, yellow: acetone) before any treatment (solid lines, filled circles) and after the 1st treatment step (3 h at 300 ∘C and 11 ppm HMDSO, dashed lines, open circles).
Nevertheless, siloxane treatment can be used to enhance the selectivity of a MOS sensor for hydrogen compared to other gases. In Fig. 6 the selectivity parameter, i.e. the sensor conductance or DSR signal to hydrogen divided by the sensor conductance or DSR signal to acetone or carbon monoxide, is given for the treatment process. Here, we chose the TCO temperatures yielding the highest selectivity values, i.e. 450 ∘C for quasistatic evaluation and 300 ∘C for DSR evaluation. The blue lines representing the quasistatic evaluation demonstrate a considerable increase in the selectivity factor with increasing HMDSO dose. For the DSR evaluation (red lines), a maximum can be observed which is reached for acetone (triangles) already after 3 treatments and for carbon monoxide (circles) around the 9th to 10th treatments (we assume the very high value after 8 treatments to be an outlier). This maximum results from the fact that the sensitivity to interfering gases reaches a value close to zero quite quickly, while the sensitivity to hydrogen as target gas is only slowly reduced over the treatment process and seems to level off after HMDSO treatments at a treatment temperature of 500 ∘C as shown in Fig. 3. The final treatment at 700 ∘C reduces the selectivity again due to the strongly reduced response to hydrogen.
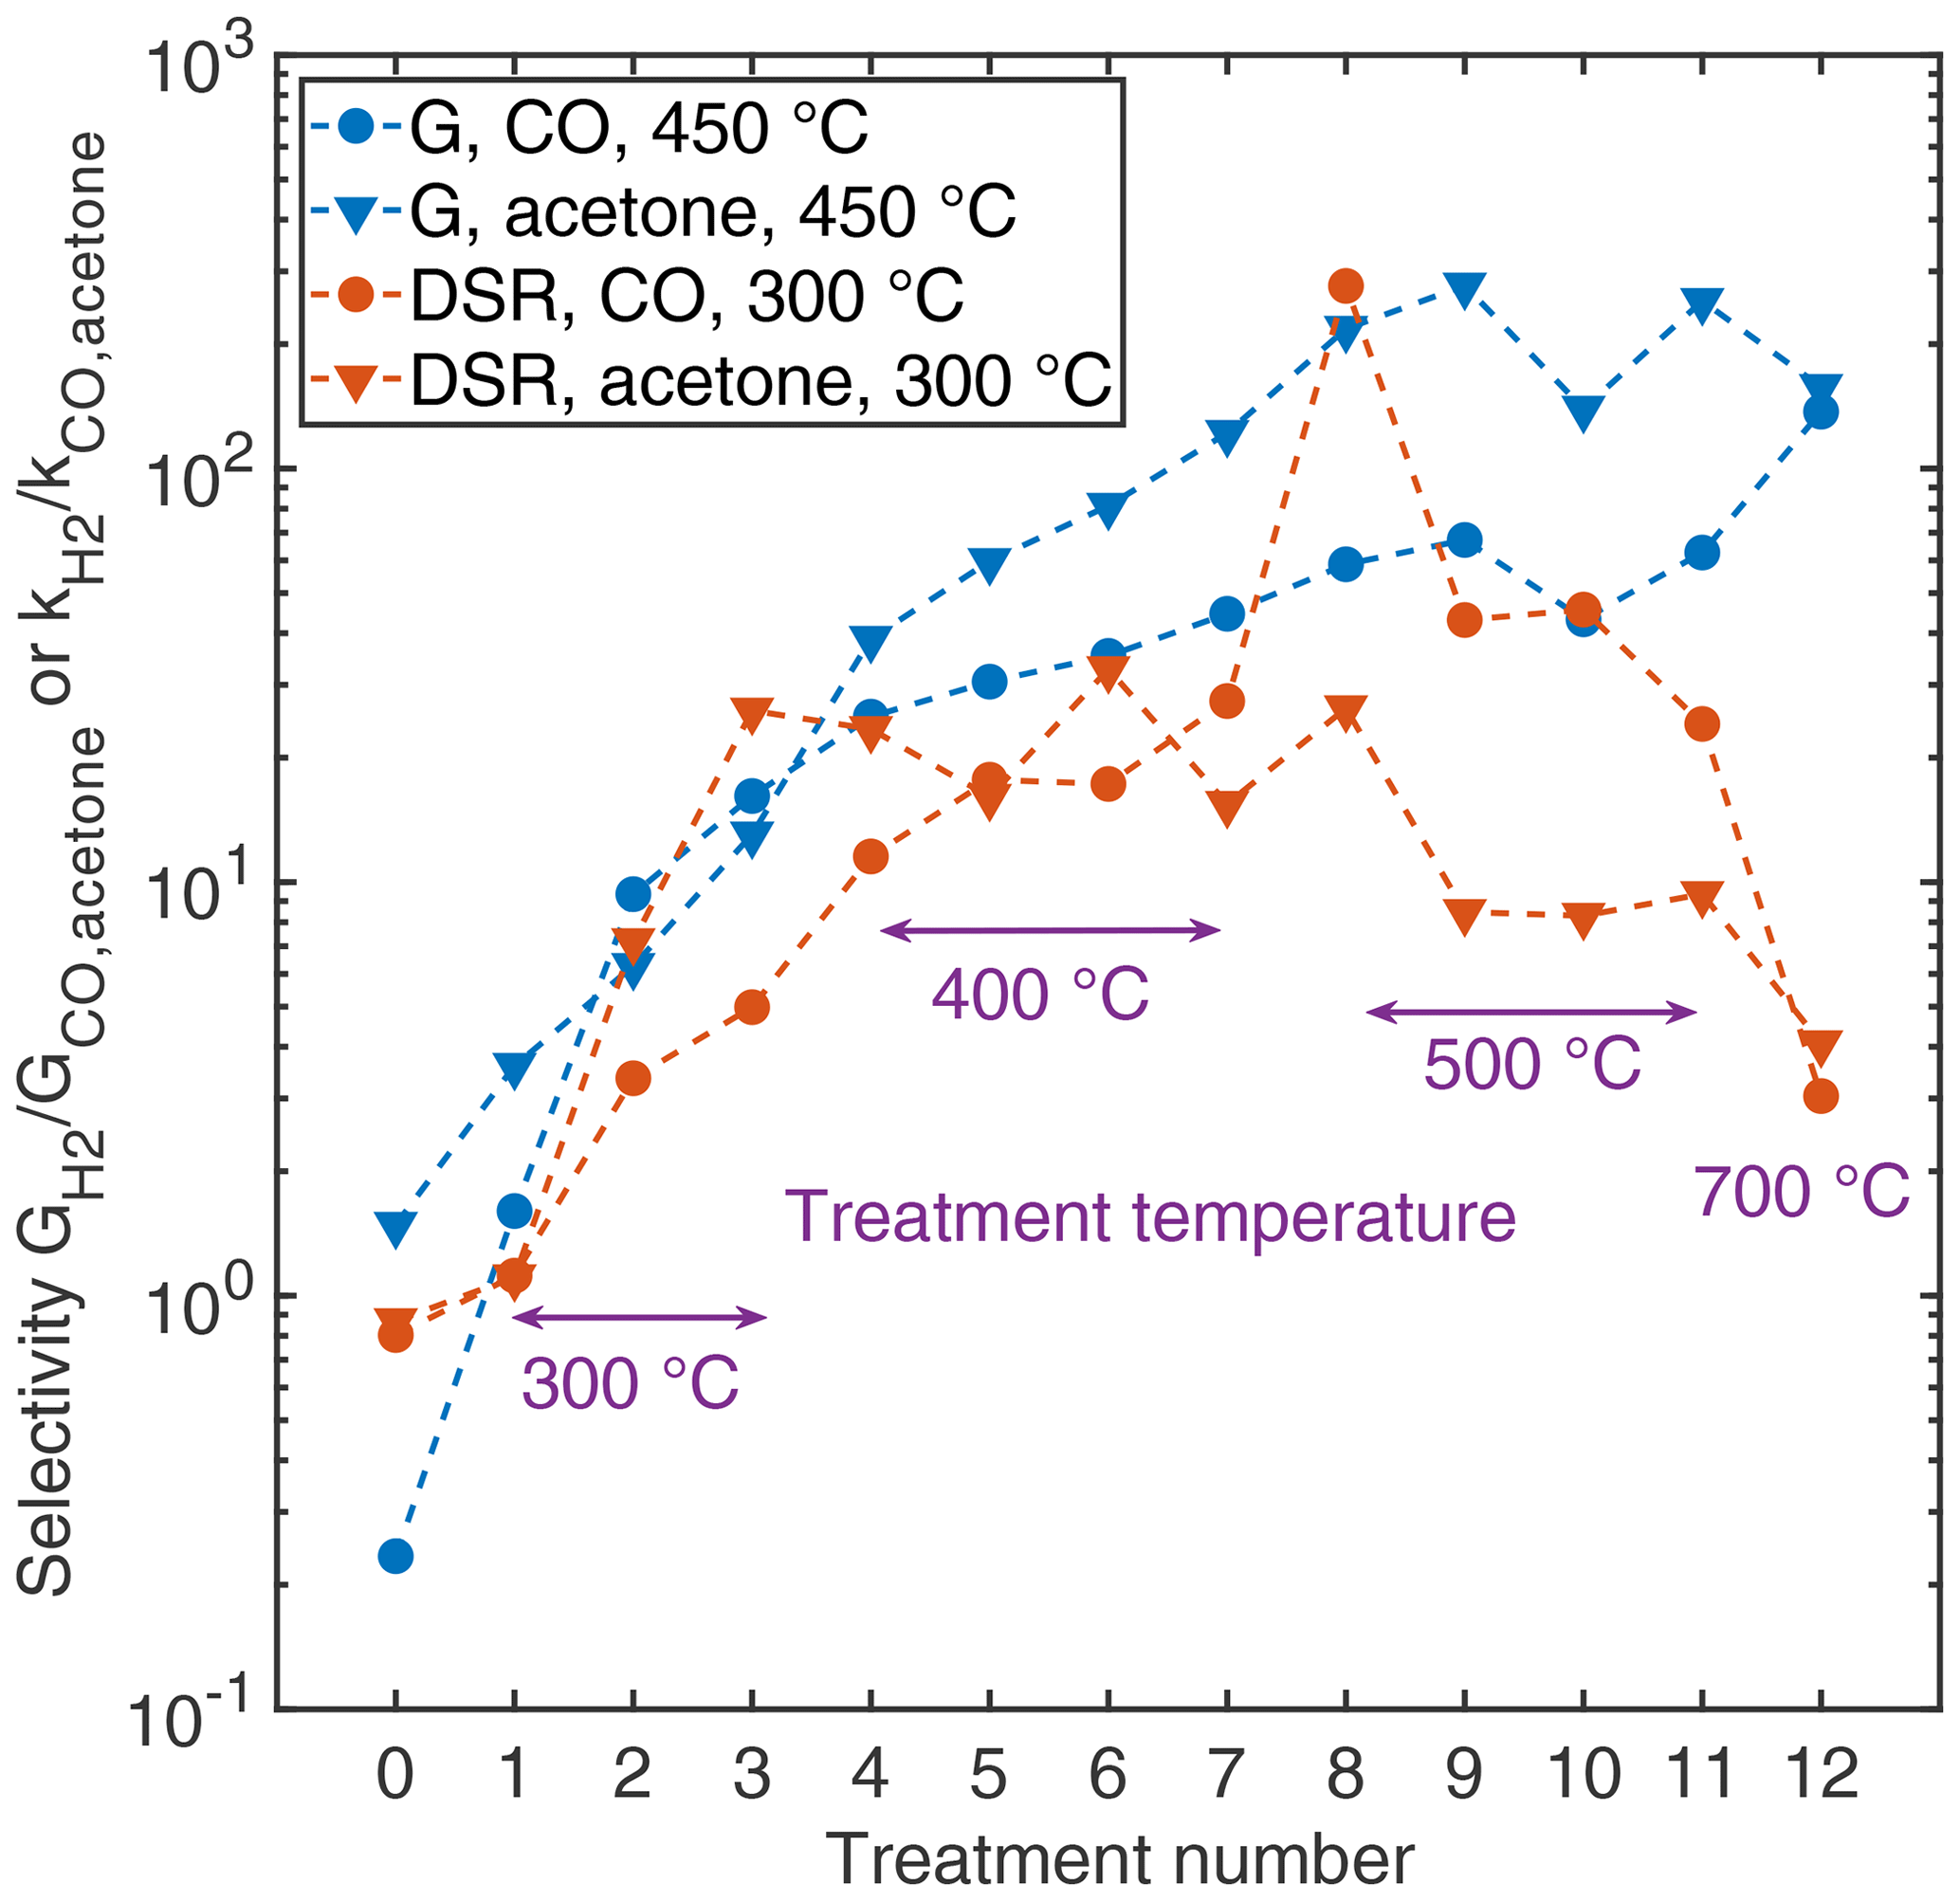
Figure 6The selectivity factor for hydrogen against acetone (triangles) and carbon monoxide (circles) in quasistatic evaluation (blue) and DSR evaluation (red) over the treatment process.
The central finding of the reported measurements is that only one basic effect of siloxane treatment on SnO2 gas sensors is sufficient to explain the somewhat confusing change in the sensitivity with increasing HMDSO dose: the reduction of the reaction rate of every surface process on the sensor. Since this also includes the generation of surface charge, the initial increase in sensitivities, reported in several previous studies and confirmed by the quasistatic evaluations in this work, can be explained as well as the subsequent strong decrease by the competition between surface charge increase by oxygen adsorption and reduction due to reducing gases. This decrease, however, varies significantly for different types of gases, which may be due to different activation energies for their reactions or due to different surface sites that are deactivated with unequal velocity. The hypothesis that hydrogen's reaction is not affected or even enhanced by poisoning (Kelleter, 1997; Hyodo et al., 2000; Tournier and Pijolat, 2005; Meng et al., 2019) has been proven wrong by our results as the DSR reaction rate reduces strongly for hydrogen after a high HMDSO dose. Nevertheless, the quasistatic sensor response rises at the same time, because the generation of negatively charged surface species is affected more by the siloxane poisoning and, thus, the equilibrium is shifted towards lower surface charge coverage.
For the dynamic operation of MOS gas sensors the presented results have serious impact. When the operation mode is mainly based on dynamic surface reactions a decrease in the reaction rates, i.e. the evaluated DSR signal, in the range of 40 % (hydrogen) to 60 % (for acetone and carbon monoxide) after only 3 h at 11 ppm of HMDSO is sufficient to prevent stable long-term operation. Taking the total siloxane concentration that is not exceeded in 90 % of investigated homes in the study by Hofmann and Plieninger (2008) (percentile P90 corresponding to 58.7 µg m−3, i.e. 8.1 ppb HMDSO or 3.87 ppb decamethylcyclopentasiloxane, which was found most), this first treatment step in our study represents a dose corresponding to 0.5–1 year of operation in an indoor environment, which might be justifiable for a low-cost sensor. Treatment step 2 corresponding to 1.5–3 years of operation under the same assumption already results in a loss in sensitivity of 70 % for hydrogen and 95 % for acetone and carbon monoxide respectively.
Nevertheless, more effort in compensation and detection of siloxane poisoning is needed to ensure proper dynamic operation in real-world environments and to maintain the sensor signal even in the deteriorated “poisoned” state. Understanding the basic effect of reduced reaction rates is a good starting point to improve sensor system performance. Specifically, we can make use of the fact that the surface charge generation is also decreasing for increased HMDSO dosage (Fig. 4). Since the concentration of oxygen can be assumed to be constant in ambient air, this value can be considered for compensation. For this purpose, the calibration curve, i.e. response vs. concentration, for the desired gas needs to be known for different stages of siloxane exposure so that the correct model can be applied for quantification. From the data presented here, we can see that the reaction rates of hydrogen and oxygen are proportional (see Fig. 7) for all HMDSO dosages. Only the original sensor before HMDSO exposure deviates from this linear curve. Therefore, before applying the proposed compensation procedure it is necessary to expose the sensor to low siloxane dosages. In any case, it is possible to use the surface charge generation rate, determined from the relaxation time constant during the high-temperature phase, to quantify the sensor deterioration by HMDSO. This information can be used to indicate the need for sensor replacement, which is highly relevant, especially in safety applications.

Figure 7The evaluated DSR signal to hydrogen over the corresponding surface charge generation rate found at each treatment steps yields a linear curve neglecting the very first data point in the untreated state.
Looking at the desired effect of high selectivity for hydrogen sensing, two cases can be distinguished. In the traditional steady-state operation (one constant temperature) our results indicate that a strong siloxane treatment yields the highest selectivity. This approach, i.e. treatment of the sensors via chemical vapour deposition to form bulky siloxane layers on top of the sensitive layer, was previously reported (Katsuki and Fukui, 1998; Tournier and Pijolat, 2005; Meng et al., 2019). One drawback might be an increase in the response time due to slow diffusion through this cover layer, which was not evaluated in this study. For the dynamic operation and DSR mode a compromise between very low reaction rates for other gases (here: acetone and carbon monoxide) and a still significant DSR signal for hydrogen should be found (compare Fig. 3b and especially Fig. 6). Since the DSR signals for acetone and carbon monoxide already approach zero after treatment 2 a HMDSO treatment of approximately 100 ppm h resulting in a selectivity factor of more than 10 should be sufficient for most applications, although the selectivity factor increases slightly further for higher treatment steps (Fig. 6). Depending on the required level of selectivity and sensitivity, i.e. expected concentrations of hydrogen and interferent gases on the one hand and the expected sensor lifetime on the other hand, the optimal treatment dose can be determined to fit the application environment.
This study presents the first systematic investigation of the influence of siloxane treatment on the dynamic properties of MOS sensors in temperature-cycled operation, especially concerning the DSR method, yielding a better understanding of the sensor properties. In contrast to previous studies we could prove a loss in reactivity on the sensor surface for all gases, not only typical reducing gases, but also hydrogen and oxygen. In equilibrium, i.e. steady-state operation, this can lead to the previously observed increase in sensitivity. For the DSR method, which focuses on the surface reaction rates, this leads to decreasing sensitivities for all siloxane doses, which can be considered sensor poisoning depending on the application. This is very challenging for dynamic sensor operation because of the strong impact for applications requiring sensitive VOC detection but is also promising in terms of compensation and sensor self-monitoring: the surface charge generation rate is a potential candidate for determining the sensor deterioration state and also for compensating the loss of sensitivity. While an enhanced selectivity to hydrogen was also observed for the DSR method, this needs careful tuning of the treatment process in order to find the optimum sensor properties.
Further studies are needed to improve the understanding of the poisoning process for different gases. Comparing these results to catalysis science might help to identify and better understand the underlying reaction mechanisms. In order to achieve stable gas quantification with a MOS sensor in this operation mode, more studies on dependence of the surface charge generation rate on the poisoning state, its independence of the gas type and concentration as well as its relation to the reaction rates of different gases are needed, also under more realistic ambient conditions.
Data sets are available at https://doi.org/10.5281/zenodo.3999438 (Schultealbert et al., 2020).
The supplement related to this article is available online at: https://doi.org/10.5194/jsss-9-283-2020-supplement.
CS took part in the conceptualization and formal analysis of the work and performed the visualization and major part of writing the original draft. IU performed the experimental investigation and data curation and took part in formal analysis and writing the original draft. TB took part in the conceptualization and reviewed the manuscript. TS contributed in terms of project administration and conceptualization as well as review and editing of the manuscript. AS supervised the work and reviewed and edited the manuscript.
The authors declare that they have no conflict of interest.
This article is part of the special issue “Dresden Sensor Symposium DSS 2019”. It is a result of the “14. Dresdner Sensor-Symposium”, Dresden, Germany, 2–4 December 2019.
We acknowledge support by the Deutsche Forschungsgemeinschaft (DFG, German Research Foundation) and Saarland University within the Open Access Publishing funding programme.
This paper was edited by Holger Fritze and reviewed by two anonymous referees.
Barsan, N. and Weimar, U.: Conduction model of metal oxide gas sensors, J. Electroceram., 7, 143–167, https://doi.org/10.1023/A:1014405811371, 2001.
Bastuck, M., Baur, T., and Schütze, A.: DAV3E – a MATLAB toolbox for multivariate sensor data evaluation, J. Sensors Sens. Syst., 7, 489–506, https://doi.org/10.5194/jsss-7-489-2018, 2018.
Baur, T., Schütze, A., and Sauerwald, T.: Optimierung des temperaturzyklischen Betriebs von Halbleitergassensoren, tm – Tech. Mess., 82, 187–195, https://doi.org/10.1515/teme-2014-0007, 2015.
Baur, T., Schultealbert, C., Schütze, A., and Sauerwald, T.: Novel method for the detection of short trace gas pulses with metal oxide semiconductor gas sensors, J. Sensors Sens. Syst., 7, 411–419, https://doi.org/10.5194/jsss-7-411-2018, 2018.
Dudzina, T., von Goetz, N., Bogdal, C., Biesterbos, J. W. H., and Hungerbühler, K.: Concentrations of cyclic volatile methylsiloxanes in European cosmetics and personal care products: Prerequisite for human and environmental exposure assessment, Environ. Int., 62, 86–94, https://doi.org/10.1016/j.envint.2013.10.002, 2014.
Elsayed, N. H., Elwell, A., Joseph, B., and Kuhn, J. N.: Effect of silicon poisoning on catalytic dry reforming of simulated biogas, Appl. Catal. A Gen., 538, 157–164, https://doi.org/10.1016/j.apcata.2017.03.024, 2017.
Gaj, K. and Pakuluk, A.: Volatile Methyl Siloxanes as Potential Hazardous Air Pollutants, Polish J. Environ. Stud., 24, 937–943, https://doi.org/10.15244/pjoes/34668, 2015.
Gurlo, A.: Interplay between O2 and SnO2: Oxygen Ionosorption and Spectroscopic Evidence for Adsorbed Oxygen, Chem. Phys. Chem., 7, 2041–2052, https://doi.org/10.1002/cphc.200600292, 2006.
Helwig, N., Schüler, M., Bur, C., Schütze, A., and Sauerwald, T.: Gas mixing apparatus for automated gas sensor characterization, Meas. Sci. Technol., 25, 055903, https://doi.org/10.1088/0957-0233/25/5/055903, 2014.
Hofmann, H. and Plieninger, P.: Bereitstellung einer Datenbank zum Vorkommen von flüchtigen organischen Verbindungen in der Raumluft, WaBoLu-Hefte 05, Umweltbundesamt, Dessau-Roßlau, 2008.
Horii, Y. and Kannan, K.: Survey of Organosilicone Compounds, Including Cyclic and Linear Siloxanes, in Personal-Care and Household Products, Arch. Environ. Contam. Toxicol., 55, 701–710, https://doi.org/10.1007/s00244-008-9172-z, 2008.
Hyodo, T., Baba, Y., Wada, K., Shimizu, Y., and Egashira, M.: Hydrogen sensing properties of SnO2 varistors loaded with SiO2 by surface chemical modification with diethoxydimethylsilane, Sensor. Actuat. B, 64, 175–181, https://doi.org/10.1016/S0925-4005(99)00503-1, 2000.
Katsuki, A. and Fukui, K.: H2 selective gas sensor based on SnO2, Sensor. Actuat. B, 52, 30–37, https://doi.org/10.1016/S0925-4005(98)00252-4, 1998.
Kelleter, J.: Künstliche Nase für gasförmige Emissionen aus unvollständiger Verbrennung: Aufbau und Erprobung eines Multi-Gassensor-Systems, PhD thesis, JLU Gießen, Shaker-Verlag, Aachen, 1997.
Korotcenkov, G. and Cho, B. K.: Instability of metal oxide-based conductometric gas sensors and approaches to stability improvement (short survey), Sensor. Actuat. B, 156, 527–538, https://doi.org/10.1016/j.snb.2011.02.024, 2011.
Leidinger, M., Schultealbert, C., Neu, J., Schütze, A., and Sauerwald, T.: Characterization and calibration of gas sensor systems at ppb level – a versatile test gas generation system, Meas. Sci. Technol., 29, 015901, https://doi.org/10.1088/1361-6501/aa91da, 2018.
Madou, M. J. and Morrison, S. R.: Chemical Sensing with Solid State Devices, Academic Press, San Diego, 1989.
Meng, X., Zhang, Q., Zhang, S., and He, Z.: The Enhanced H2 Selectivity of SnO2 Gas Sensors with the Deposited SiO2 Filters on Surface of the Sensors, Sensors, 19, 2478, https://doi.org/10.3390/s19112478, 2019.
Moorlag, C., Breton, M., Sacripante, G., and Zhou, K.: Aqueous dispersible siloxane-containing polymer inks useful for printing, Patent No. 9,359,512 B2, 7 June 2016.
Palmisano, V., Weidner, E., Boon-Brett, L., Bonato, C., Harskamp, F., Moretto, P., Post, M. B., Burgess, R., Rivkin, C., and Buttner, W. J.: Selectivity and resistance to poisons of commercial hydrogen sensors, Int. J. Hydrogen Energ., 40, 11740–11747, https://doi.org/10.1016/j.ijhydene.2015.02.120, 2015.
Robbart, E.: US Patent 4,551,385: Method for Printing Cellulosic Substrates Using Modified Reactive Siloxanes to Form an Oleophilic Layer thereon and Impregnating thereafter with an Ink, 1985.
Rücker, C. and Kümmerer, K.: Environmental Chemistry of Organosiloxanes, Chem. Rev., 115, 466–524, https://doi.org/10.1021/cr500319v, 2015.
Schüler, M.: Methoden zur Funktionsüberwachung von Gassensoren mit Hilfe multimodaler Signale, PhD thesis, Saarland University, Shaker Verlag, Aachen, 2016.
Schüler, M., Sauerwald, T., and Schütze, A.: A novel approach for detecting HMDSO poisoning of metal oxide gas sensors and improving their stability by temperature cycled operation, J. Sensors Sens. Syst., 4, 305–311, https://doi.org/10.5194/jsss-4-305-2015, 2015.
Schultealbert, C., Baur, T., Schütze, A., Böttcher, S., and Sauerwald, T.: A novel approach towards calibrated measurement of trace gases using metal oxide semiconductor sensors, Sensor. Actuat. B, 239, 390–396, https://doi.org/10.1016/j.snb.2016.08.002, 2017.
Schultealbert, C., Baur, T., Schütze, A., and Sauerwald, T.: Facile Quantification and Identification Techniques for Reducing Gases over a Wide Concentration Range Using a MOS Sensor in Temperature-Cycled Operation, Sensors, 18, 744, https://doi.org/10.3390/s18030744, 2018.
Schultealbert, C., Uzun, I., and Baur, T.: HMDSO Poisoning of UST1530 MOS Sensor, https://doi.org/10.5281/zenodo.3999438, Zenodo, 2020.
Sharpe, R. B. A., Burdinski, D., van der Marel, C., Jansen, J. A. J., Huskens, J., Zandvliet, H. J. W., Reinhoudt, D. N., and Poelsema, B.: Ink Dependence of Poly(dimethylsiloxane) Contamination in Microcontact Printing, Langmuir, 22, 5945–5951, https://doi.org/10.1021/la053298l, 2006.
Smith, T. W.: US Patent 6,750,269 B2: Ink Jet Printing with Inks Containing Cyclic Siloxanes, 2004.
Snyder, D. L. B.: US Patent 3,229,112: Siloxane Wetting Agents, 1967.
Tang, X., Misztal, P. K., Nazaroff, W. W., and Goldstein, A. H.: Siloxanes Are the Most Abundant Volatile Organic Compound Emitted from Engineering Students in a Classroom, Environ. Sci. Technol. Lett., 2, 303–307, https://doi.org/10.1021/acs.estlett.5b00256, 2015.
Tournier, G. and Pijolat, C.: Selective filter for SnO-based gas sensor: application to hydrogen trace detection, Sensor. Actuat. B, 106, 553–562, https://doi.org/10.1016/j.snb.2004.06.037, 2005.
Umweltbundesamt: Richtwerte für zyklische Dimethylsiloxane in der Innenraumluft, Bundesgesundheitsblatt – Gesundheitsforsch. – Gesundheitsschutz, 54, 388–400, https://doi.org/10.1007/s00103-010-1218-5, 2011.
Williams, D. E. and Pratt, K. F. E.: Classification of reactive sites on the surface of polycrystalline tin dioxide, J. Chem. Soc. Faraday Trans., 94, 3493–3500, https://doi.org/10.1039/a807644h, 1998.