the Creative Commons Attribution 4.0 License.
the Creative Commons Attribution 4.0 License.
 | 08 Aug 2018
Development and characterisation of a new fluorescence sensor for online monitoring of bioprocesses
Jan C. König
Tobias Steinwedel
Dörte Solle
Patrick Lindner
Ingo de Vries
Thorleif Hentrop
Michael Findeis
Gernot T. John
Thomas Scheper
Sascha Beutel
Fluorescence spectroscopy is a highly sensitive and non-invasive technique for the identification of characteristic process states and for the online monitoring of substrate and product concentrations. Nevertheless, fluorescence sensors are mainly used in academic studies and are not well implemented for monitoring of industrial production processes. In this work, we present a newly developed robust online fluorescence sensor that facilitates the analysis of fluorescence measurements. The set-up of the sensor was miniaturised and realised without any moveable part to be robust enough for application in technical environments. It was constructed to measure only the three most important biologic fluorophores (tryptophan, NADH and FAD/FMN), resulting in a significant data reduction compared to conventional a 2-D fluorescence spectrometer. The sensor performance was evaluated by calibration curves and selectivity tests. The measuring ranges were determined as 0.5–50 µmol L−1 for NADH and 0.0025–7.5 µmol L−1 for BSA and riboflavin. Online monitoring of batch cultivations of wild-type Escherichia coli K1 in a 10 L bioreactor scale were performed. The data sets were analysed using principal component analysis and partial least square regression. The recorded fluorescence data were successfully used to predict the biomass of an independent cultivation (RMSEP 4.6 %).
- Article
(1585 KB) - Full-text XML
-
Supplement
(287 KB) - BibTeX
- EndNote


To meet the high regulatory and quality requirements of the Food and Drug Administration (FDA) for the production of pharmaceuticals, pharmaceutical and biotechnological companies are encouraged to implement innovative tools to better understand their processes and to ensure batch-to-batch reproducibility. Therefore real-time online measurements of bioprocesses are becoming increasingly important (Marose, 1999; Faassen and Hitzmann, 2015; Claßen et al., 2017; Stärk et al., 2002).
Due to the complexity of biological processes, online measurement of important process variables such as substrate and product concentration without any time delay is a challenge. Therefore, vibrational spectroscopy which covers infrared and Raman spectroscopy is often applied for process monitoring (Clavaud et al., 2013; Roggo et al., 2007; Oh et al., 2013; Claßen et al., 2017; Landgrebe et al., 2010). However, compared to fluorescence spectroscopy both methods are less sensitive. Fluorescence spectroscopy has been used for 30 years as a highly sensitive and non-invasive technique for online monitoring of bioprocesses (Harrison and Chance, 1970). Historically, the first fluorescence probes were based on a single fixed wavelength combination to detect the fluorescence of one biogenic fluorophore, such as aromatic amino acids or co-enzymes (Harrison and Chance, 1970; Scheper et al., 1987). Today, modern 2-D-fluorescence sensors are able to sequentially screen a large number of excitation and emission wavelengths and to detect multiple fluorophores simultaneously. Here, the wavelength selection is usually accomplished by monochromators based on grating technology (Surribas et al., 2006; Gahlawat and Srivastava, 2013). In a few other sensors the selection is based on filter systems, e.g. the Bioview® (Delta Light & Optics), which contains two individually controlled filter wheels with 16 slots on the excitation as well as emission side (Boehl et al., 2003; Assawajaruwan et al., 2017a; Lindemann et al., 1999). However, the resulting data set is large and only a few wavelength combinations include relevant information. Therefore chemometric methods such as principle component analysis (PCA), partial least squares (PLS) regression or neural networks (NNs) are necessary for data reduction and analysis (Faassen and Hitzmann, 2015; Assawajaruwan et al., 2017b; Won and Yoon-Keun, 2006). These allow us to identify characteristic process states and to predict a lot of different important process variables, e.g. biomass (Hisiger and Jolicoeur, 2005; Surribas et al., 2006; Eliasson Lantz et al., 2006; Assawajaruwan et al., 2017b; Jain et al., 2011).
Although fluorescence spectroscopy represents a very sensitive method, fluorescence sensors are mainly used in academic environments and rarely in industrial processes. In this work, we present a newly developed functional model of an online fluorescence sensor. To facilitate the application in technical environments, it was constructed robustly without any moveable parts. Furthermore, the set-up of the sensor was reduced to detect only specific wavelength combinations of important biogenic fluorophores (tryptophan, NADH and FAD/FMN) associated with several microbial metabolisms (Assawajaruwan et al., 2017a; Gahlawat and Srivastava, 2013; Claßen et al., 2017). The furthermore miniaturised set-up of the sensor results in a significant data reduction and in lower costs for sensor components compared to commercially available 2-D sensors. In this study, calibration curves and mixtures of relevant biogenic fluorophores are measured with the developed sensor to proof the measurement range and selectivity. Furthermore, batch cultivations of E. coli K1 wild type were monitored, and resulting data were used for the estimation of biomass.
2.1 Fluorescence sensor
The functional model of the presented sensor is based on monochromatic high-power light emission diodes (LEDs) and photodiodes combined with specific bandpass filters (Fig. 1). Additionally, a scattered light (s. l.) measurement was implemented. To improve robustness, the sensor was furthermore constructed without any moveable parts. Thus, a fluorescence probe with eight fibre bundles was designed to ensure an effective channelling of excitation and emission light. For high-quality detection a lock-in amplifier was used to extract signal from noise. While all photodiodes were measuring at the same time, the LEDs were executed in rotation for 1 s (100 ms on, 100 ms off, five cycles).

Figure 1Experimental set-up of the sensor. Excitation: 1a: 278 nm LED (Laser Components GmbH, Munich) and 365, 450 and 850 nm LED (Roithner Lasertechnik GmbH, Vienna), 1b: photodiodes for each LED as reference and 1c: bandpass filter with a central wavelength (CWL) of 365 or 450 nm (Edmund Optics GmbH, Karlsruhe; FWHM 10 nm). Light transport: 2a: adapter for the Ingold port, 2b: fibre probe with eight fibre bundles. Detection: 3a: bandpass filters with a CWL of nm (FWHM: nm) or a cover for scattered light; 3b: photodiodes (Advanced Photonix, Inc.).
The probe of the sensor was installed in the bioreactor through an Ingold port using an autoclavable adapter (Fig. S1 in the Supplement). The sapphire optical window of the adapter was constructed at a 45∘ angle to reduce scattered light interference. The adapter has a defined measuring zone of 20 mm, which is constantly flown through by the culture broth. During the cultivations the fluorescence signal was measured in a sample interval of 60 s.
2.2 Calibration curves of BSA, riboflavin and NADH
The functional model was used to observe the linear correlation between the fluorescence intensity and the concentration of biogenic fluorophores. BSA (Sigma-Aldrich, St. Louis, USA), riboflavin (Sigma-Aldrich, St. Louis, USA) and NADH (Carl Roth GmbH & Co. KG) were prepared for various concentrations from to mol L−1. All measurements were performed in triplicates in a PBS buffer (pH 7.5) to provide an estimation of the standard error.
2.3 Selectivity test
After demonstration of specificity, the selectivity of the sensor has to be shown by quantitative detection of the important variables next to each other. Therefore a set of 19 solutions with linear independent concentration levels were generated and measured with the new sensor. These experiments were designed using classical design of experiments, where different levels of the factors were analysed in different linear independent combinations several times.
To build reliable quantitative PLS models, a minimum of five concentration levels have to be considered. For three variables there are 35 combinations of concentrations possible. Out of these 243 combinations 5 combinations are taken randomly where each variable was represented in five different concentration levels. The explained variance of the third principal component of a PCA of that 5×3 matrix has to be as high as possible for linear independent concentration combinations.
A brute force algorithm was used to build up three blocks of such linear independent concentration levels. By this each variable was set on each concentration level 3-fold with different concentrations of the secondary components. These 15 combinations were completed by four centre point experiments with an equal concentration distribution on a mean level for each variable. To determine the overall measurement error these central experiments are distributed over the whole experimental plan separating the linear independent blocks.
All solutions (see Table S1) were prepared independently and measured with an identical set-up and under equal experimental conditions. If reliable PLS models can be built on these spectral data, the sensor is selective and the evaluated variables can be measured quantitatively independently of the concentrations of the other variables.
2.4 Bacterial strain and cultivation conditions
The strain used in this study was an Escherichia coli B2032/82 serotype K1. It is an original clinical wild-type isolate (Rode et al., 2008) and is used for polysialic acid production (Vries et al., 2017). The starter culture was prepared by inoculating a glycerol stock into 100 mL lysogeny broth (LB) medium and subsequently incubating at 37 ∘C, 150 rpm for 7 h. The culture was diluted (1∕1000) in 500 mL of defined medium (pH 7.5), which consists of 0.15 g L−1 MgSO4•7H2O, 1 mg L−1 FeSO4•7H2O, CuSO4•7H2O, 9.3 g L−1 K2HPO4, 2.03 g L−1 KH2PO4, 10 g L−1 (NH4)2SO4, 1.2 g L−1 NaCl, 1.1 g L−1 K2SO4, 13 mg L−1 CaCl2 and 22 g L−1 glucose. The preculture was grown for a further 10 h at 37 ∘C, 150 rpm and was used to inoculate a bioreactor to give an initial OD600 of 0.2 rel. AU. Five cultivations were carried out in a 10 L bioreactor (Biostat C, B. Braun Biotech, Melsungen, Germany) and one cultivation was performed in a 30 L bioreactor (Biostat Cplus, Sartorius AG, Göttingen, Germany). Except for one cultivation anti-foam was added before inoculation to the working volume of 7.5 L or 30 L defined medium. The pH value was maintained at pH 7.5 by adding 25 % (v∕v) NH4OH or 1 M HCl. All cultivations were operated at constant temperature (37 ∘C), stirrer speed (1000 rpm) and an aeration rate of 1 vvm air.
2.5 Offline sampling and cell dry weight determination
The growth of E. coli K1 was determined offline by measuring the cell dry weight (CDW). Every hour samples were withdrawn during the cultivation. After centrifugation (13 000 rpm for 5 min) the supernatant was removed and the biomass was dried for 24 h at 80 ∘C and weighted gravimetrically.
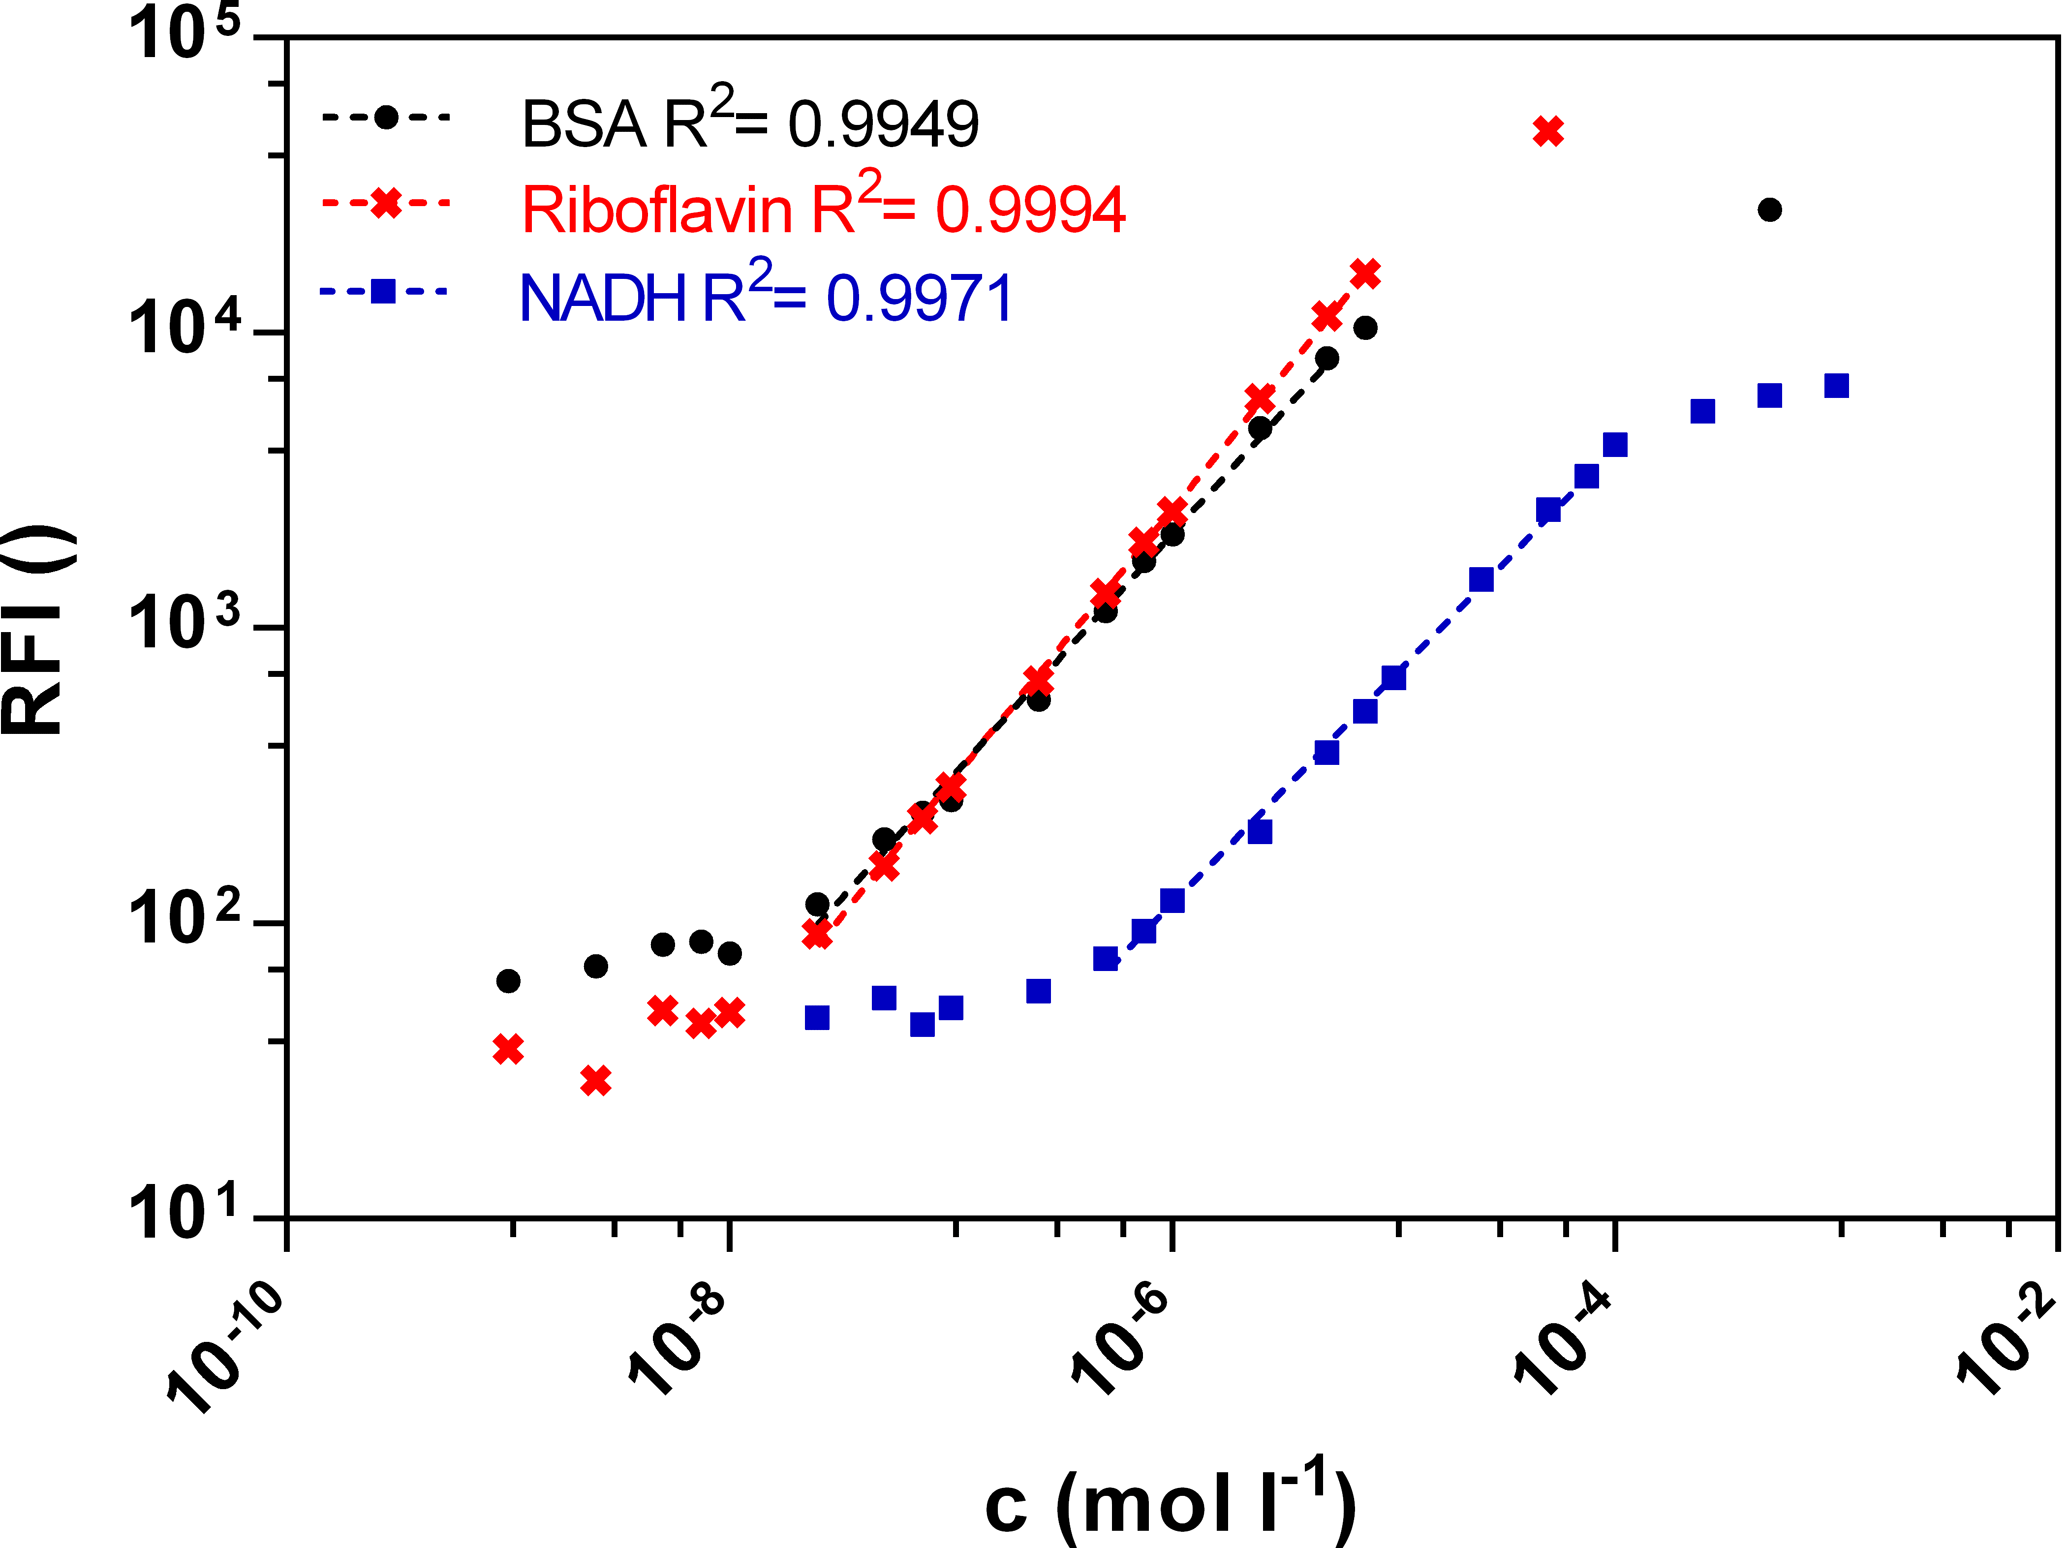
Figure 2Calibration curves of BSA (Ex280 ∕ Em340), riboflavin (Ex450 ∕ Em525) and NADH (Ex365 ∕ Em448).
2.6 Chemometric analysis and modelling
To evaluate the sensor selectivity, a partial least square regression (PLS) by Unscrambler X® software (Camo, Norway) was calculated for each fluorophore. PLS regressions were performed by mean centering data followed by a full cross-validation using the Nonlinear Iterative Partial Least Squares (NIPALS) algorithm. The fluorescence data of each cultivation were used to apply a principle component analysis (PCA). No preprocessing like media subtraction, smoothing and normalization was performed. Five of six cultivations were used for a PLS model of biomass. The excluded cultivation was used for an independent prediction of biomass.
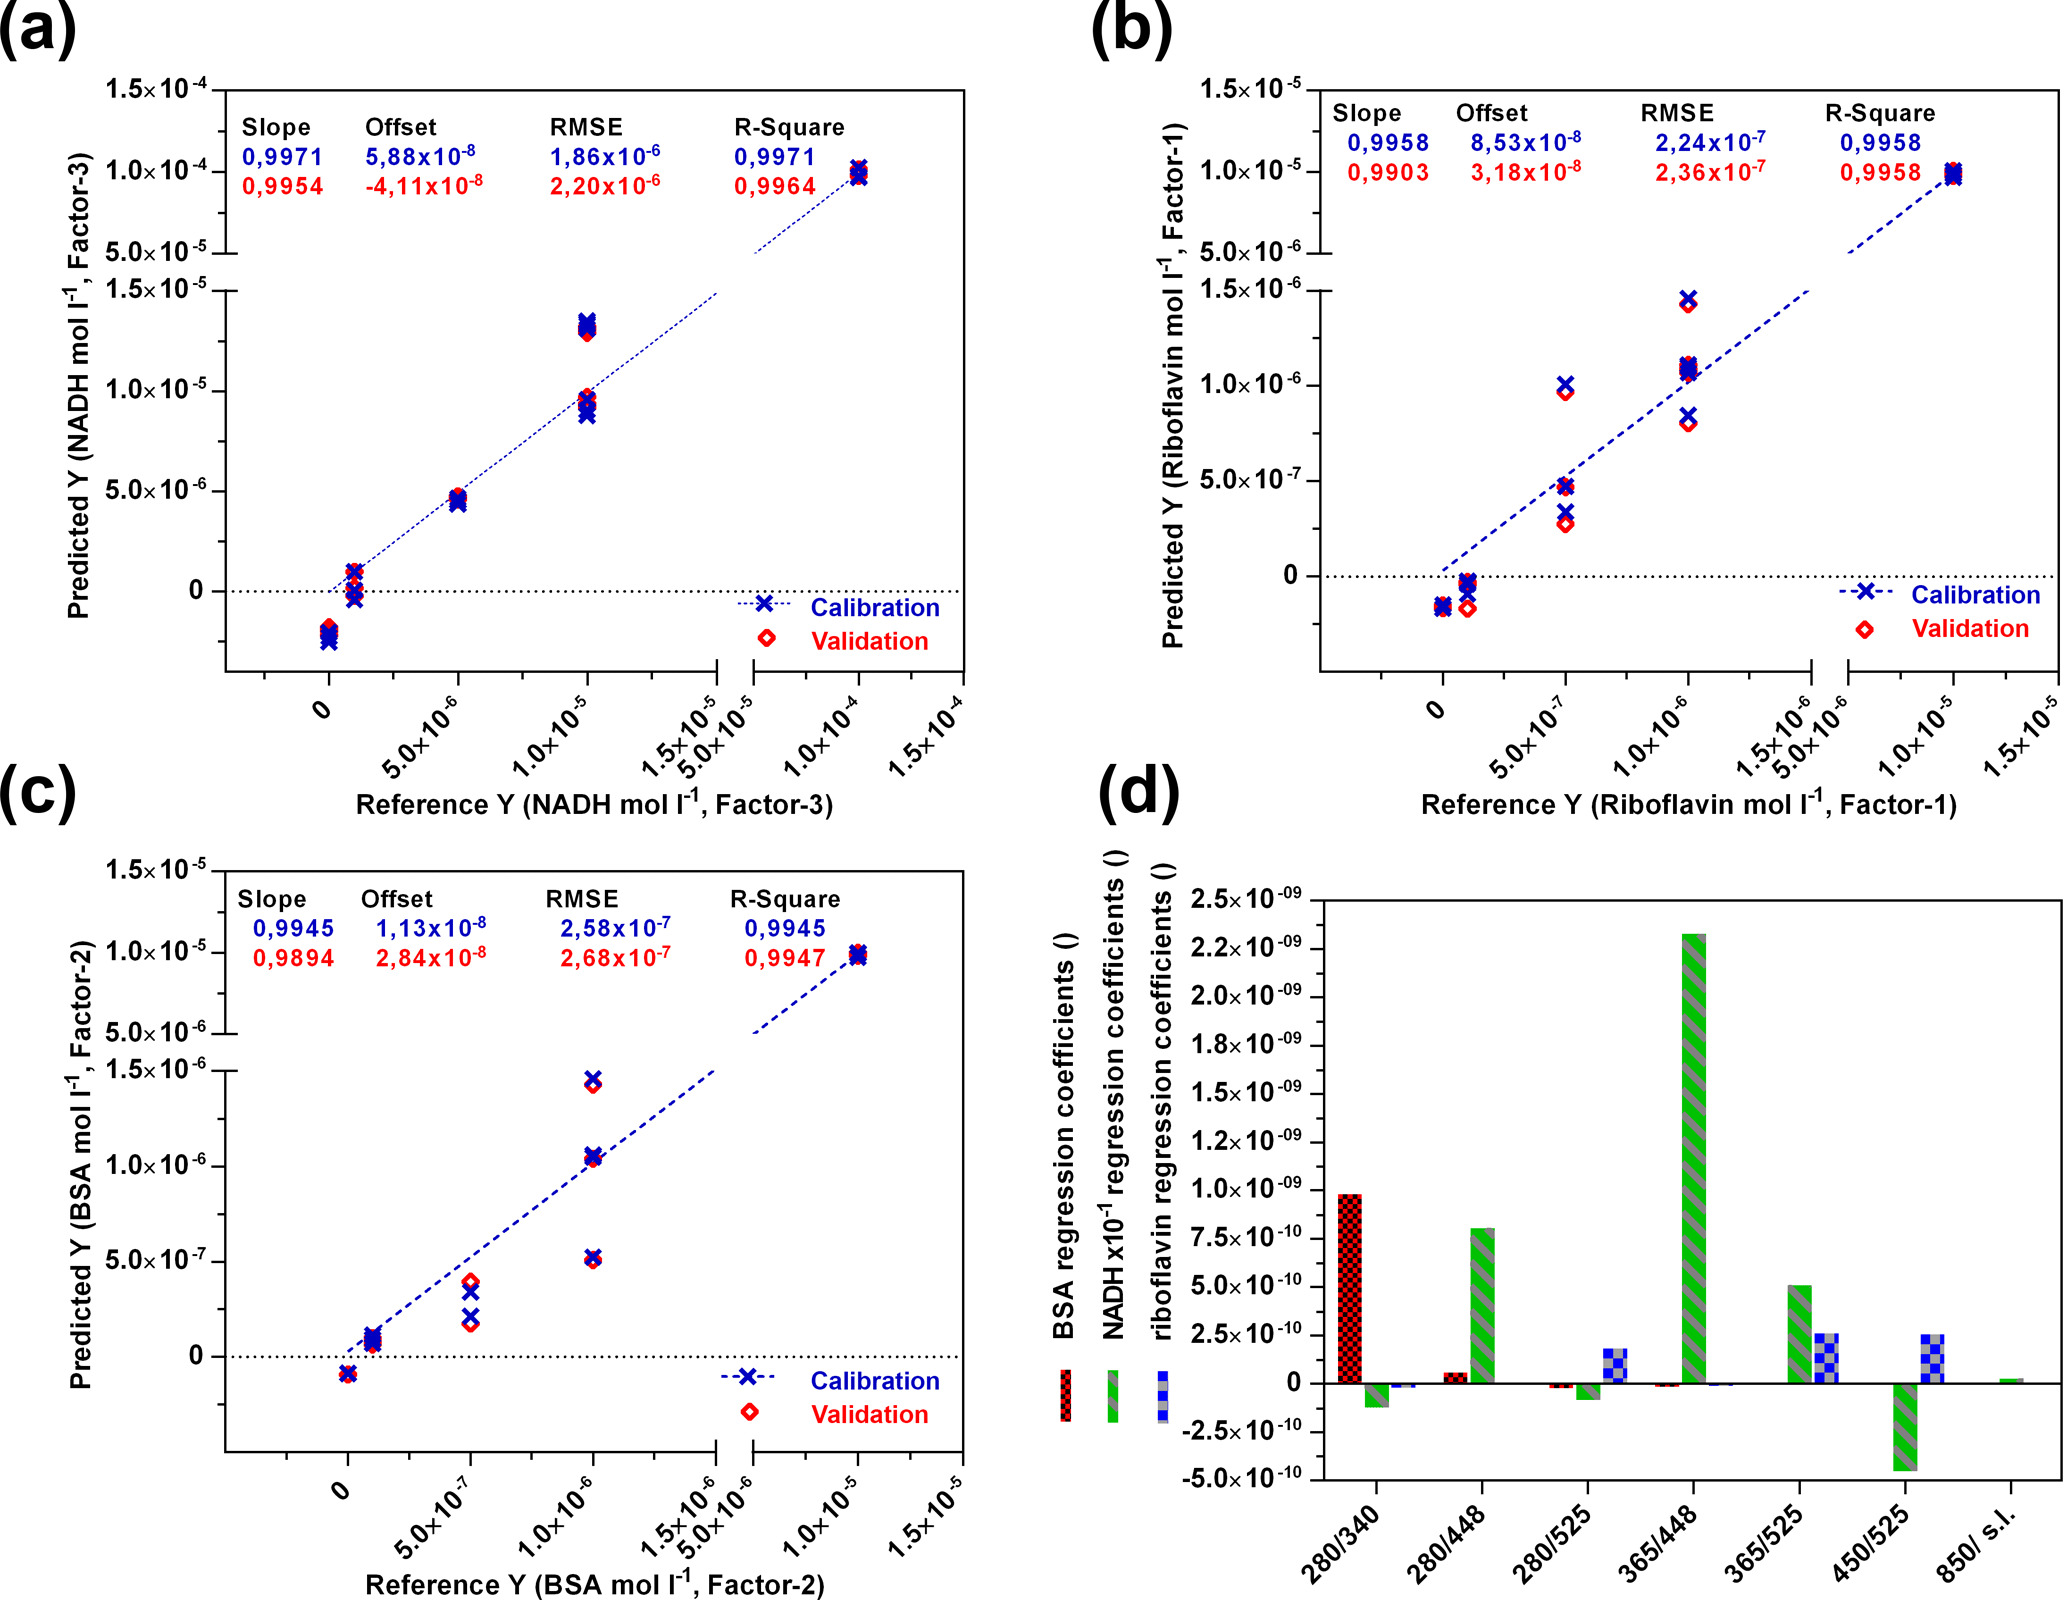
Figure 3Selectivity test of the sensor based on different mixtures of three fluorophores (BSA, NADH and riboflavin). PLS models of (a) BSA, (b) riboflavin and (c) NADH. (d) Regression coefficients of the three PLS models.
3.1 Sensitivity and selectivity
Fluorescence signals in different bioprocesses differ largely. Therefore a wide linear measurement range is desirable. Calibration curves of the three biogenic fluorophores BSA, NADH and riboflavin were measured with the functional model to prove sensitivity in the range of 10−9–10−3 mol L−1 (Fig. 2). The standard curves of BSA (Ex280 ∕ Em340) and riboflavin (Ex450 ∕ Em525) show a similar linear correlation between the fluorescence intensity and the concentration from 0.0025 to 7.5 µmol L−1. At an equal molar concentration the NADH (Ex365 ∕ Em448) fluorescence intensity is lower than the BSA or the riboflavin intensity. Thus the linear measurement range of NADH is from 0.5 to 50 µmol L−1. In general, the standard curves of the three fluorophores show a wide linear measurement range by 3 orders of magnitude.
When using sensors to monitor bioprocesses, it is important to obtain a proper selectivity for the analytes of interest to enable quantification and control. To analyse the selectivity regarding all three fluorophores a statistical design of experiments was carried out. In a mixture of BSA, riboflavin and NADH the concentration of each compound was varied and the fluorescence signal was measured. Centre point experiments were performed four times to provide a measure of process stability and inherent variability. A variation of less than 2 % proved constant process conditions and reproducibility of measurement.
For each fluorophore a PLS model was created (Fig. 3) and validated by using the full cross-validation method. In Fig. 3d the weight regression coefficients of all three PLS models are illustrated. In each case, the expected wavelength combination for excitation and emission (BSA: Ex280 ∕ Em340, riboflavin: Ex450 ∕ Em525, NADH: Ex365 ∕ Em448) has the major influence on the respective PLS regression model. Another important wavelength combination is the combination Ex280 ∕ Em448, showing effects on the BSA- and NADH-PLS models. This could be due to a cascade effect, where emitted BSA fluorescence light is used for the excitation of NADH. According to Guo et al. (2009), a quenching effect of riboflavin on the fluorescence intensity of BSA is also observed (Ex280 ∕ Em525). Thus, the real BSA fluorescence should be higher than the observed fluorescence. The PLS model for NADH was based on three principal components (PCs), whereas one or two were used for the PLS modelling of riboflavin and BSA. Results of all three calibration models show high coefficients of determination (R2≥0.99) and low root mean square errors (RMSEs). These results show that the sensor is highly capable of detecting all three fluorophores separately and next to each other in a wide concentration range.
3.2 Reproducibility
Reproducibility expresses the precision between measurement results obtained at different experimental series and is beneficial for an analytical method. Therefore, six batch cultivations of E. coli K1 were performed over 10 h in bioreactor scale and the fluorescence data were recorded. Smoothing of fluorescence data by using average values (Grote et al., 2014) or a Savitzky–Golay filter (Savitzky and Golay, 1964) is a common method to reduce the influence of noise. With the new functional model, no additional smoothing and normalization were necessary. The fluorescence data of all six cultivations were explored by using PCA (see Fig. 4). PCA is a common tool for data reduction and data analysis (Faassen and Hitzmann, 2015). It helps to detect batch-to-batch variability and to identify abnormal fermentation runs. The score plot in Fig. 4 shows that the first PC axis explains 94 % variance and the second PC 2 % of the total variance of the raw data. All six cultivations have a similar process trajectory even when an upscale from 7.5 to 30 L was performed (cultivation six). As the sensor did not change significantly its response to the process, reproducibility of the sensor is given. However, changing the composition of the process mixture showed inter-batch variability as seen with the fourth and fifth cultivations. Due to an increased cell growth (data not shown), the fourth cultivation reached the turning point earlier. At the beginning of the fifth cultivation no anti-foam was added, resulting in variations observed in the fermentation process. The loadings of PC-1 and PC-2 are presented in Fig. S2a. The s. l. has a high positive effect on both PCs and the course of the graph at the beginning of the fifth cultivation is different compared to the other cultivation (Fig. S2b). After the addition of anti-foam the cultivation was similar to the others.

Figure 4PCA on the fluorescence data showing the process trajectory and batch-to-batch variability of six E. coli K1 cultivations. The arrow marks the anti-foam addition in cultivation 5.
3.3 Prediction of biomass
A main goal of the sensor is a wide-range application to monitor metabolic changes in prokaryotic and eukaryotic cells and to detect diverse substrate and product concentrations in a cell culture medium. In a first attempt, the sensor performance was analysed to predict the biomass production. Therefore biomass production in six cultivations of E. coli K1 was determined by offline measurements. For chemometric evaluation of the fluorescence data a CDW-PLS model (Fig. 5a) was calculated using only five of six performed cultivations (without second cultivation, Fig. 4). A full cross-validation method was applied. The PLS model based on two principal components had a coefficient of determination of R2=0.95. The regression plot shows a slope of 0.95 and reveals predictive capabilities within the range of 0.15–9.1 g L−1 CDW. From the regression coefficient plot (Fig. 5b) it was observed that the PLS model is mainly based on FAD ∕ FMN fluorescence (Ex365 ∕ Em525 and Ex450 ∕ Em525) and scattered light at 850 nm. The influence of protein (Ex280 ∕ Em340) and NADH fluorescence (Ex365 ∕ Em448) is less important for the monitoring of biomass of E. coli cultivations in defined media. Previous publications showed that NADH is often correlated well with cell concentration (Marose, 1999; Hisiger and Jolicoeur, 2005), but it also was discussed whether other fluorophores such as riboflavin are more reliable for estimating biomass since they are less sensitive to difference stresses than NADH (Hisiger and Jolicoeur, 2005) and can be used for metabolic state studies (Gahlawat and Srivastava, 2013). In our case it seems that in the early log phase the NADH is correlated with biomass, but during the exponential growth phase the NADH fluorescence increases rather linearly (Fig. 5c). The recorded online fluorescence data of the excluded cultivation are illustrated in Fig. 5c. According to FAD/FMN fluorescence and scattered light curves cells enter the exponential growth phase at 2–3 h of the cultivation and reach the stationary phase after 7 h. Based on the CDW-PLS model, biomass production was predicted for the independent cultivation (Fig. 5d). The RMSE of prediction (RMSEP) represents 4.6 % of the calibration range and is very similar to the RMSEP (5 %) of a batch cultivation of E. coli observed with the Bioview® (Jain et al., 2011). The low RMSEP indicates a good fit with a good agreement of predicted values of CDW and offline measured values during the cultivation.
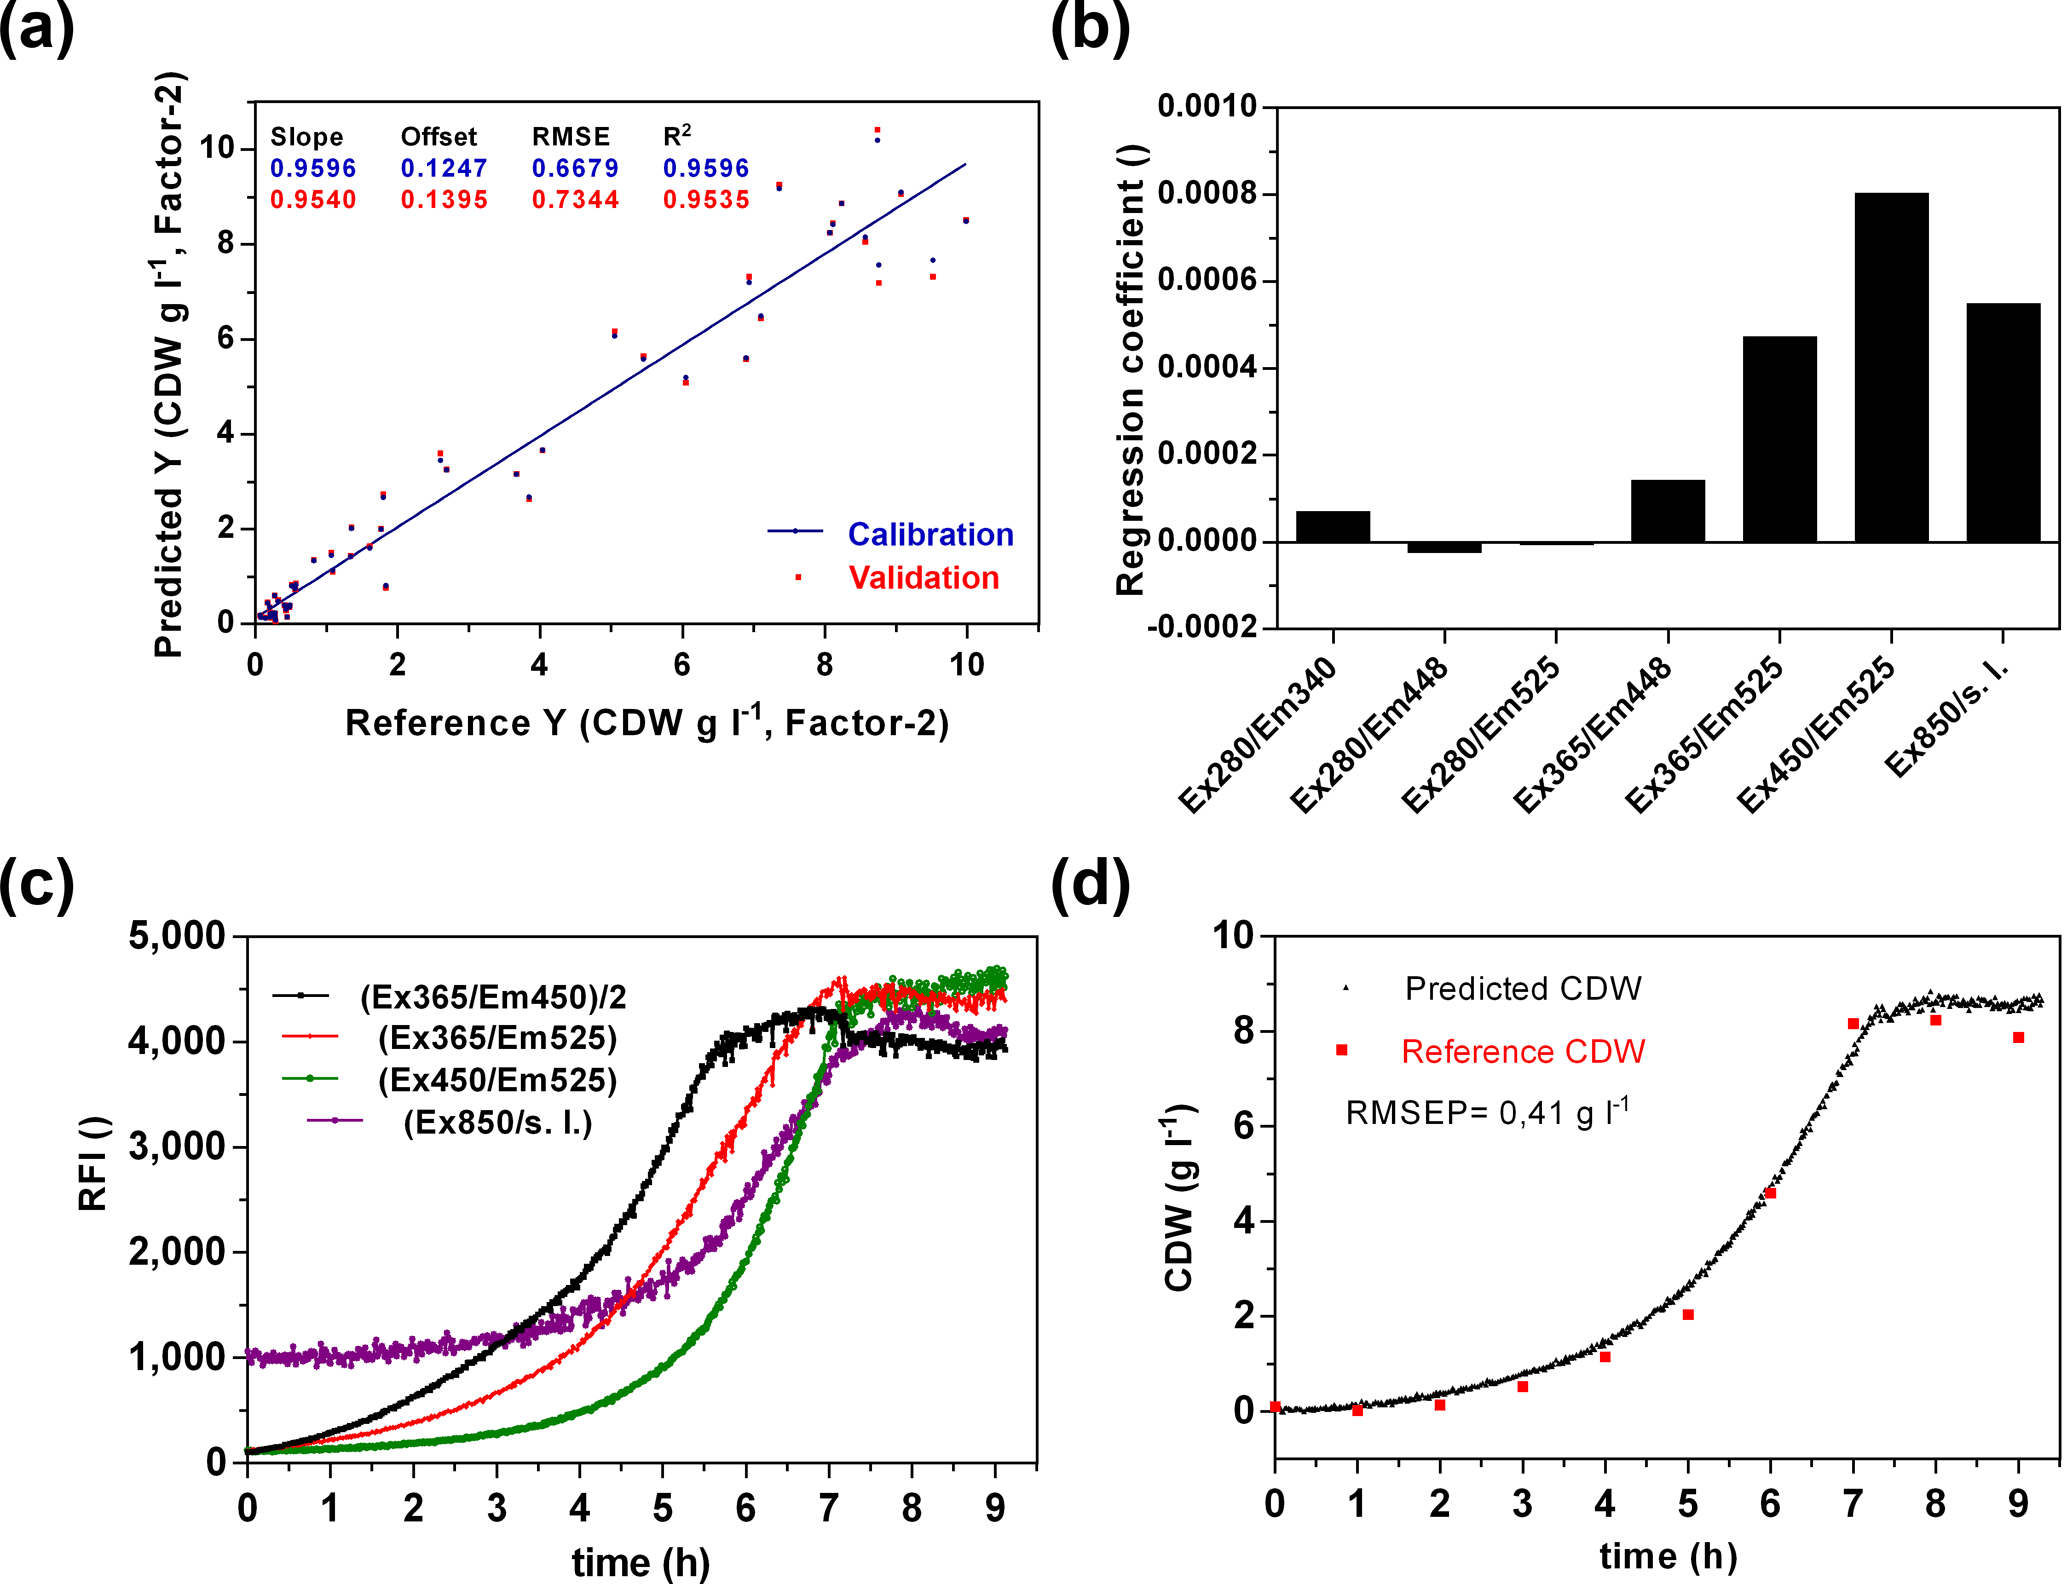
Figure 5Biomass prediction of an E. coli K1 cultivation via a fluorescence sensor. (a) PLS regression model of CDW. (b) Regression coefficients of the PLS model. (c) Fluorescence data of the fermentation. (d) Predicted biomass and offline measured biomass.
Fluorescence spectroscopy represents a very sensitive method, but fluorescence sensors are mainly used in academic environments and rarely in industrial processes. In this work, we present a newly developed functional model of an online fluorescence sensor. The robust sensor was miniaturised and constructed without any movable parts to measure only the three important biologic fluorophores (tryptophan, NADH and FAD/FMN), resulting in a significant data reduction. The results of the calibration curves and of the selectivity test revealed that the sensor has a large measurement range and is selective for protein, NADH and riboflavin fluorescence. Cultivation monitoring of six batch cultivations of E. coli led to reproducible data. No preprocessing like smoothing or normalization was necessary for chemometric modelling and the information content of the fluorescence data was used for an accurate prediction of the biomass. For applications such as monitoring metabolic changes or additional substrate and product concentration, further experiments with different bacteria and eukaryotic cells have to be investigated.
The underlying measurement data are not publicly available and can be requested from the authors if required.
The supplement related to this article is available online at: https://doi.org/10.5194/jsss-7-461-2018-supplement.
SB, GJ and TS supervised the project and proofread the manuscript. JK and DS designed the experiments and TSt carried them out together with JK. MF and TH constructed the functional model and PL wrote the algorithm for selectivity tests. JK prepared the manuscript with contributions from all co-authors.
The authors declare that they have no conflict of interest.
This article is part of the special issue “Dresden Sensor Symposium 2017”. It is a result of the Dresden Sensor Symposium 2017, Dresden, Germany, 4–6 December 2017.
We would like to thank all members of our research group for providing
feedback and suggestions. This project was funded by the BMWi via AiF within
the ZIM initiative.
Edited by: Günter
Gauglitz
Reviewed by: two anonymous referees
Assawajaruwan, S., Eckard, P., and Hitzmann, B.: On-line monitoring of relevant fluorophores of yeast cultivations due to glucose addition during the diauxic growth, Process Biochem., 58, 51–59, https://doi.org/10.1016/j.procbio.2017.05.007, 2017a.
Assawajaruwan, S., Reinalter, J., and Hitzmann, B.: Comparison of methods for wavelength combination selection from multi-wavelength fluorescence spectra for on-line monitoring of yeast cultivations, Anal. Bioanal. Chem., 409, 707–717, https://doi.org/10.1007/s00216-016-9823-2, 2017b.
Boehl, D., Solle, D., Hitzmann, B., and Scheper, T.: Chemometric modelling with two-dimensional fluorescence data for Claviceps purpurea bioprocess characterization, J. Biotechnol., 105, 179–188, 2003.
Claßen, J., Aupert, F., Reardon, K. F., Solle, D., and Scheper, T.: Spectroscopic sensors for in-line bioprocess monitoring in research and pharmaceutical industrial application, Anal. Bioanal. Chem., 409, 651–666, https://doi.org/10.1007/s00216-016-0068-x, 2017.
Clavaud, M., Roggo, Y., von Daeniken, R., Liebler, A., and Schwabe, J.-O.: Chemometrics and in-line near infrared spectroscopic monitoring of a biopharmaceutical Chinese hamster ovary cell culture: prediction of multiple cultivation variables, Talanta, 111, 28–38, https://doi.org/10.1016/j.talanta.2013.03.044, 2013.
Eliasson Lantz, A., Jørgensen, P., Poulsen, E., Lindemann, C., and Olsson, L.: Determination of cell mass and polymyxin using multi-wavelength fluorescence, J. Biotechnol., 121, 544–554, https://doi.org/10.1016/j.jbiotec.2005.08.007, 2006.
Faassen, S. M. and Hitzmann, B.: Fluorescence spectroscopy and chemometric modeling for bioprocess monitoring, Sensors (Basel, Switzerland), 15, 10271–10291, https://doi.org/10.3390/s150510271, 2015.
Gahlawat, G. and Srivastava, A. K.: Use of NAD(P)H fluorescence measurement for on-line monitoring of metabolic state of Azohydromonas australica in poly(3-hydroxybutyrate) production, Appl. Biochem. Biotechnol., 169, 821–831, https://doi.org/10.1007/s12010-012-0040-y, 2013.
Grote, B., Zense, T., and Hitzmann, B.: 2D-fluorescence and multivariate data analysis for monitoring of sourdough fermentation process, Food Control, 38, 8–18, https://doi.org/10.1016/j.foodcont.2013.09.039, 2014.
Guo, X.-J., Sun, X.-D., and Xu, S.-K.: Spectroscopic investigation of the interaction between riboflavin and bovine serum albumin, J. Mol. Struct., 931, 55–59, https://doi.org/10.1016/j.molstruc.2007.06.035, 2009.
Harrison, D. E. F. and Chance, B.: Fluorimetric Technique for Monitoring Changes in the Level of Reduced Nicotinamide Nucleotides in Continuous Cultures of Microorganisms, Applied Microbiology, 19, 446–450, 1970.
Hisiger, S. and Jolicoeur, M.: A multiwavelength fluorescence probe: is one probe capable for on-line monitoring of recombinant protein production and biomass activity?, J. Biotechnol., 117, 325–336, https://doi.org/10.1016/j.jbiotec.2005.03.004, 2005.
Jain, G., Jayaraman, G., Kökpinar, Ö., Rinas, U., and Hitzmann, B.: On-line monitoring of recombinant bacterial cultures using multi-wavelength fluorescence spectroscopy, Biochem. Eng. J., 58–59, 133–139, https://doi.org/10.1016/j.bej.2011.09.005, 2011.
Landgrebe, D., Haake, C., Höpfner, T., Beutel, S., Hitzmann, B., Scheper, T., Rhiel, M., and Reardon, K. F.: On-line infrared spectroscopy for bioprocess monitoring, Appl. Microbiol. Biot., 88, 11–22, https://doi.org/10.1007/s00253-010-2743-8, 2010.
Lindemann, C., Marose, S., Scheper, T., Nielsen, H. O., and Reardon, K. F.: Fluorescence Techniques for Bioprocess Monitoring, in: Encyclopedia of bioprocess technology: Fermentation, biocatalysis, and bioseparation, edited by: Flickinger, M. C., Wiley biotechnology encyclopedias, Wiley, New York, NY, 1999.
Marose, S.: Optical sensor systems for bioprocess monitoring, Trends Biotechnol., 17, 30–34, https://doi.org/10.1016/S0167-7799(98)01247-5, 1999.
Oh, S.-K., Yoo, S. J., Jeong, D. H., and Lee, J. M.: Real-time estimation of glucose concentration in algae cultivation system using Raman spectroscopy, Bioresource Technol., 142, 131–137, https://doi.org/10.1016/j.biortech.2013.05.008, 2013.
Rode, B., Endres, C., Ran, C., Stahl, F., Beutel, S., Kasper, C., Galuska, S., Geyer, R., Mühlenhoff, M., Gerardy-Schahn, R., and Scheper, T.: Large-scale production and homogenous purification of long chain polysialic acids from E. coli K1, J. Biotechnol., 135, 202–209, https://doi.org/10.1016/j.jbiotec.2008.03.012, 2008.
Roggo, Y., Chalus, P., Maurer, L., Lema-Martinez, C., Edmond, A., and Jent, N.: A review of near infrared spectroscopy and chemometrics in pharmaceutical technologies, J. Pharmaceut. Biomed., 44, 683–700, https://doi.org/10.1016/j.jpba.2007.03.023, 2007.
Savitzky, A. and Golay, M. J. E.: Smoothing and Differentiation of Data by Simplified Least Squares Procedures, Anal. Chem., 36, 1627–1639, https://doi.org/10.1021/ac60214a047, 1964.
Scheper, T., Lorenz, T., Schmidt, W., and Schügerl, K.: On-Line Measurement of Culture Fluorescence for Process Monitoring and Control of Biotechnological Processes, Ann. NY Acad. Sci., 506, 431–445, https://doi.org/10.1111/j.1749-6632.1987.tb23839.x, 1987.
Stärk, E., Hitzmann, B., Schügerl, K., Scheper, T., Fuchs, C., Köster, D., and Märkl, H.: In-situ-fluorescence-probes: A useful tool for non-invasive bioprocess monitoring, Adv. Biochem. Eng. Biot., 74, 21–38, 2002.
Surribas, A., Montesinos, J. L., and Valero, F. F.: Biomass estimation using fluorescence measurements inPichia pastoris bioprocess, J. Chem. Technol. Biotechnol., 81, 23–28, https://doi.org/10.1002/jctb.1352, 2006.
Vries, I. de, Busse, C., Kopatz, J., Neumann, H., Beutel, S., and Scheper, T.: Polysialic acid production using Escherichia coli K1 in a disposable bag reactor, Eng. Life Sci., 17, 723–731, https://doi.org/10.1002/elsc.201600220, 2017.
Won, H. and Yoon-Keun, C.: An artificial neural network for biomass estimation from automatic pH control signal, Biotechnol. Bioprocess Eng., 11, 351–356, https://doi.org/10.1007/BF03026252, 2006.